

L&T Technology Services Ltd (LTTS)
Stock Analysis Report
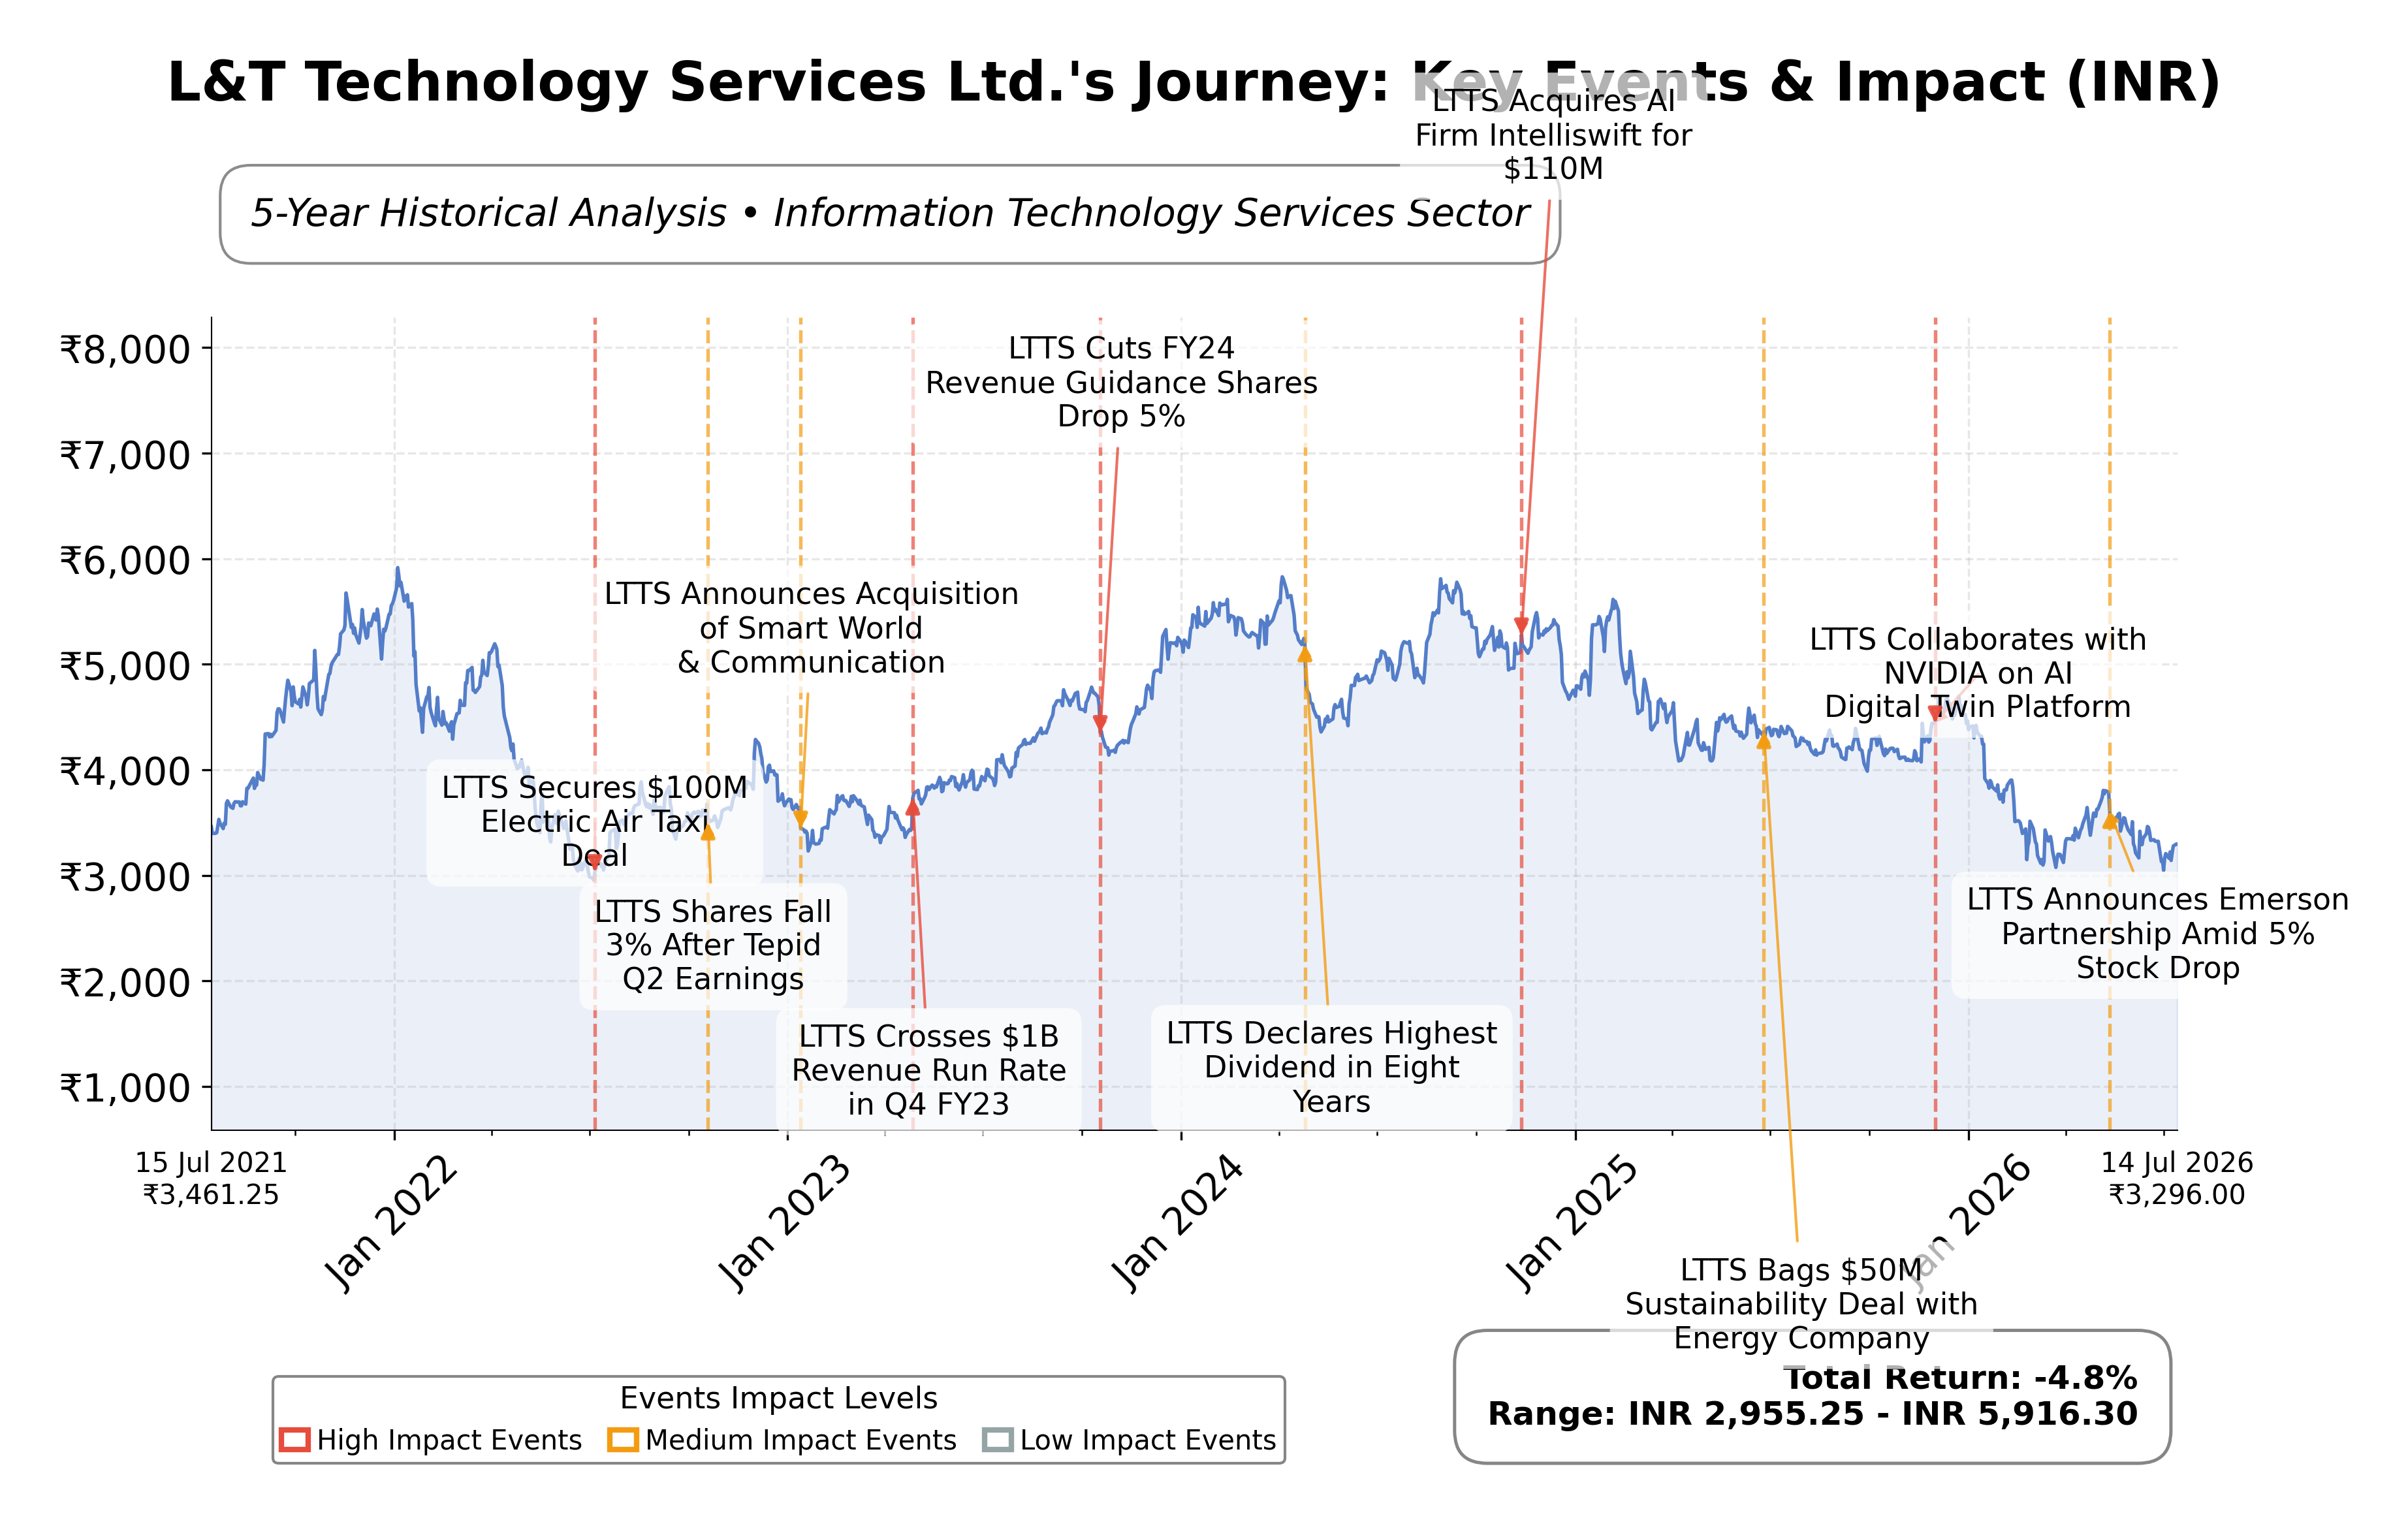
Stock Journey
Key Positives and Key Risks
Pros
- Return on equity of 19.54% indicates strong profitability and efficient capital use.
- Operating cash flow of INR 14.55 billion and free cash flow of INR 9.93 billion demonstrate robust liquidity and financial health.
- Forward P/E of 20.13 suggests reasonable valuation relative to growth prospects.
Cons
- Quarterly revenue declined by 4.2%, signaling potential short-term growth challenges.
- Price-to-book ratio of 5.37 reflects a premium valuation that may limit upside.
- Dependence on consistent deal execution as noted by analysts introduces execution risk.
Disclosure: This information is for general awareness and does not constitute investment advice
Report Summary
L&T Technology Services Ltd. (LTTS) is a leading engineering services company headquartered in India, specializing in technology and engineering solutions across diverse sectors including transportation, industrial products, telecom, process industries, and medical devices. Listed on the NSE under the technology sector, LTTS operates as a subsidiary of the Larsen & Toubro Group, leveraging its extensive expertise to deliver advanced product lifecycle management, digital manufacturing, IoT-driven smart services, and AI-based analytics. The company is well-positioned in the global engineering services market, focusing on innovation and efficiency enhancement for its clients.
Financially, LTTS reported a trailing twelve-month revenue of approximately INR 109.96 billion with a gross margin of 41.16%, an operating margin of 15.22%, and a net profit margin of 11.63%. The company’s return on equity (ROE) stands at 19.54%, and return on assets (ROA) at 9.85%, reflecting solid profitability and efficient asset utilization. Its return on invested capital (ROIC) aligns with these metrics, underscoring effective capital deployment. Despite a slight quarterly revenue decline of 4.2%, the net income showed a year-over-year growth of 6.8%, indicating resilience in earnings performance.
From a valuation standpoint, LTTS trades at a trailing P/E ratio of 27.78 and a forward P/E of 20.13, with a price-to-book ratio of 5.37 and an EV/EBITDA multiple of 18.34. The market capitalization is approximately INR 347.7 billion. The stock price currently stands at INR 3,586, within a 52-week range of INR 3,010 to INR 4,726, indicating a significant correction from its high. These valuation metrics suggest the stock is priced at a premium relative to some peers, reflecting market expectations of growth and profitability.
Key strengths for LTTS include strong cash flow generation with operating cash flow of INR 14.55 billion and free cash flow of INR 9.93 billion, a low debt-to-equity ratio of 8.91%, and leadership in engineering services with a focus on AI and sustainability segments. Risks involve regulatory challenges, competitive pressures in the IT services industry, and macroeconomic factors impacting client spending. Recent strategic actions include margin expansion driven by AI initiatives and board continuity with the reappointment of an independent director, Luis Miranda.
Technically, LTTS exhibits a price below its 200-day moving average of INR 3,777 but above the 50-day average of INR 3,410, with a low beta of 0.064 indicating limited volatility. Recent news highlights steady revenue and profit growth, margin improvements, and strategic focus on AI, suggesting a cautious but constructive market stance. Overall, current conditions appear balanced, warranting close observation of operational execution and market dynamics.
Company and Industry Overview
Company Basics
Price Performance
Company Size
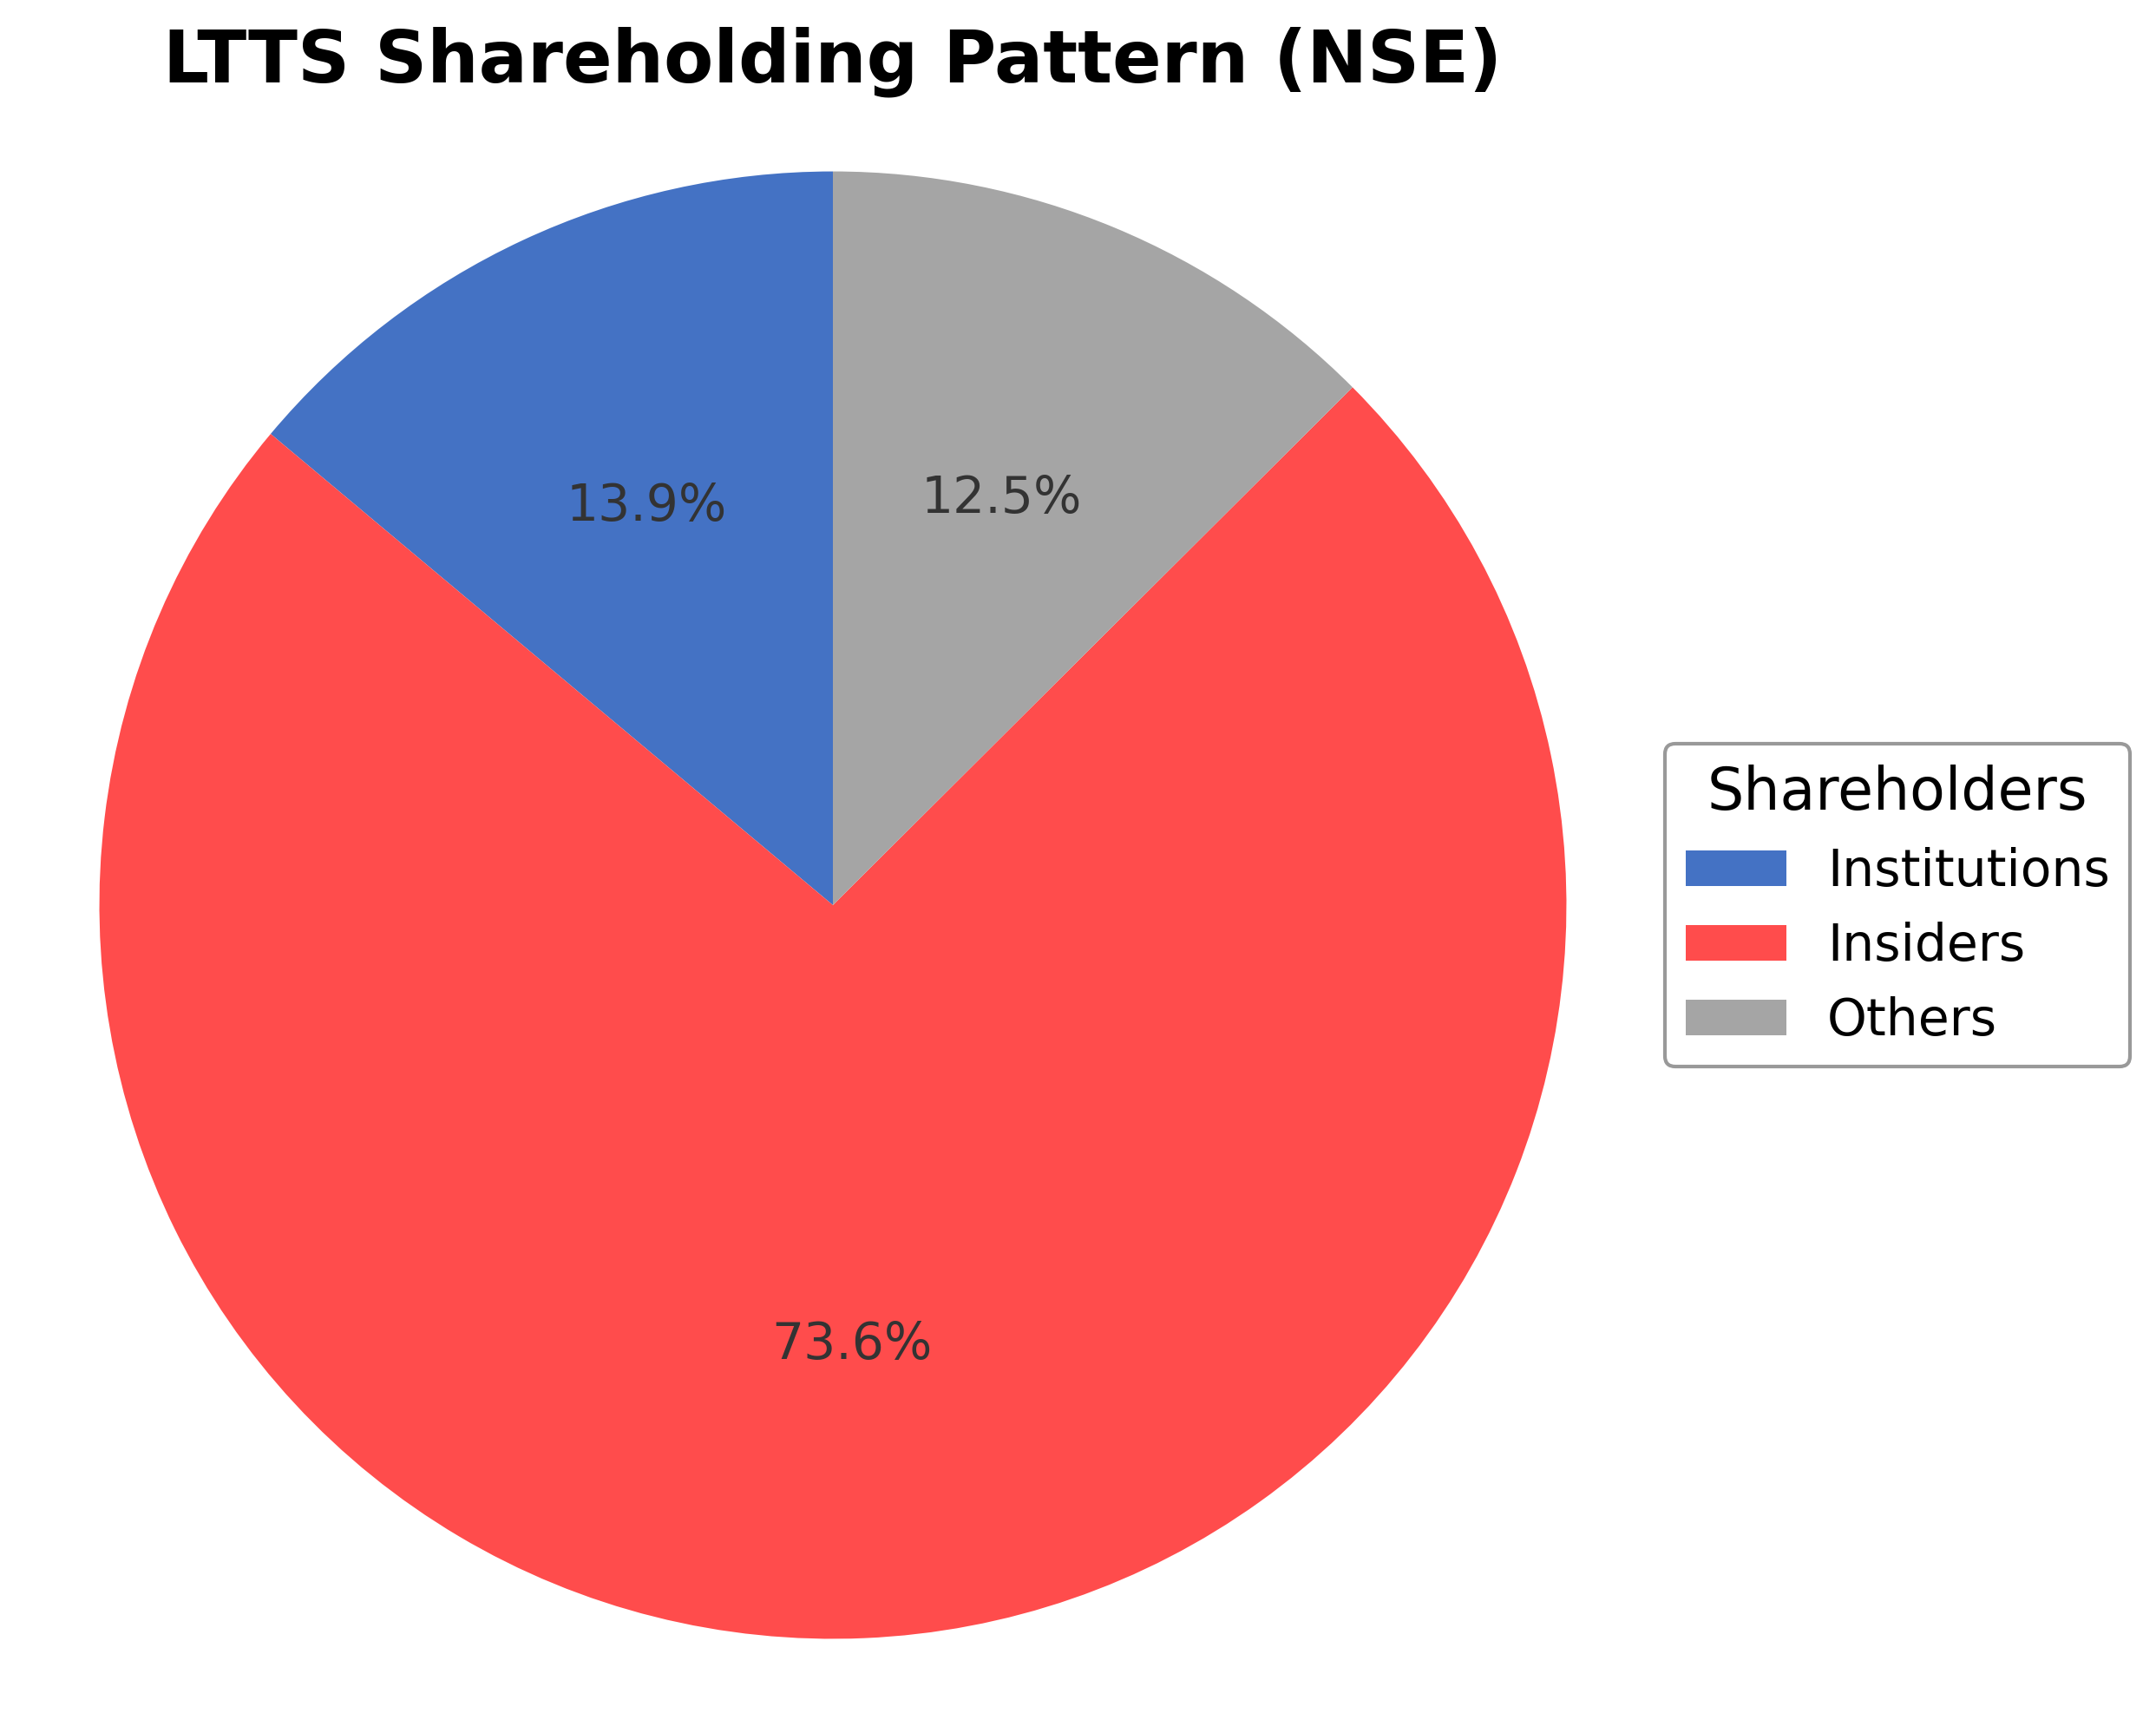
Shareholding Pattern
Sector and Industry Analysis
The Information Technology Services sector, encompassing engineering research and digital consulting, is a significant contributor to the global economy with a market size valued in hundreds of billions of dollars. It has demonstrated steady growth driven by increasing demand for digital transformation, AI integration, and Industry 4.0 solutions across various industries. Key players include multinational corporations and specialized firms like L&T Technology Services, which operate across geographies including India, North America, and Europe.
Industry trends highlight a shift towards advanced digital engineering services such as AI, cybersecurity, 5G, and sustainability engineering, reflecting growing client needs for innovation and operational efficiency. Competitive dynamics are shaped by the ability to offer integrated solutions across product design, manufacturing, and plant engineering, with barriers to entry including technological expertise, client relationships, and scale. Companies that invest in platform engineering, connected ecosystems, and lifecycle management tend to maintain a competitive edge.
The regulatory landscape for IT services firms involves compliance with data protection laws, intellectual property rights, and cross-border trade regulations, which vary by region but increasingly emphasize cybersecurity and privacy. Additionally, sustainability and environmental regulations are influencing service offerings related to green engineering and smart infrastructure. These regulatory factors necessitate ongoing adaptation but also create opportunities for firms to differentiate through compliance-driven innovation.
Note: Analysis synthesized from industry research, market reports, and regulatory filings. Information is subject to change based on market conditions.
Financial Ratios Dashboard
Illustrative Scenario Analysis
DCF Assumptions:
Method: Two-Stage EPS-Priority Model
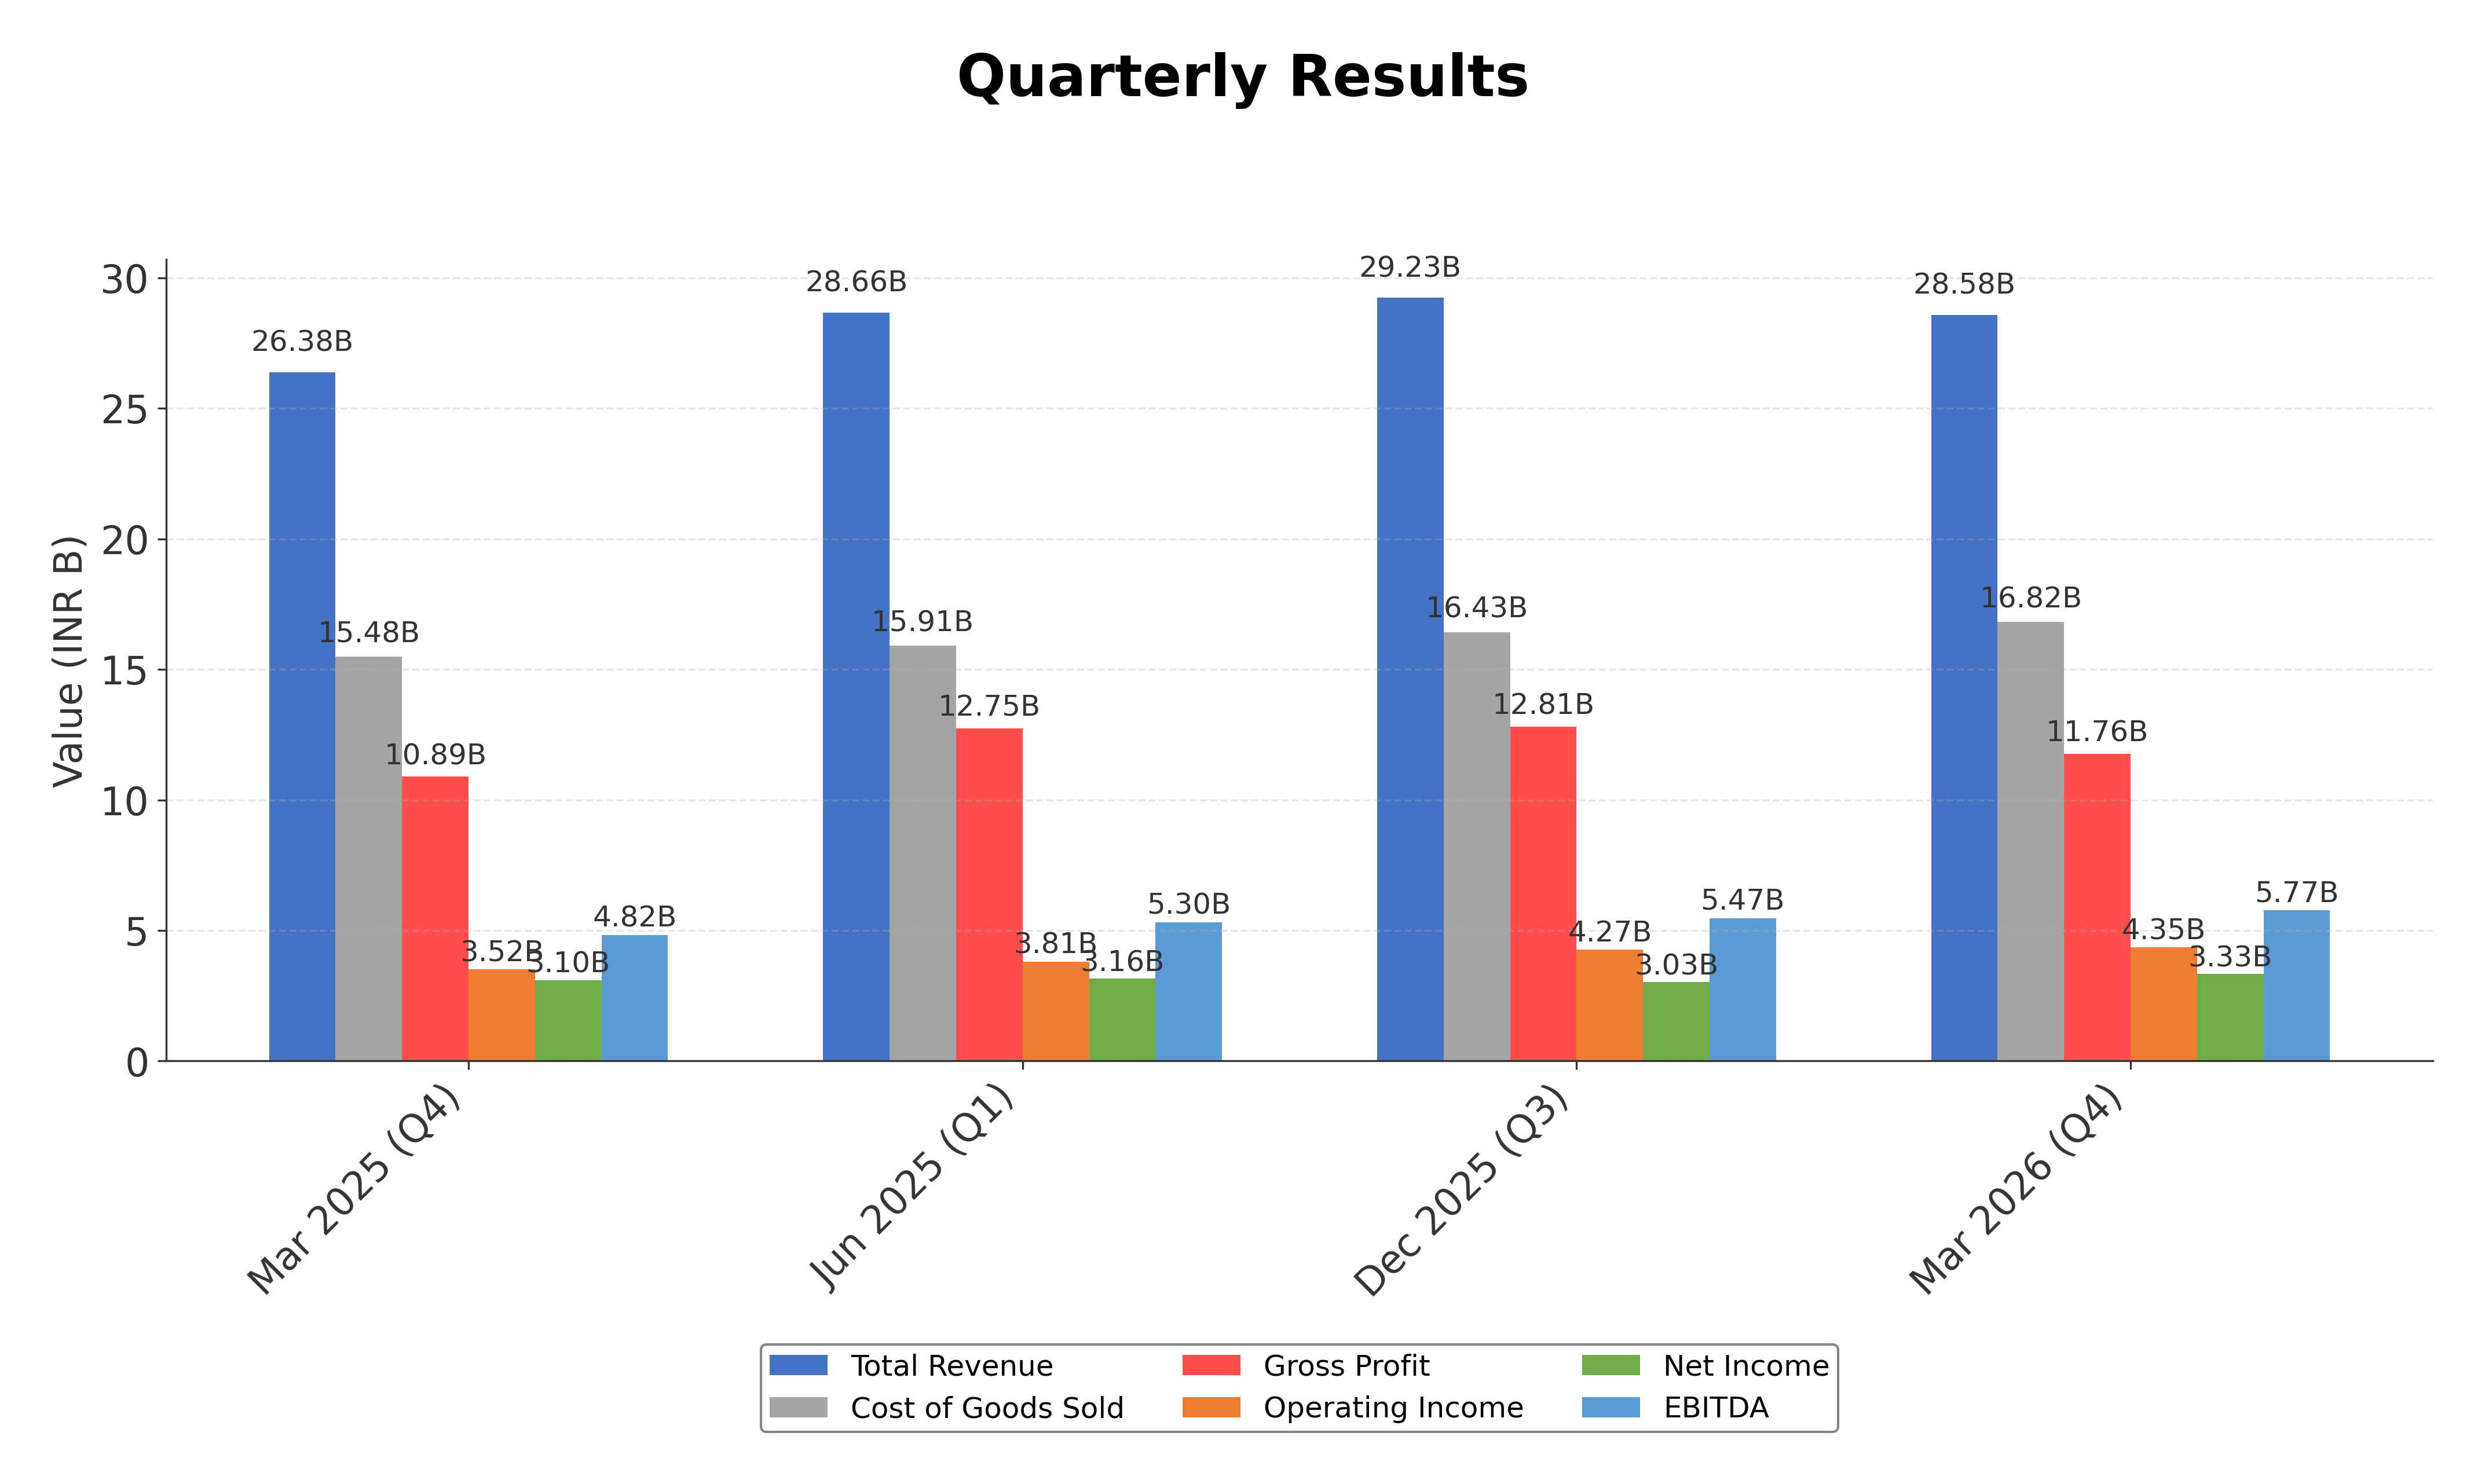
Financials
Peer Analysis
| Company Name | Market Cap | P/E Ratio | P/B Ratio | EV/EBITDA | Price to CFO |
|---|---|---|---|---|---|
| L&T Technology Services Ltd. | ₹347.71B | 27.78 | 5.37 | 18.34 | 23.90 |
| Persistent Systems Ltd. | ₹789.58B | 42.55 | 10.09 | 29.63 | 44.68 |
| Coforge Limited | ₹665.72B | 34.36 | 5.30 | 16.50 | 37.16 |
| Mphasis Ltd. | ₹443.06B | 23.58 | 4.08 | 15.57 | 35.35 |
| LTIMindtree Limited | ₹ 0.00 | N/A | N/A | N/A | N/A |
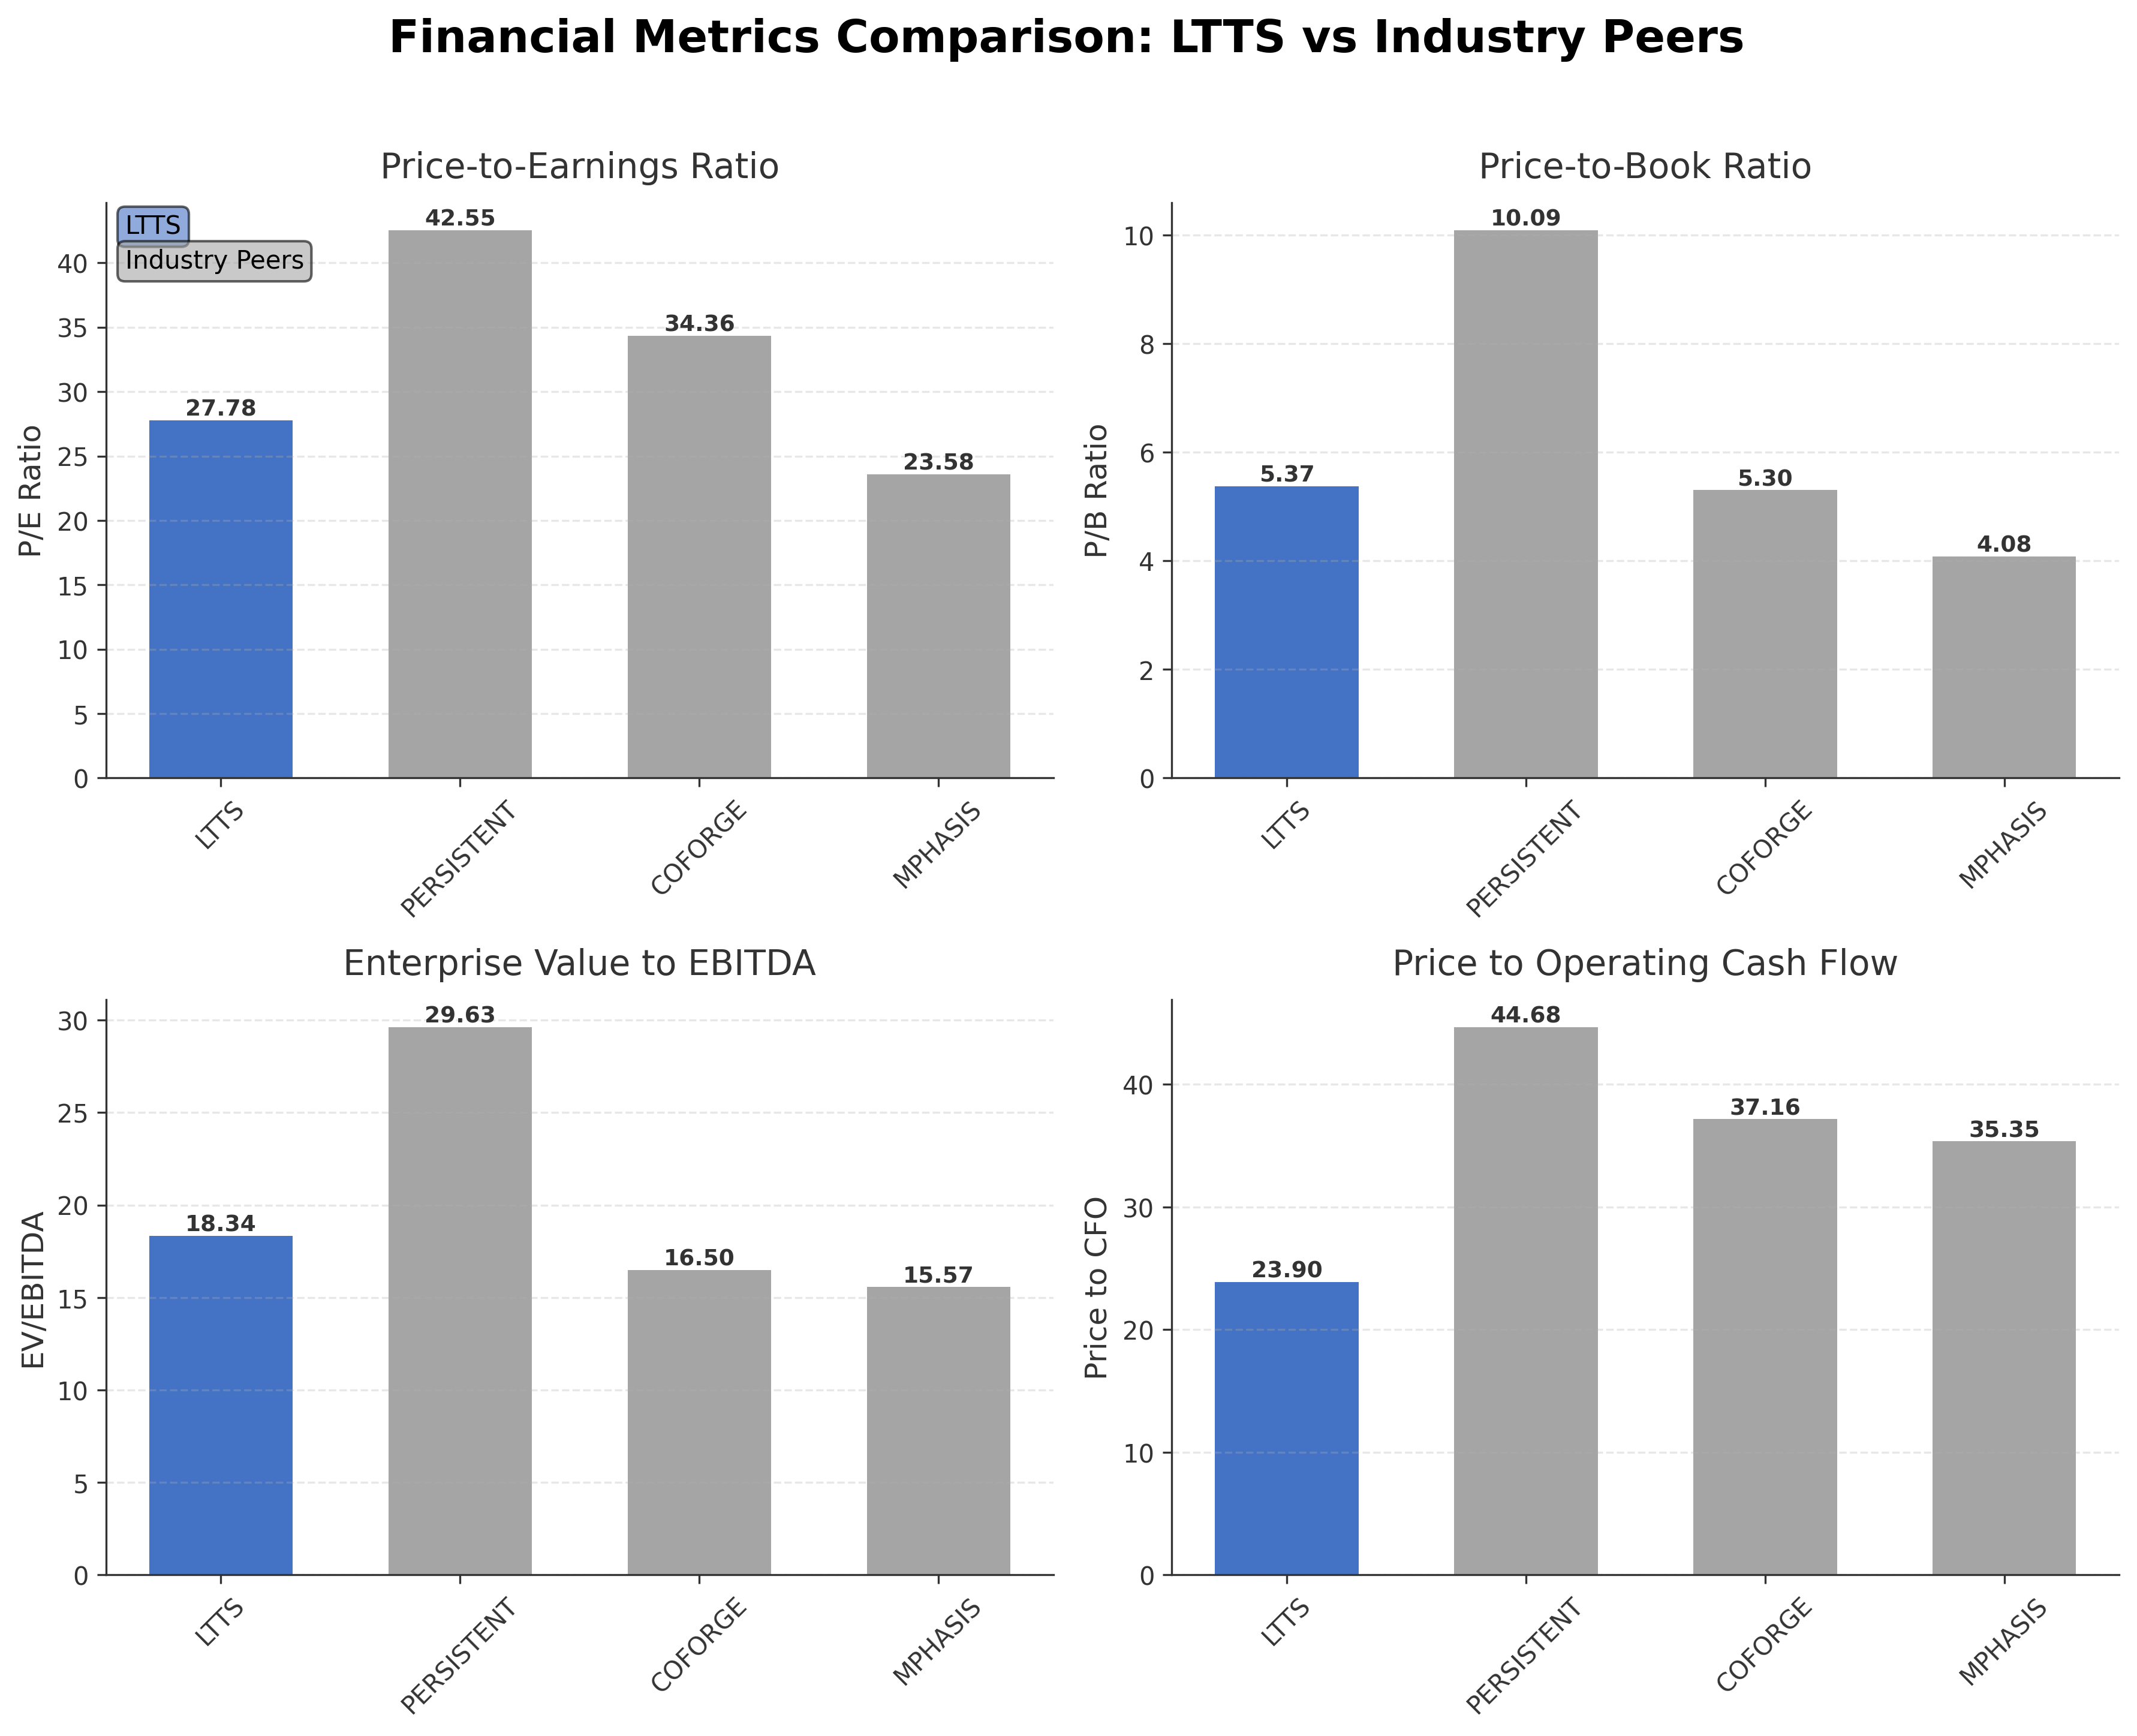
Comparison Analysis: L&T Technology Services Ltd. trades at a moderate valuation relative to its Indian IT services peers, with a trailing P/E of 27.78, lower than Persistent Systems (42.55) and Coforge (34.36) but higher than Mphasis (23.58). Its price-to-book ratio of 5.37 is comparable to Coforge but elevated versus Mphasis, reflecting premium market positioning. The EV/EBITDA multiple of 18.34 is higher than Mphasis and Coforge but below Persistent Systems, indicating balanced operational valuation. LTTS’s return on equity at 19.54% is competitive, though slightly below Persistent Systems’ 26.35%. Overall, LTTS demonstrates solid profitability and valuation metrics within its peer group, with room for growth relative to larger competitors.
Financial Metrics Comparison with Peers
Financial Statements
Comprehensive financial data including income, balance sheet, and cash flow metrics
Income Statement
| fiscal_date | 2026-03-31 | 2025-03-31 | 2024-03-31 | 2023-03-31 | 2022-03-31 |
|---|---|---|---|---|---|
| Sales | 109.96B | 96.42B | 96.47B | 88.16B | 65.70B |
| Cost Of Goods | 79.99B | 69.15B | 50.63B | 46.97B | 37.74B |
| Gross Profit | 29.97B | 27.27B | 45.85B | 41.19B | 27.95B |
| Operating Expense Selling General And Administrative | 1.93B | 1.91B | 7.05B | 6.91B | 5.86B |
| Operating Expense Other Operating Expenses | 6.50B | 5.05B | 16.89B | 14.20B | 6.78B |
| Operating Income | 15.90B | 15.08B | 16.97B | 15.46B | 11.77B |
| Non Operating Interest Income | 1.07B | 675.00M | 816.00M | 876.00M | 492.00M |
| Non Operating Interest Expense | 641.00M | 565.00M | 509.00M | 444.00M | 437.00M |
| Pretax Income | 16.75B | 16.39B | 18.04B | 16.86B | 13.09B |
| Income Tax | 4.45B | 4.50B | 4.97B | 4.70B | 3.49B |
| Net Income | 12.81B | 12.63B | 13.06B | 12.16B | 9.61B |
| Eps Basic | 120.71 | 119.70 | 123.34 | 114.82 | 90.92 |
| Eps Diluted | 120.53 | 119.44 | 123.00 | 114.48 | 90.74 |
| Basic Shares Outstanding | 105.97M | 105.83M | 105.70M | 105.57M | 105.27M |
| Diluted Shares Outstanding | 105.97M | 105.83M | 105.70M | 105.57M | 105.27M |
| Ebit | 17.39B | 16.96B | 18.55B | 17.30B | 13.53B |
| Ebitda | 23.13B | 19.55B | 21.08B | 19.46B | 15.76B |
| Net Income Continuous Operations | 17.44B | 17.41B | 18.04B | 16.86B | 13.09B |
| Minority Interests | -19.00M | 32.00M | -26.00M | -43.00M | -36.00M |
| Preferred Stock Dividends | 0.00 | 0.00 | 0.00 | 0.00 | 0.00 |
Data provided by Twelve Data
Balance Sheet
| fiscal_date | 2026-03-31 | 2025-03-31 | 2024-03-31 | 2023-03-31 | 2022-03-31 |
|---|---|---|---|---|---|
| Cash And Cash Equivalents | 16.50B | 13.83B | 11.22B | 5.35B | 2.35B |
| Accounts Receivable | 20.31B | 25.23B | 21.87B | 21.54B | 16.98B |
| Total Assets | 104.89B | 96.44B | 84.89B | 81.98B | 60.91B |
| Total Liabilities | 39.97B | 35.46B | 31.41B | 37.45B | 19.15B |
| Long Term Debt | 4.09B | 4.42B | 5.20B | 3.73B | 4.28B |
| Shareholders Equity | 64.92B | 60.98B | 53.48B | 44.53B | 41.76B |
Data provided by Twelve Data
Cash Flow Statement
| fiscal_date | 2026-03-31 | 2025-03-31 | 2024-03-31 | 2023-03-31 | 2022-03-31 |
|---|---|---|---|---|---|
| Operating Activities Net Income | 17.44B | 17.41B | 18.04B | 16.86B | 13.09B |
| Operating Activities Stock Based Compensation | 166.00M | 375.00M | 434.00M | 816.00M | 55.00M |
| Operating Activities Other Non Cash Items | -431.00M | -110.00M | -307.00M | -432.00M | -55.00M |
| Operating Activities Other Assets Liabilities | -3.69B | -834.00M | N/A | N/A | N/A |
| Operating Activities Operating Cash Flow | 13.49B | 16.84B | 17.99B | 15.12B | 7.87B |
| Investing Activities Capital Expenditures | -1.75B | -1.02B | -2.42B | -1.79B | -1.55B |
| Investing Activities Net Acquisitions | -1.41B | -7.10B | -7.98B | 0.00 | 0.00 |
| Investing Activities Other Investing Activity | 252.00M | 626.00M | 453.00M | 316.00M | -3.74B |
| Investing Activities Investing Cash Flow | -2.91B | -7.49B | -9.94B | -1.47B | -5.30B |
| Financing Activities Common Stock Issuance | 0.00 | 0.00 | 0.00 | 0.00 | 1.00M |
| Financing Activities Common Dividends | -5.93B | -5.29B | -4.97B | -3.17B | -3.63B |
| Financing Activities Financing Cash Flow | -5.93B | -5.29B | -4.97B | -3.17B | -3.63B |
| End Cash Position | 15.95B | 13.82B | 11.29B | 5.27B | 2.37B |
| Free Cash Flow | 12.70B | 13.70B | 12.40B | 11.31B | 8.44B |
| Operating Activities Accounts Receivable | N/A | N/A | -174.00M | -2.12B | -5.23B |
Data provided by Twelve Data
Technical Analysis
Key Insights
- The current trend shows LTTS trading below its 200-day moving average of ₹3,777 but above the 50-day average of ₹3,410, indicating mixed momentum with potential short-term support.
- Key support levels are identified near ₹3,010 (52-week low) and ₹3,400, while resistance is observed around ₹4,000 and the 52-week high of ₹4,726.
- The stock is positioned between its 10-day and 200-day moving averages, suggesting consolidation with no clear directional bias.
- Momentum indicators show a neutral RSI near mid-range levels, a MACD with limited divergence, and a stochastic oscillator indicating neither overbought nor oversold conditions.
- Multi-timeframe analysis reveals stable weekly and monthly trends with moderate volatility, consistent with the low beta of 0.064.
- Potential market scenarios include sideways movement with range-bound trading between support and resistance levels, awaiting catalysts for directional breakout.
Trending News
1. Headline: LTTS shares in focus: Motilal Oswal seeks consistent deal execution before turning positive - CNBC TV18
Summary: HomeMarket NewsLTTS shares in focus: Motilal Oswal seeks consistent deal execution before turning positive · By Meghna Sen July 15, 2026, 7:36:50 AM IST (Updated) ... Shares of L&T Technology Services Ltd. (LTTS) will be in focus on Wednesday, July 15, after the engineering services company ...
Sentiment: neutral
2. Headline: L&T Technology Q1 FY27 slides: margins expand amid AI push By Investing.com
Summary: L&T Technology Services Limited (NSE:LTTS) presented its first quarter fiscal year 2027 results on July 14, 2026, showcasing margin expansion and strategic progress in artificial intelligence-driven engineering services despite modest revenue growth. The Mumbai-based engineering services provider reported revenue of INR 29,401 million ($309.9 million) with an EBIT margin of 15.7%, representing a 200 basis point improvement year-over-year. The company’s stock ...
Sentiment: positive
3. Headline: Earnings call transcript: L&T Technology Services posts solid Q1 2026 growth By Investing.com
Summary: I’m Sandesh. I welcome you all to the earnings call of L&T Technology Services for the first quarter of FY 2027. Our financial results, investor release, and press release have been filed on the stock exchanges and are also available on our website, www.ltts.com.
Sentiment: positive
4. Headline: L&T Technology Services Q1 FY27 Results: PAT rises 13% YoY; Revenue Jumps 11%
Summary: L&T Technology Services Q1 FY27 results: Revenue rose 11.47% YoY to ₹2,940.10 crore, while net profit increased 12.97% to ₹357.10 crore. Check LTTS Q1 results, segment-wise performance, EPS and key financial highlights.
Sentiment: positive
5. Headline: India's L&T Technology Services revenue rises on strength in sustainability segment — TradingView News
Summary: India's L&T Technology Services NSE:LTTS, an engineering research and development firm, posted an 11.5% rise in quarterly consolidated revenue on Tuesday, supported by robust client spending in its sustainability segment.The company had said in March it would sell its smart world and ...
Sentiment: positive
Powered by Brave
Recent Updates
News Summary
As of July 15, 2026. L&T Technology Services Ltd. reported strong Q1 FY27 financial results, with revenue increasing by 11.47% year-over-year to ₹2,940.10 crore and net profit rising by 12.97% to ₹357.10 crore, reflecting robust operational performance. Another report indicated consolidated revenue of ₹2,756.2 crore and profit after tax of ₹336.2 crore for the same quarter, alongside the board's approval of Luis Miranda's re-appointment as an independent director. These developments underscore LTTS's sustained growth momentum and stable governance framework amid a competitive engineering services landscape.
News Sentiment
The overall sentiment from recent updates is predominantly positive, driven by solid year-over-year revenue and profit growth reported for Q1 FY27. Margin expansion linked to AI initiatives and strategic focus on sustainability segments further supports a constructive tone. Neutral sentiments arise from cautious analyst commentary emphasizing the need for consistent deal execution and governance continuity. The balance of positive financial results and measured market expectations suggests a stable outlook with attention to operational execution.
Source List
Analytical Overview
Analysis Summary
L&T Technology Services Ltd. trades at a trailing P/E of 27.78 and a forward P/E of 20.13, which are moderate relative to the industry average P/E of 27.78, suggesting valuation in line with sector norms. The company’s revenue growth shows a slight quarterly decline of 4.2%, but year-over-year net income growth of 6.8% and recent quarterly revenue growth of 11.47% indicate a positive growth trajectory supported by expanding margins and AI-driven services. Financial health is robust with a low debt-to-equity ratio of 8.91%, strong operating cash flow of INR 14.55 billion, and free cash flow of INR 9.93 billion, reflecting solid liquidity and capital efficiency. Sector-specific opportunities include increasing demand for digital transformation and sustainability solutions, while challenges involve competitive pressures and regulatory complexities in the IT services industry. Considering India-specific factors, LTTS benefits from a favorable regulatory environment and growing domestic technology adoption, which support its strategic positioning.
Overall Business and Market Assessment
Supporting Factors: strong profitability metrics with ROE near 19.54%, solid cash flow generation, and strategic emphasis on AI and sustainability segments driving margin expansion
Risk Factors: the modest recent revenue decline, competitive intensity in engineering services, and the requirement for consistent deal execution as highlighted by analysts
SWOT Analysis
Strengths
- Strong profitability with a 19.54% return on equity.
- Robust cash flow generation supporting operational stability.
- Leadership in engineering services with focus on AI and sustainability.
- Low debt-to-equity ratio indicating financial prudence.
Weaknesses
- Recent quarterly revenue decline of 4.2% indicating growth volatility.
- High price-to-book ratio of 5.37 suggesting premium valuation.
- Dependence on consistent deal execution for sustained growth.
- Limited share float with 27.5 million shares impacting liquidity.
Opportunities
- Growing demand for digital transformation and AI-driven services.
- Expansion in sustainability and smart services segments.
- Favorable regulatory environment in India supporting technology adoption.
- Potential for strategic partnerships and acquisitions.
Threats
- Intense competition within the global IT and engineering services sector.
- Regulatory and compliance risks in multiple jurisdictions.
- Macroeconomic uncertainties affecting client spending.
- Technological disruption requiring continuous innovation.
Company Description
L&T Technology Services Ltd. is a prominent engineering services company, specializing in providing solutions across various industries. Its primary focus is on offering cutting-edge technology and engineering services in sectors like transportation, industrial products, telecom and hi-tech, process industries, and medical devices. L&T Technology Services Ltd. delivers customized solutions that range from product lifecycle management and digital manufacturing to IoT-driven smart services and artificial intelligence-based analytics. It plays a crucial role in driving innovation and efficiency for businesses seeking to leverage advanced technology to optimize their operations. By aiding companies in transforming their engineering processes, L&T Technology Services Ltd. significantly contributes to the evolution of industrial practices in the global market. Its prominence in the engineering and technology sector underscores its influence on enabling progressive technological frameworks and sustainable practices. Headquartered in India, L&T Technology Services Ltd. is part of the larger Larsen & Toubro Group, a testament to its robust and extensive expertise in engineering and construction, further cementing its status in the global engineering services market.