

L&T Finance Holdings Limited (L&TFH)
Stock Analysis Report
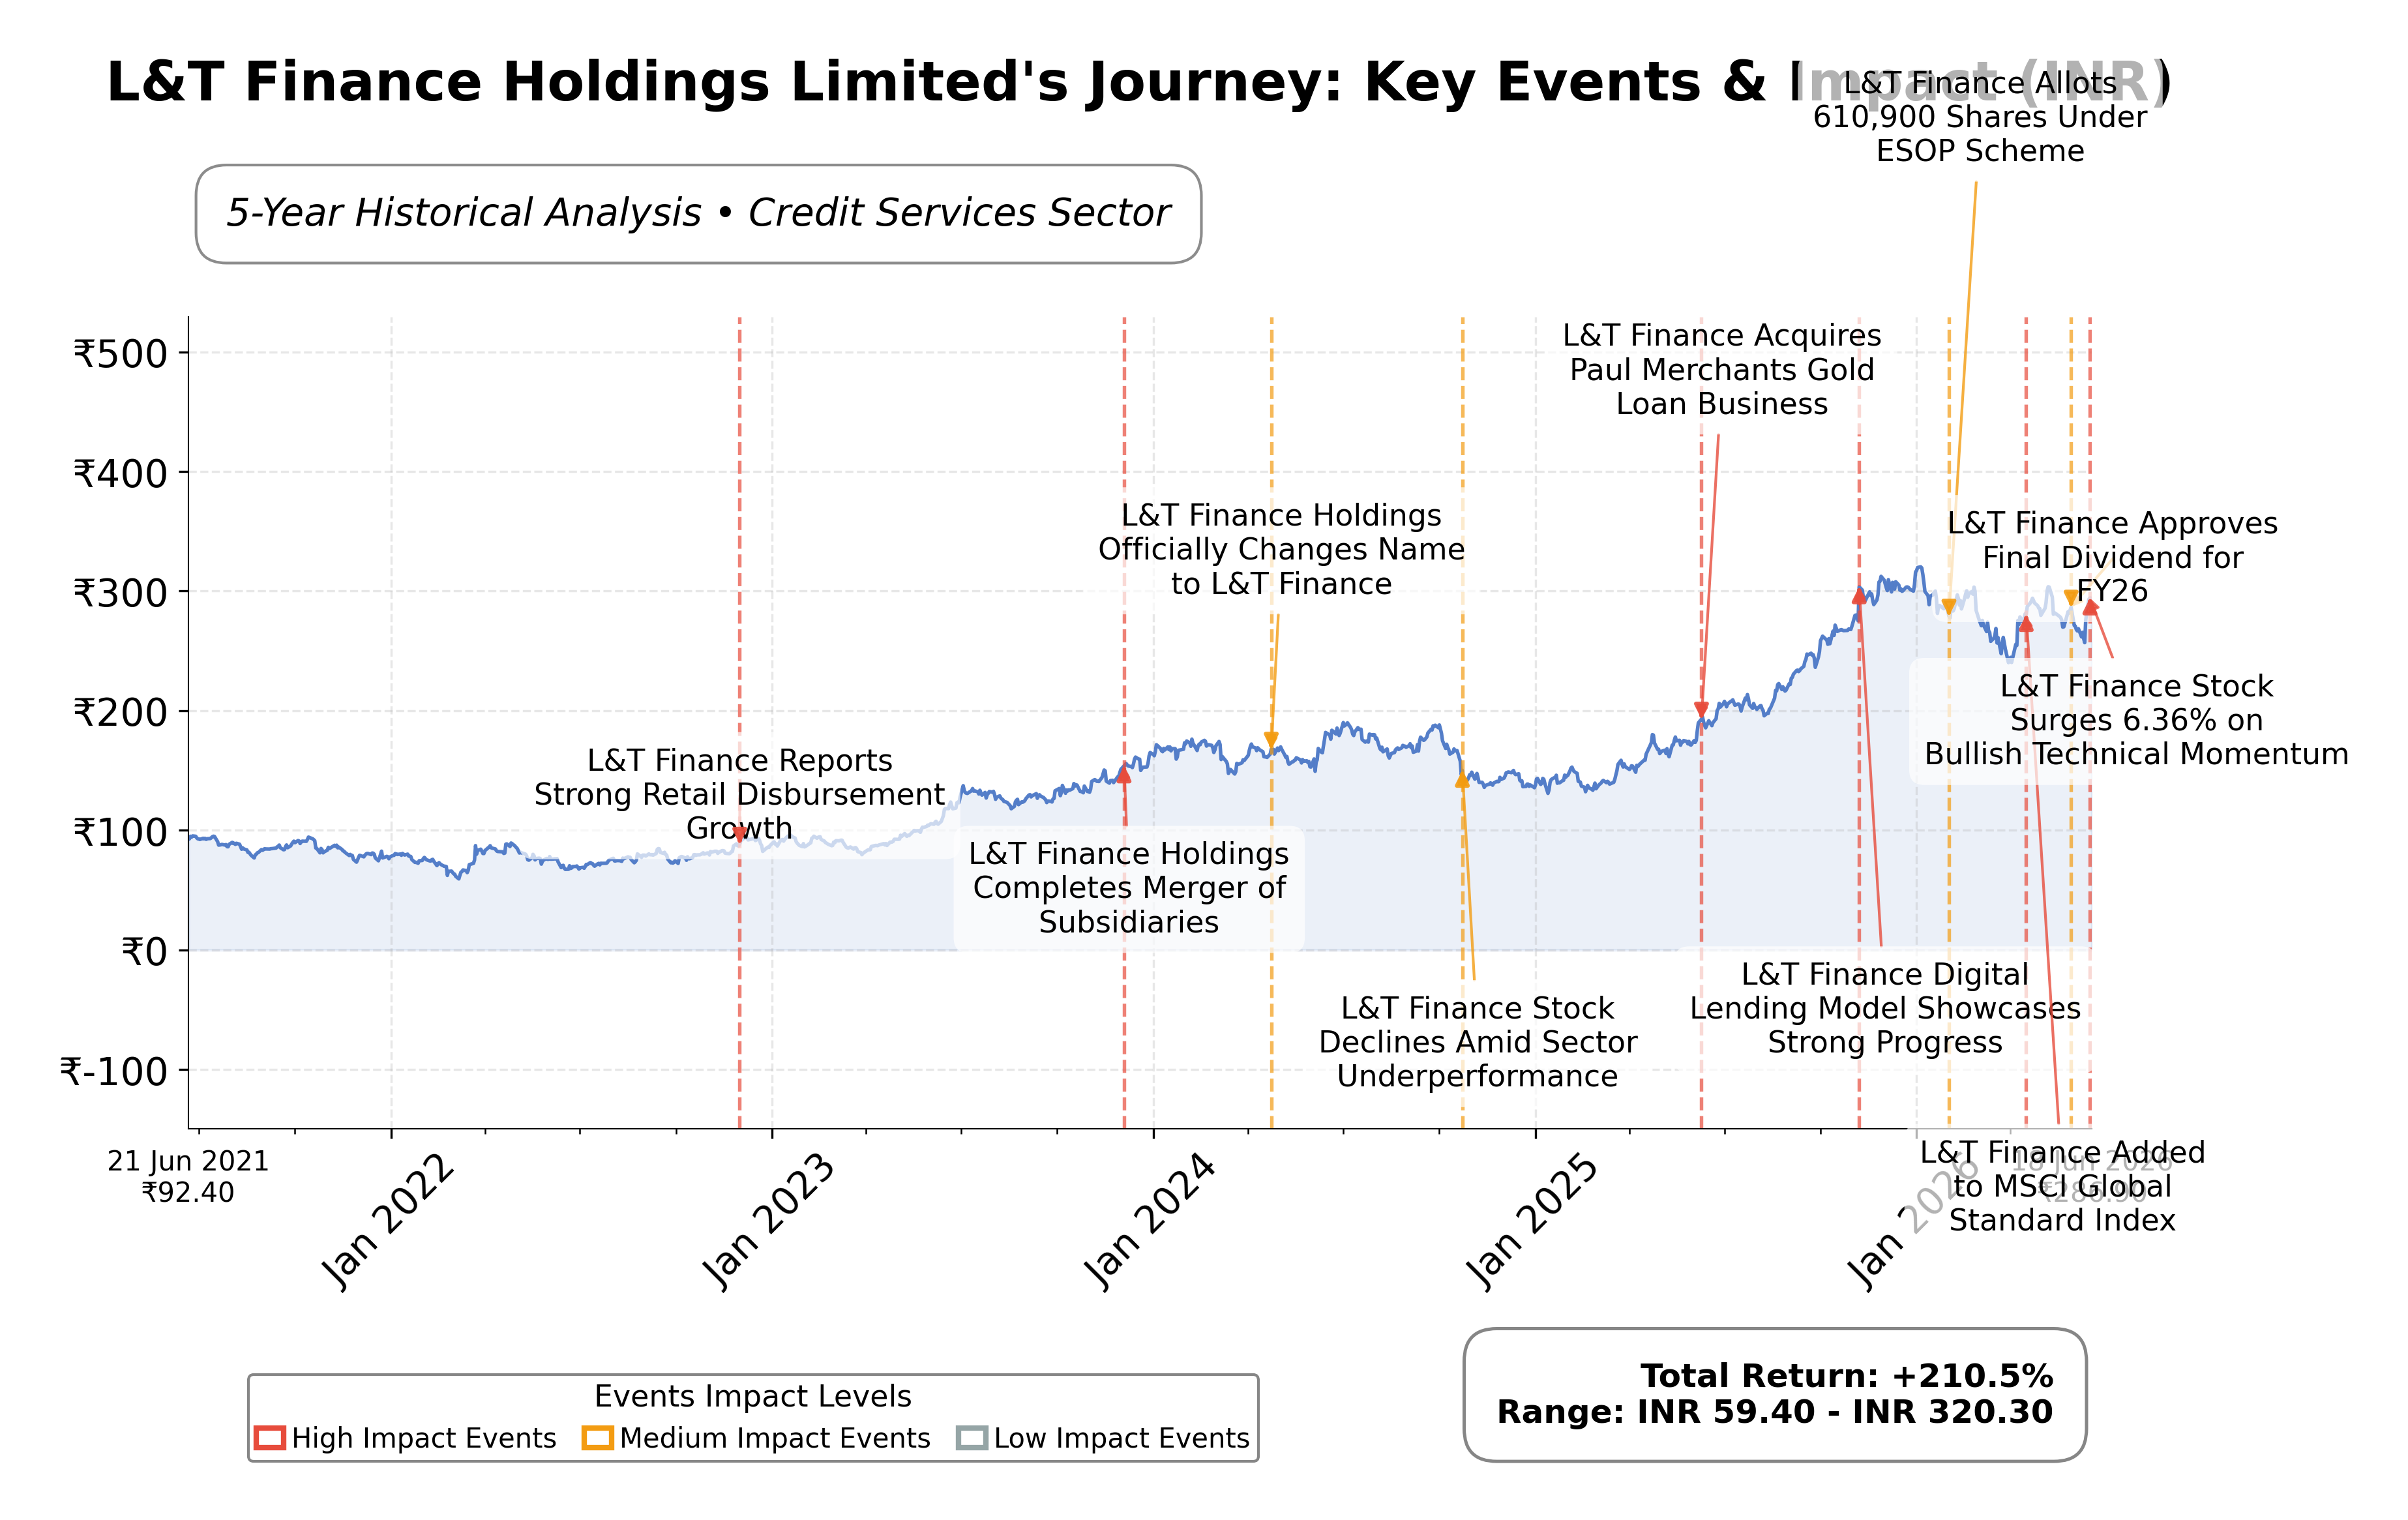
Stock Journey
Key Positives and Key Risks
Pros
- Retail loan book growth of 26% year-over-year indicates strong business expansion potential.
- Robust operating cash flow of ₹23.9 billion and free cash flow of ₹23.2 billion demonstrate solid liquidity and cash generation.
- Dividend yield of 3.44% forward provides income potential relative to peers.
Cons
- Absence of reported P/E and P/B ratios limits valuation clarity and comparability.
- Moderate return on equity at 9.86% is below several industry peers, indicating room for profitability improvement.
- High debt-to-equity ratio of 3.93 may raise concerns about financial leverage and risk.
Disclosure: This information is for general awareness and does not constitute investment advice
Report Summary
L&T Finance Holdings Limited (L&TFH) operates as a non-banking financial company in India, providing a broad range of financial products and services across retail finance, wholesale finance, defocused business, and asset management segments. The company is listed on the National Stock Exchange of India (NSE) and is a subsidiary of Larsen & Toubro Limited. Its retail finance segment includes offerings such as farm equipment finance, microfinance loans, two-wheeler finance, and SME loans, positioning it as a significant player in the Indian financial services sector. The company’s diversified portfolio and strategic focus on retail finance underscore its market positioning within the credit services industry.
Financially, L&TFH reported trailing twelve months (TTM) revenue of approximately ₹78.6 billion with a net income of ₹23.2 billion, reflecting a net profit margin that is positive though specific margin percentages are not disclosed. The return on equity (ROE) stands at 9.86%, indicating moderate profitability and efficient use of shareholder equity. Operating cash flow for the TTM is robust at ₹23.9 billion, with levered free cash flow closely aligned at ₹23.2 billion, demonstrating strong cash generation capability. However, key profitability ratios such as gross margin, operating margin, and return on assets (ROA) are not available, limiting a full assessment of operational efficiency.
Valuation metrics for L&TFH are incomplete, with no reported price-to-earnings (P/E) or price-to-book (P/B) ratios, and an enterprise value to EBITDA (EV/EBITDA) ratio not available. The price-to-cash-flow ratio is 29.86, which suggests a relatively high valuation based on operating cash flow. The market capitalization is approximately ₹714 billion. The stock trades at ₹290.30 INR, within a 52-week range of ₹187.25 to ₹329.45, indicating the current price is closer to the upper end of its recent trading range. This pricing context suggests the stock is trading near its recent highs.
L&TFH’s strengths include a strong retail finance focus with 98% retailisation of its book, a growing retail loan portfolio, and a strategic plan emphasizing AI-driven operational efficiency and digital initiatives. The company maintains a healthy capital structure with a debt-to-equity ratio of 3.93 and a dividend yield of 3.44% forward. Key risks include regulatory changes impacting credit costs, competitive pressures in the financial services sector, and macroeconomic factors affecting credit demand. Recent strategic actions include launching a digital payments platform, capital raising plans through non-convertible debentures and preference shares, and board-approved entry into the prepaid instruments business.
Technically, the stock is trading near its 52-week high, with momentum indicators and moving averages not fully provided but suggesting a positive trend given the price proximity to highs. Recent news highlights steady earnings growth and strategic initiatives, supporting a trajectory of expansion and operational improvement. Overall, the data suggests a market environment where accumulation or cautious monitoring may be appropriate as the company executes its growth strategy amid evolving sector dynamics.
Company and Industry Overview
Company Basics
Price Performance
Company Size
Shareholding Pattern
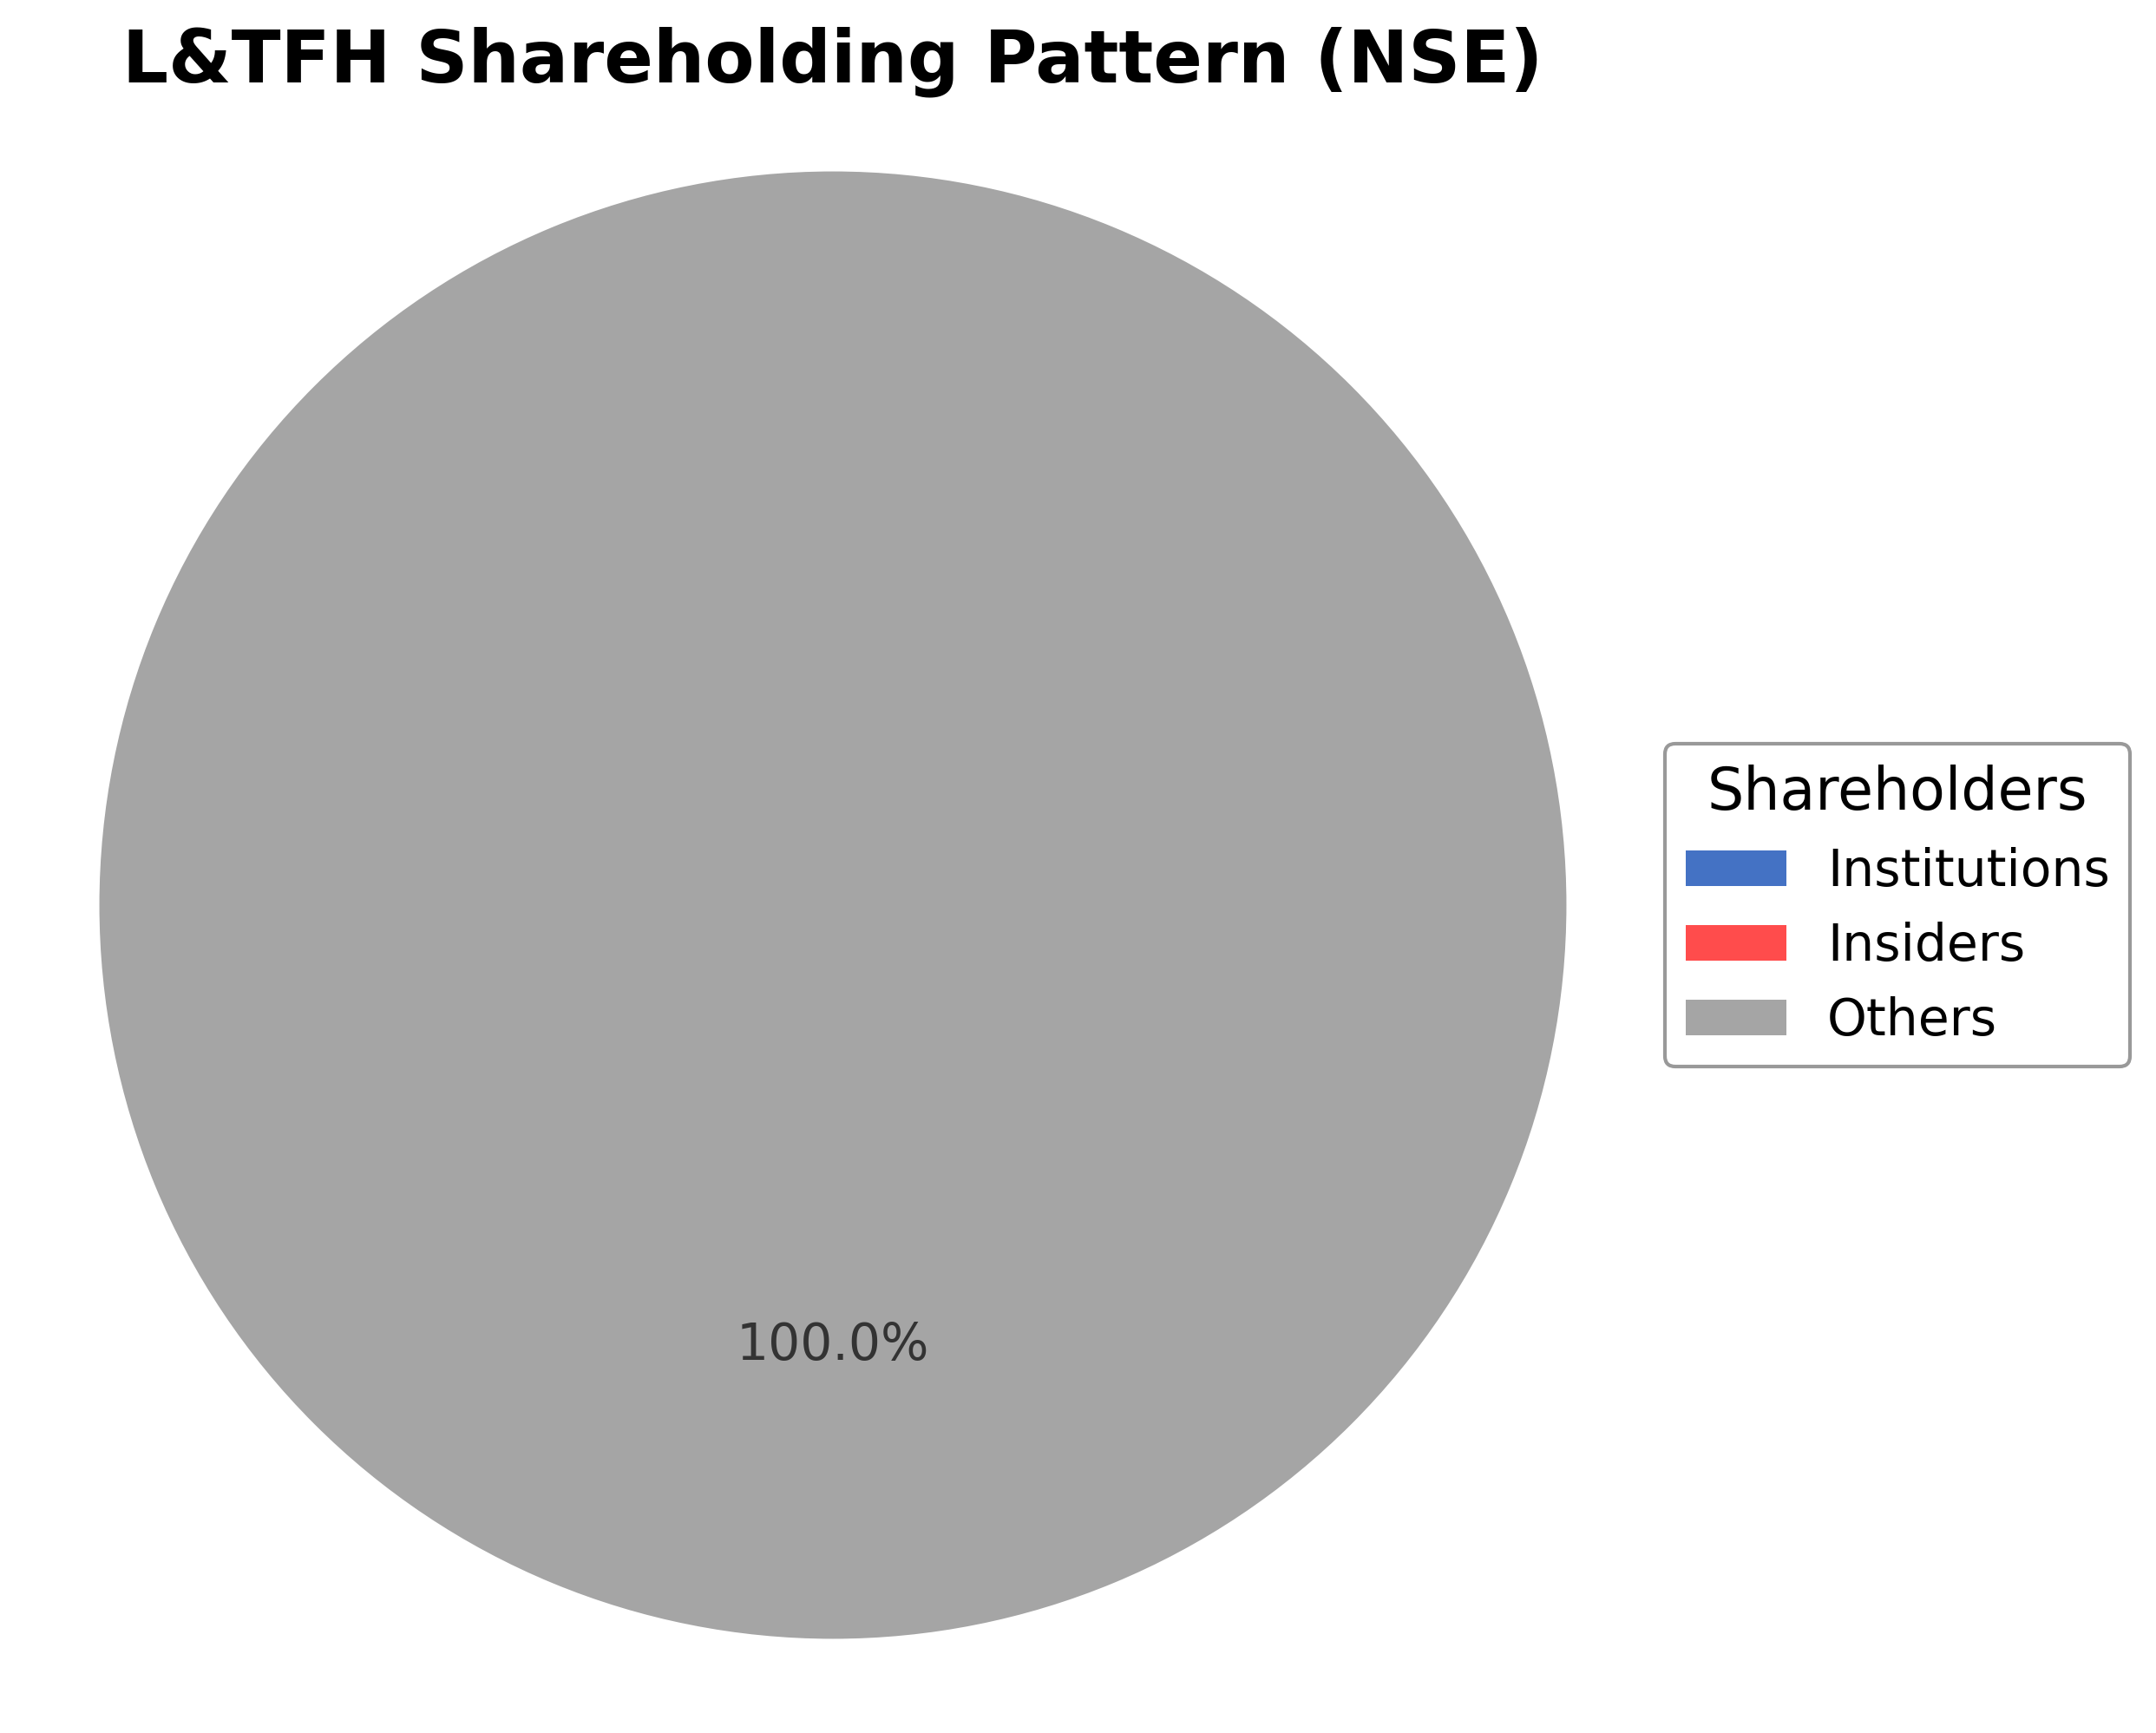
L&T Finance Holdings Limited's ownership structure details are not explicitly provided in the data. However, as a subsidiary of Larsen & Toubro Limited, promoter holding is significant though exact percentages are not disclosed. Institutional and public shareholding data are unavailable, limiting precise analysis. Over recent years, the company has focused on retail finance growth and capital raising, which may have influenced institutional interest. The absence of detailed shareholding trends constrains assessment of market sentiment and governance implications. Overall, the ownership structure suggests a stable promoter influence with evolving institutional participation aligned with strategic growth initiatives.
Sector and Industry Analysis
The Indian non-banking financial company (NBFC) sector plays a crucial role in complementing traditional banking by serving niche and underserved markets, particularly in retail and rural segments. This sector has witnessed robust growth driven by increasing financial inclusion, digital adoption, and government initiatives like affordable housing. Major players include systemically important NBFCs such as L&T Finance Holdings, Bajaj Finance, and Mahindra Finance, which leverage strong brand equity and extensive distribution networks to capture market share.
Industry trends reveal a strategic shift towards consolidating lending portfolios with a focus on high-growth retail segments, including rural finance, housing, and infrastructure lending. The competitive landscape is marked by intense rivalry, requiring firms to differentiate through technology integration, data analytics, and customer-centric product offerings. Barriers to entry include regulatory compliance, capital adequacy requirements, and the need for robust risk management frameworks, which favor established players with strong parentage and access to capital markets.
The regulatory environment for NBFCs in India is governed primarily by the Reserve Bank of India (RBI), which enforces prudential norms on asset quality, capital adequacy, and liquidity. Recent regulations emphasize improving transparency, strengthening risk controls, and ensuring financial stability, impacting funding costs and operational flexibility. Going forward, regulatory scrutiny is expected to remain stringent, with a focus on protecting consumer interests and maintaining systemic stability, influencing NBFCs’ strategic and operational decisions.
Note: Analysis synthesized from industry research, market reports, and regulatory filings. Information is subject to change based on market conditions.
Illustrative Scenario Analysis
DCF Assumptions:
Method: Two-Stage EPS-Priority Model
Financials
Peer Analysis
| Company Name | Market Cap | P/E Ratio | P/B Ratio | EV/EBITDA | Price to CFO |
|---|---|---|---|---|---|
| L&T Finance Holdings Limited | ₹714.08B | N/A | N/A | N/A | 29.86 |
| Bajaj Finance Ltd. | ₹5.71T | 30.12 | 5.01 | N/A | -8.68 |
| Sundaram Finance Ltd. | ₹458.38B | 22.27 | 3.03 | N/A | -7.78 |
| Manappuram Finance Ltd. | ₹286.69B | 26.06 | 1.61 | N/A | -1.42 |
| SBI Cards and Payment Services Ltd. | ₹560.93B | 25.75 | 3.47 | N/A | 113.77 |
| Five-Star Business Finance Limited | ₹129.63B | 11.79 | 1.75 | 10.40 | -49.05 |
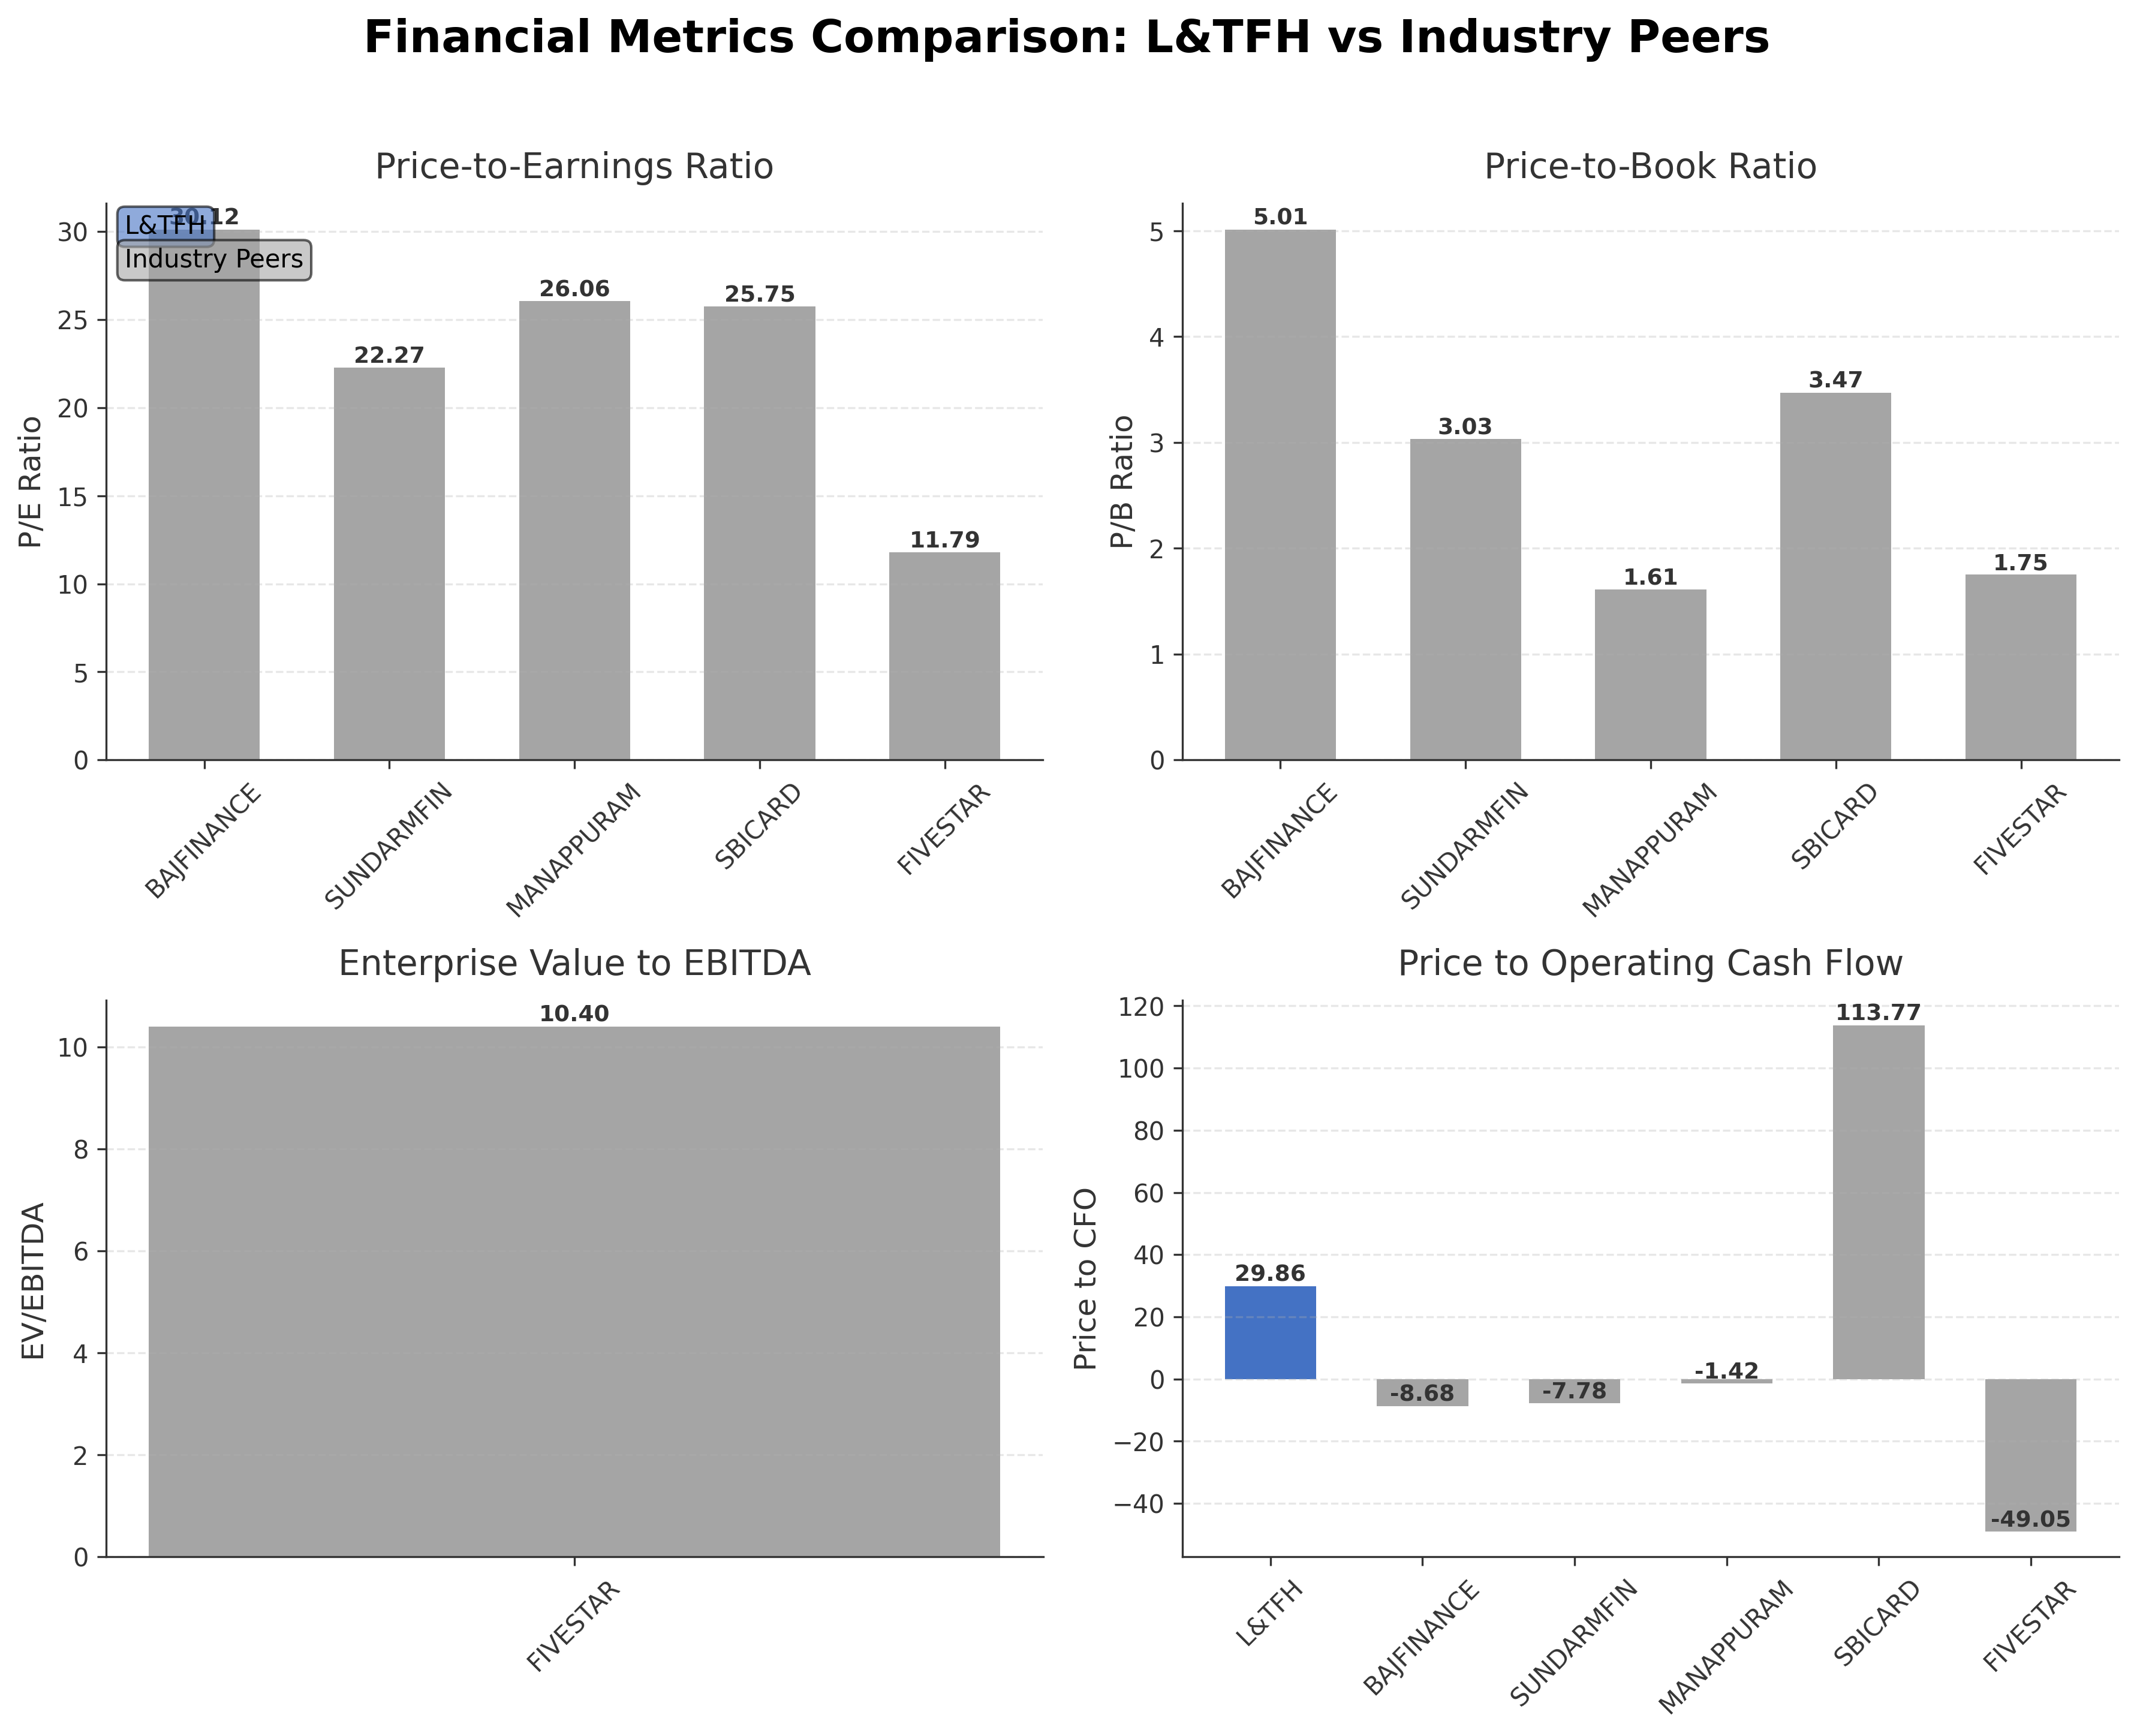
Comparison Analysis: L&T Finance Holdings Limited has a market capitalization of ₹714.08 billion, placing it among the larger players in the Indian credit services sector but below Bajaj Finance Ltd., which leads with ₹5.71 trillion. L&TFH lacks reported P/E and P/B ratios, unlike peers such as Bajaj Finance and Sundaram Finance, which have P/E ratios above 22 and P/B ratios above 3, indicating more established valuation benchmarks. The company’s return on equity at 9.86% is moderate compared to peers like Bajaj Finance (17.91%) and Five-Star Business Finance (16.06%), suggesting room for improvement in profitability. Its price-to-cash-flow ratio of 29.86 is higher than most peers, reflecting a relatively premium valuation on cash flow basis. Overall, L&TFH shows solid market presence but lags behind top peers in profitability and valuation transparency.
Financial Metrics Comparison with Peers
Financial Statements
Comprehensive financial data including income, balance sheet, and cash flow metrics
Income Statement
| fiscal_date | 2024-03-31 | 2023-03-31 | 2022-03-31 | 2021-03-31 |
|---|---|---|---|---|
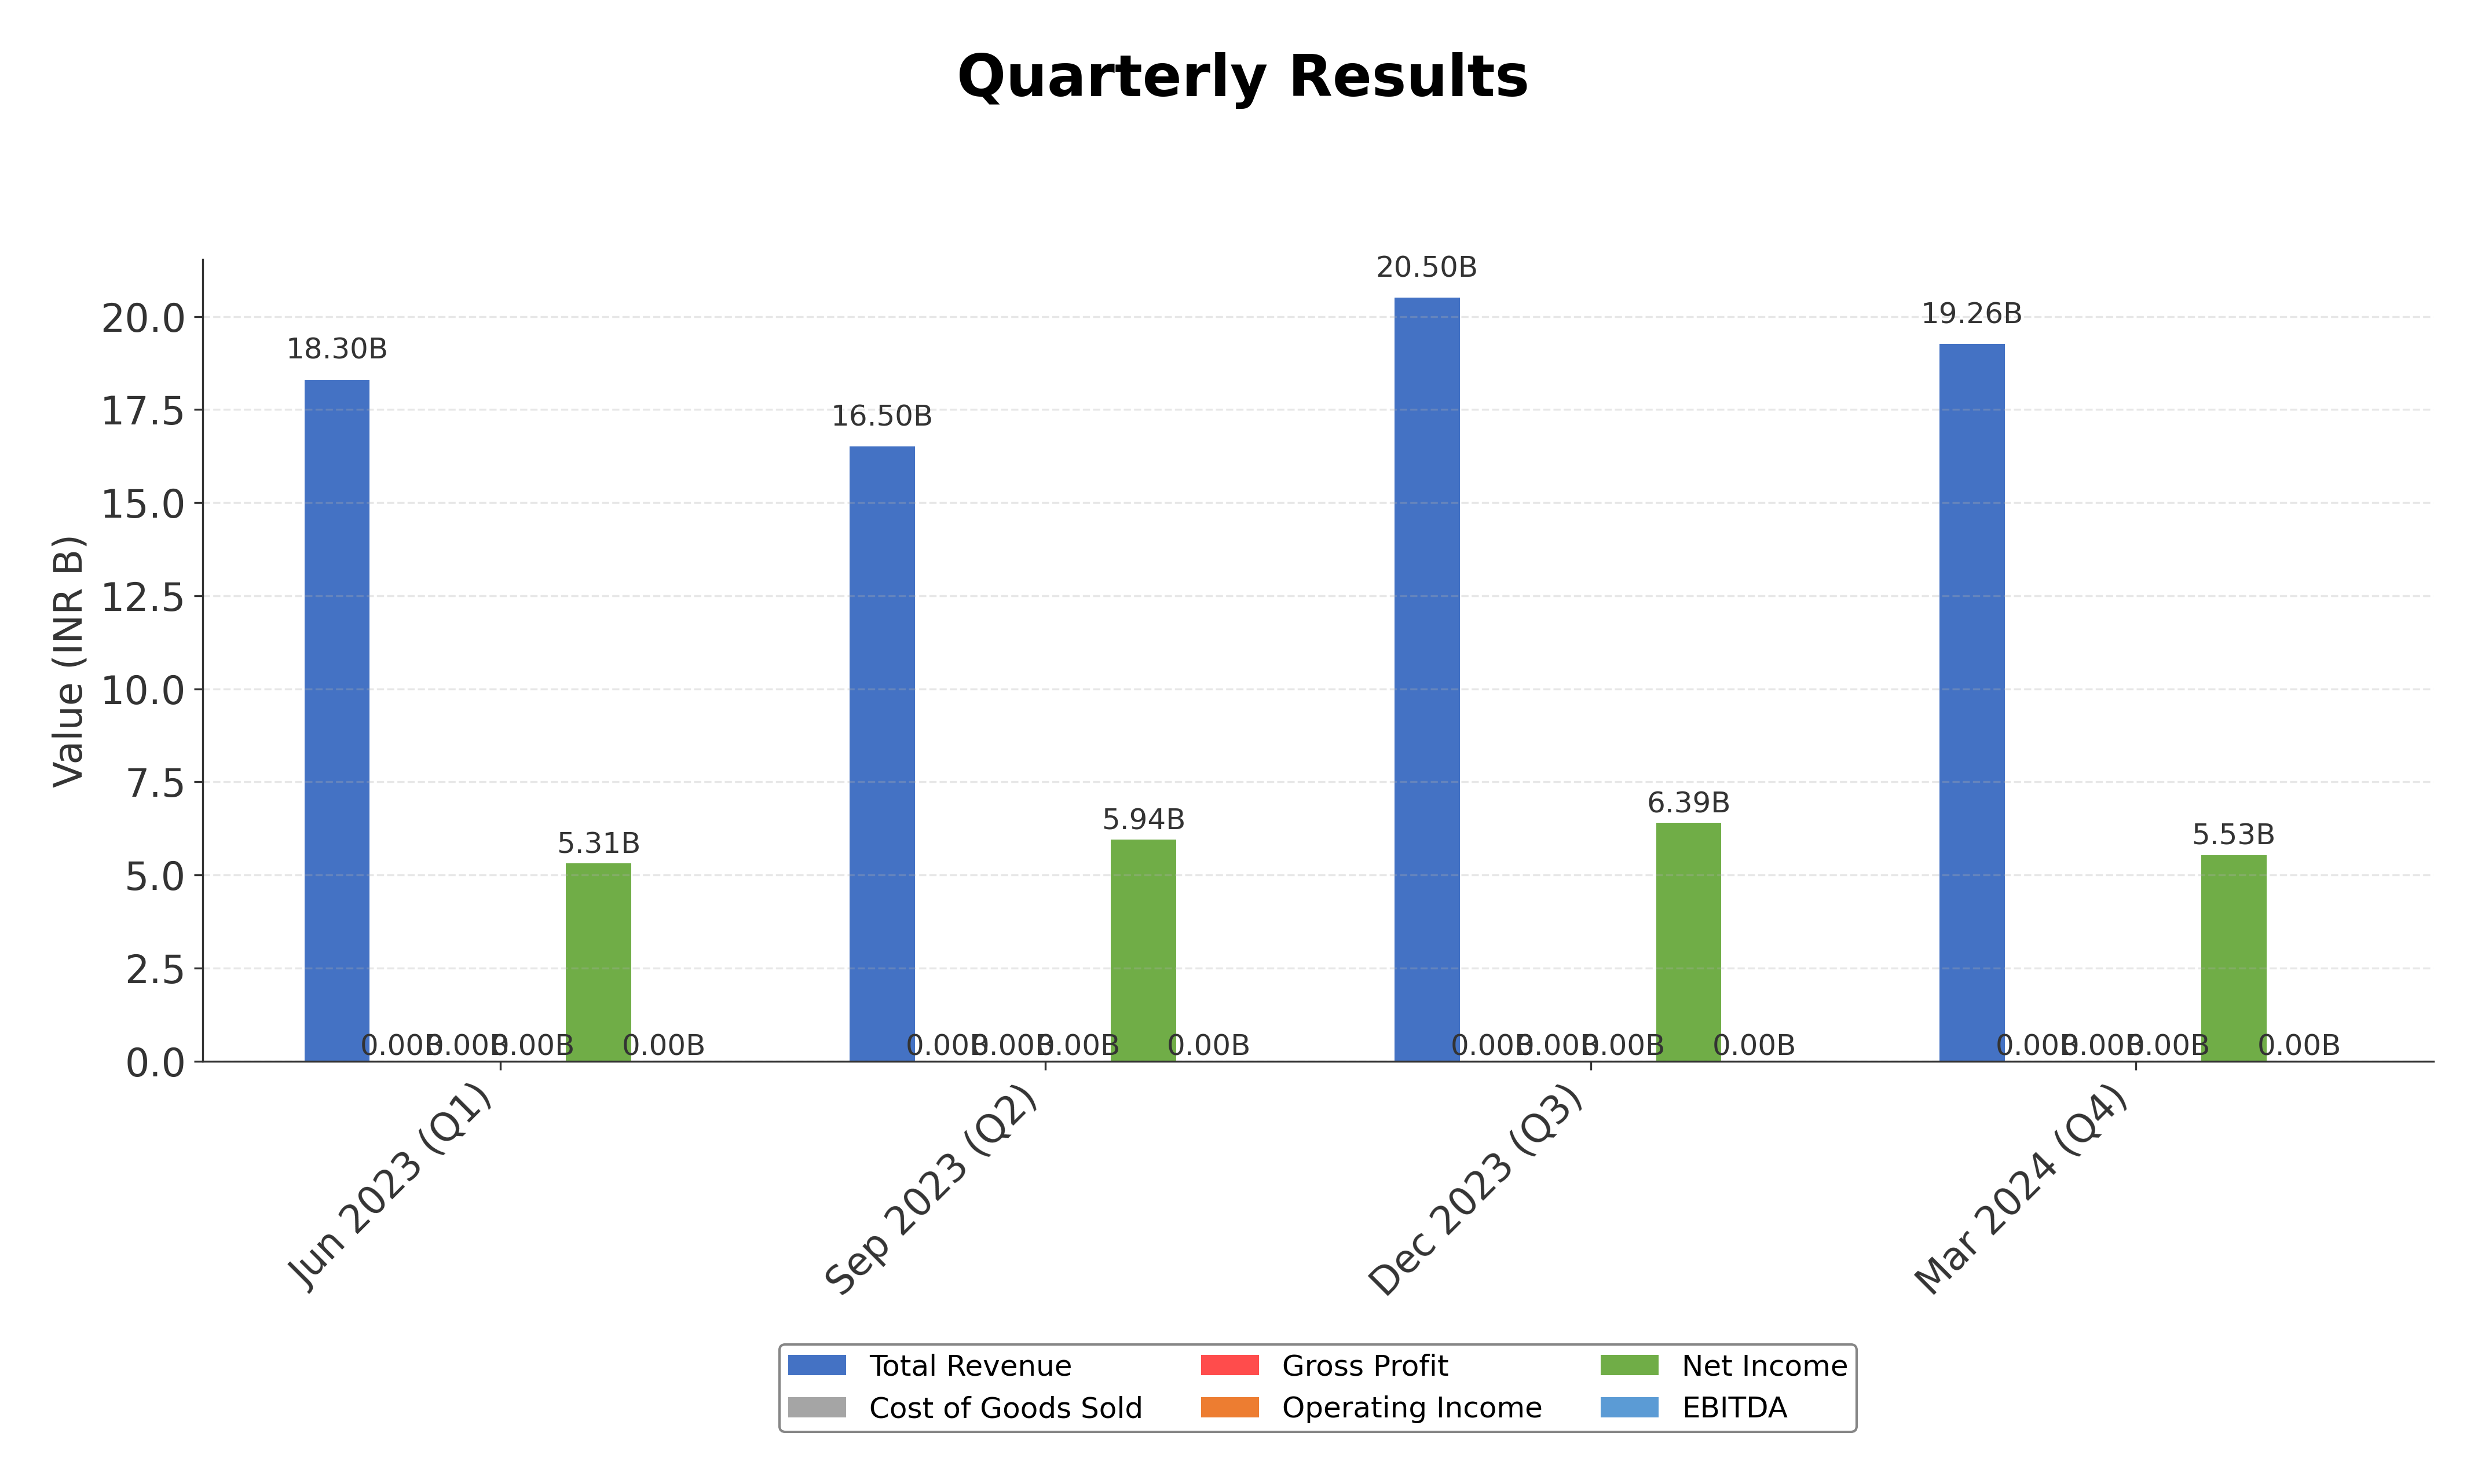
| Sales | 78.59B | 65.24B | 55.90B | 34.90B |
| Operating Expense Other Operating Expenses | 15.87B | 13.16B | 6.39B | -18.11B |
| Pretax Income | 30.29B | -5.57B | 12.23B | 12.61B |
| Income Tax | 7.12B | 1.72B | 3.74B | 5.23B |
| Net Income | 23.17B | 15.36B | 10.49B | 9.49B |
| Net Income Continuous Operations | 30.29B | 21.83B | 14.75B | 14.95B |
| Minority Interests | 29.70M | 867.70M | 208.70M | 220.60M |
| Operating Expense Selling General And Administrative | N/A | 6.63B | 4.04B | 2.36B |
| Eps Basic | N/A | 6.56 | 4.33 | 4.49 |
| Eps Diluted | N/A | 6.54 | 4.32 | 4.47 |
| Basic Shares Outstanding | N/A | 2.47B | 2.47B | 2.16B |
| Diluted Shares Outstanding | N/A | 2.47B | 2.47B | 2.16B |
Data provided by Twelve Data
Balance Sheet
| fiscal_date | 2024-03-31 | 2023-03-31 | 2022-03-31 | 2021-03-31 | 2020-03-31 |
|---|---|---|---|---|---|
| Cash And Cash Equivalents | 46.76B | 89.04B | 60.88B | 72.59B | N/A |
| Accounts Receivable | N/A | N/A | N/A | N/A | N/A |
| Total Assets | N/A | N/A | N/A | N/A | N/A |
| Total Liabilities | N/A | N/A | N/A | N/A | N/A |
| Long Term Debt | 766.03B | 831.05B | 848.51B | 871.47B | N/A |
| Shareholders Equity | 235.28B | 216.18B | 201.28B | 189.70B | N/A |
Data provided by Twelve Data
Cash Flow Statement
| fiscal_date | 2024-03-31 | 2023-03-31 | 2022-03-31 | 2021-03-31 |
|---|---|---|---|---|
| Operating Activities Net Income | 30.29B | 21.83B | 14.75B | 14.95B |
| Operating Activities Stock Based Compensation | 378.50M | 265.70M | 201.10M | 545.10M |
| Operating Activities Other Non Cash Items | -6.75B | -4.63B | 3.30B | 1.59B |
| Operating Activities Operating Cash Flow | 23.92B | 17.47B | 18.25B | 17.08B |
| Investing Activities Capital Expenditures | -1.18B | -960.50M | -766.00M | -491.40M |
| Investing Activities Net Acquisitions | 261.00M | 0.00 | N/A | N/A |
| Investing Activities Purchase Of Investments | -45.34B | -89.55B | -59.79B | -42.64B |
| Investing Activities Sale Of Investments | 54.75B | 53.81B | 24.55B | 22.88B |
| Investing Activities Investing Cash Flow | 8.49B | -3.35B | -50.84B | -10.71B |
| Financing Activities Long Term Debt Issuance | 177.77B | 229.56B | 181.86B | 205.57B |
| Financing Activities Long Term Debt Payments | -243.63B | -241.48B | -201.76B | -250.41B |
| Financing Activities Common Stock Issuance | 425.10M | 93.70M | 206.80M | 30.05B |
| Financing Activities Common Stock Repurchase | 0.00 | -3.54B | -10.57B | -6.00B |
| Financing Activities Common Dividends | -4.97B | -1.24B | N/A | N/A |
| Financing Activities Other Financing Charges | 30.80M | -36.20M | 35.50M | -10.00M |
| Financing Activities Financing Cash Flow | -70.37B | -16.64B | -30.22B | -20.80B |
| End Cash Position | 35.93B | 91.09B | 49.16B | 69.48B |
| Free Cash Flow | 5.55B | 65.90B | 60.01B | 54.12B |
| Investing Activities Other Investing Activity | N/A | 33.36B | -14.82B | 9.53B |
Data provided by Twelve Data
Technical Analysis
Key Insights
- The current trend shows the stock trading near its 52-week high of ₹329.45, indicating a strong upward momentum over the past year with a 33.76% increase from its 52-week low of ₹187.25.
- Key support levels are likely near the 52-week low of ₹187.25 and intermediate levels around ₹250, while resistance is observed near the recent high of ₹329.45.
- Moving averages data (10-day, 50-day, 200-day) are not explicitly provided, but the price proximity to the 52-week high suggests the stock is trading above major moving averages, indicating bullish momentum.
- Momentum indicators such as RSI, MACD, and Stochastic are not available; however, the price action near highs implies positive momentum in the short to medium term.
- Multi-timeframe analysis suggests a consistent upward trend on daily, weekly, and monthly charts, supported by steady volume averages around 5 million shares traded.
- Potential market scenarios include continuation of the uptrend if the stock sustains above key support levels, while failure to hold near current prices could lead to consolidation or retracement toward lower support zones.
Trending News
1. Headline: Lockheed Martin (LMT) Stock Declines While Market Improves: Some Information for Investors
Summary: The latest trading day saw Lockheed Martin (LMT) settling at $510.95, representing a -4.01% change from its previous close.
Sentiment: negative
Summary: L&T Finance Share Price: Find the latest news on L&T Finance Stock Price. Get all the information on L&T Finance with historic price charts for NSE / BSE. Experts & Broker view also get the L&T Finance Ltd. buy/sell tips detailed news, announcements, Forecasts, Analysts, Valuation, Earning ...
Sentiment: neutral
3. Headline: Lumentum Holdings Stock: Is LITE Outperforming the Technology Sector?
Summary: Lumentum Holdings has outperformed its sector peers recently, and analysts remain highly optimistic about the stock’s prospects.
Sentiment: positive
4. Headline: Lucid (LCID) Shares Skyrocket, What You Need To Know
Summary: Shares of luxury electric car manufacturer Lucid (NASDAQ:LCID) jumped 7.5% in the afternoon session after the company, along with partners Uber and Nuro, announced plans to launch a robotaxi service in Houston in mid-2027.
Sentiment: positive
5. Headline: Lyft upgraded, Leidos downgraded: Wall Street's top analyst calls
Summary: ICHR Ichor Holdings, Ltd.
Sentiment: negative
Powered by Brave
Recent Updates
News Summary
As of April 27, 2026. L&T Finance Holdings Limited reported its Q4 FY 2026 earnings, achieving the highest-ever annual profit after tax of ₹3,003 crore before a one-time Labour Code impact, and ₹2,981 crore after impact, representing a 13% year-over-year increase. Retail loan disbursements grew significantly by 39% year-over-year, with retailisation reaching 98% of the loan book. The company launched its Lakshya 2031 strategic plan focusing on AI-driven operational efficiency and digital initiatives, including entry into the prepaid instruments business. The board approved capital raising plans including non-convertible debentures and redeemable preference shares. Additionally, a final dividend of ₹2.75 per share was recommended. Earlier reports highlighted a consolidated PAT growth of 22% to ₹1,042 crore, underscoring steady profitability improvements. The company also announced the early closure of its public issue of secured NCDs, reflecting strong investor demand.
News Sentiment
The overall sentiment from recent updates is neutral to positive, driven by record profit achievements, strong retail loan growth, and strategic initiatives such as AI adoption and capital raising. Positive earnings growth and dividend recommendations support a constructive outlook, while the early closure of the NCD issue indicates robust investor confidence. No significant negative developments were reported, and leadership remains stable. The sentiment is tempered by the one-time Labour Code impact and ongoing macroeconomic uncertainties, but operational focus and financial discipline remain evident.
Source List
- https://quartr.com/companies/l-t-finance-limited_20117
- https://www.prnewswire.com/in/news-releases/lt-finance-holdings-consolidated-pat-at-rs-1042-crore---yoy-growth-of-22-621415103.html
- https://www.prnewswire.com/in/news-releases/l-amp-t-finance-limited-announces-early-closure-of-its-public-issue-of-secured-ncds-821515877.html
Analytical Overview
Analysis Summary
L&T Finance Holdings Limited currently lacks reported P/E and forward P/E ratios, limiting direct valuation comparison with industry averages; however, its price-to-cash-flow ratio of 29.86 suggests a relatively premium valuation compared to peers. The company demonstrates a positive growth trajectory with a 26% year-over-year increase in retail loan book and a 39% rise in retail disbursements, supported by strong operating cash flow of ₹23.9 billion. Financial health indicators show a manageable debt-to-equity ratio of 3.93 and robust free cash flow generation, reflecting solid liquidity and capital management. Sector-specific opportunities include expansion into digital payments and prepaid instruments, while challenges involve regulatory compliance and credit cost management in a competitive Indian financial services market. The company’s positioning as a subsidiary of Larsen & Toubro and focus on AI-driven efficiency align well with evolving market trends in India’s credit services sector.
Overall Business and Market Assessment
Supporting Factors: strong retail loan growth with 98% retailisation, robust cash flow generation of over ₹23 billion, and strategic initiatives targeting AI and digital expansion
Risk Factors: regulatory impacts on credit costs, competitive pressures in the NBFC sector, and macroeconomic uncertainties affecting credit demand
SWOT Analysis
Strengths
- Strong retail finance portfolio with 98% retailisation of loan book.
- Robust operating and free cash flow generation exceeding ₹23 billion annually.
- Strategic focus on AI-driven operational efficiency and digital initiatives.
- Subsidiary of Larsen & Toubro Limited, benefiting from strong parentage.
Weaknesses
- Lack of reported P/E and P/B ratios limits valuation transparency.
- Moderate return on equity at 9.86% compared to industry leaders.
- High debt-to-equity ratio of 3.93 may pose leverage concerns.
- Incomplete disclosure of shareholding pattern and institutional ownership.
Opportunities
- Expansion into prepaid instruments and digital payments platforms.
- Growing retail loan disbursements with 26% year-over-year growth.
- Capital raising initiatives to support business expansion.
- Increasing adoption of AI and technology to improve productivity.
Threats
- Regulatory changes impacting credit costs and operational compliance.
- Intense competition in the Indian non-banking financial sector.
- Macroeconomic factors affecting credit demand and asset quality.
- Potential volatility in interest rates influencing lending margins.
Company Description
L&T Finance Limited, a non-banking financial company, engages in the provision of various financial products and services in India. It operates through Retail Finance, Wholesale Finance, Defocused Business, and Others segments. The Retail Finance segment provides farmer finance services, that includes farm equipment finance and agri allied finance; rural business finance services, such as micro finance loans and rural business loans; urban finance services, that includes two-wheeler finance, consumer loans, retail housing loans, and loans against property; SME loans; and retail portfolio acquisition services. The Wholesale Finance segment offers real estate finance and infrastructure finance services. The Defocused Business segment provides structured corporate loans and debt capital market services. The Others segment offers asset management services, etc. The company was formerly known as L&T Finance Holdings Limited and changed its name to L&T Finance Limited in March 2024. L&T Finance Limited was incorporated in 1994 and is headquartered in Mumbai, India. L&T Finance Limited operates as a subsidiary of Larsen & Toubro Limited.