
Lincoln Pharmaceuticals Ltd (LINCOLN)
Stock Analysis Report
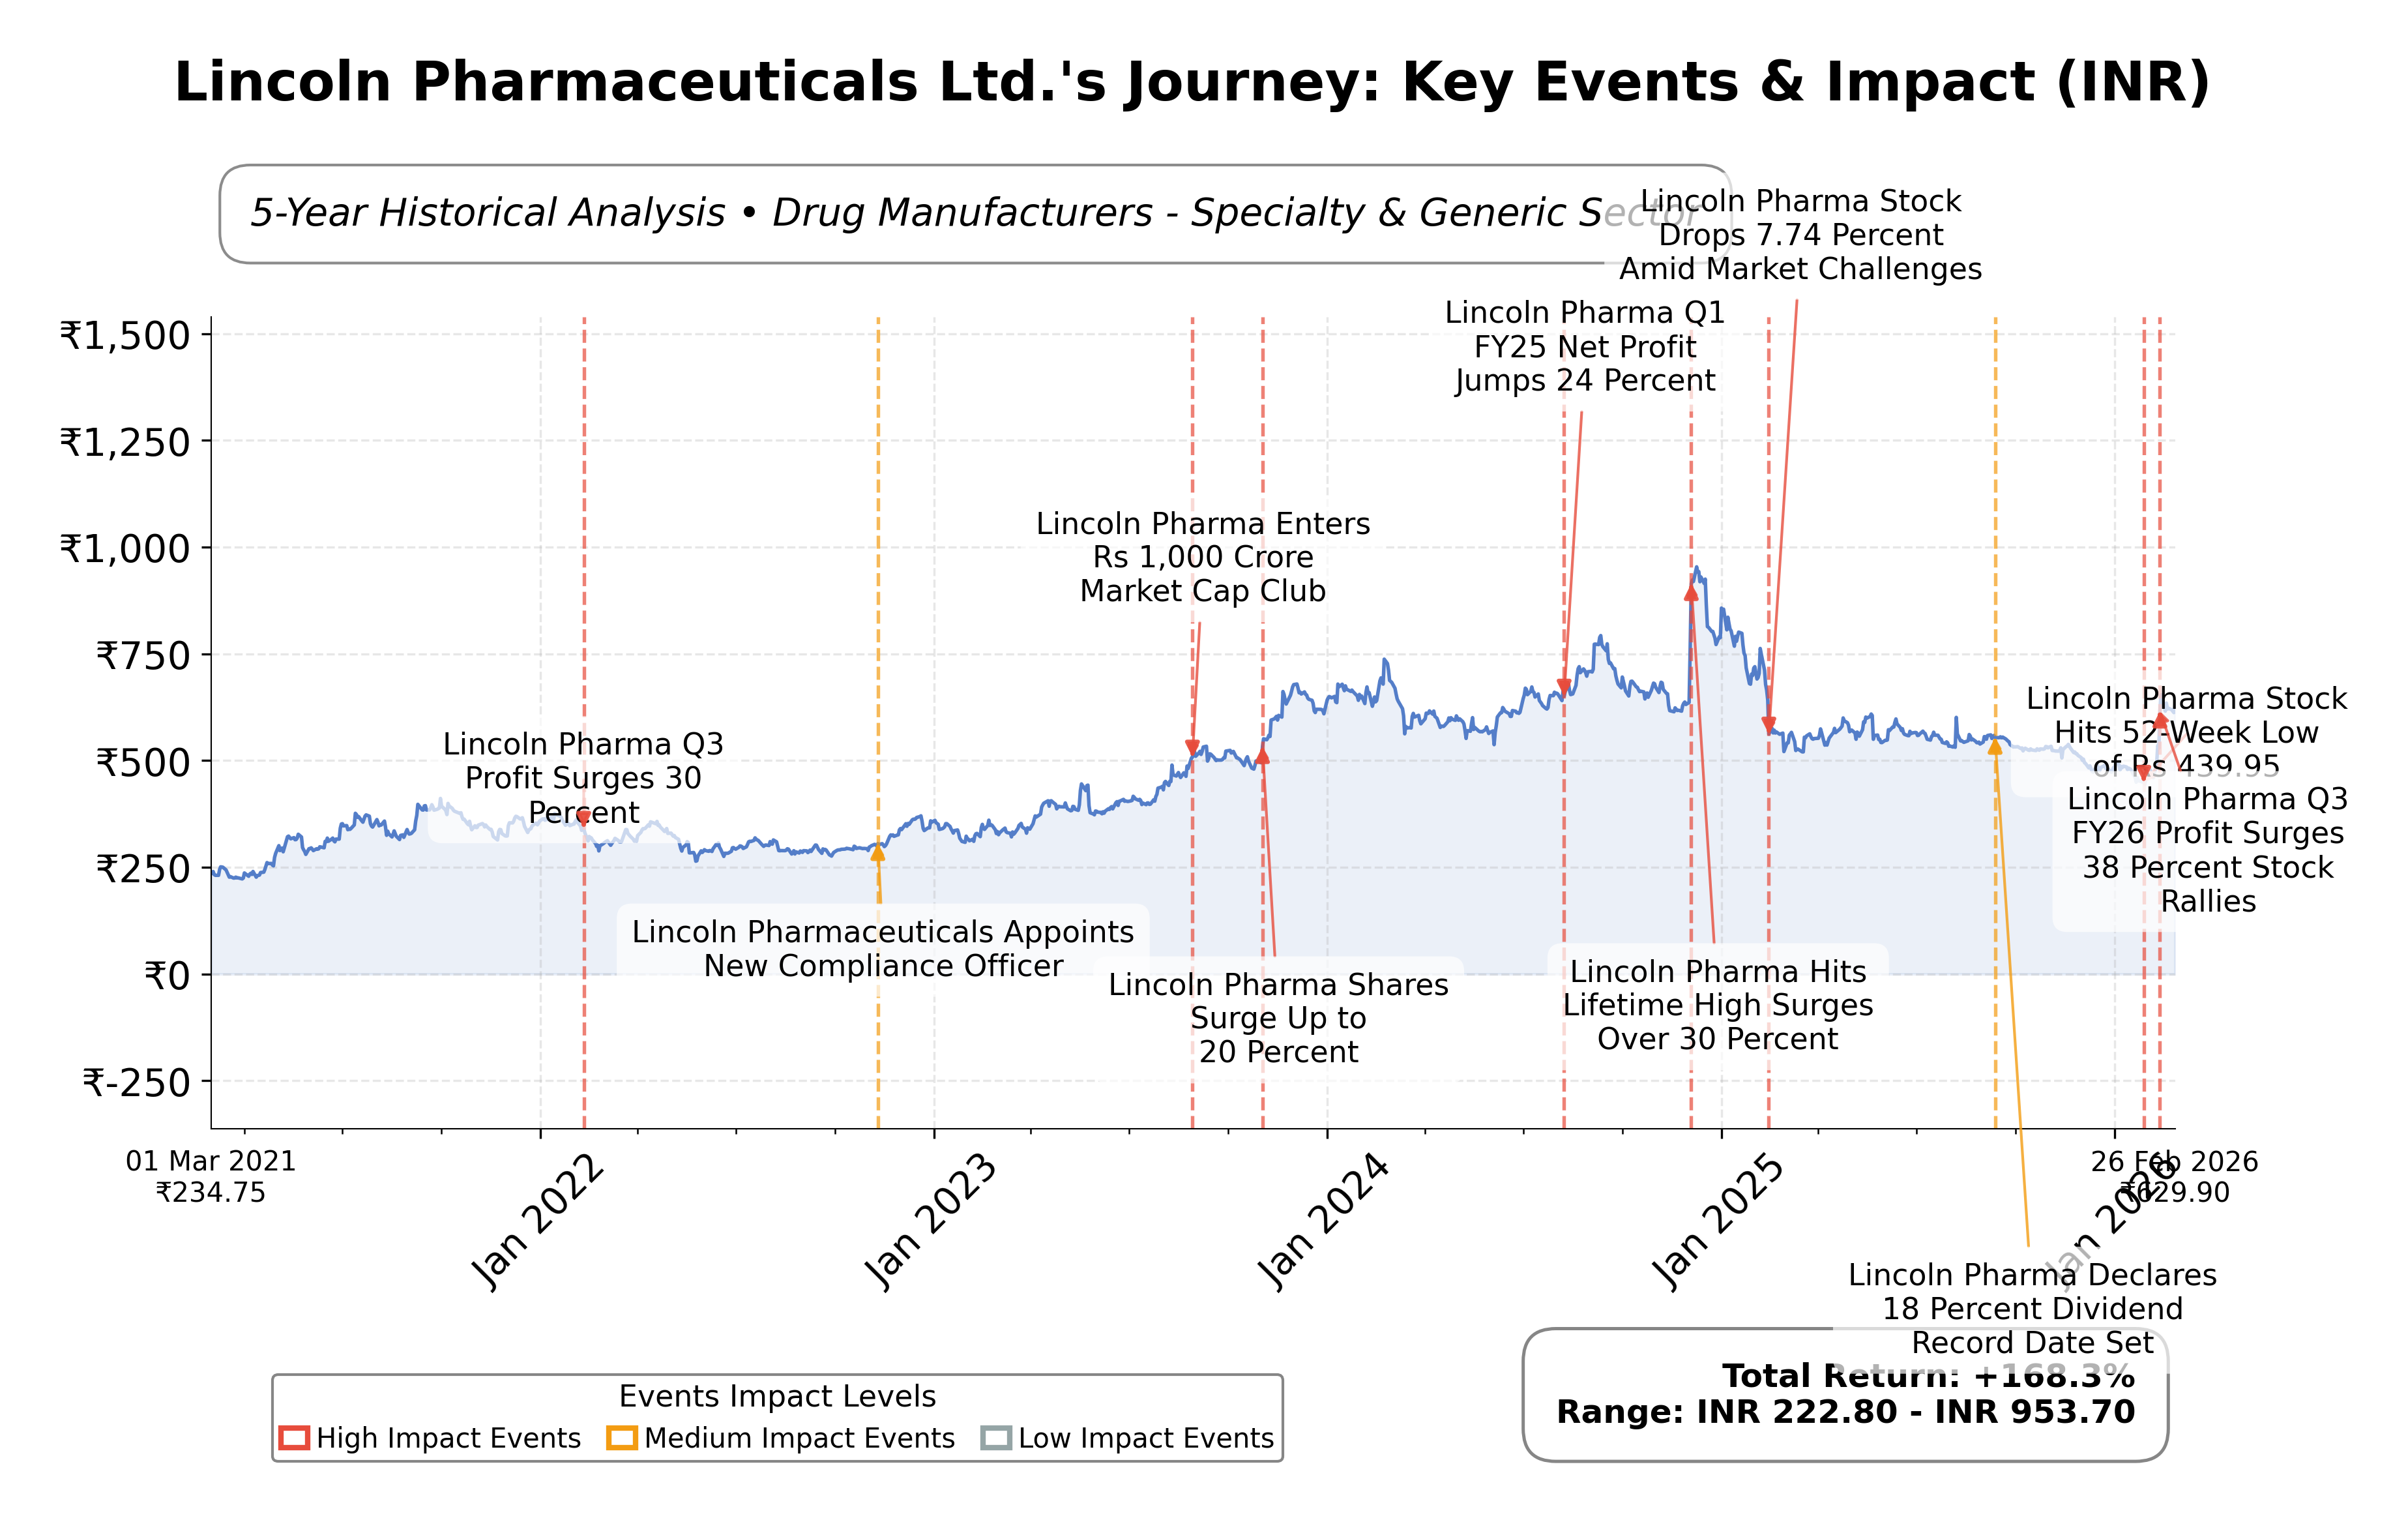
Stock Journey
Key Positives and Key Risks
Pros
- Trailing P/E ratio of 15.32 aligns with industry average, indicating reasonable valuation.
- Strong liquidity position with a current ratio of 4.71 and minimal debt-to-equity ratio of 0.009.
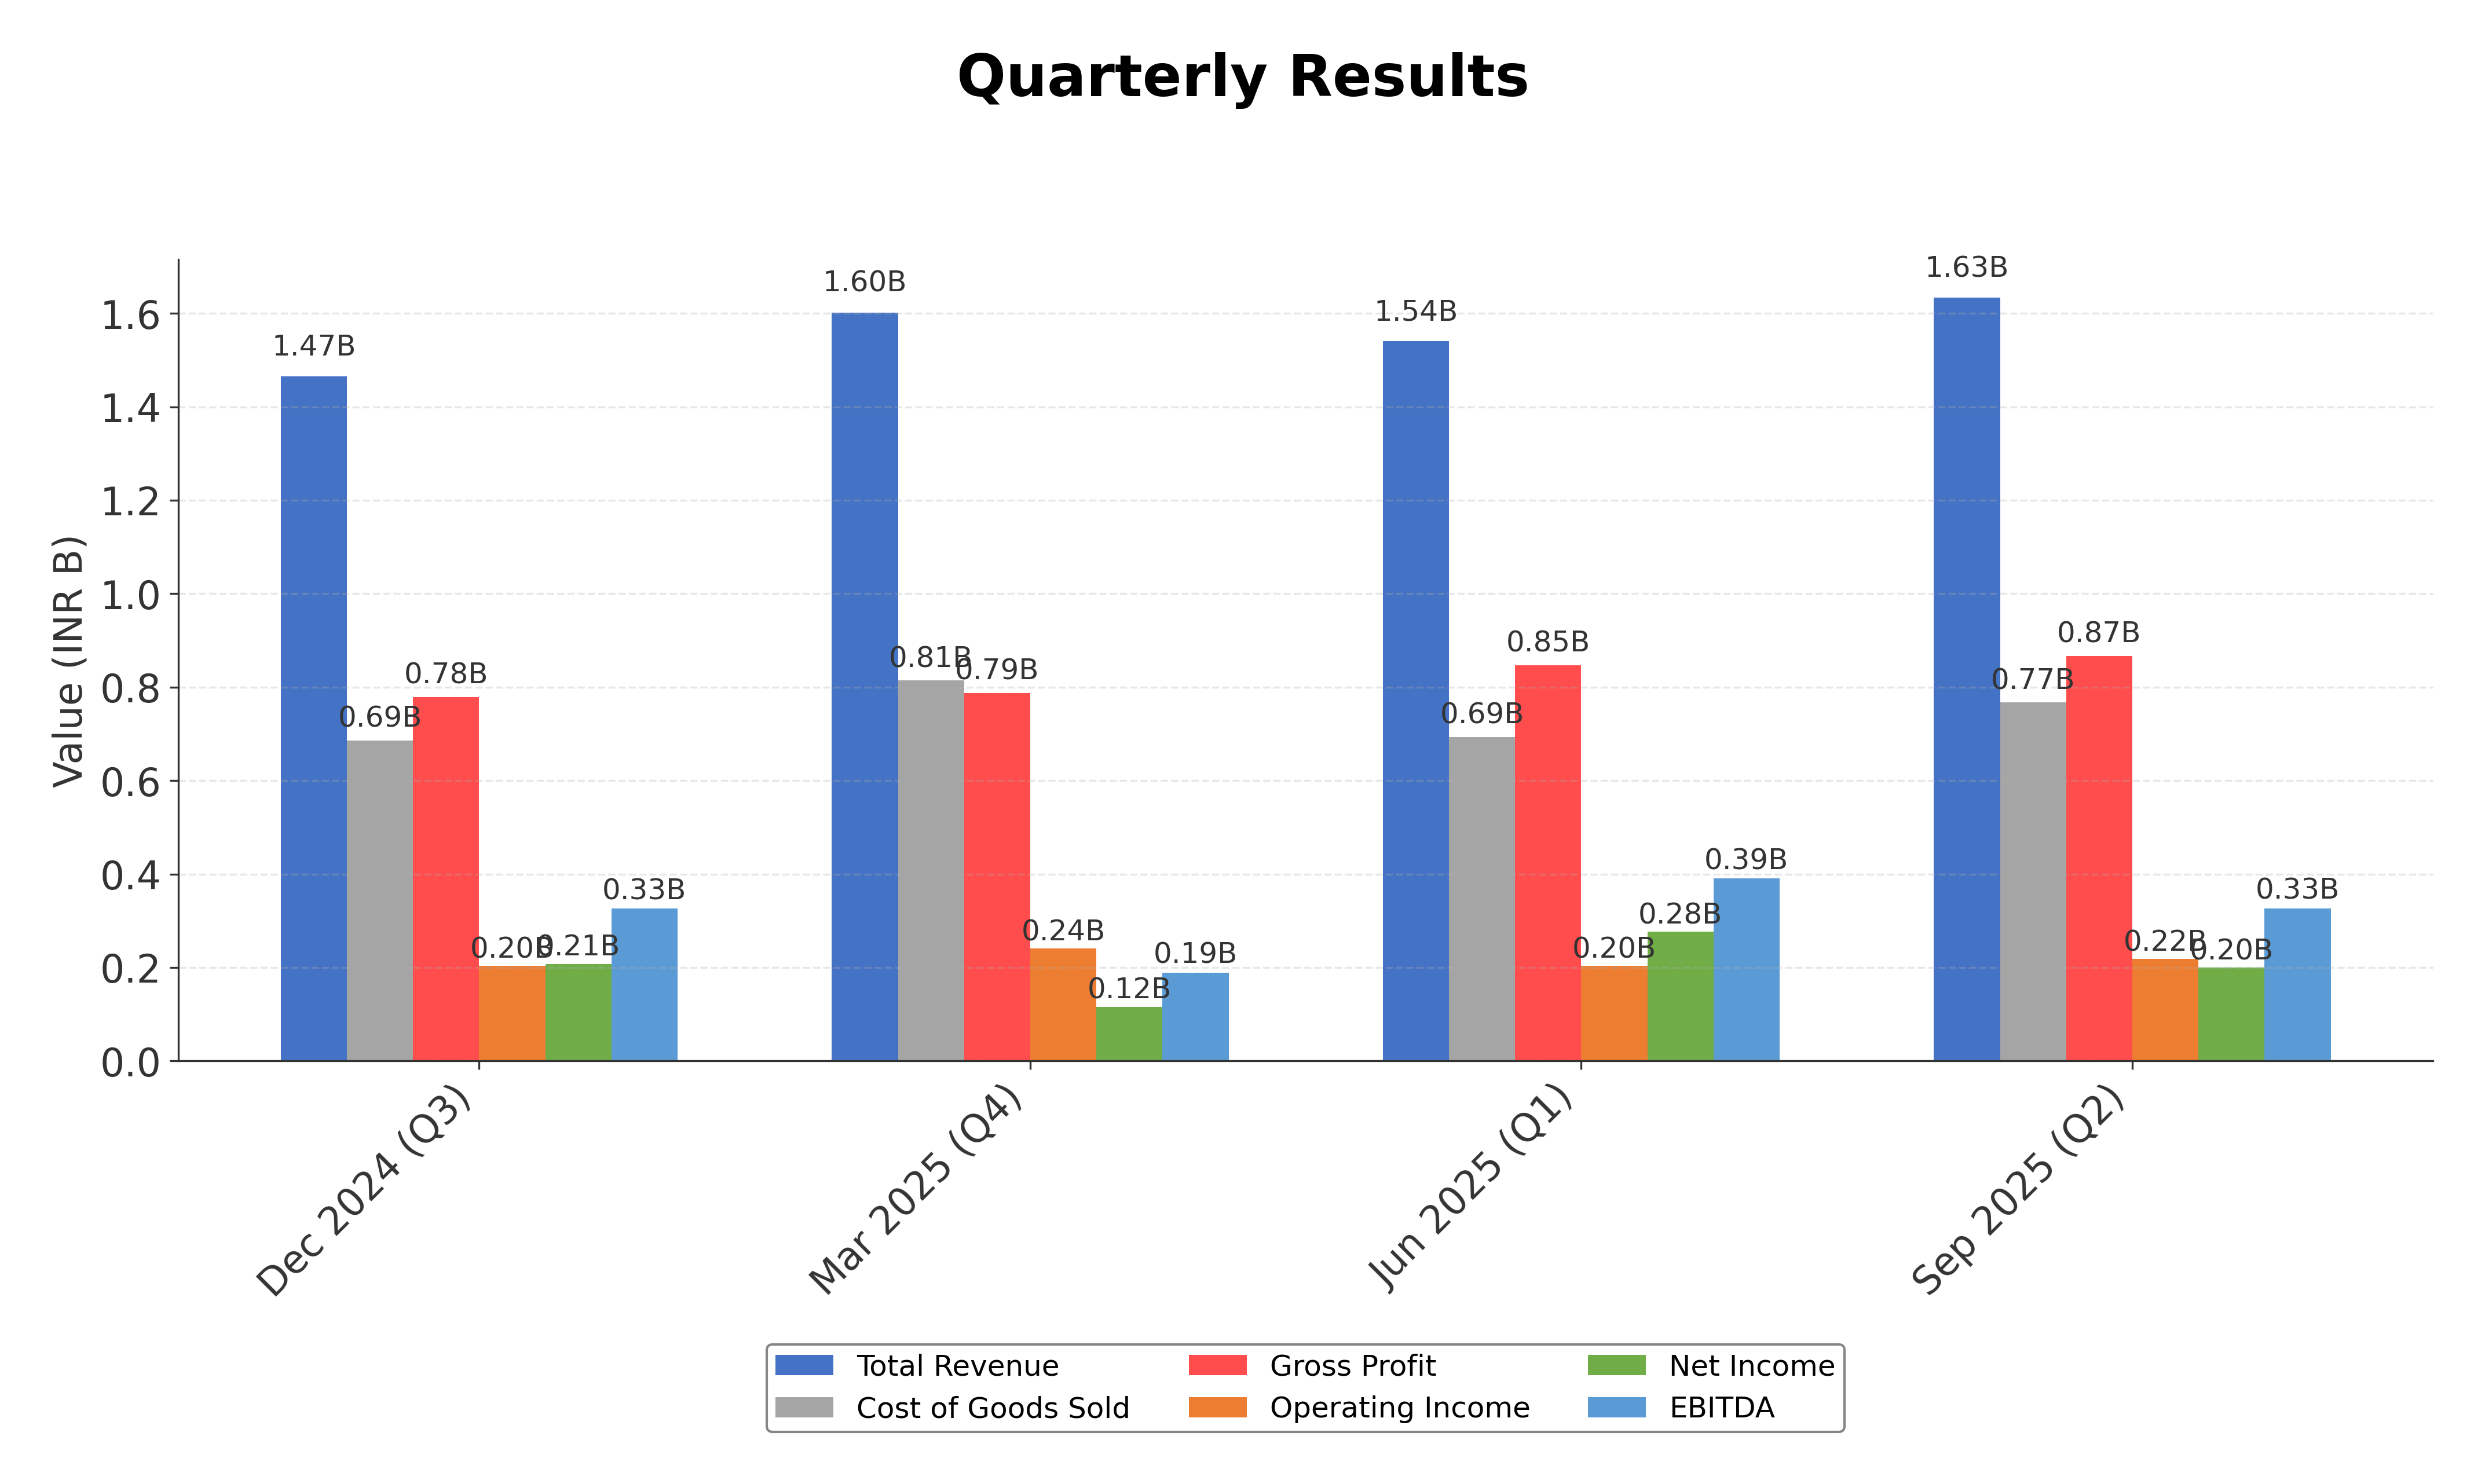
- Quarterly revenue growth of 13.5% and earnings growth of 37.7% demonstrate robust operational performance.
Cons
- Operational margin pressures noted, with operating margin at 11.95%, potentially impacting profitability.
- Limited institutional ownership at approximately 1.04% may reflect cautious market sentiment.
- Recent technical momentum shows a shift to mildly bearish, suggesting potential short-term volatility.
Disclosure: This information is for general awareness and does not constitute investment advice
Report Summary
Lincoln Pharmaceuticals Ltd. operates within the pharmaceutical sector, specializing in the development, manufacturing, and distribution of a broad range of medicinal products including antibiotics, antimalarials, and dietary supplements. Positioned as a key player in India, the company serves both domestic and international markets across Asia, Africa, and Europe, focusing on generic and branded formulations that address diverse healthcare needs.
Financially, Lincoln Pharmaceuticals reports a market capitalization of approximately â¹12.62 billion with a trailing P/E ratio of 15.32, aligning closely with its industry average. The company demonstrates solid profitability with a net income of â¹878 million and a profit margin of 13.47%. Its balance sheet reveals strong liquidity, evidenced by a current ratio of 4.71 and minimal debt levels, while cash flows remain robust with operating cash flow near â¹968 million and free cash flow around â¹823 million.
Technically, the stock shows a recent shift in momentum from sideways to mildly bearish, with price action currently above the 50-day moving average but below the 200-day average, suggesting mixed signals. Recent strategic initiatives include targeting â¹1,000 crore in revenue within three years, supported by a focus on exports. Strengths include strong cash reserves and low leverage, while risks involve operational margin pressures and valuation shifts reflecting evolving market perceptions.
In comparison to regional peers such as Piramal Pharma, Abbott India, and J.B. Chemicals, Lincoln Pharmaceuticals maintains a more moderate valuation profile with a lower P/E and EV/EBITDA ratio, indicating relatively conservative pricing. However, its return on equity at 12.26% is competitive within the specialty and generic drug manufacturing segment. Peers generally exhibit higher market capitalizations and more elevated valuation multiples, reflecting differing scales and growth expectations.
Lincoln Pharmaceuticals navigates a competitive pharmaceutical landscape marked by rapid innovation and regulatory complexity. Recent achievements include notable profit growth and strategic revenue targets, while ongoing challenges encompass operational efficiency and market valuation adjustments. The company stands at a pivotal juncture where execution of growth strategies and market dynamics will significantly influence its future trajectory. Given the current financial and technical data, a balanced approach emphasizing monitoring of performance and market conditions may be appropriate for those assessing the stock.
Company and Industry Overview
Company Basics
Price Performance
Company Size
Shareholding Pattern
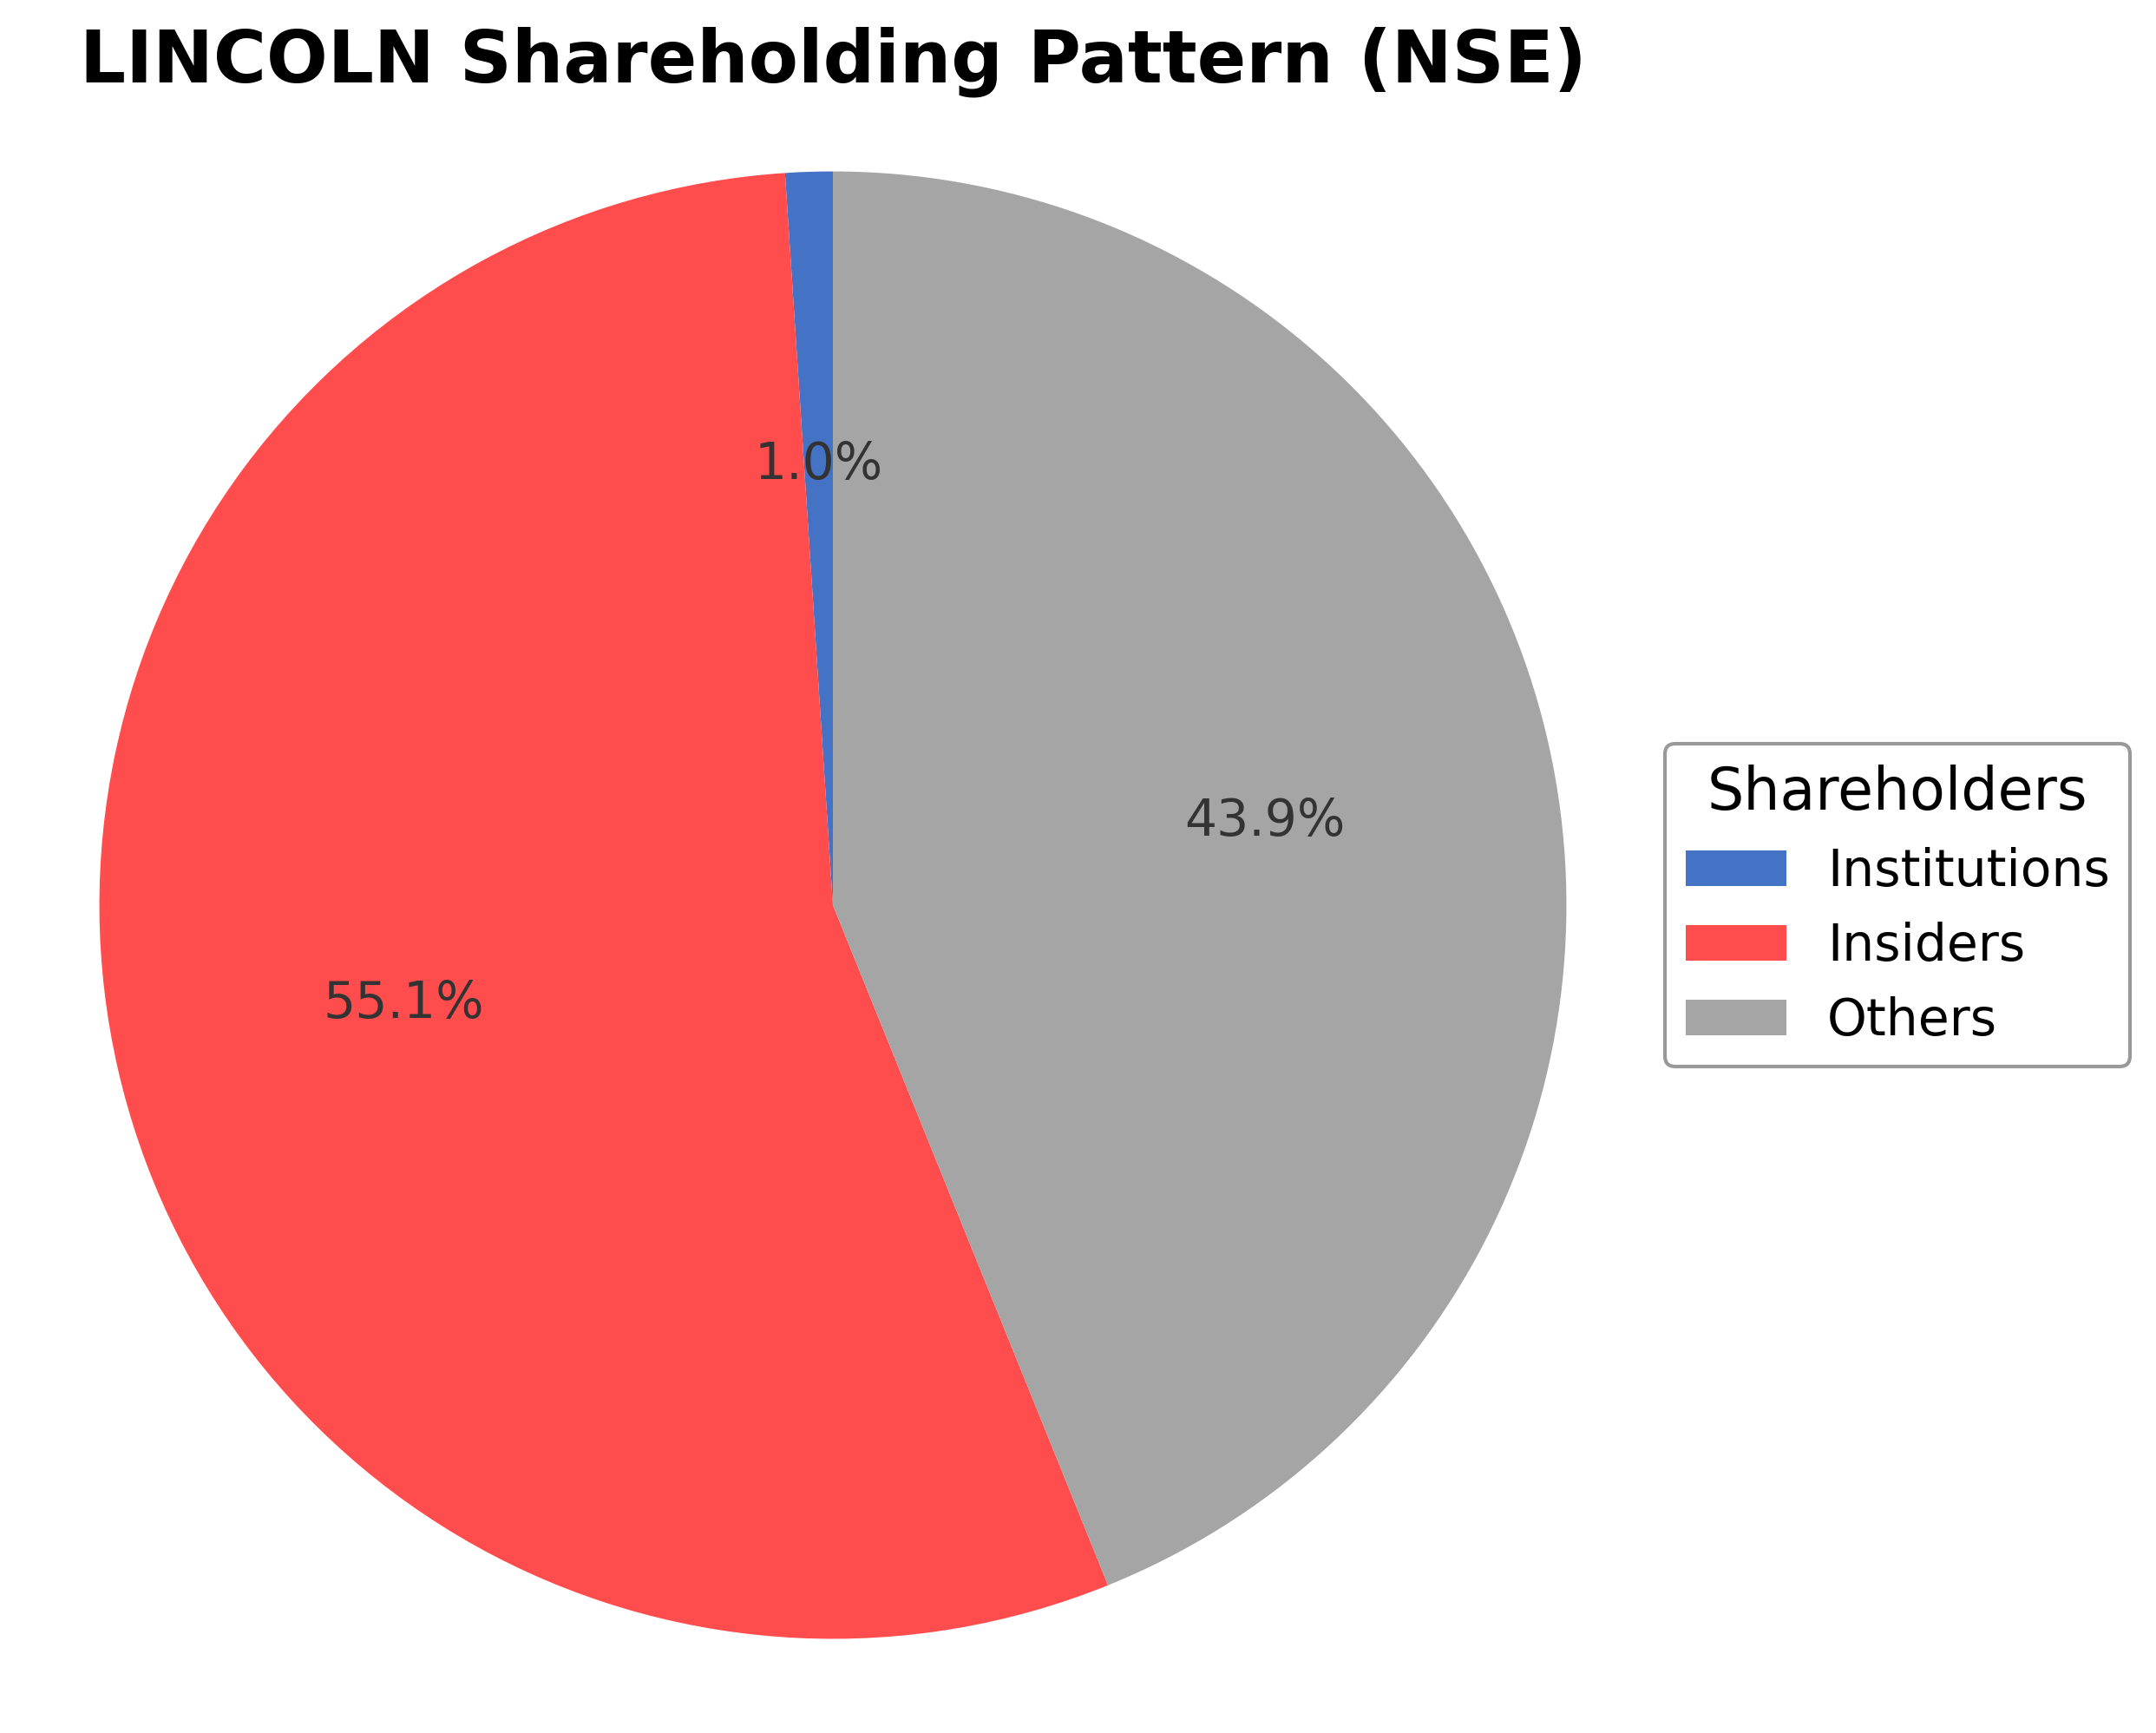
The shareholding structure of Lincoln Pharmaceuticals Ltd. is predominantly held by insiders, including executives and board members, who own approximately 55.08% of the shares. Institutional investors hold a minor stake of about 1.04%, while the remaining 43.88% is held by public shareholders including retail investors and employee stock plans. Over the past 12-24 months, insider ownership has remained relatively stable, with no significant shifts reported. Institutional accumulation appears limited, reflecting a cautious stance among major funds. This ownership distribution suggests strong promoter control, which may influence governance and strategic decisions, while the modest institutional presence indicates a market sentiment that is neutral to moderately cautious. The current structure supports continuity in corporate direction but warrants observation for any future changes in institutional engagement.
Sector and Industry Analysis
Sector and Industry Analysis: Pharmaceuticals and Specialty Chemicals (Context: Lincoln Pharmaceuticals Ltd.)
1. Sector Overview: Lincoln Pharmaceuticals operates within the pharmaceuticals and specialty chemicals sector, a critical component of the global healthcare industry. The pharmaceutical sector is characterized by a substantial and growing market size, driven by rising healthcare expenditures, aging populations, and increasing prevalence of chronic diseases worldwide. Globally, the pharmaceutical market is valued in the trillions of USD and is expected to grow at a compound annual growth rate (CAGR) of approximately 6-8% over the next five years. Key players in this sector range from large multinational corporations with diversified portfolios (e.g., Pfizer, Novartis, Sun Pharma) to mid-sized and specialty firms like Lincoln Pharmaceuticals that focus on niche therapeutic segments or generic formulations. The Indian pharmaceutical industry, where Lincoln is based, is among the largest globally by volume and is a significant exporter of generic medicines.
2. Industry Trends: The pharmaceutical industry is undergoing rapid transformation driven by technological advancements such as biotechnology, personalized medicine, and digital health integration. There is a growing emphasis on biosimilars and complex generics, which offer opportunities for companies with strong R&D capabilities and manufacturing expertise. Consumer behavior is shifting towards increased demand for affordable, high-quality generic drugs, especially in emerging markets. Additionally, the COVID-19 pandemic has accelerated innovation in vaccine development and telemedicine, creating new avenues for growth. Specialty chemicals, often used as intermediates or active pharmaceutical ingredients (APIs), are also evolving with increased focus on green chemistry and sustainable manufacturing processes, reflecting broader environmental concerns.
3. Regulatory Landscape: The pharmaceutical sector is highly regulated globally, with stringent compliance requirements imposed by agencies such as the US FDA, EMA in Europe, and CDSCO in India. Regulatory frameworks govern drug approval, manufacturing standards (cGMP), pricing controls, and post-market surveillance to ensure safety and efficacy. In India, policies such as the Drug Price Control Order (DPCO) impact pricing strategies, while the government promotes domestic manufacturing under initiatives like "Make in India." Intellectual property rights and patent laws significantly influence innovation and market exclusivity. Compliance with evolving regulations on data integrity, pharmacovigilance, and environmental standards is critical for maintaining market access and reputation.
4. Competitive Dynamics: The pharmaceutical industry exhibits a mixed market structure with high fragmentation in generics and specialty segments, alongside oligopolistic tendencies in patented drugs. Barriers to entry include high capital expenditure for manufacturing facilities, regulatory approvals, and the need for robust R&D pipelines. Established players benefit from economies of scale, extensive distribution networks, and brand recognition. Companies like Lincoln Pharmaceuticals compete by focusing on niche therapeutic areas, cost-effective production, and strategic partnerships. The competitive landscape is also shaped by consolidation trends, with mergers and acquisitions enabling portfolio diversification and geographic expansion. Innovation, regulatory compliance, and supply chain resilience are key determinants of competitive positioning in this sector.
Note: Analysis synthesized from industry research, market reports, and regulatory filings. Information is subject to change based on market conditions.
Illustrative Scenario Analysis
DCF Assumptions:
Method: Two-Stage EPS-Priority Model
Financials
Peer Analysis
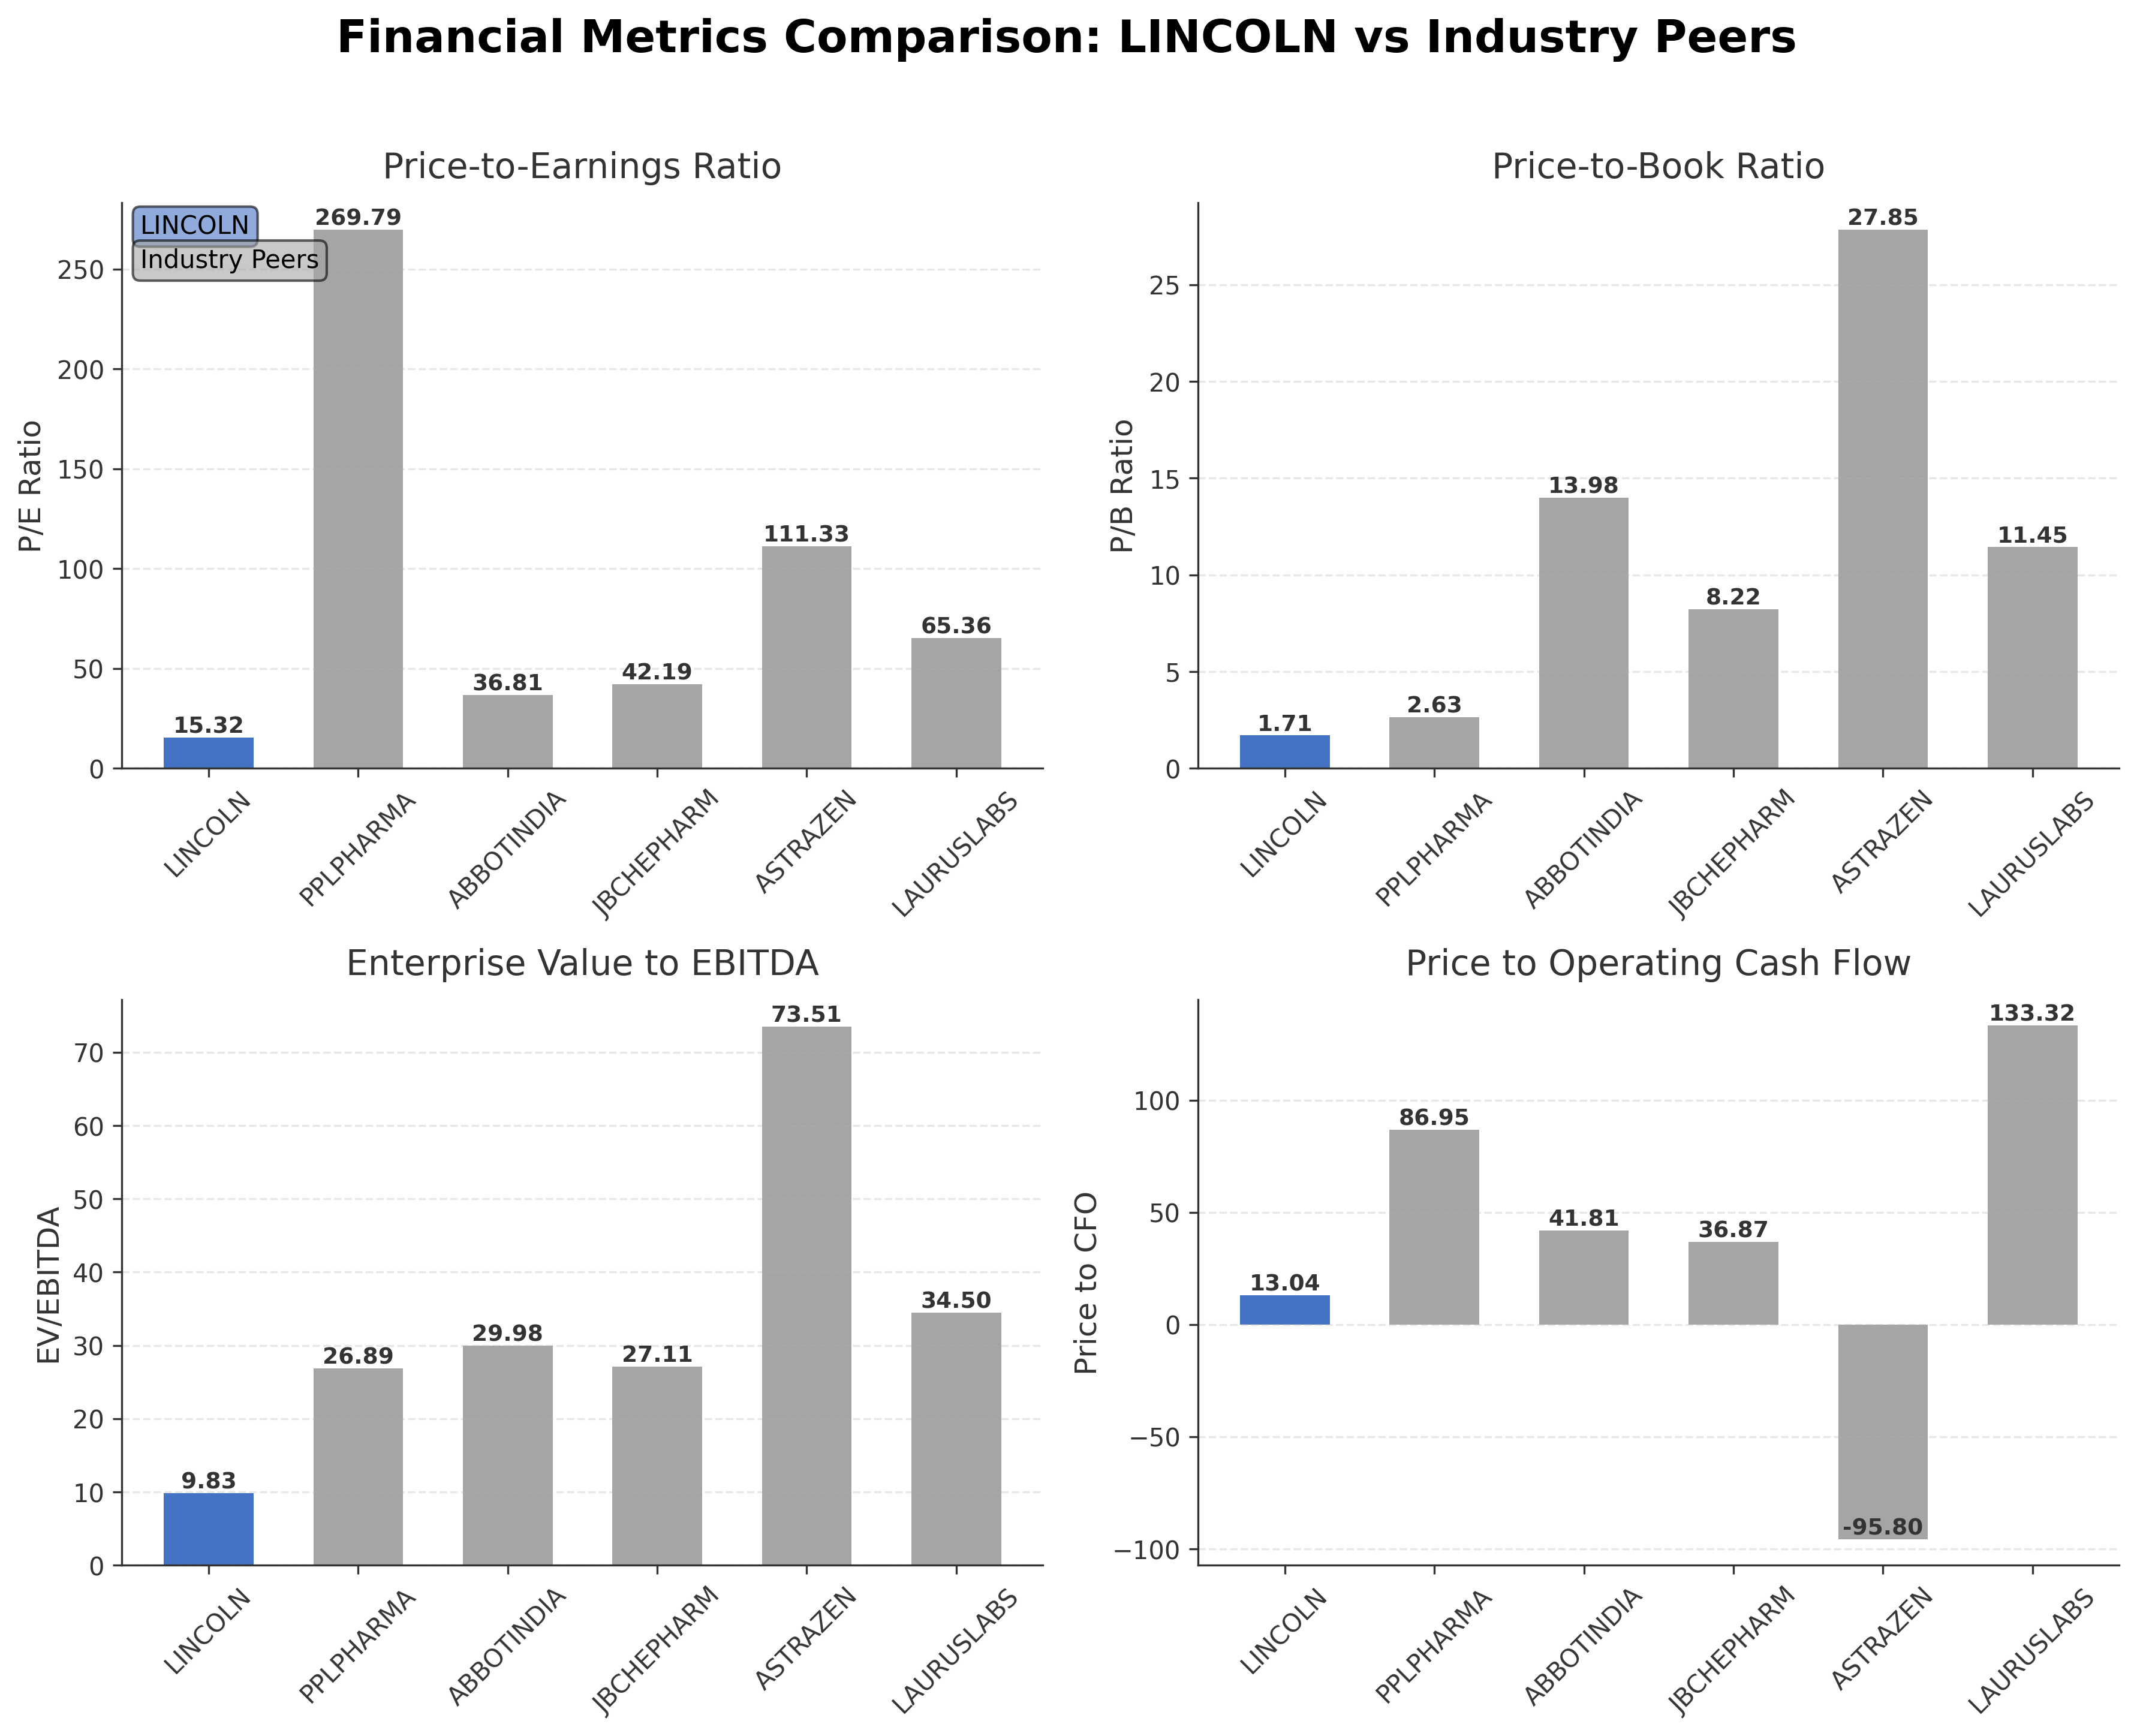
| Company Name | Market Cap | P/E Ratio | P/B Ratio | EV/EBITDA | Price to CFO |
|---|---|---|---|---|---|
| Lincoln Pharmaceuticals Ltd. | ₹12.62B | 15.32 | 1.71 | 9.83 | 13.04 |
| Piramal Pharma Ltd. | ₹212.55B | 269.79 | 2.63 | 26.89 | 86.95 |
| Abbott India Ltd. | ₹558.75B | 36.81 | 13.98 | 29.98 | 41.81 |
| J.B. Chemicals & Pharmaceuticals Ltd. | ₹321.22B | 42.19 | 8.22 | 27.11 | 36.87 |
| AstraZeneca Pharma India Ltd. | ₹222.24B | 111.33 | 27.85 | 73.51 | -95.80 |
| Laurus Labs Ltd. | ₹550.21B | 65.36 | 11.45 | 34.50 | 133.32 |
Comparison Analysis: Lincoln Pharmaceuticals Ltd. exhibits a notably lower valuation profile compared to its larger regional peers, with a trailing P/E ratio of 15.32 and EV/EBITDA of 9.83, which are significantly below the sector averages reflected by companies like Piramal Pharma and Abbott India. The company’s price-to-book ratio of 1.71 also suggests more conservative pricing relative to peers with higher multiples. Return on equity at 12.26% is comparatively strong within this group, indicating efficient capital use. However, peers generally possess larger market capitalizations and higher valuation multiples, reflecting their scale and growth expectations. Lincoln’s metrics position it as a more moderately valued entity within the Indian specialty and generic pharmaceutical industry.
Financial Metrics Comparison with Peers
Financial Statements
Comprehensive financial data including income, balance sheet, and cash flow metrics
Income Statement
| fiscal_date | 2025-03-31 | 2024-03-31 | 2023-03-31 | 2022-03-31 | 2021-03-31 |
|---|---|---|---|---|---|
| Sales | 6.15B | 5.71B | 5.05B | 4.68B | 4.15B |
| Cost Of Goods | 2.93B | 2.80B | 2.43B | 2.20B | 1.99B |
| Gross Profit | 3.23B | 2.91B | 2.62B | 2.48B | 2.16B |
| Operating Expense Selling General And Administrative | 528.94M | 412.53M | 379.50M | 354.44M | 349.11M |
| Operating Expense Other Operating Expenses | 436.23M | 399.62M | 345.34M | 295.71M | 298.26M |
| Operating Income | 892.05M | 896.22M | 806.75M | 883.99M | 798.01M |
| Non Operating Interest Income | 72.20M | 70.23M | 61.71M | 50.28M | 22.37M |
| Non Operating Interest Expense | 9.96M | 9.46M | 16.38M | 9.20M | 12.02M |
| Pretax Income | 1.09B | 1.22B | 1.00B | 959.39M | 837.21M |
| Income Tax | 268.42M | 289.38M | 275.81M | 265.84M | 214.71M |
| Net Income | 823.46M | 933.05M | 728.99M | 693.55M | 622.50M |
| Eps Basic | 41.11 | 46.58 | 36.40 | 34.63 | 31.08 |
| Eps Diluted | 41.11 | 46.58 | 36.40 | 34.63 | 31.08 |
| Basic Shares Outstanding | 20.03M | 20.03M | 20.03M | 20.03M | 20.03M |
| Diluted Shares Outstanding | 20.03M | 20.03M | 20.03M | 20.03M | 20.03M |
| Ebit | 1.10B | 1.23B | 1.02B | 968.59M | 849.23M |
| Ebitda | 1.17B | 1.11B | 1.07B | 1.02B | 896.93M |
| Net Income Continuous Operations | 1.09B | 1.22B | 1.00B | 959.39M | 837.21M |
| Preferred Stock Dividends | 0.00 | 0.00 | 0.00 | 0.00 | 0.00 |
| Minority Interests | N/A | N/A | N/A | N/A | -261.00K |
Source: Financial statements and regulatory filings
Balance Sheet
| fiscal_date | 2025-03-31 | 2024-03-31 | 2023-03-31 | 2022-03-31 | 2021-03-31 |
|---|---|---|---|---|---|
| Cash And Cash Equivalents | 134.14M | 57.47M | 50.52M | 69.34M | 114.38M |
| Accounts Receivable | 1.66B | 1.62B | 1.36B | 1.16B | 1.13B |
| Total Assets | 7.97B | 7.00B | 5.87B | 5.34B | 4.52B |
| Total Liabilities | 1.25B | 1.07B | 849.46M | 1.01B | 859.67M |
| Long Term Debt | N/A | N/A | N/A | 0.00 | 1.45M |
| Shareholders Equity | 6.72B | 5.93B | 5.02B | 4.33B | 3.66B |
Source: Financial statements and regulatory filings
Cash Flow Statement
| fiscal_date | 2025-03-31 | 2024-03-31 | 2023-03-31 | 2022-03-31 | 2021-03-31 |
|---|---|---|---|---|---|
| Operating Activities Net Income | 1.09B | 1.22B | 1.00B | 959.39M | 837.21M |
| Operating Activities Other Non Cash Items | -53.37M | -55.58M | -41.41M | -35.77M | 1.32M |
| Operating Activities Accounts Receivable | -47.79M | -260.86M | -202.12M | -31.19M | -100.83M |
| Operating Activities Other Assets Liabilities | -22.85M | -112.74M | 83.80M | -97.20M | 49.91M |
| Operating Activities Operating Cash Flow | 967.87M | 793.25M | 845.07M | 795.23M | 787.62M |
| Investing Activities Capital Expenditures | -189.07M | -393.86M | -135.53M | -454.46M | -86.85M |
| Investing Activities Net Intangibles | -2.15M | -1.37M | -232.00K | N/A | N/A |
| Investing Activities Purchase Of Investments | -851.37M | -996.31M | -631.87M | -530.47M | -545.03M |
| Investing Activities Sale Of Investments | 564.54M | 748.26M | 738.01M | 405.18M | 105.04M |
| Investing Activities Other Investing Activity | -12.54M | 215.52M | -150.20M | -107.56M | -4.44M |
| Investing Activities Investing Cash Flow | -488.44M | -426.39M | -179.59M | -687.31M | -530.78M |
| Financing Activities Long Term Debt Payments | -694.17M | -209.02M | -195.02M | -5.20M | -45.54M |
| Financing Activities Short Term Debt Issuance | -9.97M | -9.02M | -1.44M | 20.00M | -38.33M |
| Financing Activities Common Dividends | -36.05M | -30.05M | -30.05M | -30.00M | N/A |
| Financing Activities Financing Cash Flow | -740.20M | -248.08M | -226.51M | -15.20M | -83.88M |
| End Cash Position | 134.14M | 57.47M | 50.52M | 69.34M | 114.38M |
| Free Cash Flow | 737.71M | 236.04M | 249.80M | 306.07M | 605.19M |
| Investing Activities Net Acquisitions | N/A | N/A | N/A | 0.00 | 500.00K |
| Financing Activities Long Term Debt Issuance | N/A | N/A | N/A | N/A | N/A |
Source: Financial statements and regulatory filings
Technical Analysis
Key Insights
- The current trend shows a transition from sideways to mildly bearish momentum, with price action exhibiting some volatility around key moving averages.
- Key support levels are identified near ₹600, while resistance is observed around the 52-week high of ₹677.
- The stock price is trading above the 50-day moving average (~₹503) but below the 200-day moving average (~₹534), indicating mixed medium-term signals.
- Momentum indicators show RSI in a neutral range, MACD reflecting weakening bullish momentum, and stochastic oscillators suggesting potential short-term consolidation.
- Analysis across daily, weekly, and monthly timeframes reveals short-term caution with longer-term charts maintaining a neutral to slightly positive bias.
- Potential market scenarios include consolidation near current levels with possible testing of support, while a sustained move above resistance could signal renewed upward momentum.
Trending News
1. Headline: Ligand Reports Fourth Quarter and Full Year 2025 Financial Results - BioSpace
Summary: JUPITER, Fla., Feb. 26, 2026 (GLOBE NEWSWIRE) -- Ligand Pharmaceuticals Incorporated (Nasdaq: LGND) today reported financial results for the three and twelve months ended December 31, 2025, and provided an operating forecast and business update. Ligand management will host a conference call ...
Sentiment: neutral
2. Headline: Why is Lincoln Pharmaceuticals Ltd falling/rising?
Summary: On 25-Feb, Lincoln Pharmaceuticals Ltd witnessed a decline in its share price, falling by 0.82% to close at ₹611.55. This marks the continuation of a short-term downward trend despite the stock's strong longer-term performance relative to the benchmark Sensex.
Sentiment: negative
3. Headline: Lincoln Pharmaceuticals Ltd is Rated Sell
Summary: Lincoln Pharmaceuticals Ltd is rated 'Sell' by MarketsMOJO, with this rating last updated on 07 August 2025. However, the analysis and financial metrics discussed here reflect the stock's current position as of 25 February 2026, providing investors with an up-to-date perspective on the company’s ...
Sentiment: neutral
4. Headline: GlaxoSmithKline Pharma: Quiet India Move, Big Signal for US Portfolios?
Summary: GSK’s India-listed pharma arm is flying under the radar, even as the global parent reshapes its vaccine and specialty-drug pipeline. Here is why this secondary play could matter more to US investors than its low profile suggests.
Sentiment: positive
5. Headline: Lincoln Pharmaceuticals Ltd Technical Momentum Shifts Amid Mixed Indicator Signals
Summary: Lincoln Pharmaceuticals Ltd has experienced a notable shift in its technical momentum, transitioning from a sideways trend to a mildly bearish stance. Despite some bullish indicators on weekly charts, monthly signals suggest caution, reflecting a complex technical landscape for investors to ...
Sentiment: positive
6. Headline: Lincoln Pharma Q3 FY26 Profit Surges 38% to ₹28.6 Cr; Revenue Up 13.5%
Summary: Lincoln Pharmaceuticals operates within India's highly competitive pharmaceutical sector. Its peers include large-cap companies like Sun Pharmaceutical Industries Ltd. and Divi's Laboratories Ltd., known for their extensive product portfolios and strong global presence.
Sentiment: positive
7. Headline: Lincoln Pharmaceuticals Ltd: Valuation Shifts Signal Changing Price Attractiveness
Summary: Lincoln Pharmaceuticals Ltd has witnessed a notable shift in its valuation parameters, moving from an attractive to a fair valuation grade, reflecting evolving market perceptions and sector dynamics. This article analyses the recent changes in key valuation metrics such as price-to-earnings ...
Sentiment: positive
Summary: Lincoln Pharmaceuticals Limited ( NSE:LINCOLN ) shares have had a really impressive month, gaining 29% after a shaky...
Sentiment: positive
9. Headline: Lincoln Pharmaceuticals Q3 FY26: Profit Surge Masks Operational Margin Concerns
Summary: Lincoln Pharmaceuticals Ltd., an Ahmedabad-based pharmaceutical formulations manufacturer, reported a striking 139.24% quarter-on-quarter surge in net profit to ₹27.68 crores for Q1 FY26 (April-June 2025), though the impressive headline figure conceals underlying operational challenges that ...
Sentiment: positive
Summary: Lincoln Pharmaceuticals Ltdhas informed BSE that the meeting of the Board of Directors of the Company is scheduled on 12/02/2026 ,inter alia....
Sentiment: neutral
Recent Updates
News Summary
Recent news coverage of Lincoln Pharmaceuticals Ltd. highlights a shift in technical momentum with mixed indicator signals, reflecting a transition from mildly bearish to sideways trends. The company has set ambitious revenue targets aiming for ₹1,000 crore within three years, underscoring growth aspirations. Share price performance has been notable with a 29% increase over the past month, although operational margin concerns persist amid profit surges. These developments occur within a competitive Indian pharmaceutical landscape, where export focus and strategic initiatives are key themes. Overall, the news cycle emphasizes both growth potential and cautionary signals in market dynamics.
News Sentiment
Sentiment across recent news is predominantly positive with nuanced caution. Positive coverage centers on profit growth, revenue targets, and technical momentum shifts, while neutral and negative sentiments reflect valuation concerns and short-term price volatility. The mixed sentiment suggests a balanced market perception, with optimism tempered by operational and technical complexities.
Analytical Overview
Analysis Summary
Valuation Metrics: Lincoln Pharmaceuticals' trailing P/E ratio of 15.32 aligns closely with the industry average, indicating a valuation consistent with sector norms. Absence of forward P/E data limits projection-based valuation insights.
Growth Trajectory: The company exhibits a positive revenue growth rate of 13.5% quarterly and a strong quarterly earnings growth of 37.7%, supported by robust operating and free cash flows, signaling a healthy growth trajectory.
Financial Health: With a very low debt-to-equity ratio of 0.009 and a high current ratio of 4.71, Lincoln Pharmaceuticals demonstrates strong financial health and liquidity, supported by substantial cash reserves exceeding ₹2.3 billion.
Sector Specific Factors: The Indian pharmaceutical sector presents opportunities through expanding export markets and increasing healthcare demand, while challenges include regulatory compliance and competitive pressures. Lincoln’s export focus aligns with these sector dynamics.
Market Positioning And Competitive Advantages: Lincoln Pharmaceuticals benefits from a diversified product portfolio and strong promoter ownership, positioning it well within the specialty and generic drug market in India and select international regions.
Investment Conclusion
Supporting Factors: Consistent revenue and earnings growth with a 13.5% quarterly revenue increase and 37.7% earnings growth.
Risk Factors: Operational margin pressures noted in recent quarters.
SWOT Analysis
Strengths
- Strong promoter ownership ensuring strategic continuity.
- Robust liquidity with a high current ratio and low debt levels.
- Consistent revenue and earnings growth supported by diversified product portfolio.
- Competitive valuation metrics relative to industry peers.
Weaknesses
- Operational margins show signs of pressure in recent quarters.
- Limited institutional investor participation may constrain broader market support.
- Negative PEG ratio indicating challenges in growth valuation alignment.
- Relatively small market capitalization compared to major peers.
Opportunities
- Expansion into export markets aligned with sector growth trends.
- Increasing healthcare demand in emerging markets.
- Potential for strategic partnerships or acquisitions to enhance product offerings.
- Growing focus on specialty and generic pharmaceutical segments.
Threats
- Regulatory changes and compliance risks in domestic and international markets.
- Intense competition from larger pharmaceutical companies.
- Market valuation shifts reflecting changing investor sentiment.
- Operational risks impacting profit margins and cash flow stability.
Company Description
Lincoln Pharmaceuticals Ltd. is a prominent company in the pharmaceutical sector, specializing in the development, manufacturing, and distribution of a diverse range of medicinal products. With a strong focus on innovation and quality, Lincoln Pharmaceuticals Ltd. delivers a portfolio that includes antibiotics, antimalarials, cough and cold formulations, gastroenterologicals, and various dietary supplements, serving a broad spectrum of healthcare needs. The company plays a crucial role in the healthcare industry, providing both generic and branded formulations that cater to dynamic patient requirements. Established in India, Lincoln Pharmaceuticals Ltd. has expanded its reach internationally, penetrating markets across Asia, Africa, and Europe. In the financial market, the company is recognized for its consistent growth and strategic expansions, driven by a commitment to research and compliance with international standards. As a key player in the pharmaceutical landscape, Lincoln Pharmaceuticals Ltd. continues to impact global health trends and contribute to enhanced patient care through its extensive product offerings.