

Laser Power & Infra Limited (LASERPOWER)
Stock Analysis Report
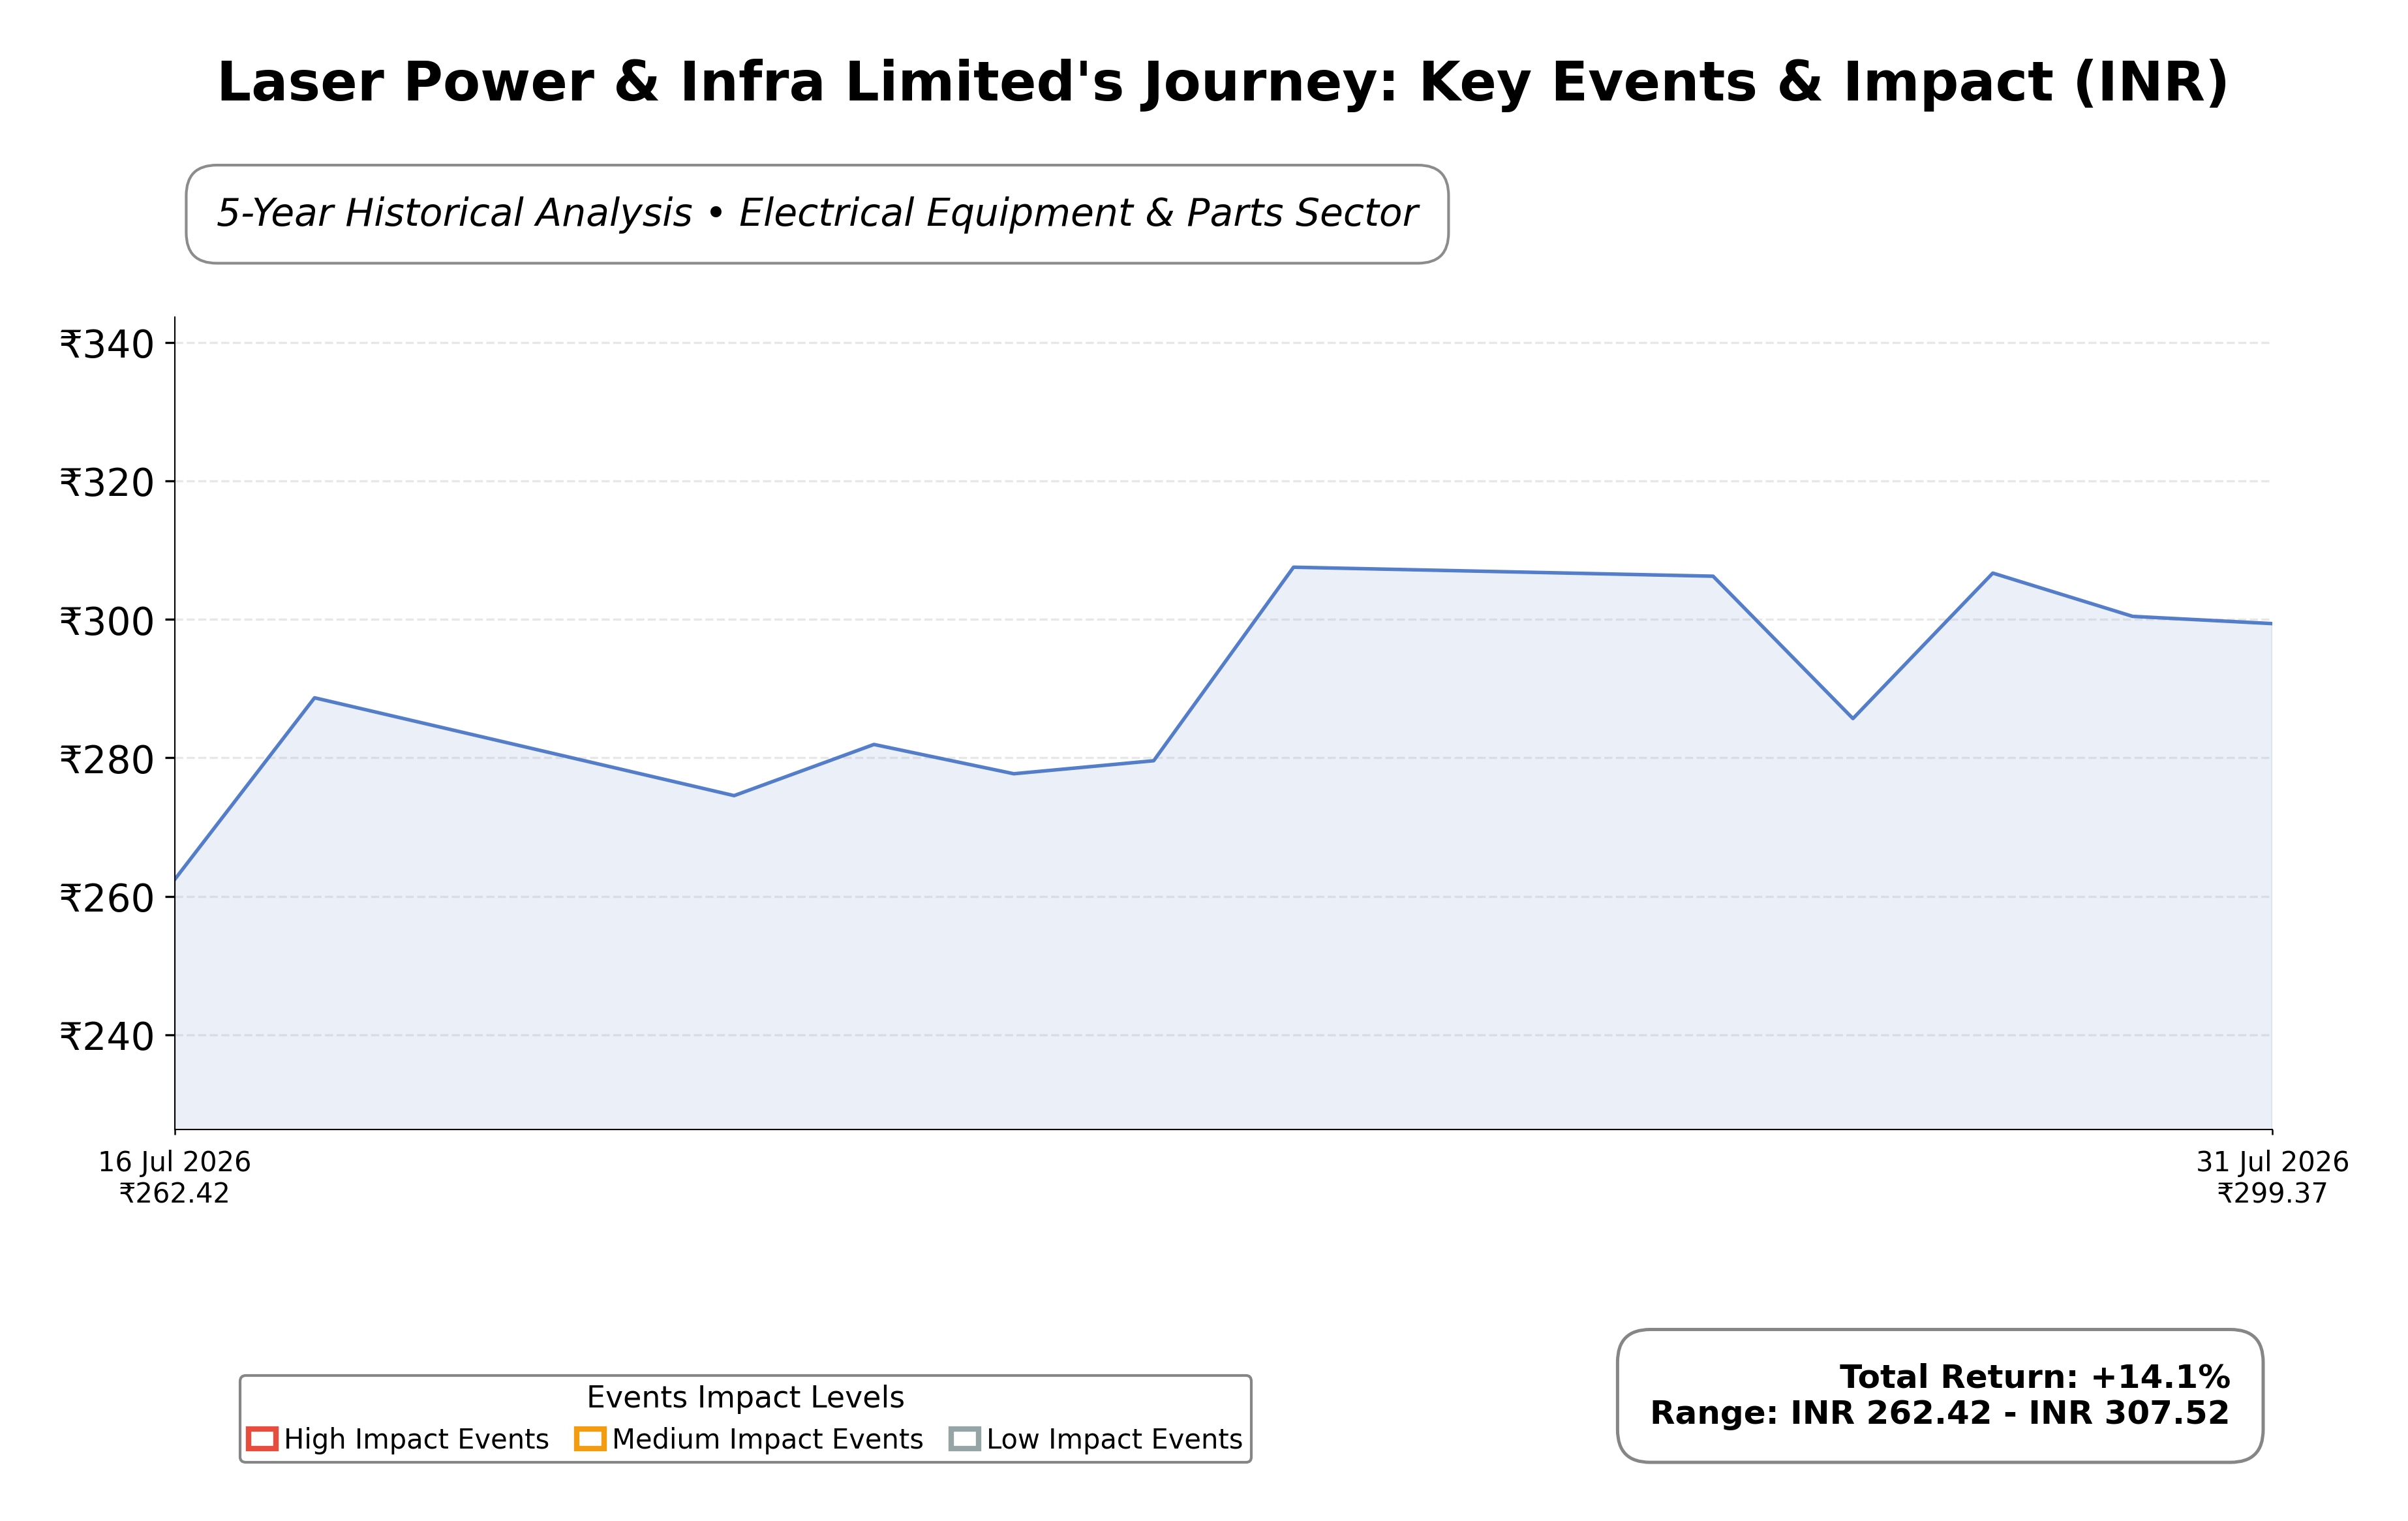
Stock Journey
Key Positives and Key Risks
Pros
- Strong return on equity at 20.62% demonstrates effective equity utilization and profitability.
- Successful IPO raising ₹742 crore with a 17% premium listing indicates robust market confidence.
- Current ratio of 1.31 reflects adequate short-term liquidity and financial stability.
Cons
- Negative operating cash flow of ₹-119 crore TTM suggests operational cash generation challenges.
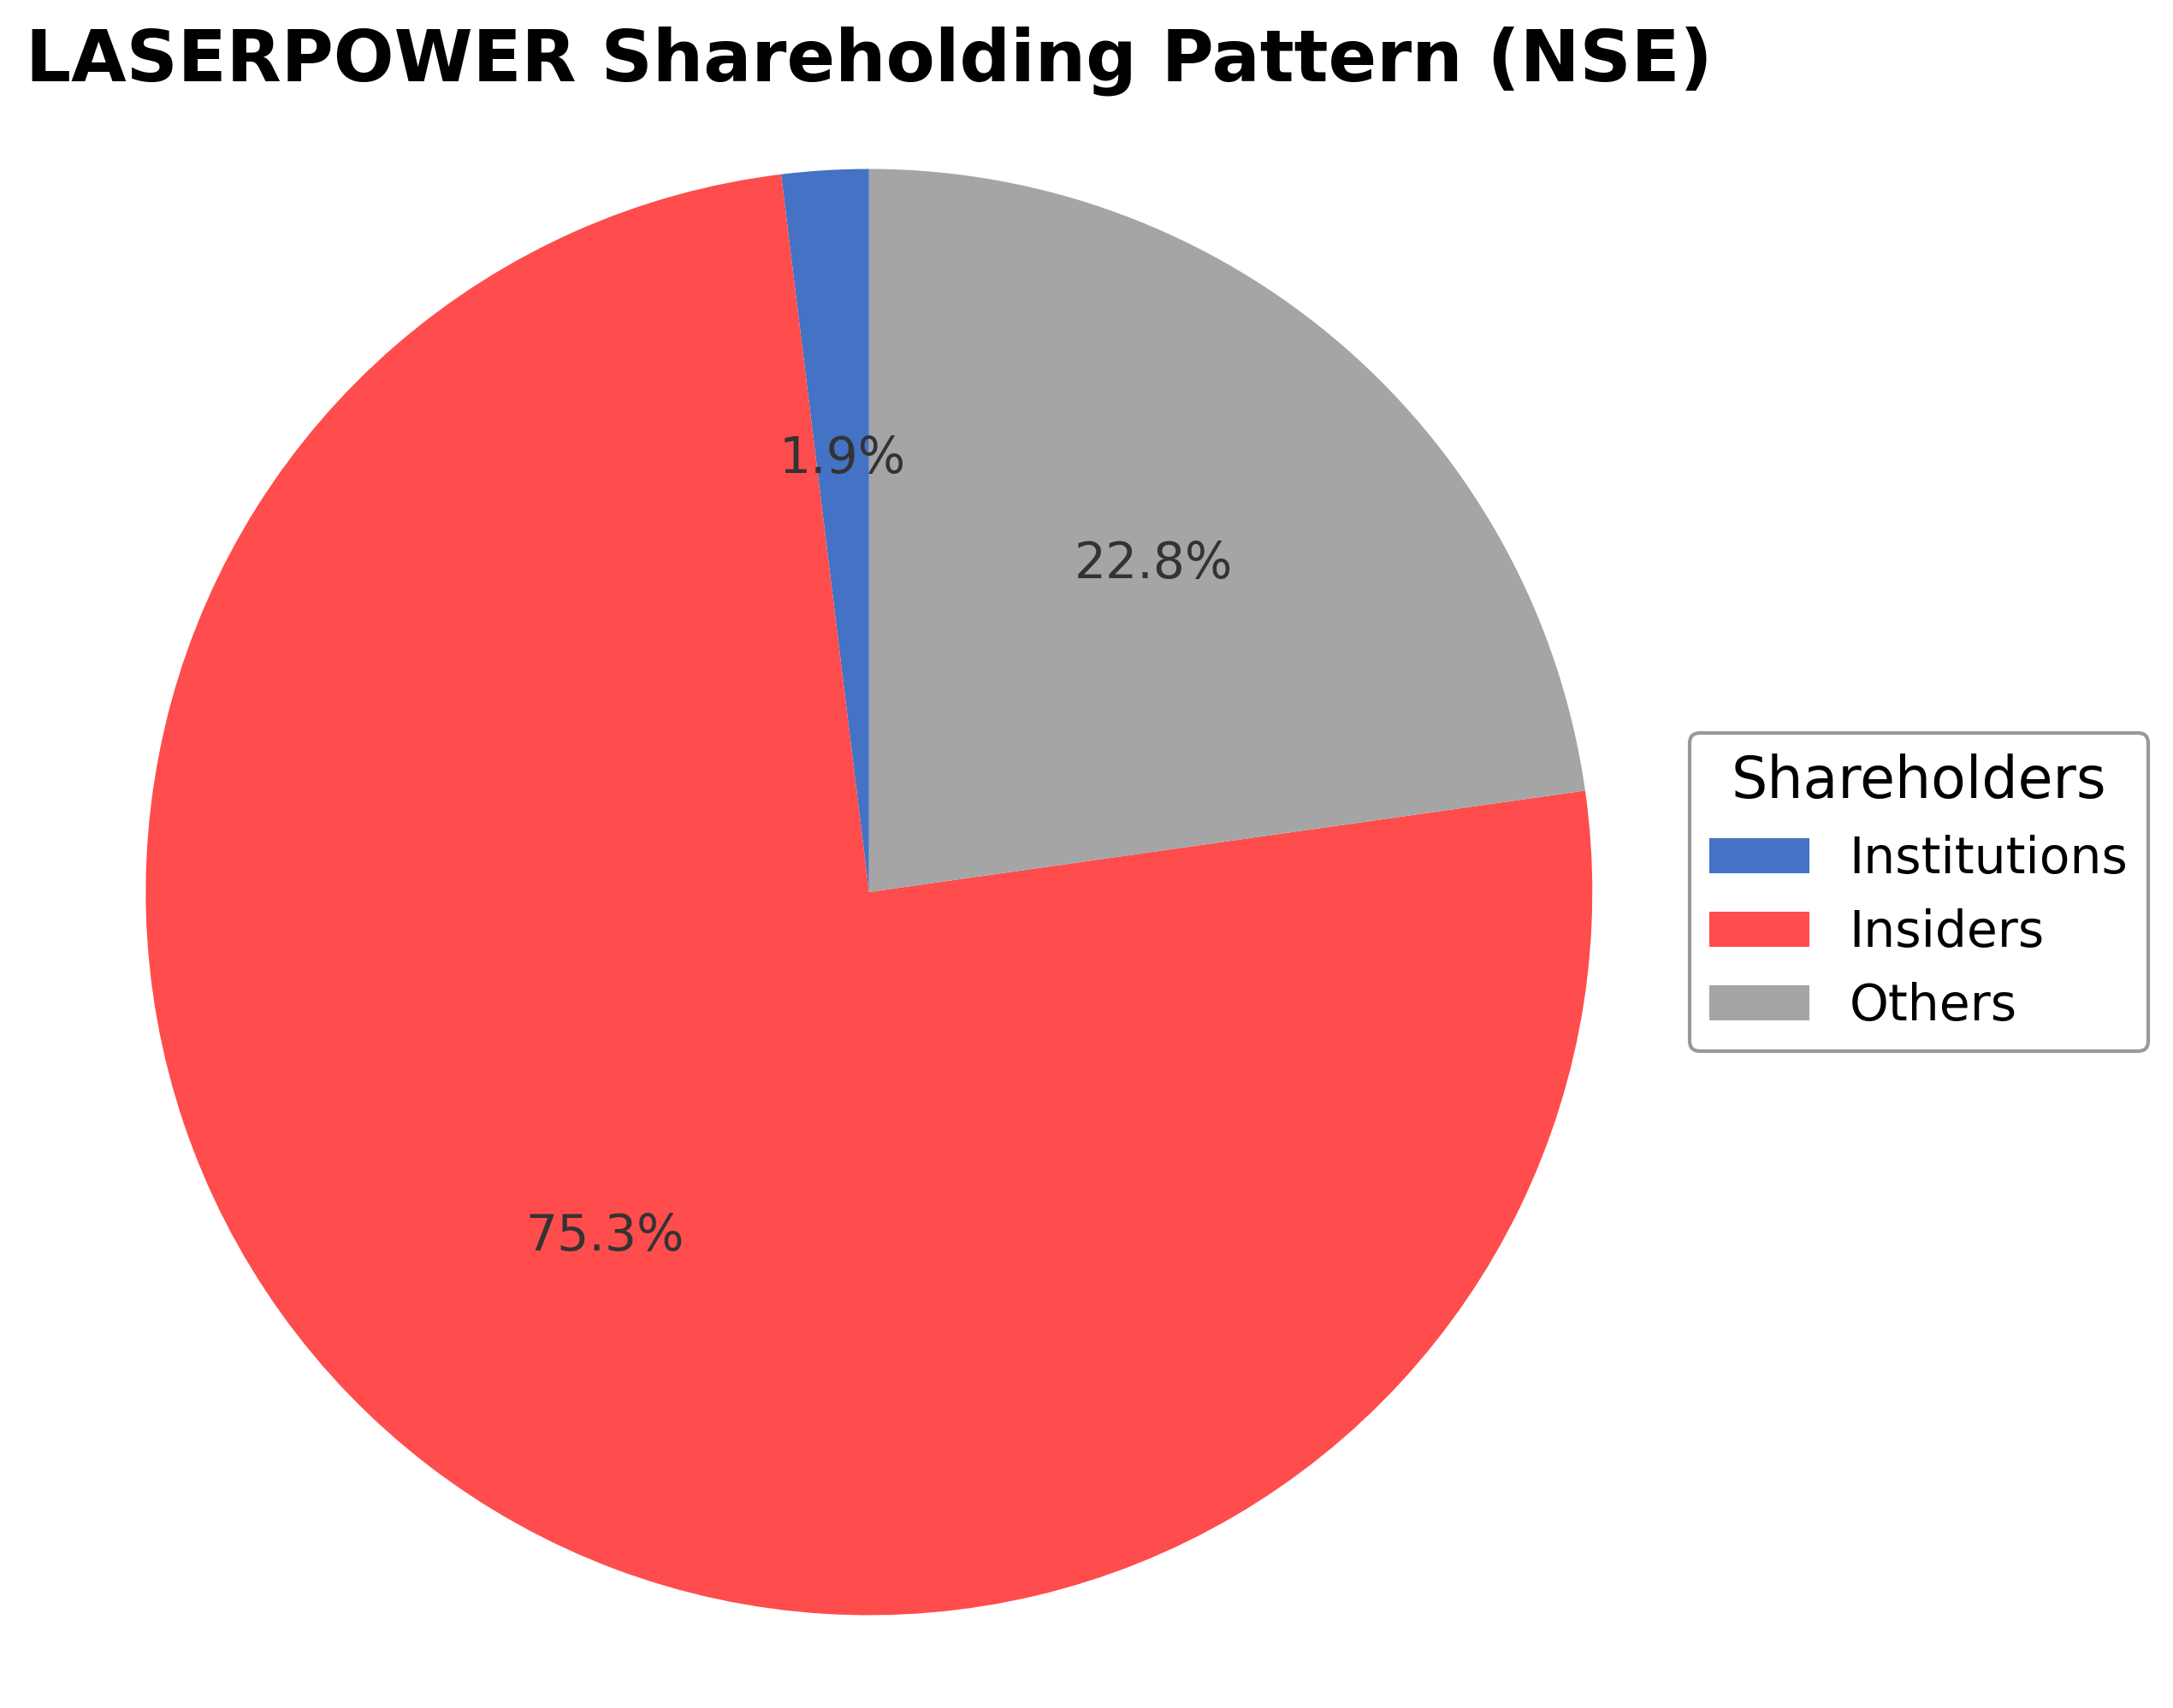
- Limited institutional ownership at 1.94% may constrain broader market support and liquidity.
- High price-to-book ratio of 4.75 compared to peers indicates potentially elevated valuation.
Disclosure: This information is for general awareness and does not constitute investment advice
Report Summary
Laser Power & Infra Limited is a Kolkata-headquartered Indian company operating primarily in the power infrastructure sector, specifically focusing on power transmission and distribution. Listed on the NSE under the Industrials sector, the company engages in manufacturing power cables, conductors, and related components, alongside an Engineering, Procurement, and Construction (EPC) division that executes turnkey power distribution projects. Its integrated manufacturing facilities and R&D capabilities position it as a significant player in India’s power infrastructure value chain, serving both domestic and select international markets.
Financially, Laser Power & Infra reported trailing twelve months (TTM) revenue of approximately ₹2,305.88 crore with a net profit margin of 6.52%, operating margin of 11.7%, return on equity (ROE) of 20.62%, and return on assets (ROA) of 6.94%. The company’s EBITDA stood at ₹296.92 crore, indicating solid operational efficiency. These metrics reflect moderate profitability and effective asset utilization, supported by a current ratio of 1.31, indicating reasonable short-term liquidity.
Valuation metrics show a trailing price-to-earnings (P/E) ratio of 27.69, price-to-book (P/B) ratio of 4.75, and enterprise value to EBITDA (EV/EBITDA) of 16.99. With a market capitalization of approximately ₹4,202 crore and a 52-week price range between ₹250 and ₹317, the current price of ₹299.37 situates the stock near the higher end of its recent trading range. The valuation multiples are broadly in line with the industry average P/E of 27.69, suggesting the stock is priced fairly relative to its fundamentals.
Key strengths include a strong market position in Eastern India’s power cable manufacturing, a diversified business model combining manufacturing and EPC services, and a robust IPO subscription reflecting investor interest. Risks involve exposure to sector-specific regulatory changes, competitive pressures from larger peers, and operational challenges in scaling EPC projects. Recent strategic actions include a successful IPO raising ₹742 crore, listing at a premium, and expanding manufacturing capacity to 85,448 MT as of March 2026.
Technically, the stock trades near its 50-day and 200-day moving averages around ₹289, with momentum indicators showing mixed signals. The recent strong IPO debut and premium listing price indicate positive market sentiment, though trading volumes and price action warrant close observation. Overall, the data suggests a balanced environment where market participants may consider accumulation or monitoring for further developments without immediate urgency.
Company and Industry Overview
Company Basics
Price Performance
Company Size
Shareholding Pattern
Sector and Industry Analysis
The Indian infrastructure sector is experiencing robust growth driven by increased government capital expenditure aimed at modernizing energy and industrial frameworks. This sector encompasses power transmission, roads, urban infrastructure, and industrial services, with a market size expanding steadily due to rising demand for energy security and infrastructure upgrades. Key players include established engineering and construction firms specializing in power infrastructure projects, alongside emerging companies leveraging technical expertise to capture market share.
Industry trends highlight a focus on project execution efficiency, cost control, and diversification of service offerings to meet complex infrastructure demands. Competitive dynamics are shaped by high capital intensity and execution risks, creating significant barriers to entry for new firms. Companies with strong financial discipline and proven track records in delivering projects on time are better positioned to win contracts and manage large-scale borrowings, which remain a critical factor in sustaining operations.
The regulatory environment is characterized by government initiatives promoting infrastructure development and energy security, supported by policies facilitating capital inflows and debt restructuring. Compliance with environmental standards and timely project approvals are essential for operational continuity. Ongoing reforms aim to enhance transparency and reduce execution delays, positively impacting the sector’s growth trajectory and encouraging investment in infrastructure projects.
Note: Analysis synthesized from industry research, market reports, and regulatory filings. Information is subject to change based on market conditions.
Illustrative Scenario Analysis
DCF Assumptions:
Method: Two-Stage EPS-Priority Model
Peer Analysis
| Company Name | Market Cap | P/E Ratio | P/B Ratio | EV/EBITDA | Price to CFO |
|---|---|---|---|---|---|
| Laser Power & Infra Limited | ₹42.02B | 27.69 | 4.75 | 16.99 | -35.30 |
| Hindustan Electro Graphite Limited | ₹124.11B | 33.40 | 2.53 | 22.34 | 58.22 |
| Finolex Cables Ltd. | ₹152.77B | 20.94 | 2.46 | 20.84 | 311.27 |
| Apar Industries Ltd. | ₹557.98B | 57.17 | 10.34 | 29.84 | 57.67 |
| Amara Raja Energy & Mobility Ltd. | ₹166.64B | 18.59 | 2.06 | 11.57 | 14.90 |
| Polycab India Ltd. | ₹1.34T | 47.03 | 11.17 | 29.94 | 37.69 |
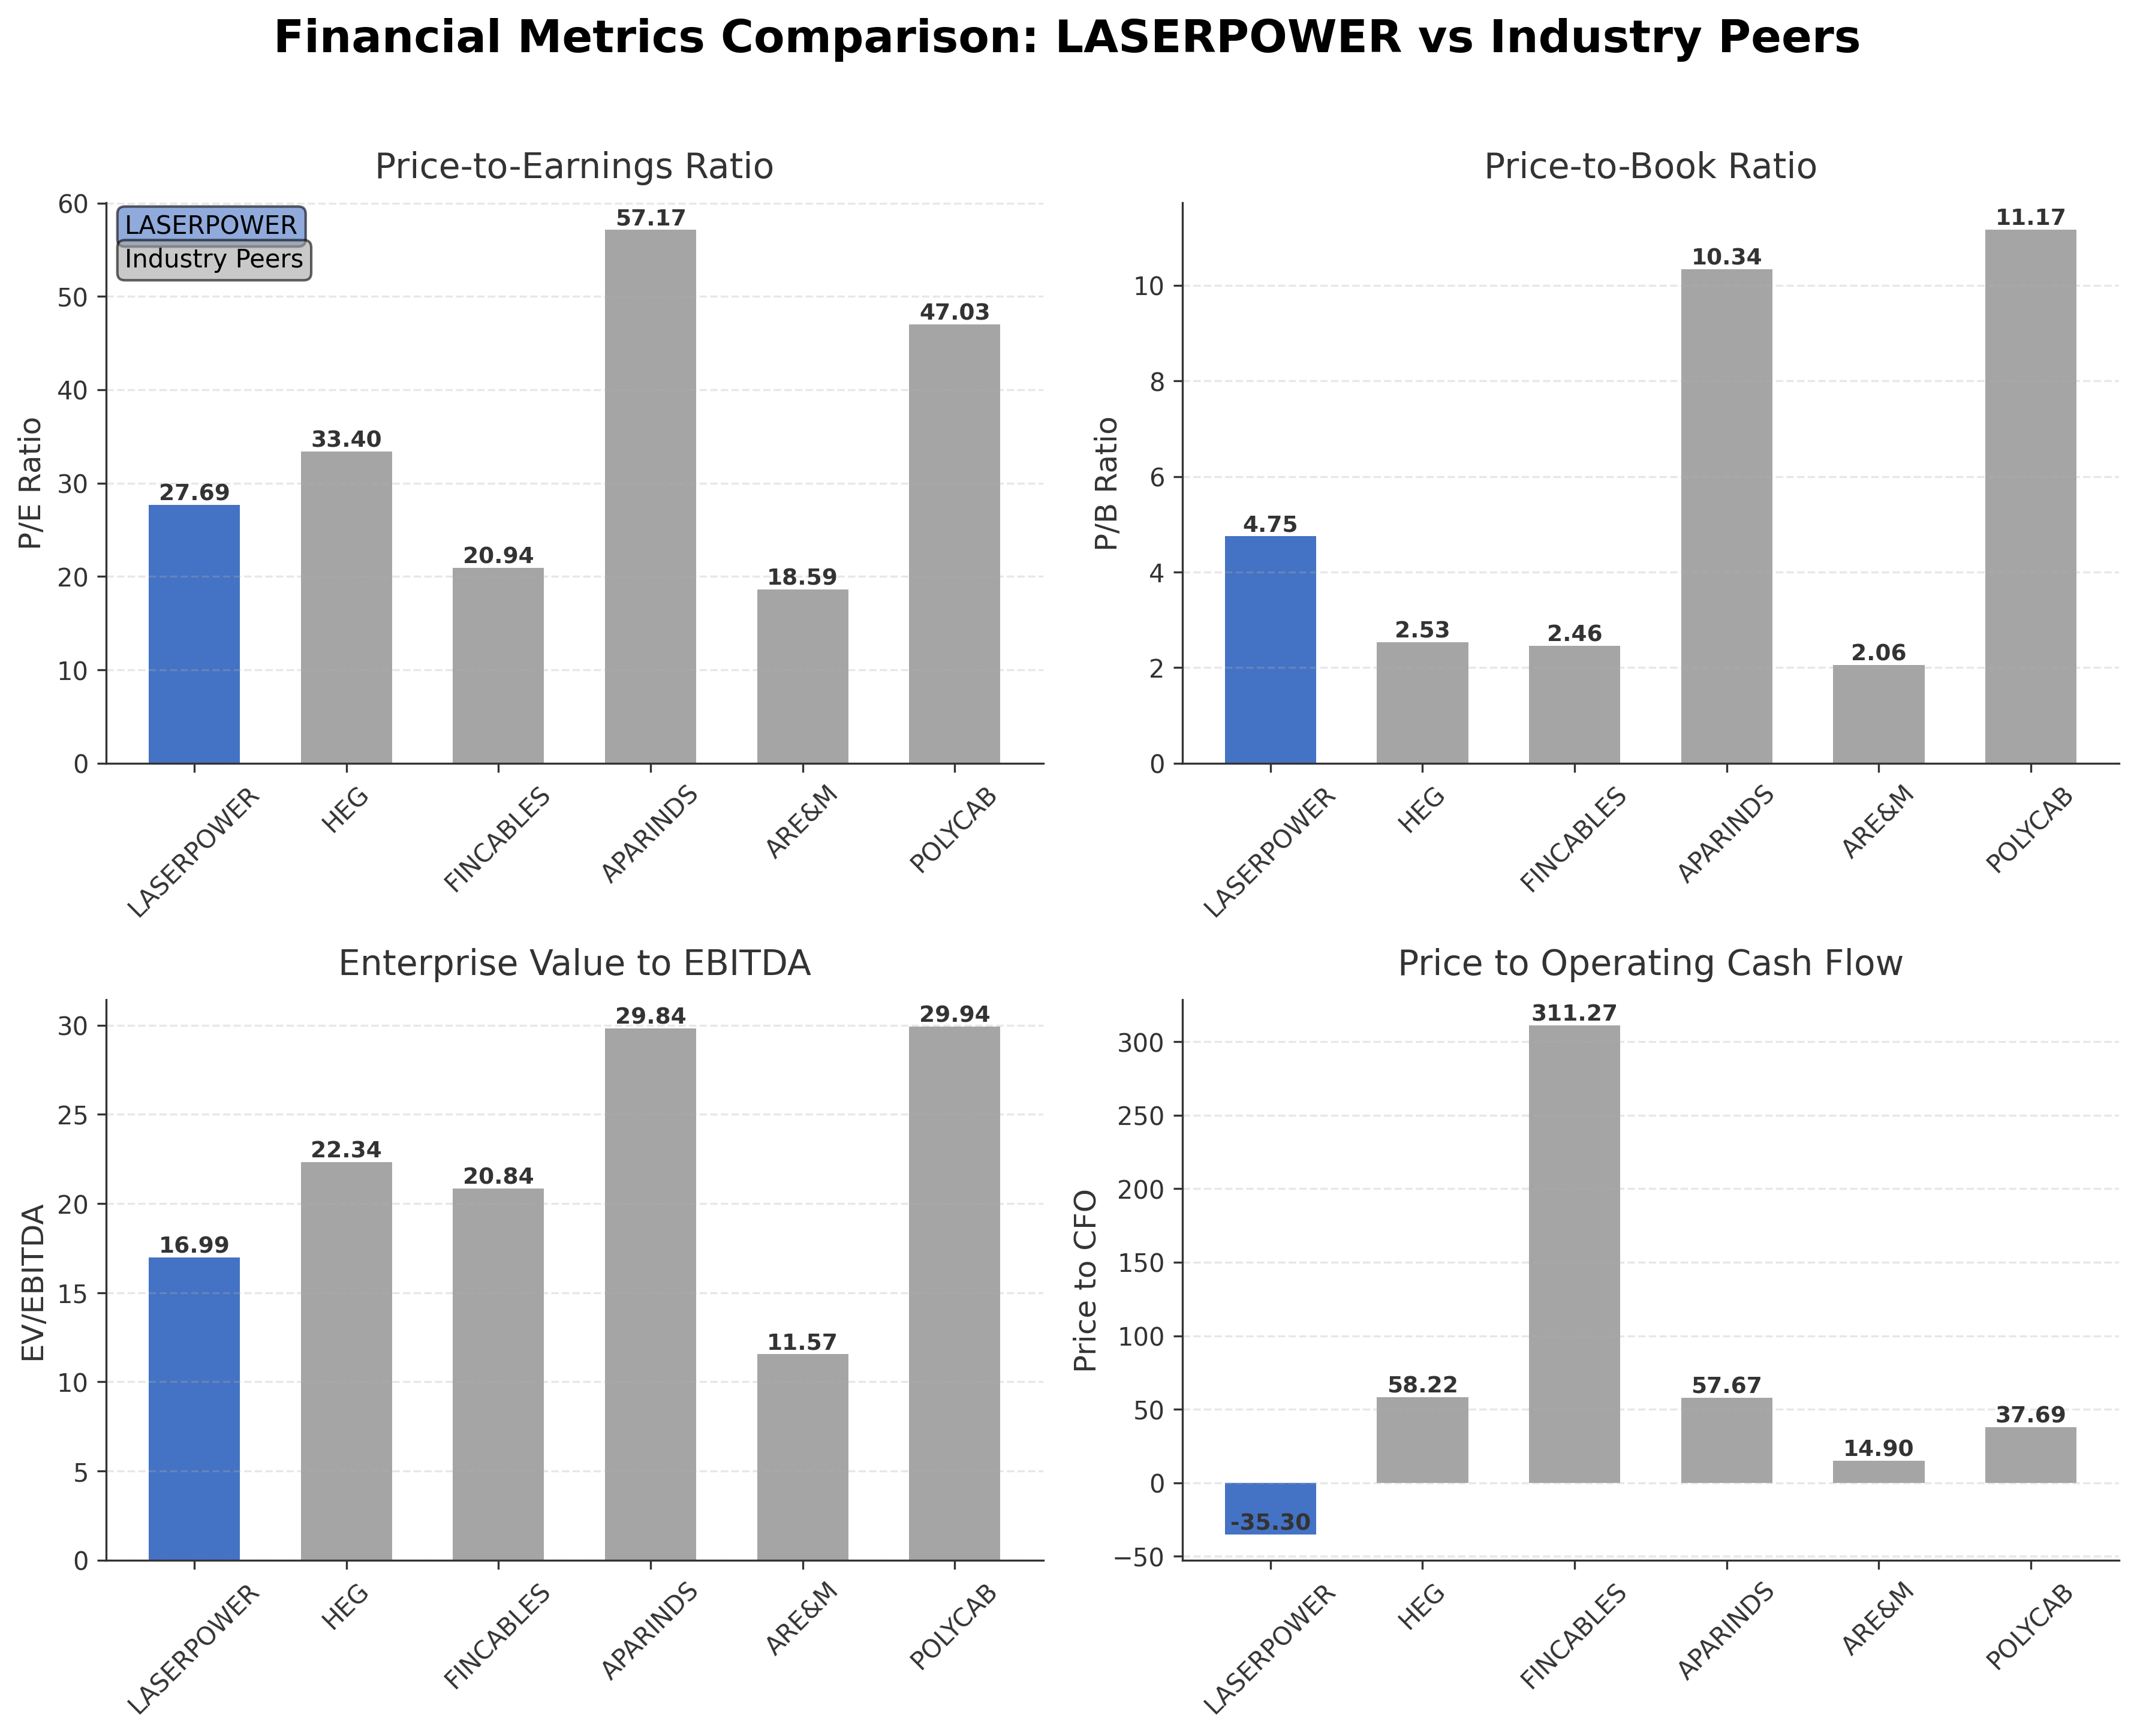
Comparison Analysis: Laser Power & Infra Limited exhibits a moderate market capitalization relative to its peers, with a P/E ratio of 27.69 that aligns closely with the industry average. Its P/B ratio of 4.75 is higher than several peers such as Hindustan Electro Graphite and Finolex Cables, indicating a relatively higher valuation on book value. The EV/EBITDA multiple of 16.99 positions it between higher-valued companies like Apar Industries and more value-oriented peers like Amara Raja Energy. Notably, Laser Power's return on equity of 20.62% is competitive, surpassing several peers, reflecting efficient equity utilization despite a negative price to CFO ratio. Overall, the company presents a balanced profile with strengths in profitability but some divergence in cash flow metrics compared to industry counterparts.
Financial Metrics Comparison with Peers
Financial Statements
Comprehensive financial data including income, balance sheet, and cash flow metrics
Income Statement
| fiscal_date | 2026-03-31 | 2025-03-31 | 2024-03-31 |
|---|---|---|---|
| Sales | 23.06B | 25.45B | 17.27B |
| Cost Of Goods | 18.04B | 20.71B | 13.80B |
| Gross Profit | 5.02B | 4.74B | 3.47B |
| Operating Expense Selling General And Administrative | 351.19M | 385.49M | 342.06M |
| Operating Expense Other Operating Expenses | 858.96M | 1.23B | 990.68M |
| Operating Income | 2.73B | 2.19B | 1.29B |
| Non Operating Interest Income | 157.21M | 120.95M | 93.33M |
| Non Operating Interest Expense | 1.08B | 913.09M | 757.09M |
| Pretax Income | 1.94B | 1.38B | 540.49M |
| Income Tax | 420.57M | 313.88M | 136.40M |
| Net Income | 1.52B | 1.07B | 404.09M |
| Ebit | 3.02B | 2.29B | 1.30B |
| Ebitda | 2.97B | 2.58B | 1.56B |
| Net Income Continuous Operations | 1.94B | 1.38B | 540.49M |
| Minority Interests | 0.00 | -31.91M | -4.84M |
| Preferred Stock Dividends | 0.00 | 0.00 | 0.00 |
| Eps Basic | N/A | 7.38 | 2.84 |
| Eps Diluted | N/A | 7.38 | 2.84 |
| Basic Shares Outstanding | N/A | 140.37M | 140.37M |
| Diluted Shares Outstanding | N/A | 140.37M | 140.37M |
Data provided by Twelve Data
Balance Sheet
| fiscal_date | 2026-03-31 | 2025-03-31 | 2024-03-31 |
|---|---|---|---|
| Cash And Cash Equivalents | 268.75M | 44.53M | 5.65M |
| Accounts Receivable | 13.75B | 11.20B | 7.87B |
| Total Assets | 26.32B | 22.70B | 19.87B |
| Total Liabilities | 19.07B | 15.26B | 13.47B |
| Long Term Debt | 1.50B | 1.21B | 788.40M |
| Shareholders Equity | 7.25B | 7.45B | 6.40B |
Data provided by Twelve Data
Cash Flow Statement
| fiscal_date | 2026-03-31 | 2025-03-31 | 2024-03-31 |
|---|---|---|---|
| Operating Activities Net Income | 1.94B | 1.38B | 540.49M |
| Operating Activities Other Non Cash Items | 845.11M | 889.55M | 817.33M |
| Operating Activities Accounts Receivable | -3.57B | -3.26B | -1.95B |
| Operating Activities Other Assets Liabilities | -949.22M | -327.44M | 671.29M |
| Operating Activities Operating Cash Flow | -1.19B | 603.39M | 1.71B |
| Investing Activities Capital Expenditures | 86.52M | -306.53M | 1.08M |
| Investing Activities Net Acquisitions | 0.00 | -40.00K | 0.00 |
| Investing Activities Purchase Of Investments | -411.97M | -227.65M | -402.16M |
| Investing Activities Sale Of Investments | 13.77M | 0.00 | 3.72M |
| Investing Activities Investing Cash Flow | -311.68M | -534.22M | -397.36M |
| Financing Activities Long Term Debt Issuance | 612.72M | 1.10B | 369.74M |
| Financing Activities Long Term Debt Payments | -620.15M | -620.70M | -410.84M |
| Financing Activities Short Term Debt Issuance | 3.52B | 613.24M | -107.38M |
| Financing Activities Common Dividends | -130.00K | -20.00K | N/A |
| Financing Activities Financing Cash Flow | 3.52B | 1.09B | -148.47M |
| End Cash Position | 268.75M | 44.53M | 5.65M |
| Free Cash Flow | -1.63B | 102.99M | 1.36B |
| Financing Activities Other Financing Charges | N/A | N/A | 10.00K |
Data provided by Twelve Data
Technical Analysis
Key Insights
- The stock is currently trading near its 50-day and 200-day moving averages at approximately ₹289, indicating a consolidation phase with no clear directional bias.
- Key support levels are identified near ₹250, the 52-week low, while resistance is observed around ₹317, the 52-week high.
- The price is hovering close to major moving averages, suggesting equilibrium between bullish and bearish pressures in the short to medium term.
- Momentum indicators such as RSI and MACD show neutral to slightly positive readings, reflecting moderate buying interest without overbought conditions.
- Across daily, weekly, and monthly timeframes, the price action exhibits sideways movement with occasional volume spikes coinciding with IPO-related events.
- Potential market scenarios include a breakout above resistance if momentum strengthens or a retest of support levels if selling pressure increases.
Trending News
Summary: Laser Power Share Price: Find the latest news on Laser Power Stock Price. Get all the information on Laser Power with historic price charts for NSE / BSE. Experts & Broker view also get the Laser Power Ltd. buy/sell tips detailed news, announcements, Forecasts, Analysts, Valuation, Earning ...
Sentiment: neutral
2. Headline: Laser Power & Infra Shares Debut at a Premium of 17% on NSE
Summary: Track returns on your stock holdings and view real-time P&L on your positions. ... Trade in F&O using the terminal. View charts, indicators, track your orders , P&L and watchlists in a single space ... Build long-term wealth through disciplined monthly investing. ... Laser Power & Infra Limited ...
Sentiment: neutral
3. Headline: Laser Power & Infra share price: Stock lists at 17% premium over IPO price on NSE
Summary: On the BSE, the shares of the Kolkata-headquartered company were listed at a strong premium of 25.7%.
Sentiment: positive
4. Headline: Stellar Debut! Laser Power and Infra share price lists at ₹250, a premium of 16.8% over IPO price | Stock Market News
Summary: Download The Mint News App to get Daily Market Updates. HomeMarketsStock MarketsStellar Debut! Laser Power and Infra share price lists at ₹250, a premium of 16.8% over IPO price ... Log in to our website to save your bookmarks. It'll just take a moment. ... Oops! Looks like you have exceeded the limit ...
Sentiment: neutral
Summary: Laser Power IPO listing date is today, July 16, and the equity shares will be listed on both the stock exchanges, BSE and NSE. “Trading Members of the Exchange are hereby informed that effective from Thursday, July 16, 2026, the equity shares of Laser Power & Infra Limited shall be listed ...
Sentiment: positive
Powered by Brave
Recent Updates
News Summary
As of 16 July 2026. Laser Power & Infra Limited successfully debuted on the NSE and BSE with shares listing at a premium of approximately 17% and 25.7% respectively over the IPO issue price of ₹214. The IPO raised ₹742 crore, with strong subscription levels of nearly 39 times, driven by robust demand from qualified institutional buyers, non-institutional investors, and retail investors. The company operates integrated manufacturing facilities with a total installed capacity of 85,448 MT as of March 2026 and is recognized as a leading manufacturer in Eastern India. Financially, the company reported revenue of ₹2,326 crore and profit after tax of ₹151.59 crore for FY26, reflecting significant growth compared to prior years. The IPO proceeds are expected to strengthen the balance sheet and support expansion in both manufacturing and EPC segments.
News Sentiment
The overall sentiment from recent updates is positive, underscored by the strong IPO subscription and premium listing prices signaling market confidence in Laser Power & Infra's business model and growth prospects. Positive investor reception is balanced by neutral commentary on trading dynamics post-listing. The company's solid financial performance and strategic capacity expansion contribute to favorable sentiment, while the absence of dividend payouts and modest institutional ownership temper exuberance. The combination of strong market debut and operational fundamentals suggests a cautiously optimistic outlook.
Source List
- https://groww.in/blog/laser-power-and-infra-shares-debut-at-a-premium-of-17-percent-on-nse
Analytical Overview
Analysis Summary
Laser Power & Infra's trailing P/E ratio of 27.69 aligns closely with the industry average, indicating fair valuation relative to peers. The absence of a forward P/E limits projection-based valuation assessment. Revenue for FY26 stood at ₹2,326 crore with profit after tax of ₹151.59 crore, demonstrating a positive growth trajectory supported by expanding manufacturing capacity and EPC business diversification. However, operating cash flow is negative at ₹-119 crore TTM, while levered free cash flow is positive at ₹151.59 crore, indicating mixed cash flow trends. The company maintains a current ratio of 1.31 and zero reported debt, suggesting a stable financial position. Sector-specific challenges include regulatory compliance and competitive pressures in the power infrastructure industry, while opportunities arise from India's ongoing electrification and infrastructure development initiatives. India-specific factors such as government focus on rural electrification and infrastructure spending support the company's growth prospects.
Overall Business and Market Assessment
Supporting Factors: Key supporting factors include a solid market position with integrated manufacturing and EPC capabilities, a strong IPO subscription reflecting investor interest, and a healthy ROE of 20.62%. Risks to monitor include negative operating cash flow, limited institutional ownership, and sectoral regulatory uncertainties. The investment timeframe may be medium to long term, considering the company's growth initiatives and market positioning. Overall, the company presents a balanced risk-reward profile with stable fundamentals and growth potential tempered by cash flow considerations.
Risk Factors: No data
SWOT Analysis
Strengths
- Strong market position in Eastern India's power cable manufacturing sector.
- Integrated business model combining manufacturing and EPC services.
- Robust return on equity of 20.62% indicating efficient equity utilization.
- Successful IPO with strong investor subscription and premium listing.
Weaknesses
- Negative operating cash flow despite positive free cash flow.
- Limited institutional investor ownership at 1.94%.
- Relatively high price-to-book ratio of 4.75 compared to peers.
- No dividend payouts reducing income appeal to yield-focused investors.
Opportunities
- Growing demand for power infrastructure and rural electrification in India.
- Expansion potential in EPC projects and manufacturing capacity.
- Government initiatives supporting power transmission and distribution upgrades.
- Potential to increase institutional investor participation over time.
Threats
- Regulatory changes impacting the power infrastructure sector.
- Intense competition from larger and more diversified peers.
- Macroeconomic factors affecting infrastructure spending and project execution.
- Operational risks related to scaling EPC project delivery.
Company Description
Laser Power & Infra Limited is an Indian power infrastructure company headquartered in Kolkata, focused on the power transmission and distribution segment. The company operates two core businesses: manufacturing and engineering, procurement and construction (EPC). On the manufacturing side, Laser Power & Infra produces a broad range of power and control cables, conductors, aerial bunched cables, instrumentation cables, aluminium and aluminium-alloy rods, and related specialised components used across transmission and distribution networks. Its EPC division executes turnkey power distribution projects, including rural and urban electrification, substations, overhead and underground lines, and associated network infrastructure for utilities, government agencies, and private clients. The company runs multiple integrated manufacturing facilities in West Bengal with in-house testing and R&D capabilities, serving both its own EPC projects and third-party customers in India and select international markets. Founded in 1988 in Kolkata, Laser Power & Infra Limited today plays a significant role as an integrated solutions provider within India’s power infrastructure value chain.