


Larsen & Toubro Ltd (LT)
Stock Analysis Report
Stock Journey
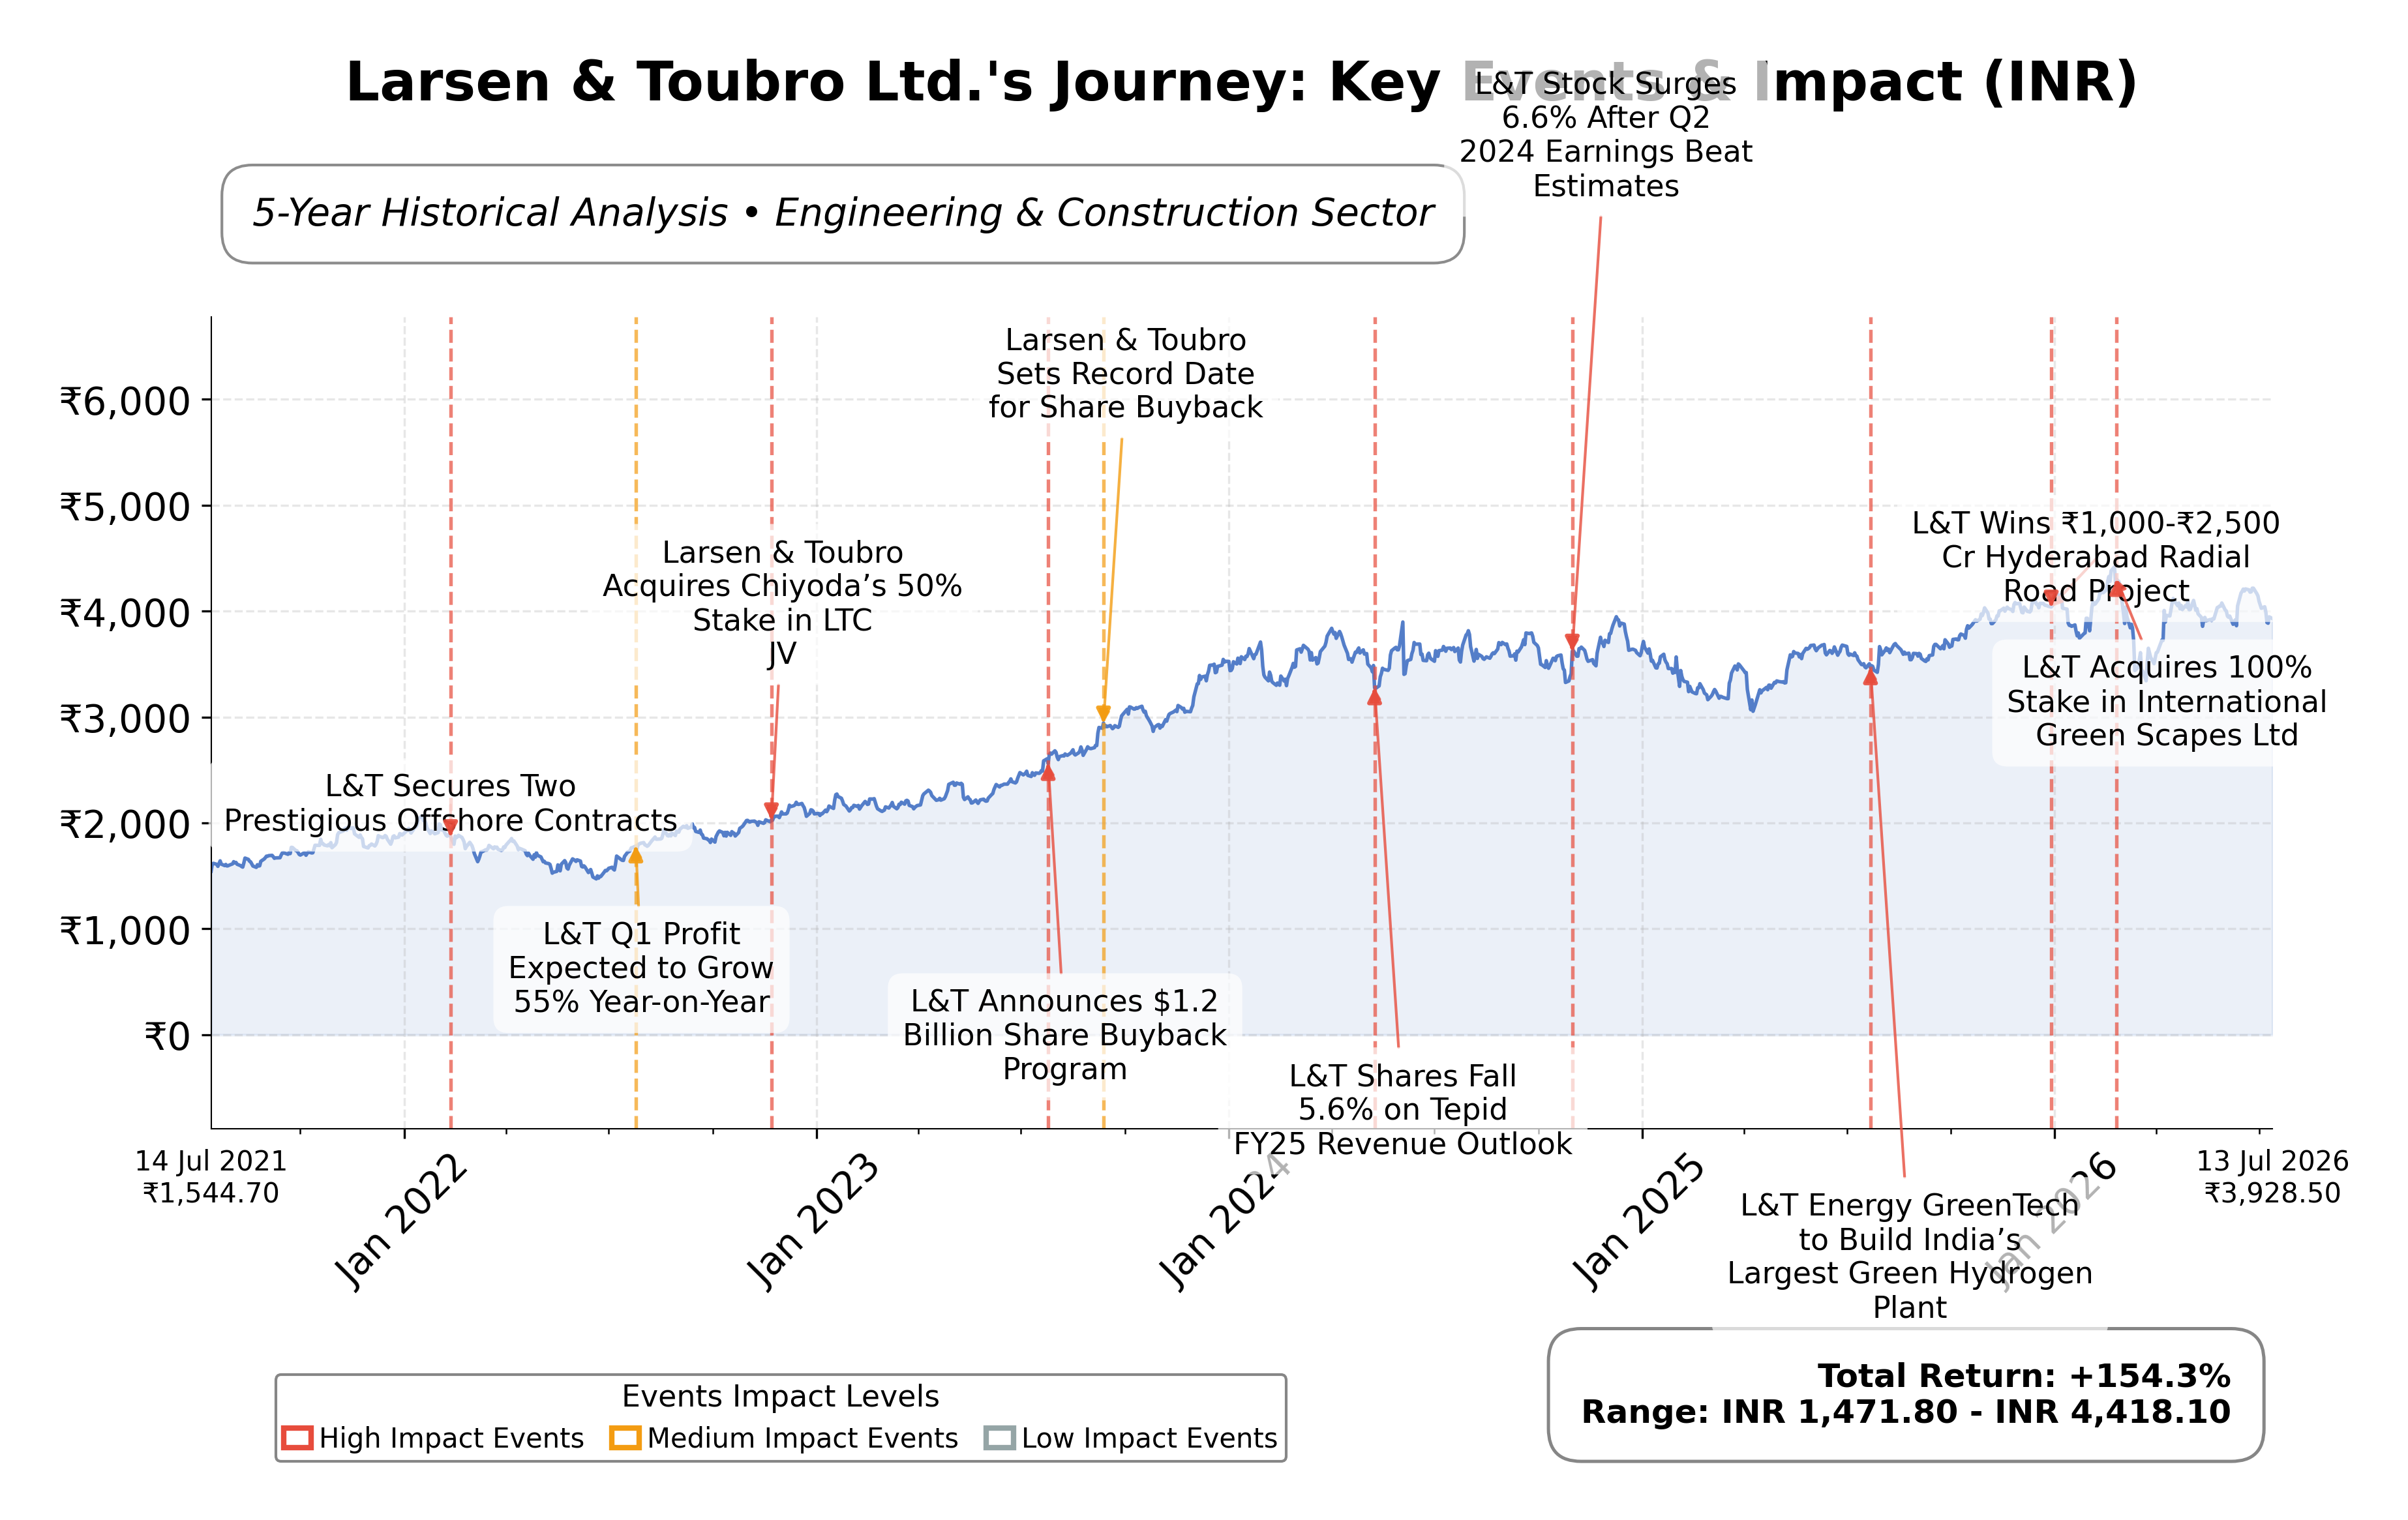
Key Positives and Key Risks
Pros
- Market capitalization of ₹5.43 trillion reflects strong scale and market presence in the engineering sector.
- Revenue growth of 11.7% year-over-year and a forward P/E of 21.17 indicate growth potential with reasonable valuation.
Cons
- Profit margin of 5.52% is relatively modest, reflecting capital-intensive operations and margin pressures.
- Debt-to-equity ratio near 0.98 suggests moderate leverage, which could impact financial flexibility.
- Price-to-book ratio of 4.89 is high compared to some peers, indicating premium valuation.
Disclosure: This information is for general awareness and does not constitute investment advice
Report Summary
Larsen & Toubro Ltd. (LT) is a leading Indian multinational conglomerate operating primarily in the engineering and construction sector, listed on the NSE. The company is engaged in diverse business segments including infrastructure projects, energy, hi-tech manufacturing, IT and technology services, and financial services. It serves a broad client base across more than 50 countries, focusing on complex infrastructure and energy-related facilities, which positions it as a key player in the Industrials sector in India.
Financially, LT reported trailing twelve months (TTM) revenue of approximately ₹2.92 trillion with a gross margin of 30.47%, operating margin of 10.71%, and a net profit margin of 5.52%. The company’s return on equity (ROE) stands at 16.95%, and return on assets (ROA) at 4.59%, reflecting efficient capital utilization and profitability. Its return on invested capital (ROIC) is consistent with operational efficiency, supported by stable EBITDA margins around 10.2% in FY26.
Valuation metrics indicate a trailing P/E ratio of 33.28 and a forward P/E of 21.17, suggesting the market anticipates earnings growth. The price-to-book ratio is 4.89, and the EV/EBITDA multiple is 17.77, positioning LT as moderately valued relative to its fundamentals. The stock trades at ₹3,846, within a 52-week range of ₹3,288 to ₹4,440, currently closer to the lower end of the range, indicating some price consolidation.
LT’s strengths include strong cash flow generation with operating cash flow of ₹167 billion and free cash flow of ₹262 billion, a manageable debt-to-equity ratio near 0.98, and a diversified portfolio with international order inflows comprising over 50% of the order book. Key risks involve supply chain disruptions impacting near-term growth, regulatory challenges, and competitive pressures in the engineering and construction industry. Recent strategic initiatives include the launch of a new AI-focused subsidiary and Moody’s upgrade to a Baa1 rating, reflecting financial discipline.
Technically, LT’s price is trading near its 50-day and 200-day moving averages around ₹4,000, with momentum indicators showing mixed signals. The stock has experienced robust trading volumes recently, aligned with sector gains. Overall, current data suggest a balanced outlook with conditions warranting close observation of operational performance and market trends for potential entry or exit considerations.
Company and Industry Overview
Company Basics
Price Performance
Company Size
Shareholding Pattern
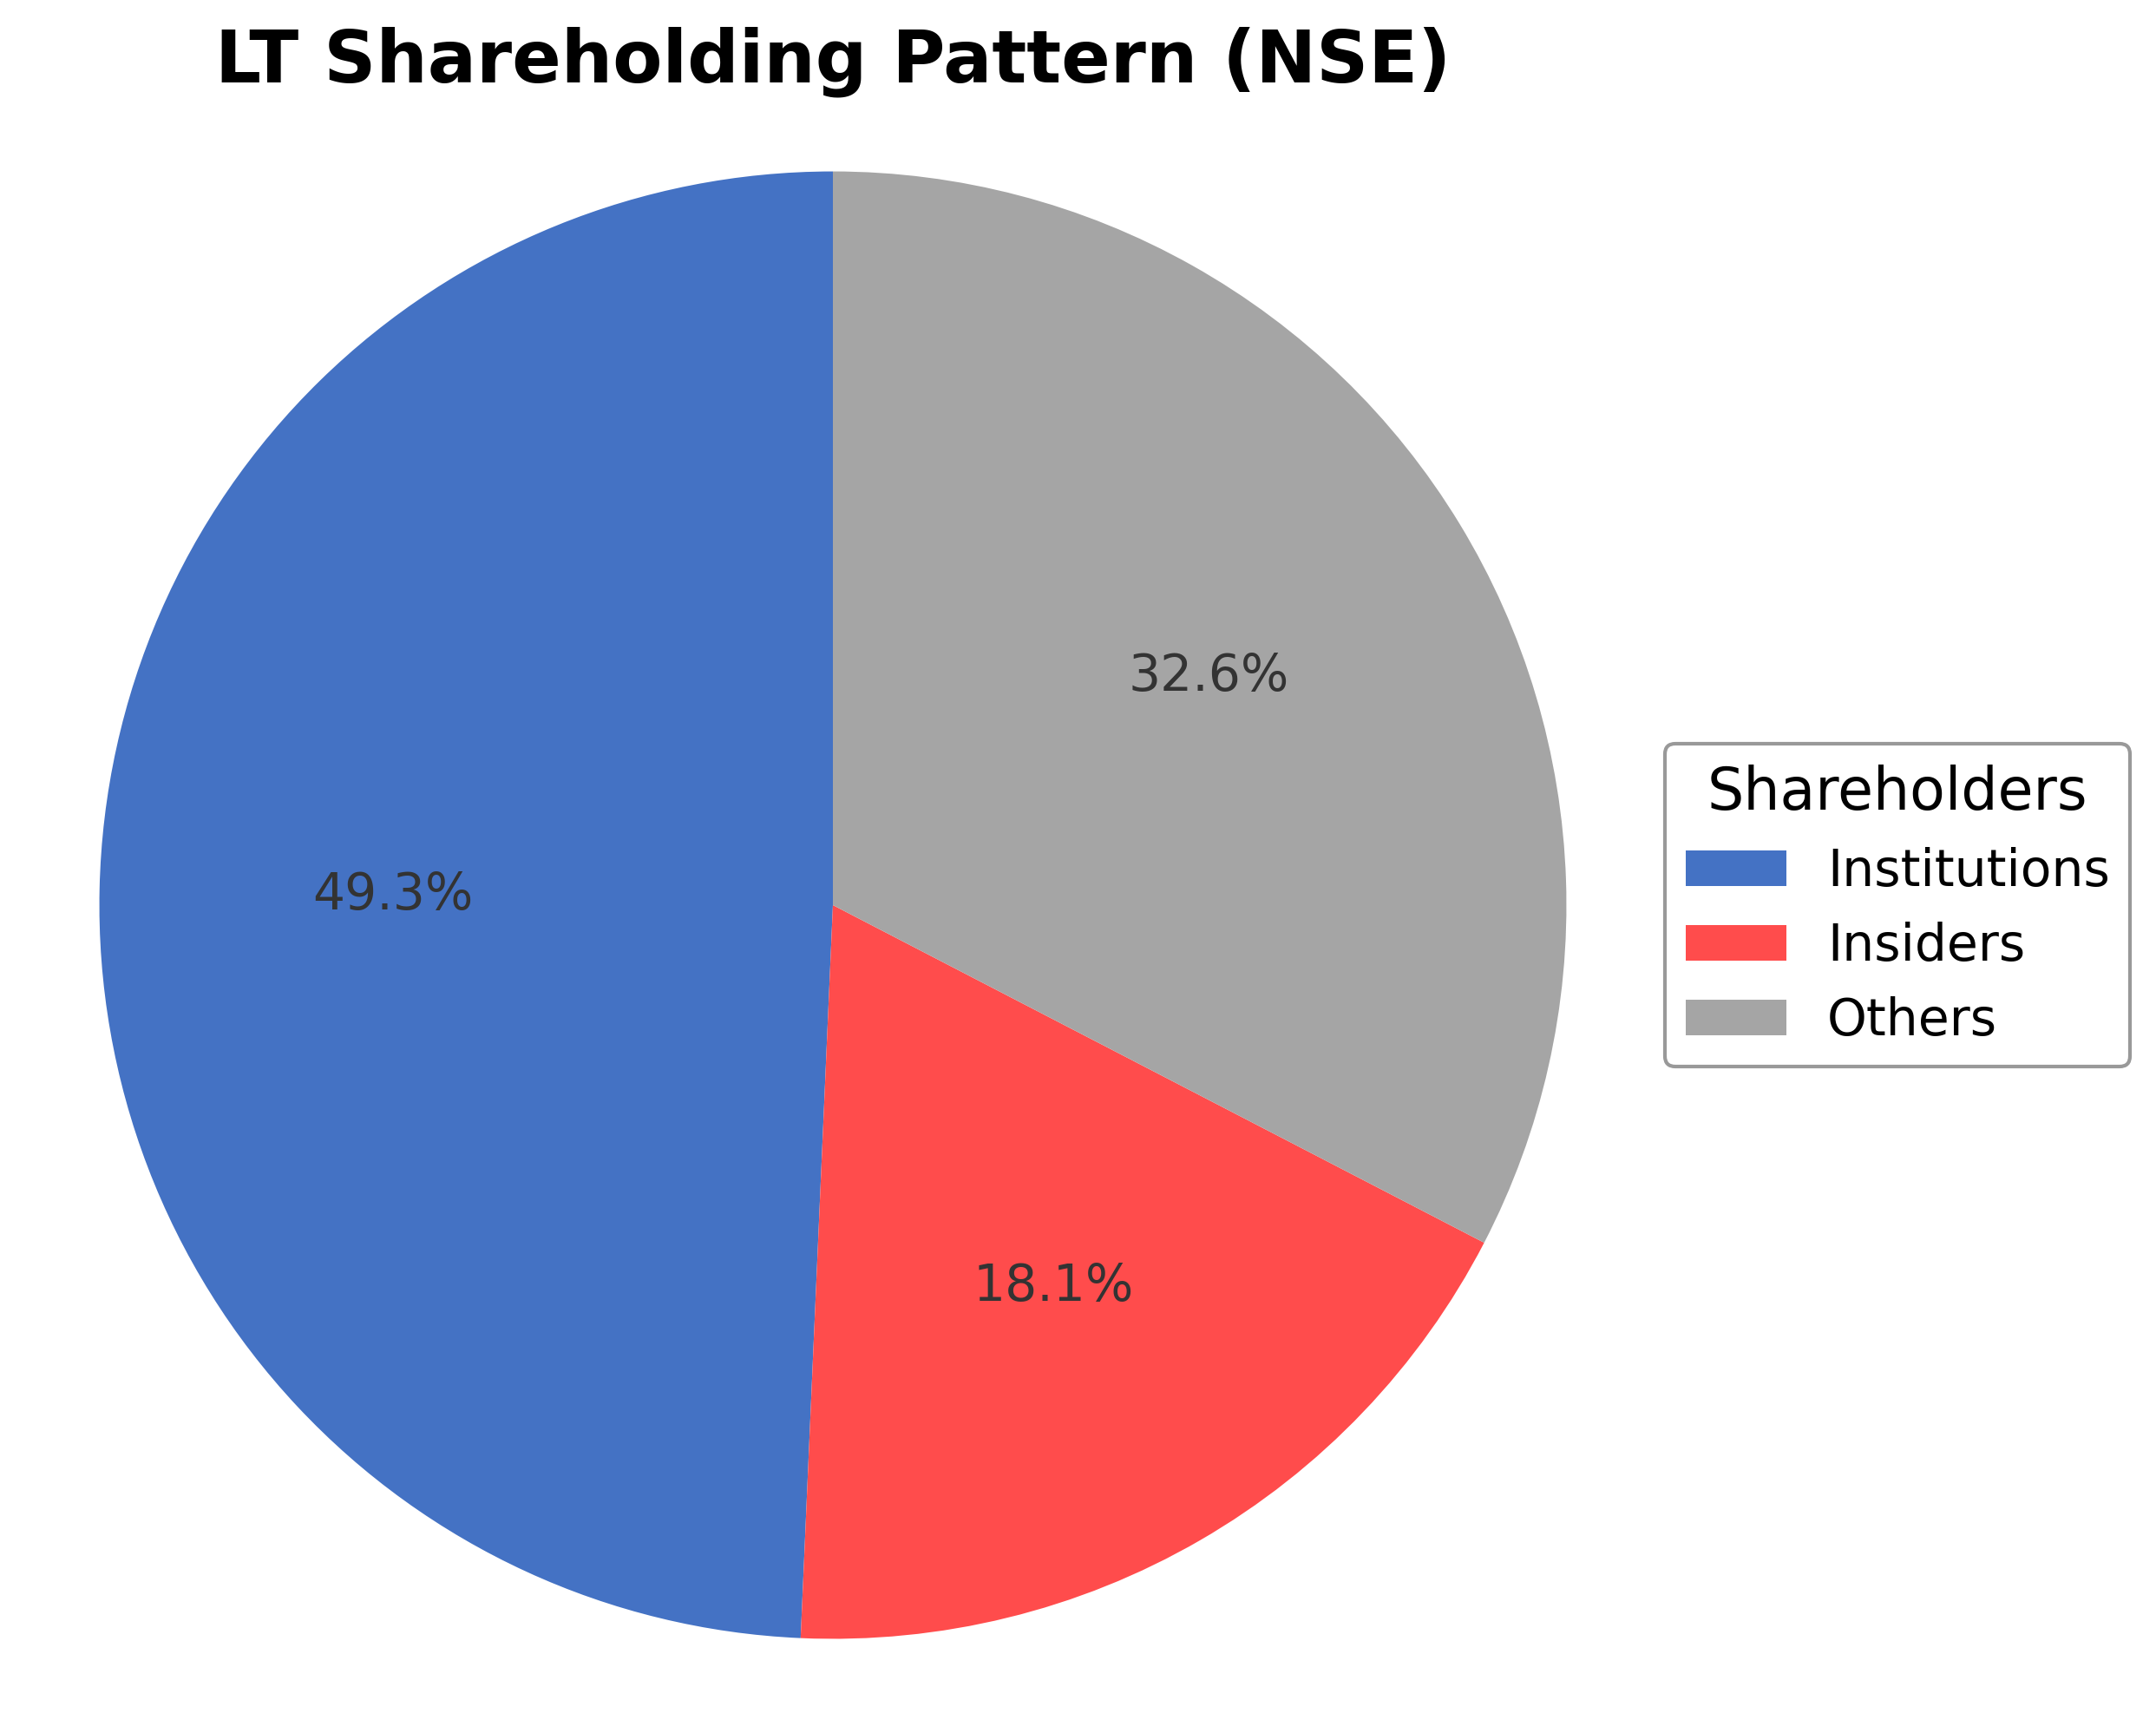
Larsen & Toubro Ltd. exhibits a shareholding structure with insiders, including executives and board members, holding approximately 18.09% of shares, institutional investors such as mutual funds and pension funds owning 49.30%, and the remaining 32.61% held by public and retail investors. Over the past 12 to 24 months, institutional ownership has shown moderate accumulation, reflecting confidence from major funds, while insider holdings have remained relatively stable. This distribution suggests a balanced governance framework with significant institutional oversight and broad public participation. The ownership pattern supports strategic decision-making aligned with long-term growth objectives and indicates market sentiment favoring the company’s diversified industrial operations within the Indian engineering and construction sector.
Sector and Industry Analysis
The engineering and construction sector in India, where Larsen & Toubro operates, is a significant contributor to the country's infrastructure development, with a market size estimated in the hundreds of billions of dollars. The sector is experiencing steady growth driven by government initiatives in urbanization, renewable energy, and transportation infrastructure. Key players include Larsen & Toubro, Tata Projects, and Reliance Infrastructure, which dominate due to their scale and diversified capabilities.
Industry trends highlight a shift towards digitalization, sustainable construction practices, and increased adoption of smart infrastructure technologies. Competitive dynamics are shaped by high capital requirements and technical expertise, creating substantial barriers to entry. Established firms like Larsen & Toubro leverage their integrated service offerings and strong project execution track record to maintain market leadership amid rising competition from both domestic and international players.
The regulatory environment is characterized by stringent safety, environmental, and labor laws, alongside policies promoting infrastructure investment and public-private partnerships. Recent reforms aim to streamline project approvals and enhance transparency, positively impacting project timelines and cost efficiency. Compliance with evolving environmental standards and local content requirements remains critical for sustained operational success in this sector.
Note: Analysis synthesized from industry research, market reports, and regulatory filings. Information is subject to change based on market conditions.
Financial Ratios Dashboard
Illustrative Scenario Analysis
DCF Assumptions:
Method: Two-Stage EPS-Priority Model
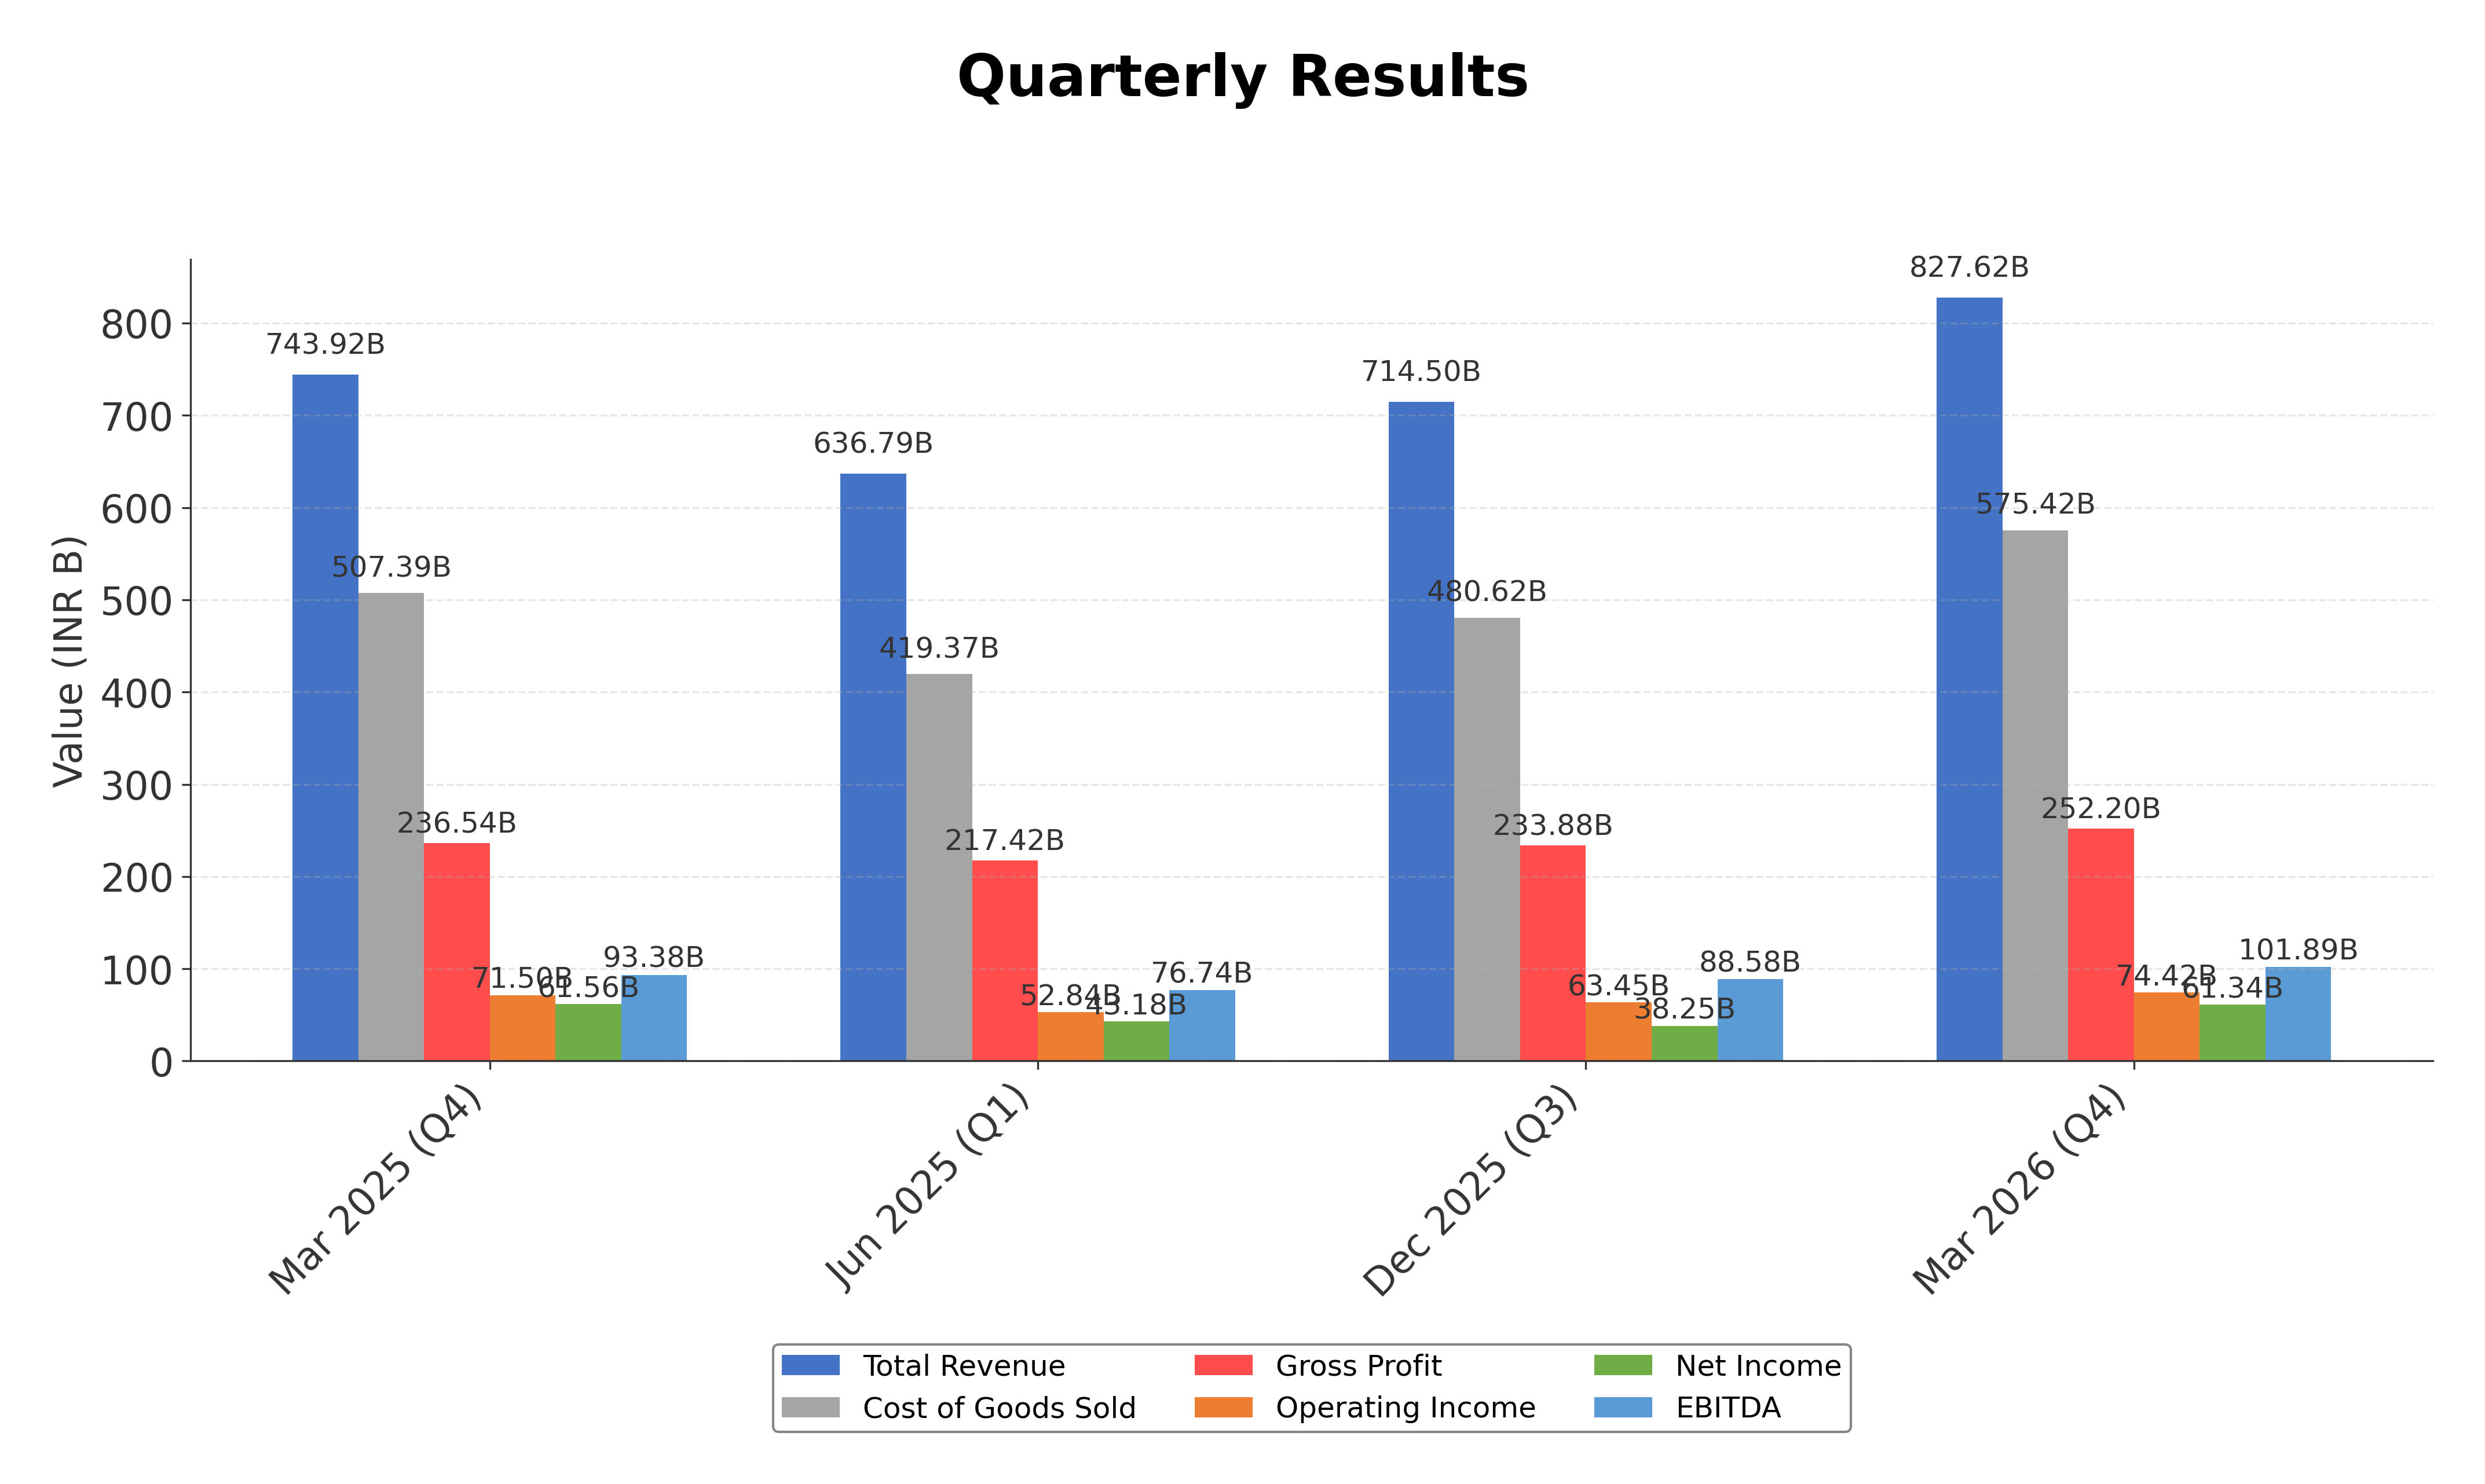
Financials
Peer Analysis
| Company Name | Market Cap | P/E Ratio | P/B Ratio | EV/EBITDA | Price to CFO |
|---|---|---|---|---|---|
| Larsen & Toubro Ltd. | ₹5.43T | 33.28 | 4.89 | 17.77 | 32.43 |
| Siemens Ltd. | ₹1.25T | 73.10 | 8.94 | 49.42 | -348.85 |
| ABB India Ltd. | ₹1.45T | 93.26 | 18.44 | 73.91 | 95.11 |
| Thermax Ltd. | ₹541.73B | 75.00 | 9.76 | 52.72 | 100.03 |
| Bharat Heavy Electricals Ltd. | ₹1.38T | 82.78 | 5.08 | 54.54 | 23.58 |
| Kec International Ltd. | ₹134.39B | 21.79 | 2.18 | 11.04 | -32.45 |
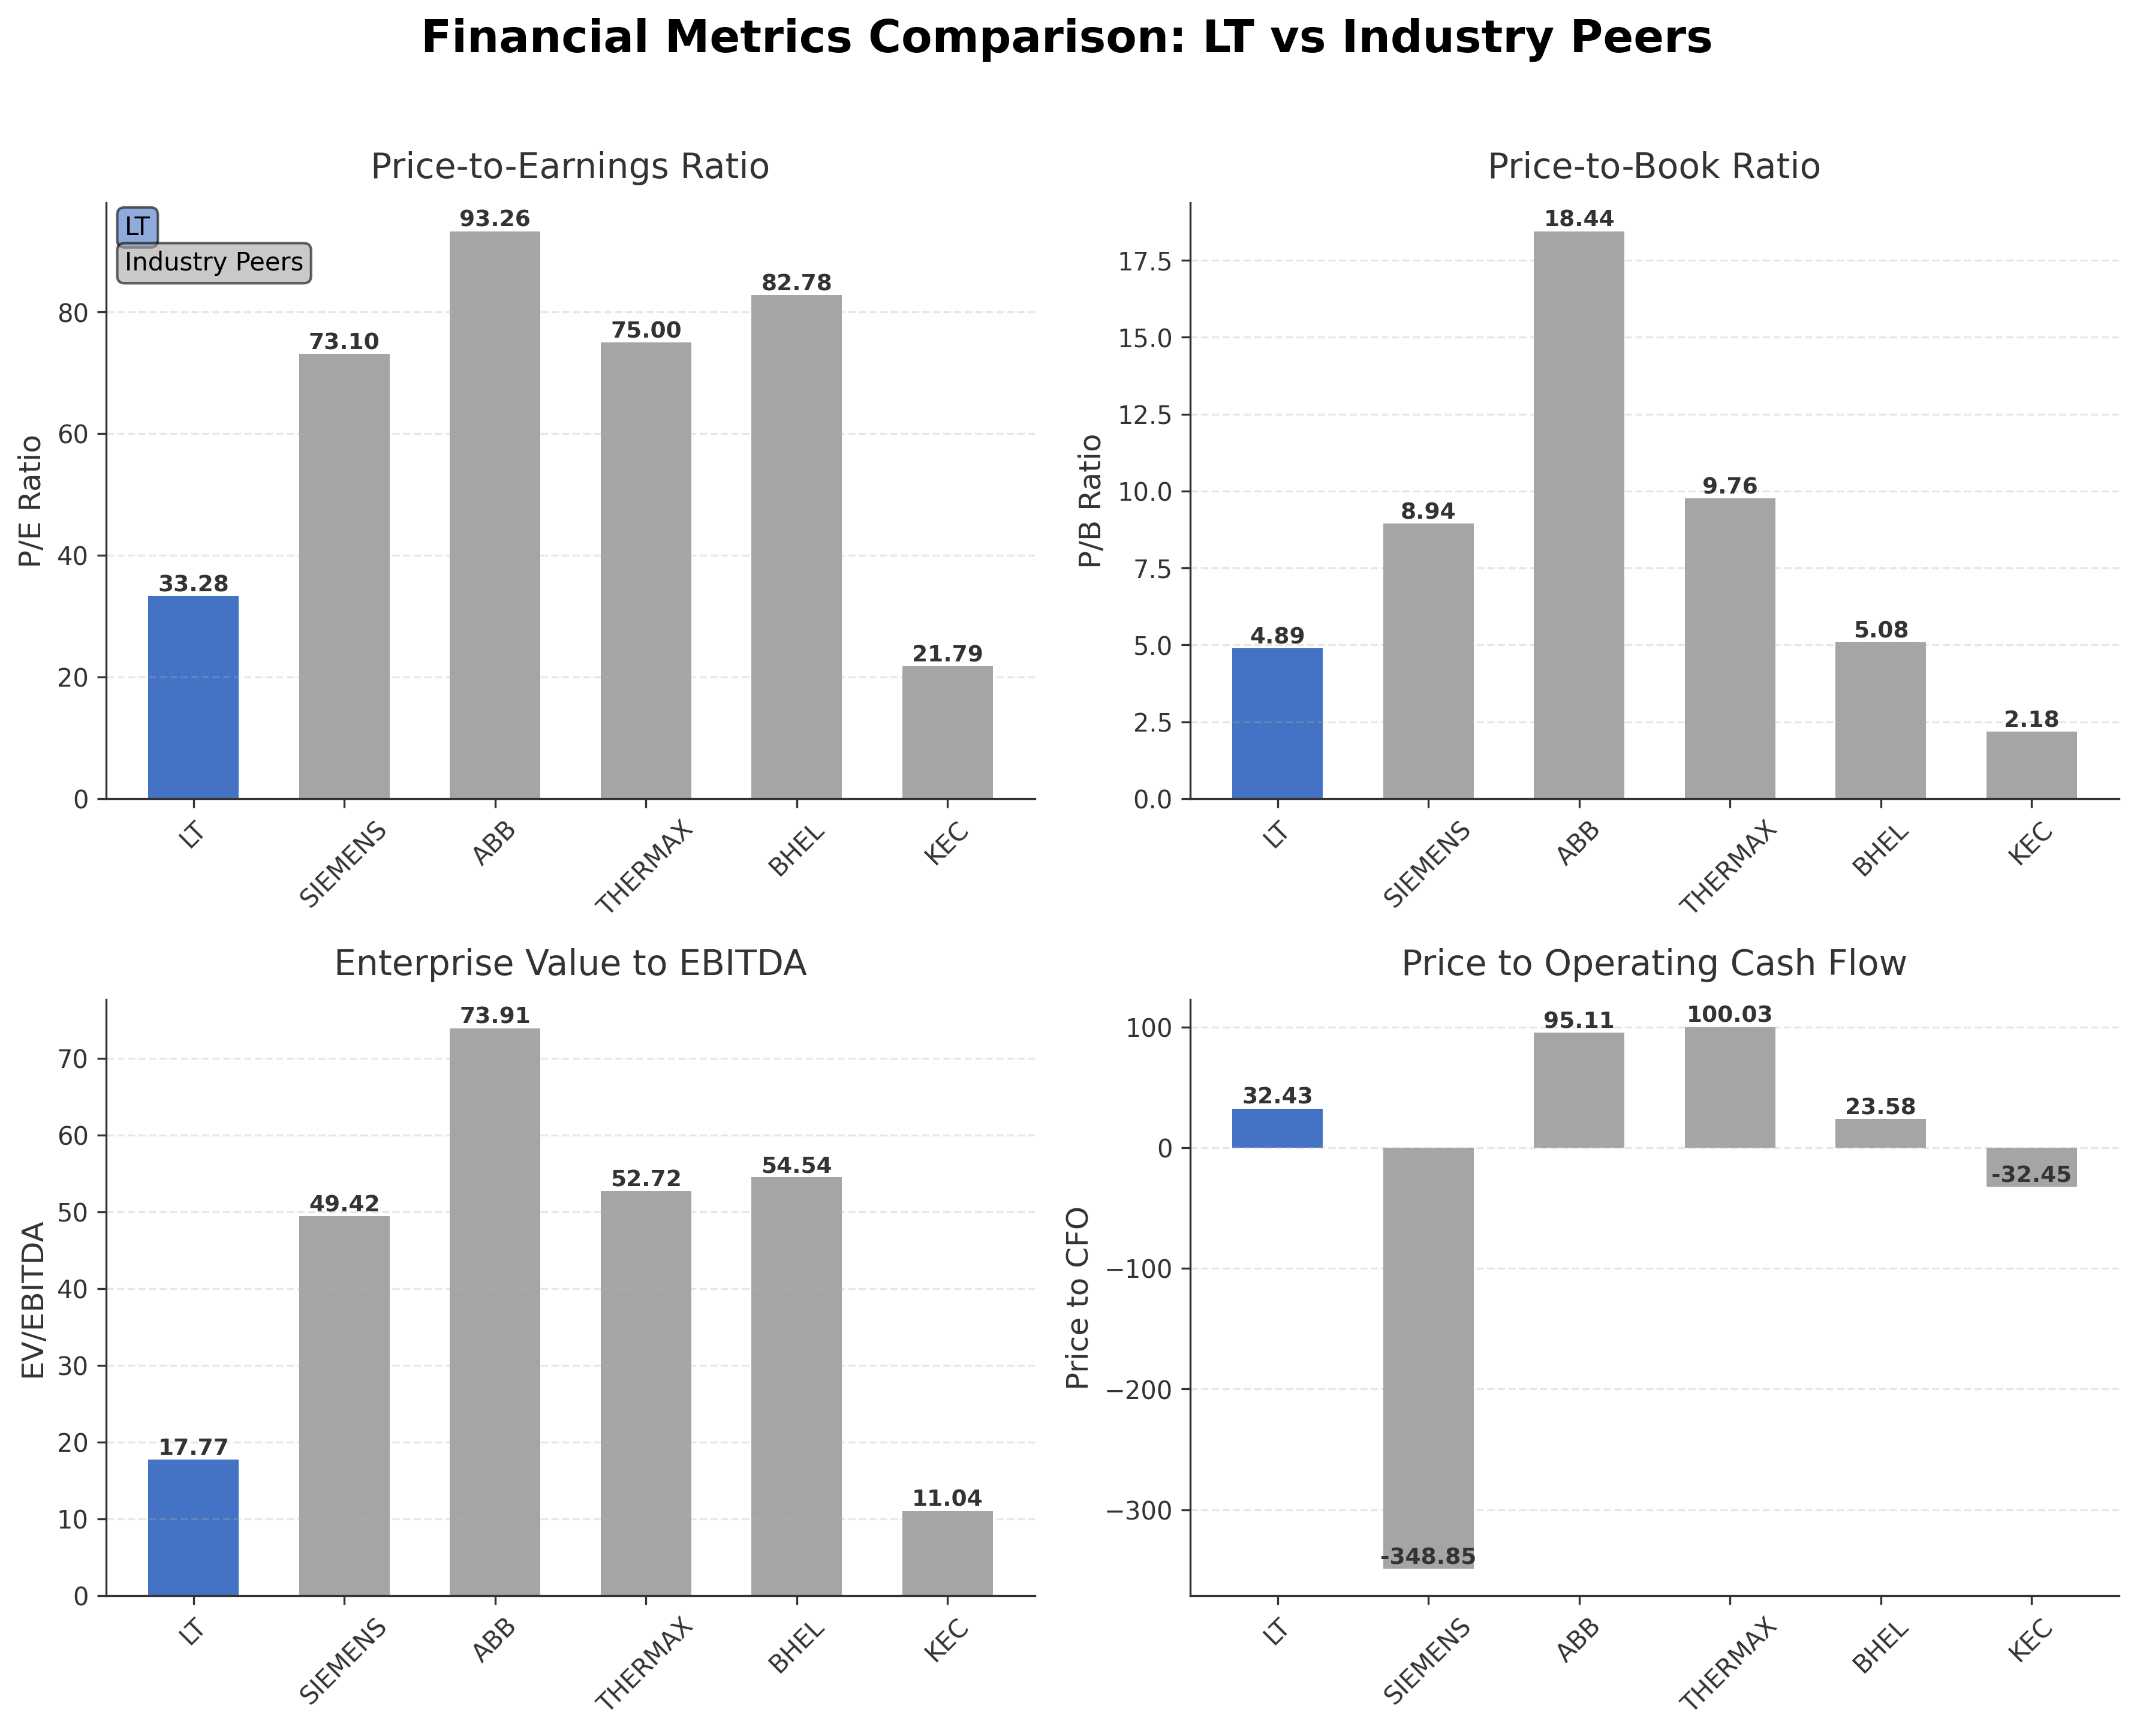
Comparison Analysis: Larsen & Toubro Ltd. stands out among its Indian engineering and construction peers with a substantial market capitalization of ₹5.43 trillion, significantly larger than competitors like Siemens Ltd. and ABB India Ltd. LT’s P/E ratio of 33.28 is considerably lower than the elevated valuations of peers such as ABB (93.26) and Thermax (75.00), indicating a more moderate price relative to earnings. Its price-to-book ratio of 4.89 is also more conservative compared to ABB’s 18.44 and Thermax’s 9.76. The EV/EBITDA multiple of 17.77 for LT is substantially below the peer average, reflecting relatively better valuation. Return on equity at 16.95% is competitive, surpassed only by ABB at 21.29%, while LT’s price to CFO ratio is positive and reasonable compared to peers with negative or extreme values. Overall, LT exhibits a balanced valuation profile with strong scale and profitability metrics relative to its industry peers.
Financial Metrics Comparison with Peers
Financial Statements
Comprehensive financial data including income, balance sheet, and cash flow metrics
Income Statement
| fiscal_date | 2026-03-31 | 2025-03-31 | 2024-03-31 | 2023-03-31 | 2022-03-31 |
|---|---|---|---|---|---|
| Sales | 2842.25B | 2542.09B | 2191.16B | 1816.61B | 1556.72B |
| Cost Of Goods | 1930.49B | 1711.69B | 1460.29B | 1166.15B | 998.87B |
| Gross Profit | 911.76B | 830.40B | 730.87B | 650.46B | 557.86B |
| Operating Expense Selling General And Administrative | 63.06B | 61.49B | 52.59B | 46.38B | 38.91B |
| Operating Expense Other Operating Expenses | 23.50B | 3.91B | 21.79B | 13.36B | 3.83B |
| Operating Income | 270.71B | 264.78B | 217.31B | 195.01B | 193.41B |
| Non Operating Interest Income | 31.62B | 24.71B | 24.47B | 18.17B | 10.63B |
| Non Operating Interest Expense | 28.47B | 33.31B | 35.37B | 31.78B | 30.55B |
| Pretax Income | 259.76B | 235.79B | 205.17B | 171.09B | 144.95B |
| Income Tax | 68.16B | 58.91B | 49.47B | 44.84B | 42.04B |
| Net Income | 189.54B | 176.73B | 155.47B | 125.31B | 104.19B |
| Eps Basic | 116.93 | 109.36 | 93.96 | 74.51 | 61.71 |
| Eps Diluted | 116.88 | 109.28 | 93.88 | 74.45 | 61.65 |
| Basic Shares Outstanding | 1.38B | 1.37B | 1.39B | 1.41B | 1.40B |
| Diluted Shares Outstanding | 1.38B | 1.37B | 1.39B | 1.41B | 1.40B |
| Ebit | 288.23B | 269.10B | 240.54B | 202.87B | 175.50B |
| Ebitda | 363.34B | 336.48B | 288.61B | 261.61B | 245.56B |
| Net Income Continuous Operations | 276.98B | 231.04B | 204.24B | 169.73B | 143.98B |
| Minority Interests | -28.70B | -26.36B | -24.88B | -20.60B | -17.50B |
| Preferred Stock Dividends | 0.00 | 0.00 | 0.00 | 0.00 | 0.00 |
Data provided by Twelve Data
Balance Sheet
| fiscal_date | 2026-03-31 | 2025-03-31 | 2024-03-31 | 2023-03-31 | 2022-03-31 |
|---|---|---|---|---|---|
| Cash And Cash Equivalents | 153.91B | 121.87B | 119.58B | 169.27B | 137.70B |
| Accounts Receivable | 604.61B | 537.14B | 487.71B | 447.32B | 461.39B |
| Total Assets | 4525.50B | 3795.24B | 3396.27B | 3303.52B | 3200.67B |
| Total Liabilities | 3240.19B | 2641.20B | 2370.78B | 2267.85B | 2246.94B |
| Long Term Debt | 665.06B | 597.69B | 582.42B | 628.64B | 630.36B |
| Shareholders Equity | 1285.30B | 1154.04B | 1025.50B | 1035.67B | 953.74B |
Data provided by Twelve Data
Cash Flow Statement
| fiscal_date | 2026-03-31 | 2025-03-31 | 2024-03-31 | 2023-03-31 | 2022-03-31 |
|---|---|---|---|---|---|
| Operating Activities Net Income | 276.98B | 231.04B | 204.24B | 169.73B | 143.98B |
| Operating Activities Stock Based Compensation | 1.15B | 2.23B | 2.98B | 2.50B | 1.35B |
| Operating Activities Other Non Cash Items | -5.30B | 7.02B | 10.39B | 13.50B | 20.01B |
| Operating Activities Accounts Receivable | -533.84B | -245.24B | -161.36B | 4.42B | -48.47B |
| Operating Activities Other Assets Liabilities | -22.01B | -5.40B | 2.45B | -4.76B | -743.30M |
| Operating Activities Operating Cash Flow | -283.02B | -10.35B | 58.68B | 185.39B | 116.13B |
| Investing Activities Capital Expenditures | -44.69B | -35.41B | -42.10B | -37.93B | -30.40B |
| Investing Activities Net Acquisitions | -11.46B | -3.65B | 8.53B | 27.63B | 9.28B |
| Investing Activities Purchase Of Investments | -129.46B | -82.35B | -48.89B | -97.82B | -21.56B |
| Investing Activities Sale Of Investments | 11.90B | 17.26B | 76.29B | 8.27B | 24.63B |
| Investing Activities Other Investing Activity | 26.92B | -71.92B | -49.70M | -1.12B | -28.44B |
| Investing Activities Investing Cash Flow | -146.79B | -176.06B | -6.23B | -100.97B | -46.49B |
| Financing Activities Long Term Debt Issuance | 436.94B | 464.97B | 231.25B | 282.98B | 273.93B |
| Financing Activities Long Term Debt Payments | -364.03B | -307.82B | -272.28B | -327.95B | -358.06B |
| Financing Activities Common Stock Issuance | 75.20M | 93.20M | 96.50M | 103.10M | 109.70M |
| Financing Activities Common Dividends | -46.76B | -38.50B | -42.17B | -30.91B | -25.28B |
| Financing Activities Other Financing Charges | -8.77B | -11.46B | -30.12B | -5.25B | -8.76B |
| Financing Activities Financing Cash Flow | 17.44B | 107.28B | -213.48B | -81.02B | -118.06B |
| End Cash Position | 153.91B | 121.87B | 119.58B | 169.27B | 137.70B |
| Free Cash Flow | 119.32B | 47.33B | 137.50B | 186.33B | 160.53B |
| Financing Activities Common Stock Repurchase | N/A | 0.00 | -100.27B | 0.00 | N/A |
Data provided by Twelve Data
Technical Analysis
Key Insights
- The current trend shows consolidation with price hovering near the 50-day moving average at ₹4,028 and the 200-day moving average at ₹3,965, indicating a neutral trend direction.
- Key support levels are identified near ₹3,288 (52-week low) and ₹3,800, while resistance is observed around ₹4,440 (52-week high) and ₹4,100.
- The stock price is slightly below the 50-day and 200-day moving averages, suggesting cautious momentum in the short to medium term.
- Momentum indicators show RSI near neutral levels, MACD indicates a lack of strong directional momentum, and Stochastic oscillators are also in mid-range, reflecting balanced buying and selling pressure.
- Across daily, weekly, and monthly timeframes, the price action is stable without significant breakout or breakdown signals, indicating a period of consolidation.
- Potential market scenarios include a continuation of sideways movement with possible testing of support levels or a gradual upward move if volume and momentum indicators improve.
Trending News
1. Headline: Tata Group remains India’s most valuable brand for 18th consecutive year - Business News | The Financial Express
Summary: The Tata Group, Infosys, LIC, HDFC Group, and Reliance Group remain India's top brands, showing strong growth driven by digital transformation, infrastructure, and innovation, with a 7% increase in total brand value to $252.8 billion.
Sentiment: positive
2. Headline: Buy Larsen and Toubro Finance; target of Rs 370: ICICI Securities- Moneycontrol.com
Summary: ICICI Securities is bullish on Larsen and Toubro Finance recommended buy rating on the stock with a target price of Rs 370 in its research report dated July 12, 2026.
Sentiment: positive
Summary: Larsen Share Price: Find the latest news on Larsen Stock Price. Get all the information on Larsen with historic price charts for NSE / BSE. Experts & Broker view also get the Larsen Ltd. buy/sell tips detailed news, announcements, Forecasts, Analysts, Valuation, Earning forecasts, Estimates, ...
Sentiment: neutral
4. Headline: L&T Finance Q1 profit rises 29% to record high on strong retail book growth - CNBC TV18
Summary: L&T Finance reported its highest-ever quarterly profit in the June quarter, driven by strong retail loan growth, higher disbursements and improved asset quality.
Sentiment: positive
5. Headline: Larsen & Toubro Ltd Sees Robust Trading Activity Amid Sector-Aligned Gains
Summary: Larsen & Toubro Ltd. (LT), a stalwart in the construction sector, witnessed significant trading activity on 9 July 2026, emerging as one of the highest value stocks on the bourses. With a total traded volume exceeding 25 lakh shares and a turnover nearing ₹9,824.5 crores, the stock demonstrated ...
Sentiment: positive
Powered by Brave
Recent Updates
News Summary
As of July 14, 2026. Larsen & Toubro Limited has recently announced the launch of a new subsidiary dedicated to compute infrastructure, aimed at enhancing its artificial intelligence capabilities and expanding its technological footprint. This initiative aligns with the company's strategic focus on innovation and digital transformation. The Q4 FY26 earnings summary revealed record order inflows of ₹4,356 billion, a 22% year-over-year increase, with international orders comprising over half of the order book. Revenue grew 12% year-over-year to ₹2,859 billion, driven by strong performance in hi-tech manufacturing, energy, and financial services segments. Recurring PAT rose 18% to ₹172 billion, despite a one-time labor code provision impacting reported PAT. The order book reached ₹7,403 billion, up 28% year-over-year, with improved net working capital to revenue ratio at 4.1%. Cash flow from operations (excluding financial services) surged 87% year-over-year to ₹355 billion, and the debt-equity ratio improved to 0.95, reflecting enhanced financial health. Moody’s upgraded L&T’s credit rating to Baa1 with a stable outlook, underscoring strong financial discipline and low credit risk. The company’s strategic exits from Nabha Power and Hyderabad Metro Rail were also noted, with assets classified as held for sale.
News Sentiment
The overall sentiment from recent updates is predominantly positive, driven by strong financial performance, record order inflows, and strategic initiatives such as the AI subsidiary launch. The significant growth in revenue and profit, coupled with improved cash flow and credit rating upgrades, supports a constructive view on operational and financial strength. However, the impact of a one-time labor provision and ongoing supply chain challenges introduces some caution. The balanced approach to asset divestments and focus on emerging sectors like data centers and green hydrogen further reflects strategic adaptability. Overall, the news indicates robust business momentum tempered by manageable near-term risks.
Source List
- https://www.tipranks.com/news/company-announcements/larsen-toubro-deepens-ai-push-with-new-compute-infrastructure-subsidiary
- https://quartr.com/companies/larsen-toubro-limited_10300
- https://www.alphaspread.com/security/nse/lt/investor-relations
Analytical Overview
Analysis Summary
Larsen & Toubro Ltd. trades at a trailing P/E of 33.28 and a forward P/E of 21.17, which are below the industry average P/E of 33.28, indicating relatively attractive valuation compared to peers. The company’s PEG ratio of 0.57 suggests undervaluation relative to its earnings growth prospects. Revenue growth of 11.7% year-over-year and strong operating cash flow trends demonstrate a solid growth trajectory supported by diversified business segments.
Financial health is robust with a debt-to-equity ratio near 0.98 and a current ratio of 1.25, reflecting manageable leverage and adequate liquidity. Operating cash flow of ₹167 billion and free cash flow of ₹262 billion further underscore strong cash generation capabilities. Sector-specific challenges include supply chain disruptions and competitive pressures in infrastructure projects, while opportunities arise from government infrastructure spending and emerging technologies like AI and green hydrogen.
Considering India-specific factors, the regulatory environment remains supportive with initiatives in infrastructure development and ESG compliance, while consumer and industrial demand trends favor capital formation. The company’s strategic focus on technology and sustainability aligns well with evolving market dynamics.
Overall Business and Market Assessment
Supporting Factors: Key supporting factors include strong revenue and order book growth, robust cash flow generation, and strategic initiatives in technology and sustainability. Risks to monitor include supply chain disruptions, regulatory changes, and competitive intensity in core sectors. The appropriate investment timeframe is medium to long term, reflecting the company’s capital-intensive business model and growth strategy. Overall, the analysis suggests a stable outlook with balanced risk-reward characteristics.
Risk Factors: No data
SWOT Analysis
Strengths
- Diversified business portfolio across infrastructure, energy, manufacturing, IT, and financial services.
- Strong financial discipline with Moody’s Baa1 rating and stable credit outlook.
- Robust cash flow generation supporting operational and strategic initiatives.
- Significant international presence with over 50% of order inflows from global markets.
Weaknesses
- Moderate debt-to-equity ratio near 0.98 indicating leverage exposure.
- Profit margins remain modest at 5.52%, reflecting capital-intensive operations.
- Exposure to supply chain disruptions impacting near-term growth.
- Relatively high price-to-book ratio of 4.89 compared to some peers.
Opportunities
- Expansion into AI and compute infrastructure through new subsidiary.
- Growing government infrastructure spending and green energy initiatives.
- Strategic exits from non-core assets to optimize capital allocation.
- Increasing international order book supporting revenue diversification.
Threats
- Competitive pressures in the engineering and construction sector.
- Regulatory and policy changes impacting project execution timelines.
- Global economic uncertainties affecting international business segments.
- Potential delays or cost overruns in large-scale infrastructure projects.
Company Description
Larsen & Toubro Ltd. is an Indian multinational conglomerate engaged in engineering, procurement and construction projects, hi-tech manufacturing and a broad range of services. Headquartered in Mumbai, the company focuses on delivering complex infrastructure and energy-related facilities, including buildings, transportation systems, heavy civil works, power transmission and distribution, renewable energy, water management, and process industry projects. Its portfolio also spans hydrocarbon and power plant EPC solutions, defense and aerospace systems, shipbuilding, industrial machinery, and advanced forgings, serving governments, large enterprises, and industrial clients across more than 50 countries. Larsen & Toubro further extends its presence through information technology and engineering services, as well as financial services that support project development and corporate customers. Organized into infrastructure projects, energy projects, hi-tech manufacturing, IT and technology services, financial services, and development projects, Larsen & Toubro plays a central role in enabling large-scale capital formation and industrial capacity across India and international markets.