


Larsen & Toubro Ltd (LT)
Stock Analysis Report
Stock Journey
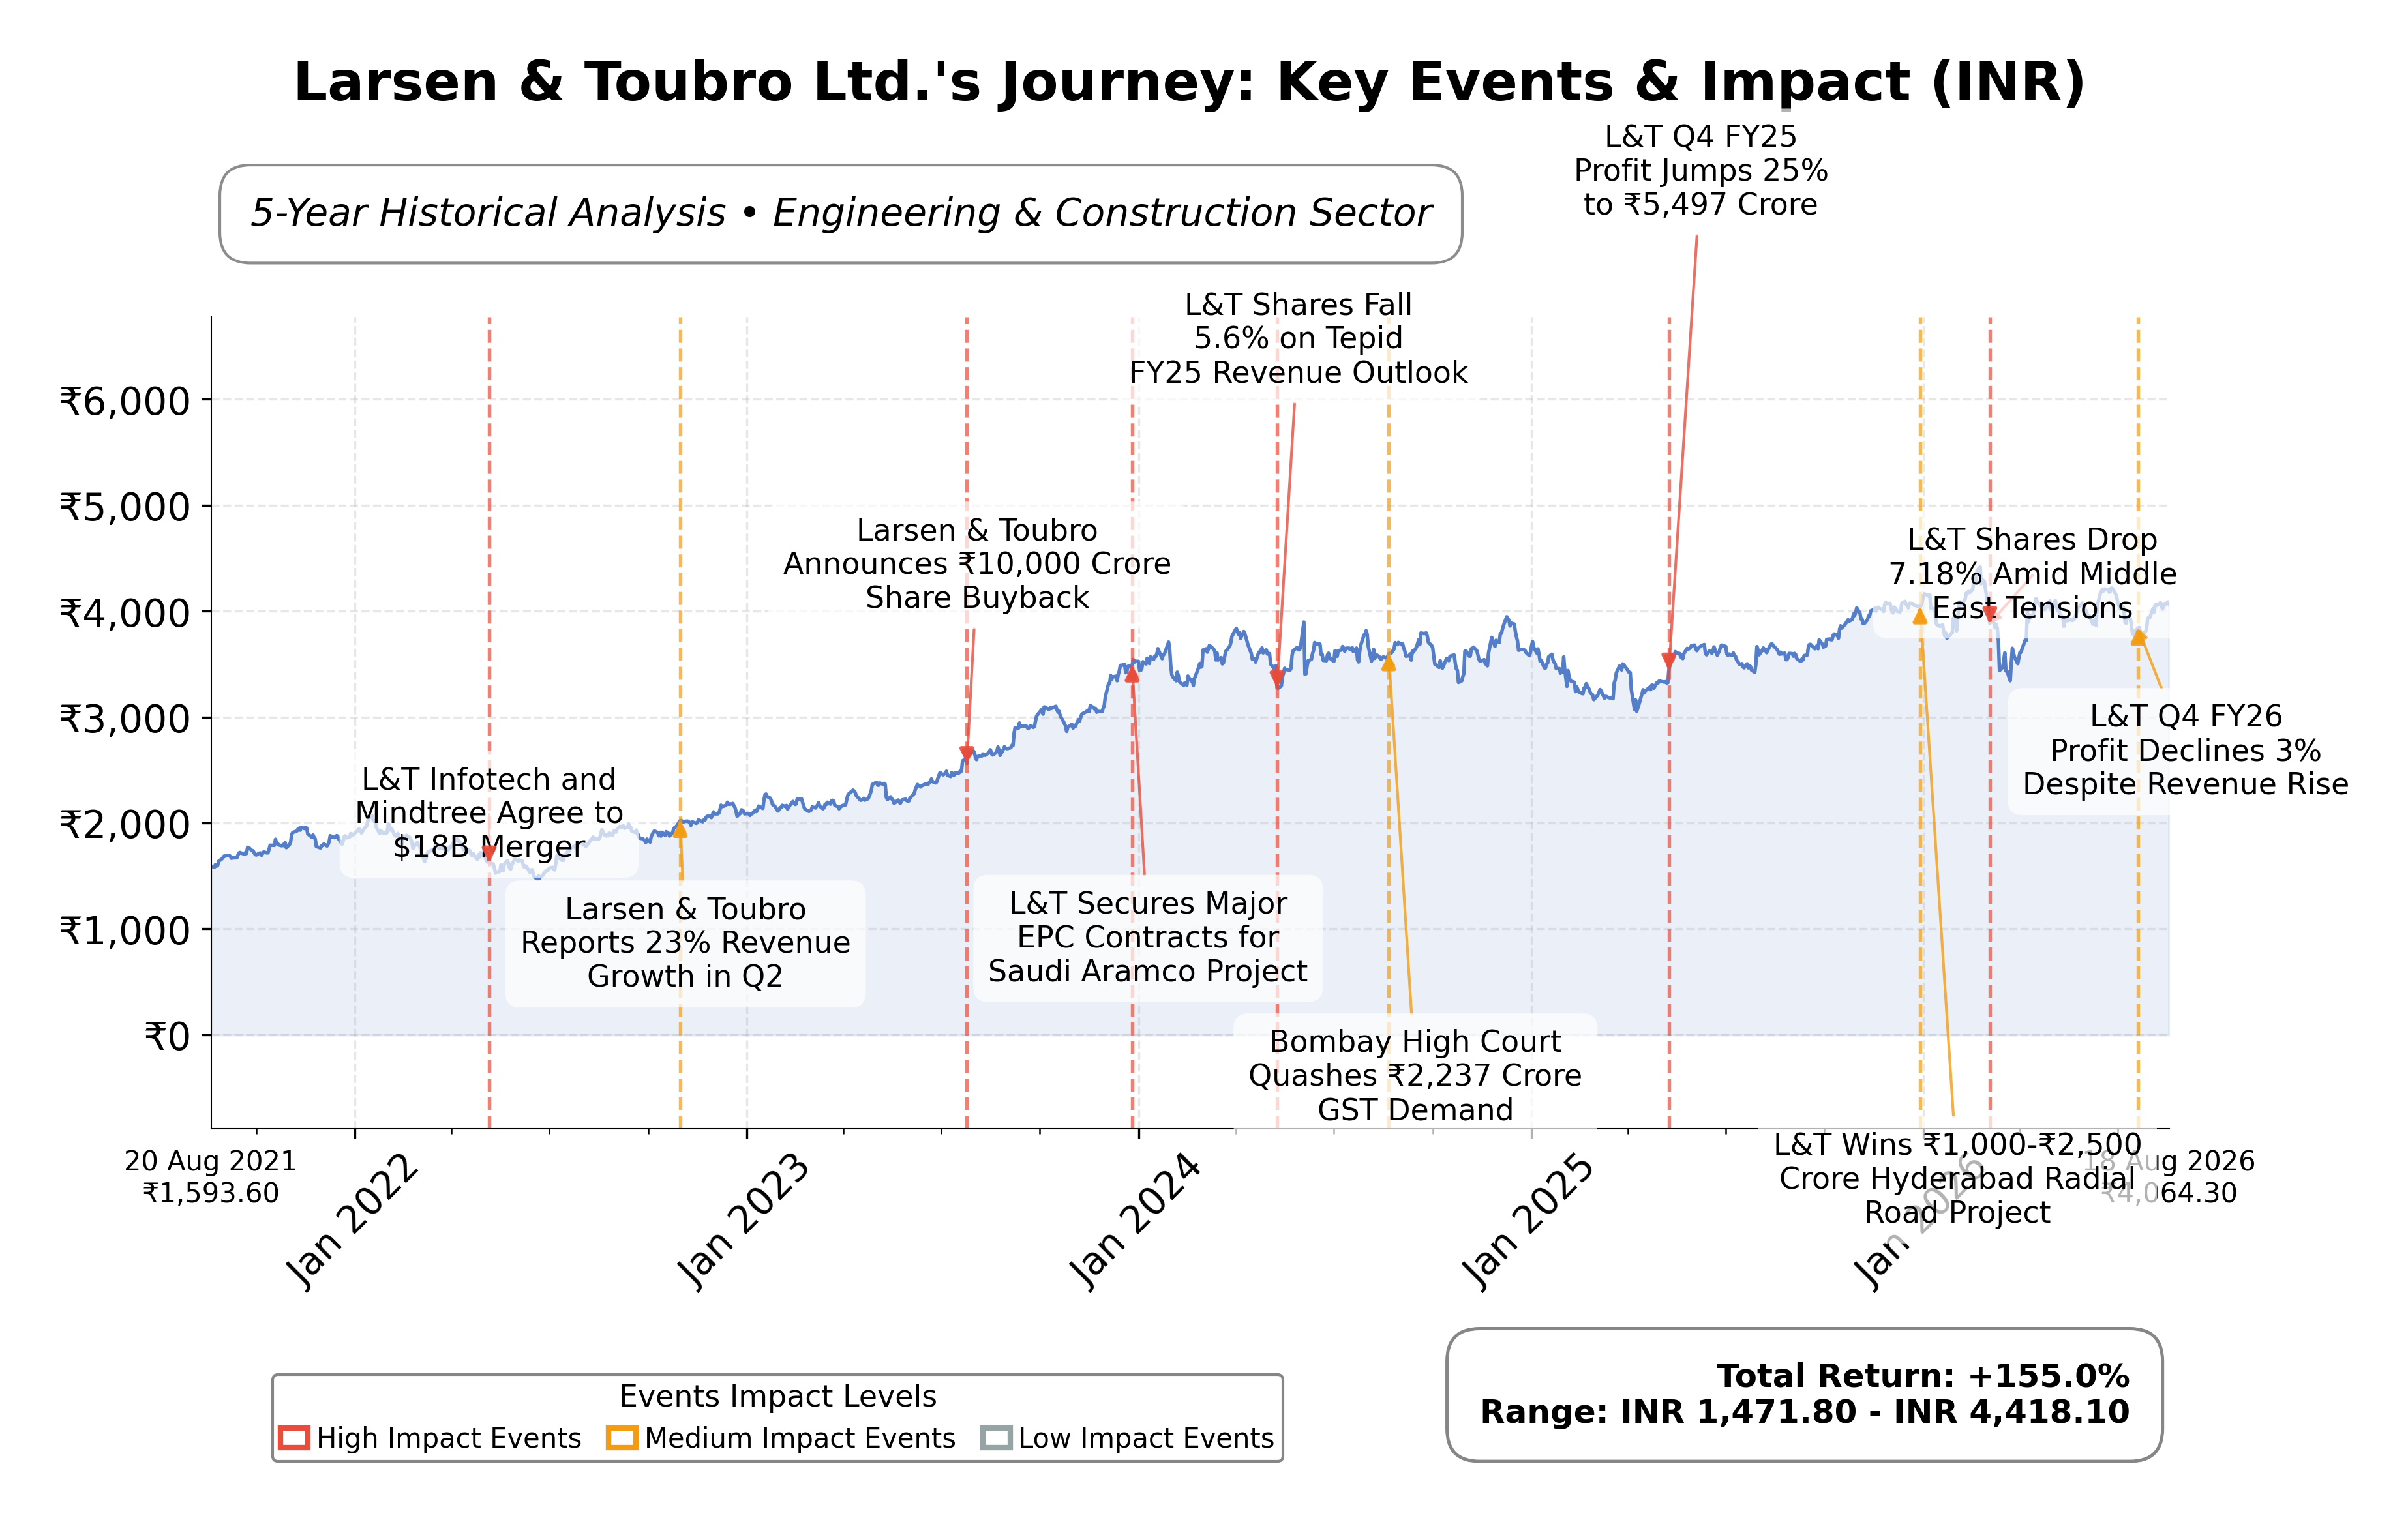
Key Positives and Key Risks
Pros
- Larsen & Toubro’s trailing P/E ratio of 32.47 and forward P/E of 20.66 indicate reasonable valuation relative to growth prospects and industry average P/E of 32.47.
- The company’s quarterly revenue growth of 11.7% and strong operating cash flow of INR 167.4 billion demonstrate healthy business expansion and cash generation.
- L&T’s return on equity of 16.95% reflects efficient use of shareholder capital and competitive profitability within the sector.
Cons
- The debt-to-equity ratio of 97.64% highlights significant leverage, which may pose financial risk if not managed prudently.
- Net profit margin of 5.52% is moderate, indicating pressure on profitability from capital-intensive operations and competitive market conditions.
- Execution risks related to large-scale infrastructure projects and new technology ventures could impact timelines and financial outcomes.
Disclosure: This information is for general awareness and does not constitute investment advice
Report Summary
Larsen & Toubro Ltd. (L&T) is a leading Indian multinational conglomerate operating primarily in the engineering and construction sector, listed on the NSE. The company engages in complex infrastructure and energy-related projects, including buildings, transportation, power transmission, renewable energy, and hydrocarbon plant EPC solutions. L&T also has significant operations in hi-tech manufacturing, defense, aerospace, IT services, and financial services, positioning it as a diversified industrial powerhouse with a strong presence in India and over 50 countries globally.
Financially, L&T reported trailing twelve months (TTM) revenue of approximately INR 2.92 trillion with a gross margin of 30.47%, operating margin of 10.71%, and a net profit margin of 5.52%. The company’s return on equity (ROE) stands at 16.95%, and return on assets (ROA) at 4.59%, indicating efficient capital utilization and moderate profitability. Operating cash flow for the TTM period was INR 167.4 billion, with a levered free cash flow of INR 262 billion, reflecting strong cash generation capacity.
Valuation metrics show a trailing price-to-earnings (P/E) ratio of 32.47 and a forward P/E of 20.66, with a price-to-book (P/B) ratio of 4.77 and an enterprise value to EBITDA (EV/EBITDA) multiple of 17.39. The market capitalization is approximately INR 5.21 trillion. The stock currently trades at INR 4,064, within a 52-week range of INR 3,288 to INR 4,440, suggesting it is positioned closer to its upper price range, reflecting investor confidence relative to fundamentals.
L&T’s strengths include robust cash flow generation, a diversified business model, and a strong order book highlighted by recent mega contracts exceeding INR 15,000 crore in the Middle East. The company maintains a manageable debt-to-equity ratio of 97.64%, supported by a current ratio of 1.25. Risks include exposure to regulatory changes, project execution challenges, and competitive pressures in the engineering and construction industry. Recent strategic moves include divesting its data center and cloud business to Vyoma.AI and entering the AI factory and rare-earth magnet manufacturing sectors, signaling a focus on technology-led growth.
Technically, the stock is trading above its 50-day and 200-day moving averages, with a beta of 0.46 indicating relatively low volatility. Momentum indicators and multi-timeframe analyses suggest a stable upward trend, supported by strong institutional ownership at nearly 50%. The current data implies a market environment favoring cautious accumulation with attention to macroeconomic and sectoral developments.
Company and Industry Overview
Company Basics
Price Performance
Company Size
Shareholding Pattern
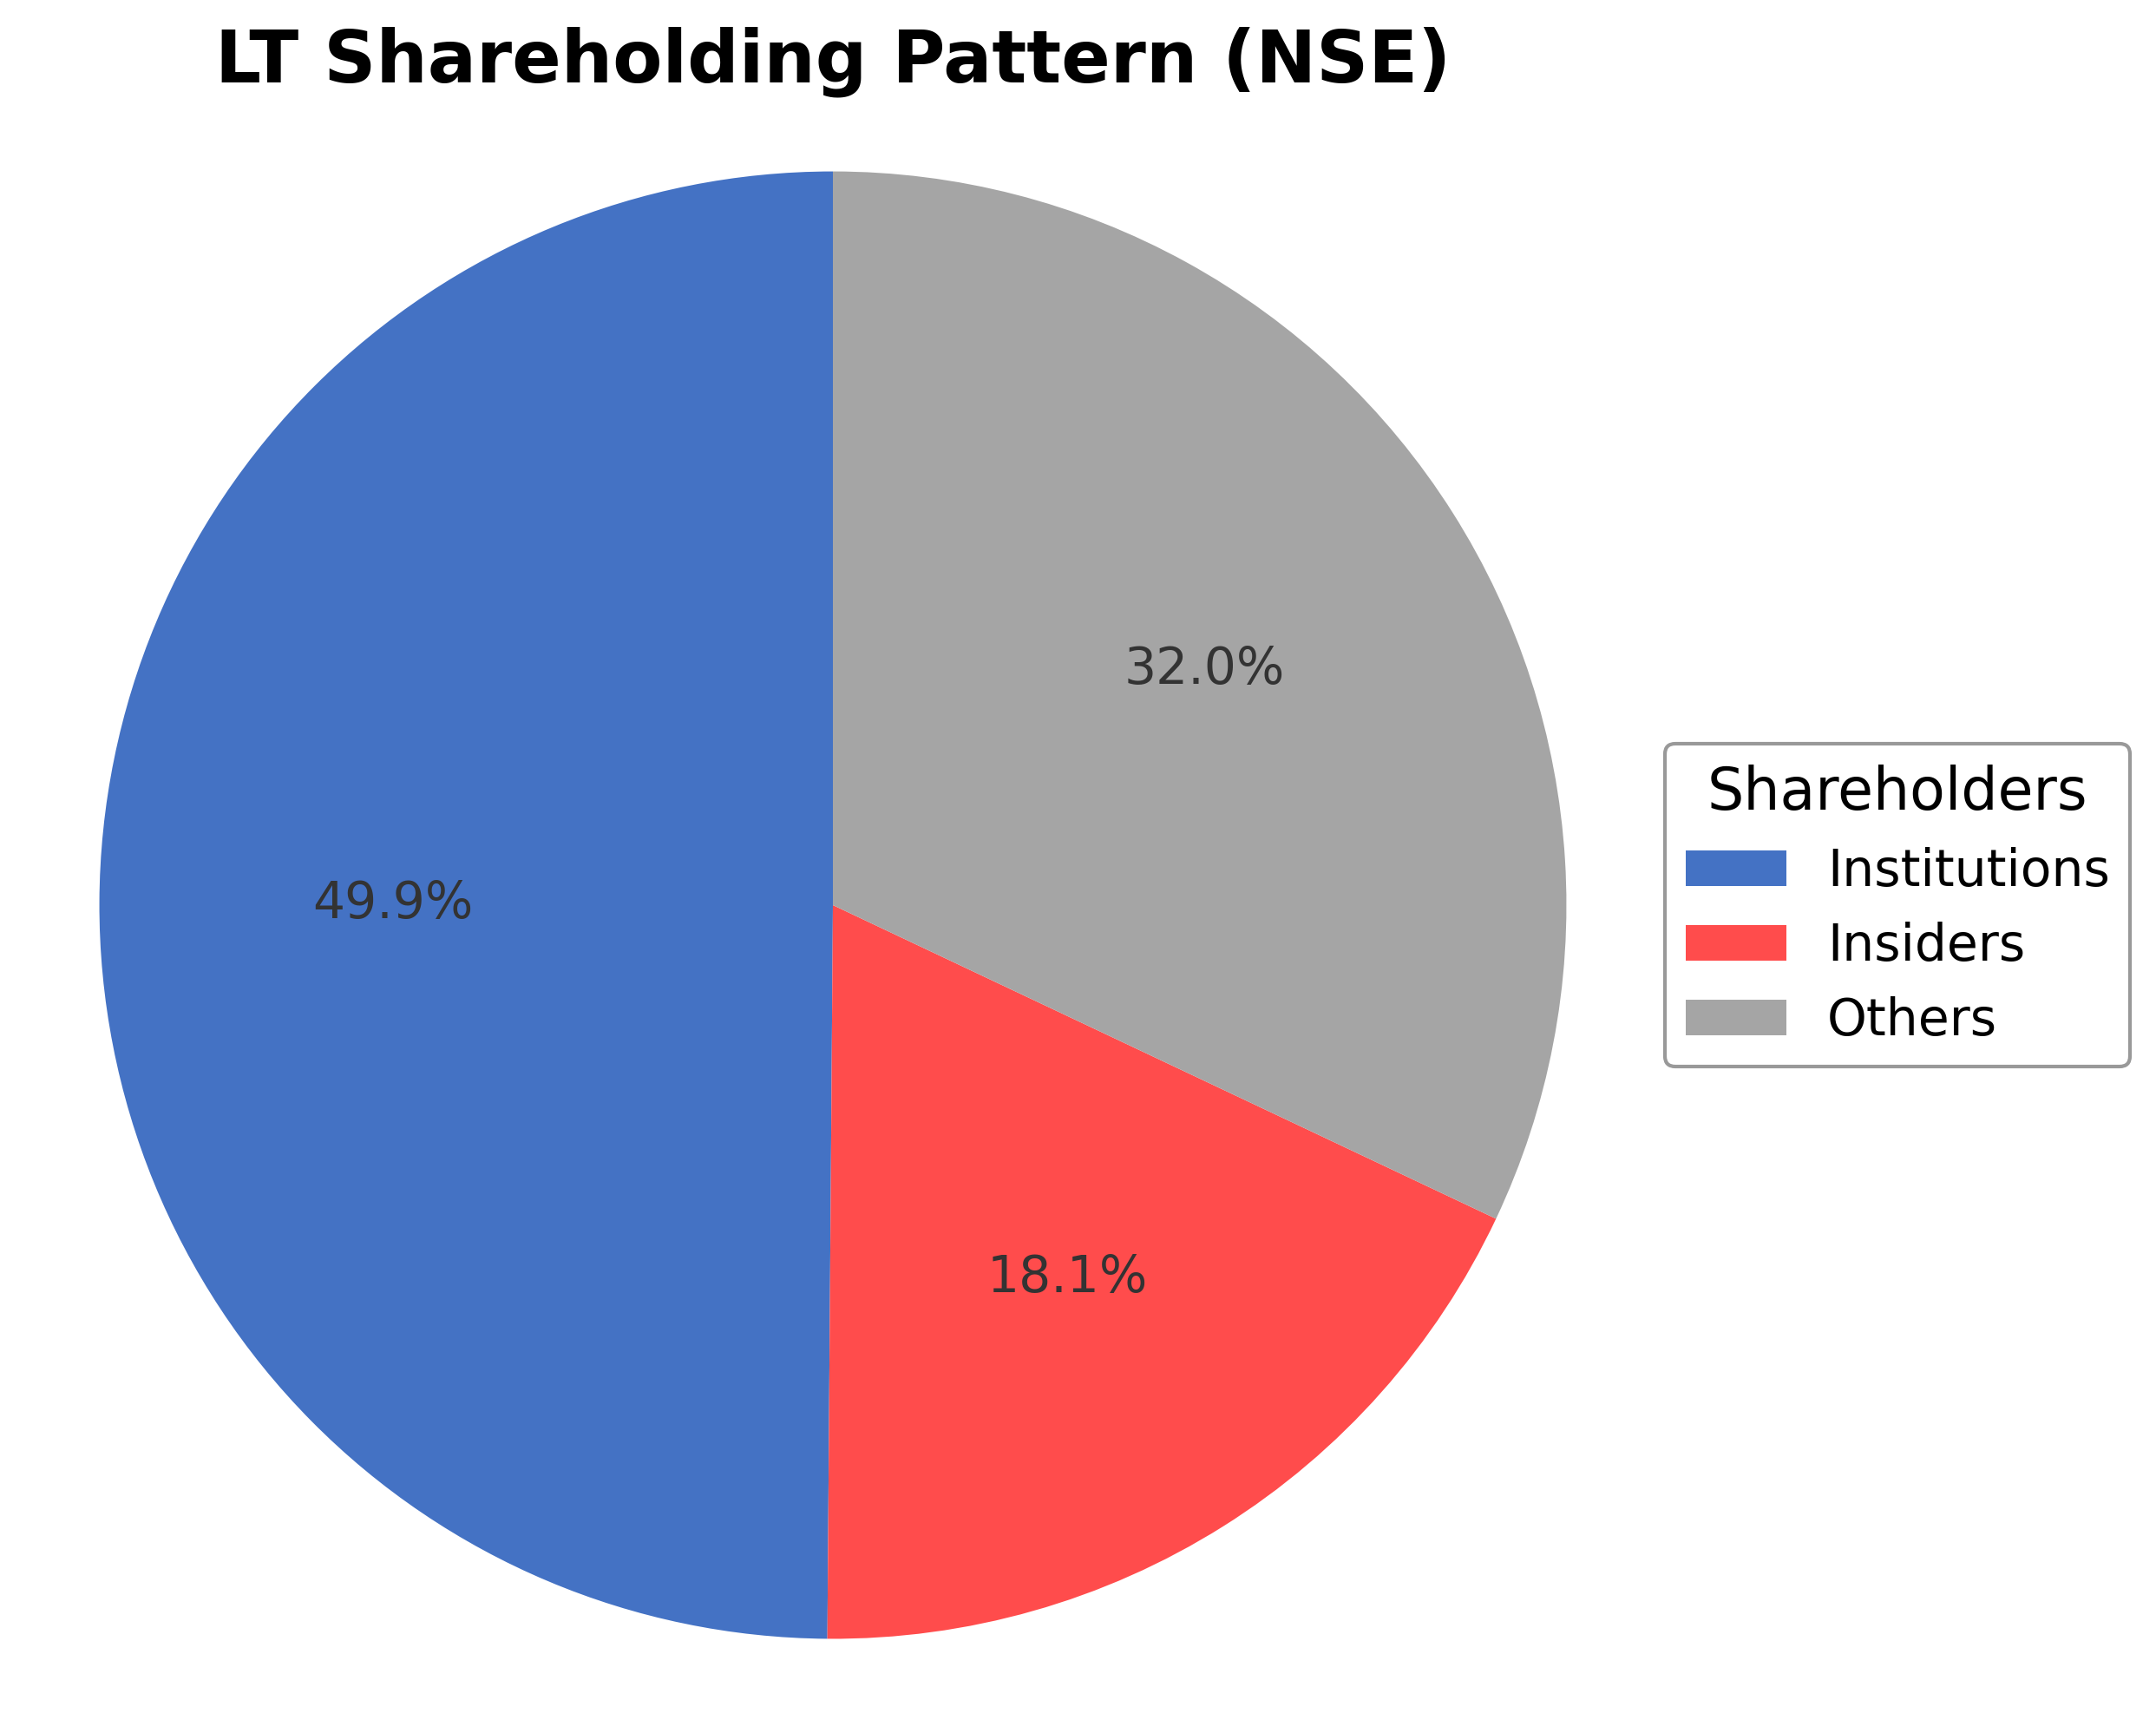
Larsen & Toubro Ltd. exhibits a shareholding structure dominated by institutional investors holding 49.88%, insiders including promoters and executives at 18.09%, and public shareholders comprising approximately 32.03%. Over the past 12-24 months, institutional ownership has remained stable with selective accumulation by major mutual funds and asset managers, reflecting steady confidence in the company’s strategic direction. The significant promoter stake ensures aligned governance, while diversified institutional participation supports liquidity and market depth. This ownership pattern suggests balanced market sentiment, providing a foundation for disciplined corporate governance and sustained capital allocation aligned with long-term industrial and infrastructure growth trends in India and abroad.
Sector and Industry Analysis
The engineering and construction sector in India, where Larsen & Toubro operates, is a significant contributor to the country's infrastructure development, with a market size valued in the hundreds of billions of dollars. The sector is experiencing steady growth driven by government initiatives in urban development, transportation, and energy infrastructure. Key players include Larsen & Toubro, Tata Projects, and Reliance Infrastructure, which dominate due to their scale and diversified capabilities.
Industry trends highlight a shift towards integrated project delivery and increased adoption of digital technologies such as BIM (Building Information Modeling) and automation to enhance efficiency. Competitive dynamics are shaped by high capital requirements and technical expertise, creating substantial barriers to entry for new firms. Established companies leverage their strong project execution track record and extensive supply chain networks to maintain market leadership.
The regulatory environment is influenced by government policies promoting infrastructure investment and public-private partnerships, alongside stringent environmental and safety standards. Compliance with these regulations requires significant operational adjustments but also opens opportunities for firms with advanced capabilities. Ongoing reforms aimed at streamlining approvals and enhancing transparency are expected to improve project execution timelines and sector attractiveness.
Note: Analysis synthesized from industry research, market reports, and regulatory filings. Information is subject to change based on market conditions.
Financial Ratios Dashboard
Illustrative Scenario Analysis
DCF Assumptions:
Method: Two-Stage EPS-Priority Model
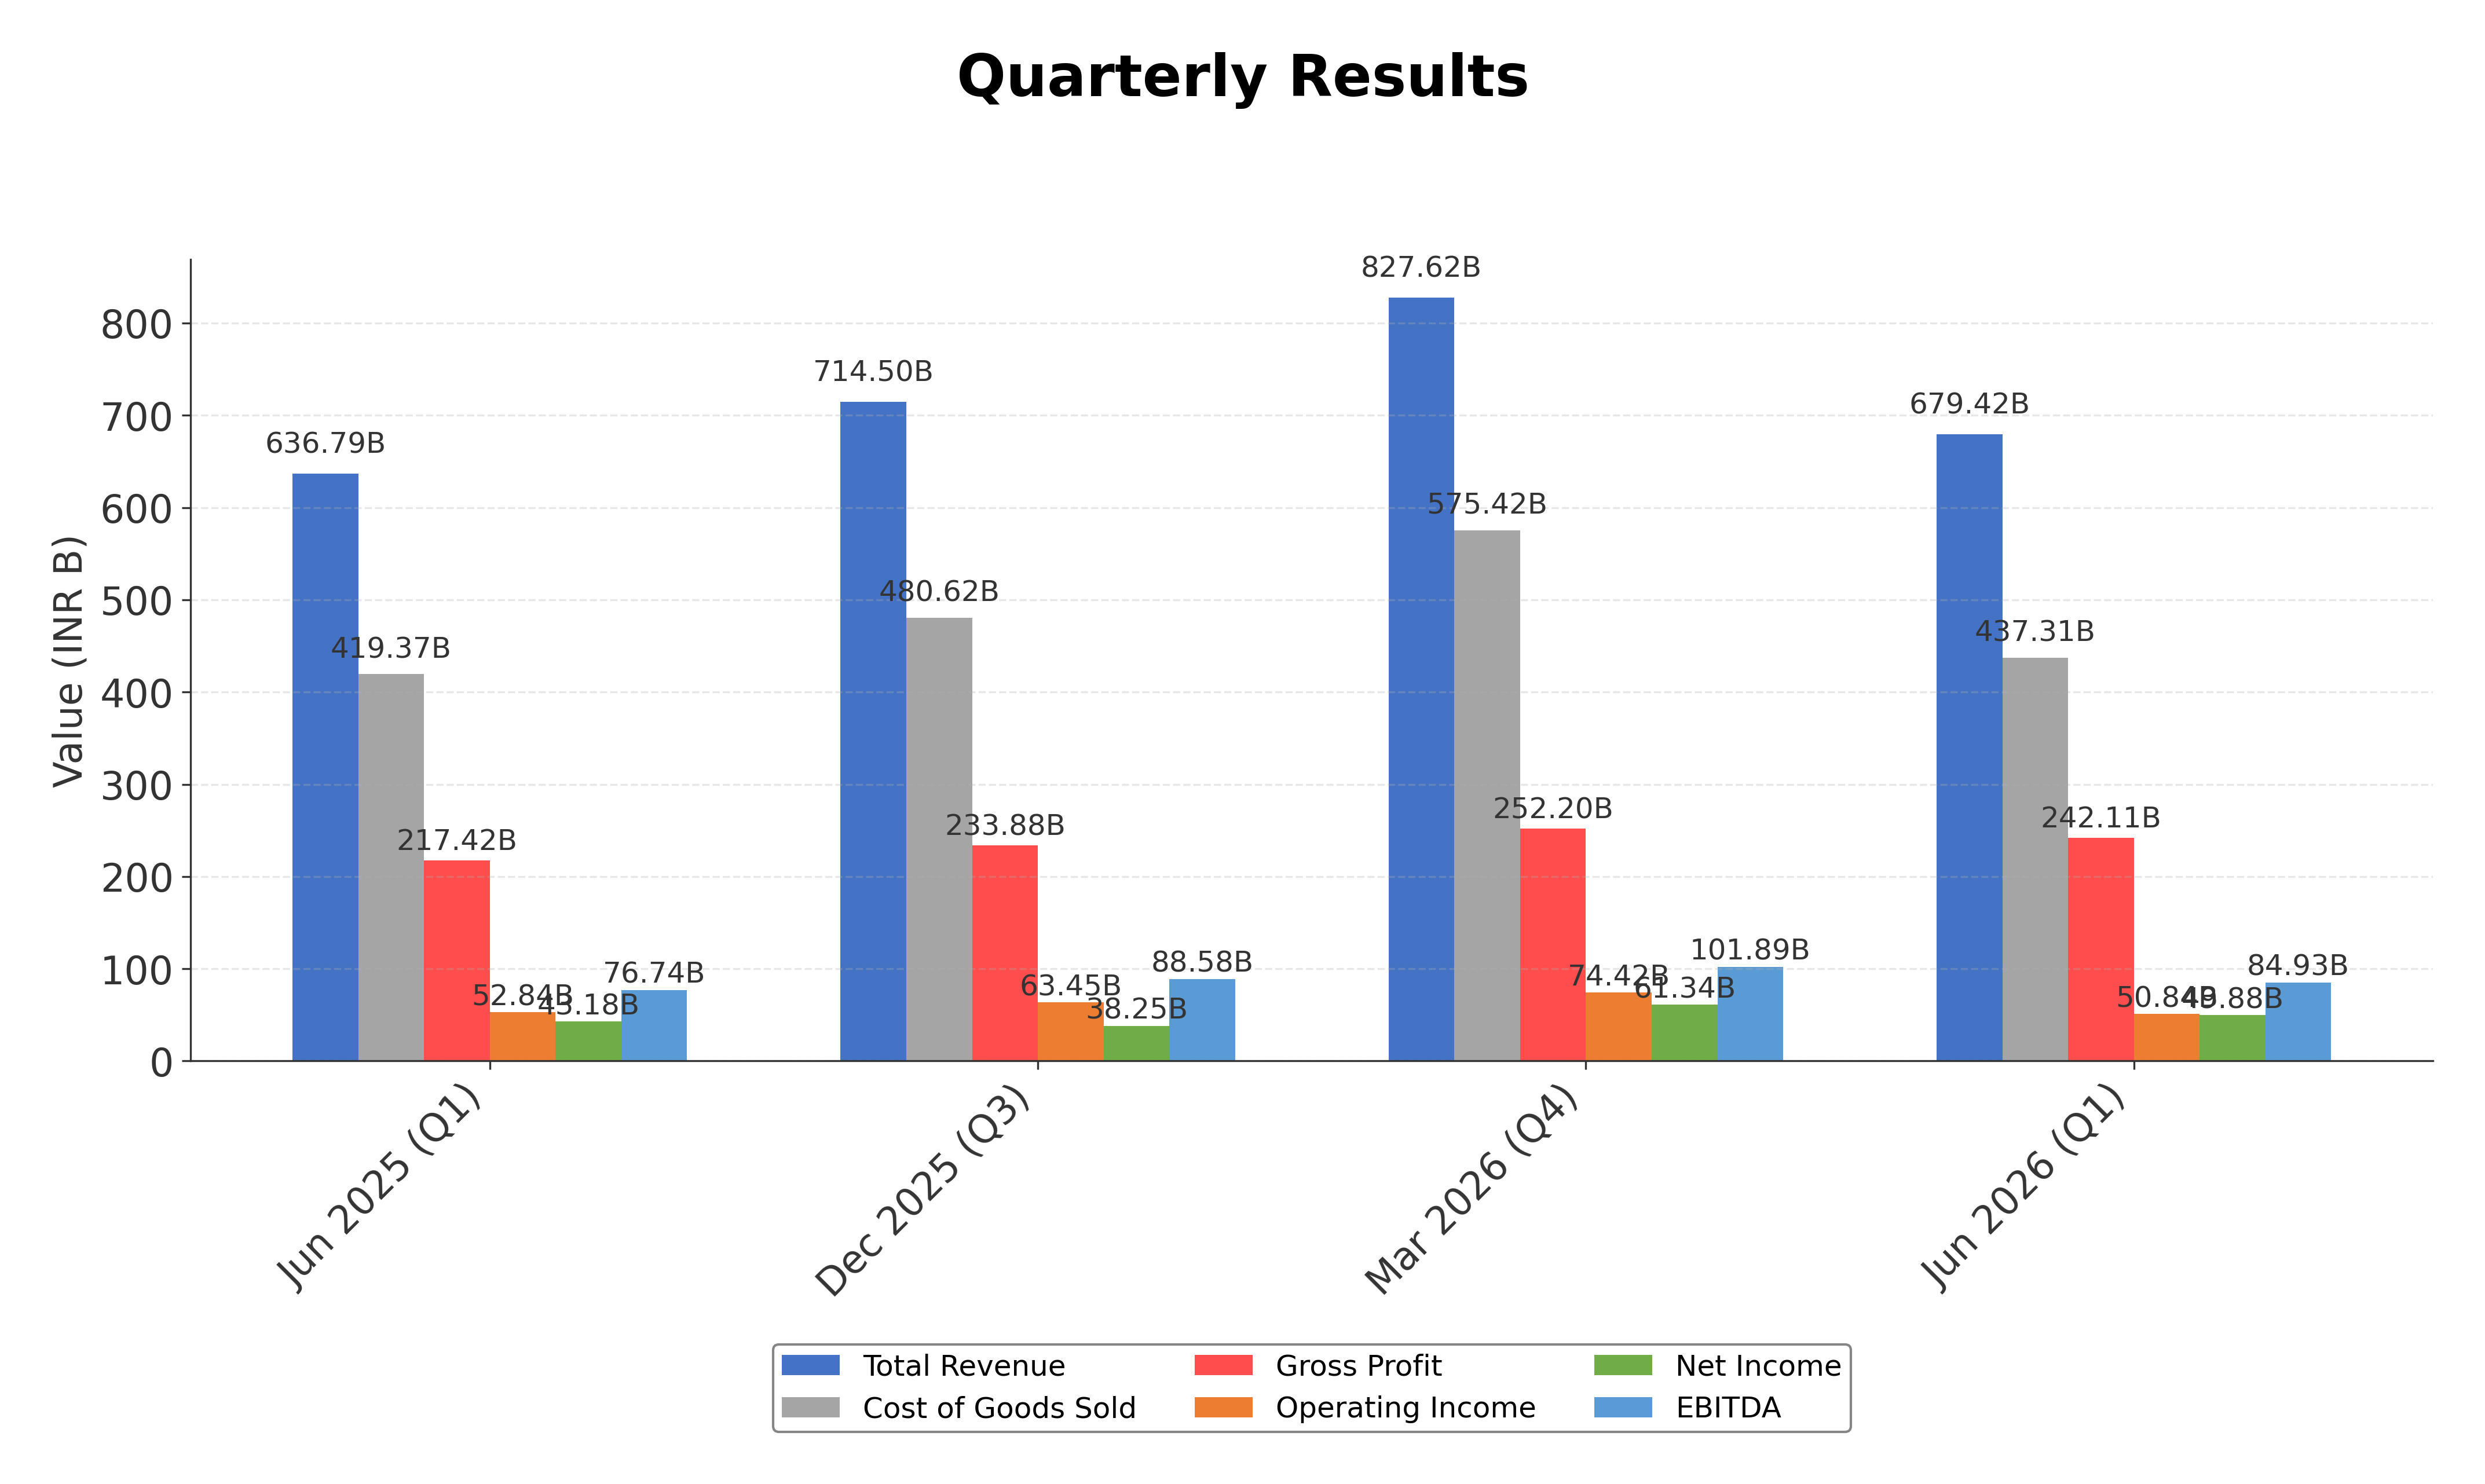
Financials
Peer Analysis
| Company Name | Market Cap | P/E Ratio | P/B Ratio | EV/EBITDA | Price to CFO |
|---|---|---|---|---|---|
| Larsen & Toubro Ltd. | ₹5.21T | 32.47 | 4.77 | 17.39 | 31.11 |
| Siemens Ltd. | ₹1.31T | 77.7 | 9.49 | 66.28 | -368.14 |
| ABB India Ltd. | ₹1.54T | 99.73 | 19.72 | 79.23 | 126.58 |
| Thermax Ltd. | ₹508.50B | 70.43 | 9.16 | 49.48 | 93.9 |
| Bharat Heavy Electricals Ltd. | ₹1.45T | 59.53 | 5.56 | 49.71 | 24.08 |
| Kec International Ltd. | ₹125.09B | 20.65 | 2.03 | 10.48 | -30.2 |
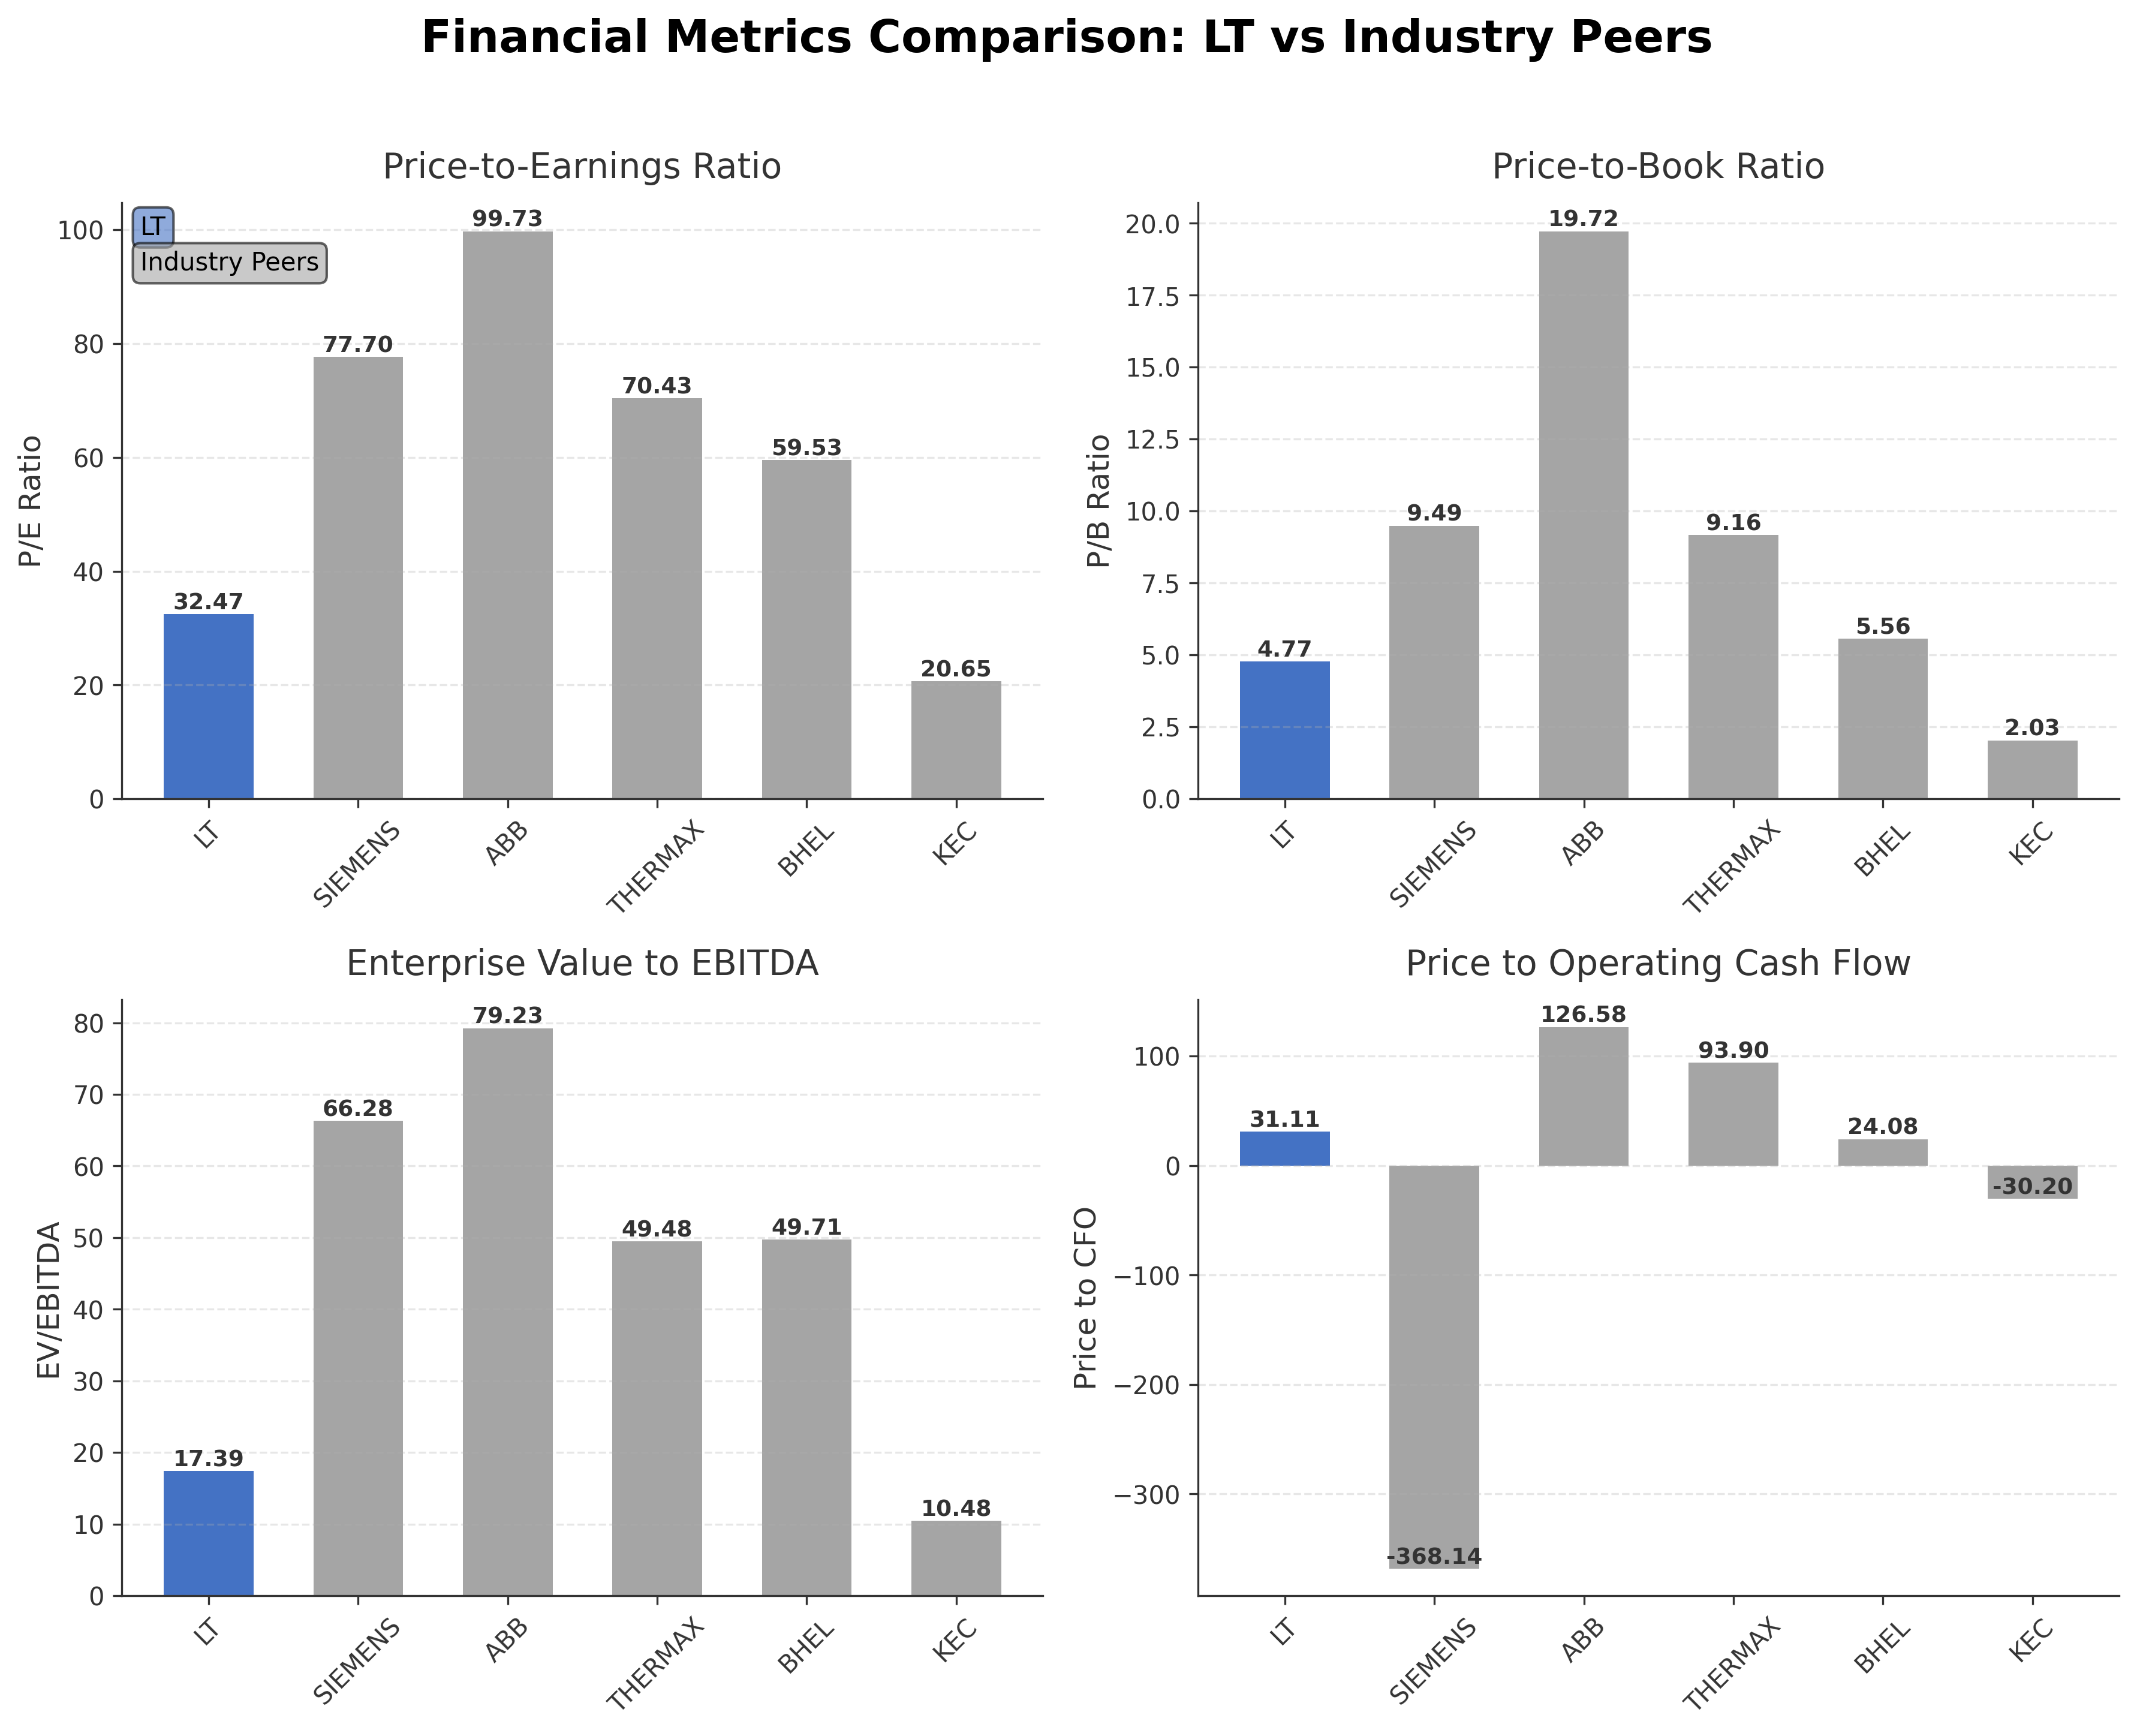
Comparison Analysis: Larsen & Toubro Ltd. stands out among its Indian engineering and construction peers with a market capitalization of ₹5.21 trillion, significantly larger than its competitors. Its P/E ratio of 32.47 is substantially lower than Siemens, ABB, and Thermax, indicating relatively more attractive valuation versus those peers despite strong profitability. L&T’s P/B ratio of 4.77 is moderate compared to the high multiples of ABB and Siemens, reflecting balanced market pricing. The EV/EBITDA multiple of 17.39 is considerably lower than the sector heavyweights, suggesting better operational efficiency or valuation discipline. Return on equity at 16.95% is competitive, outperforming most peers except ABB, which reports 21.29%. Overall, L&T demonstrates a blend of scale, profitability, and valuation metrics that position it favorably within its regional industry cohort.
Financial Metrics Comparison with Peers
Financial Statements
Comprehensive financial data including income, balance sheet, and cash flow metrics
Income Statement
| fiscal_date | 2026-03-31 | 2025-03-31 | 2024-03-31 | 2023-03-31 | 2022-03-31 |
|---|---|---|---|---|---|
| Sales | 2842.25B | 2542.09B | 2191.16B | 1816.61B | 1556.72B |
| Cost Of Goods | 1930.49B | 1711.69B | 1460.29B | 1166.15B | 998.87B |
| Gross Profit | 911.76B | 830.40B | 730.87B | 650.46B | 557.86B |
| Operating Expense Selling General And Administrative | 63.06B | 61.49B | 52.59B | 46.38B | 38.91B |
| Operating Expense Other Operating Expenses | 23.50B | 3.91B | 21.79B | 13.36B | 3.83B |
| Operating Income | 270.71B | 264.78B | 217.31B | 195.01B | 193.41B |
| Non Operating Interest Income | 31.62B | 24.71B | 24.47B | 18.17B | 10.63B |
| Non Operating Interest Expense | 28.47B | 33.31B | 35.37B | 31.78B | 30.55B |
| Pretax Income | 259.76B | 235.79B | 205.17B | 171.09B | 144.95B |
| Income Tax | 68.16B | 58.91B | 49.47B | 44.84B | 42.04B |
| Net Income | 189.54B | 176.73B | 155.47B | 125.31B | 104.19B |
| Eps Basic | 116.93 | 109.36 | 93.96 | 74.51 | 61.71 |
| Eps Diluted | 116.88 | 109.28 | 93.88 | 74.45 | 61.65 |
| Basic Shares Outstanding | 1.38B | 1.37B | 1.39B | 1.41B | 1.40B |
| Diluted Shares Outstanding | 1.38B | 1.37B | 1.39B | 1.41B | 1.40B |
| Ebit | 288.23B | 269.10B | 240.54B | 202.87B | 175.50B |
| Ebitda | 363.34B | 336.48B | 288.61B | 261.61B | 245.56B |
| Net Income Continuous Operations | 276.98B | 231.04B | 204.24B | 169.73B | 143.98B |
| Minority Interests | -28.70B | -26.36B | -24.88B | -20.60B | -17.50B |
| Preferred Stock Dividends | 0.00 | 0.00 | 0.00 | 0.00 | 0.00 |
Data provided by Twelve Data
Balance Sheet
| fiscal_date | 2026-03-31 | 2025-03-31 | 2024-03-31 | 2023-03-31 | 2022-03-31 |
|---|---|---|---|---|---|
| Cash And Cash Equivalents | 153.91B | 121.87B | 119.58B | 169.27B | 137.70B |
| Accounts Receivable | 604.61B | 537.14B | 487.71B | 447.32B | 461.39B |
| Total Assets | 4525.50B | 3795.24B | 3396.27B | 3303.52B | 3200.67B |
| Total Liabilities | 3240.19B | 2641.20B | 2370.78B | 2267.85B | 2246.94B |
| Long Term Debt | 665.06B | 597.69B | 582.42B | 628.64B | 630.36B |
| Shareholders Equity | 1285.30B | 1154.04B | 1025.50B | 1035.67B | 953.74B |
Data provided by Twelve Data
Cash Flow Statement
| fiscal_date | 2026-03-31 | 2025-03-31 | 2024-03-31 | 2023-03-31 | 2022-03-31 |
|---|---|---|---|---|---|
| Operating Activities Net Income | 276.98B | 231.04B | 204.24B | 169.73B | 143.98B |
| Operating Activities Stock Based Compensation | 1.15B | 2.23B | 2.98B | 2.50B | 1.35B |
| Operating Activities Other Non Cash Items | -5.30B | 7.02B | 10.39B | 13.50B | 20.01B |
| Operating Activities Accounts Receivable | -533.84B | -245.24B | -161.36B | 4.42B | -48.47B |
| Operating Activities Other Assets Liabilities | -22.01B | -5.40B | 2.45B | -4.76B | -743.30M |
| Operating Activities Operating Cash Flow | 167.41B | -10.35B | 58.68B | 185.39B | 116.13B |
| Investing Activities Net Acquisitions | -11.46B | -3.65B | 8.53B | 27.63B | 9.28B |
| Investing Activities Purchase Of Investments | -129.46B | -82.35B | -48.89B | -97.82B | -21.56B |
| Investing Activities Sale Of Investments | 11.90B | 17.26B | 76.29B | 8.27B | 24.63B |
| Investing Activities Other Investing Activity | 26.92B | -71.92B | -49.70M | -1.12B | -28.44B |
| Investing Activities Investing Cash Flow | -102.10B | -176.06B | -6.23B | -100.97B | -46.49B |
| Financing Activities Long Term Debt Issuance | 436.94B | 464.97B | 231.25B | 282.98B | 273.93B |
| Financing Activities Long Term Debt Payments | -364.03B | -307.82B | -272.28B | -327.95B | -358.06B |
| Financing Activities Common Stock Issuance | 75.20M | 93.20M | 96.50M | 103.10M | 109.70M |
| Financing Activities Common Dividends | -46.76B | -38.50B | -42.17B | -30.91B | -25.28B |
| Financing Activities Other Financing Charges | -8.77B | -11.46B | -30.12B | -5.25B | -8.76B |
| Financing Activities Financing Cash Flow | 17.44B | 107.28B | -213.48B | -81.02B | -118.06B |
| End Cash Position | 153.91B | 121.87B | 119.58B | 169.27B | 137.70B |
| Free Cash Flow | 119.32B | 47.33B | 137.50B | 186.33B | 160.53B |
| Investing Activities Capital Expenditures | N/A | -35.41B | -42.10B | -37.93B | -30.40B |
| Financing Activities Common Stock Repurchase | N/A | 0.00 | -100.27B | 0.00 | N/A |
Data provided by Twelve Data
Technical Analysis
Key Insights
- Larsen & Toubro’s stock is currently in an upward trend, trading above its 10-day, 50-day (₹4,000.37), and 200-day (₹3,969.03) moving averages, indicating sustained bullish momentum.
- Key support levels are identified near ₹3,950 and ₹3,800, while resistance is observed around the 52-week high of ₹4,440, marking critical price points for potential consolidation or breakout.
- The stock’s position above major moving averages suggests strong medium- to long-term trend strength, with the 50-day and 200-day averages converging closely, indicating stability.
- Momentum indicators show a Relative Strength Index (RSI) in the mid-60s range, MACD positive but approaching a potential crossover, and Stochastic oscillators reflecting moderate overbought conditions.
- Multi-timeframe analysis across daily, weekly, and monthly charts confirms a consistent uptrend with no significant reversal signals, supporting a continuation of current price action.
- Potential market scenarios include a gradual ascent toward the 52-week high if momentum sustains or a short-term pullback to support zones before resuming upward movement.
Trending News
1. Headline: From dairy machines to AI factory: L&T is future-proofing its empire - The Economic Times
Summary: Larsen & Toubro is entering a new phase of diversification, using its engineering, infrastructure and financial strength to build technology-led businesses. The recently-won Rs 15,000 crore AI factory contract is part of a broader strategy spanning electronics, semiconductors, green hydrogen, ...
Sentiment: positive
Summary: Larsen Share Price: Find the latest news on Larsen Stock Price. Get all the information on Larsen with historic price charts for NSE / BSE. Experts & Broker view also get the Larsen Ltd. buy/sell tips detailed news, announcements, Forecasts, Analysts, Valuation, Earning forecasts, Estimates, ...
Sentiment: neutral
3. Headline: L&T shares recover from day’s low on bagging ultra-mega order worth over ₹15,000 crore in Middle East
Summary: The company in a regulatory filing also said that the award reinforces LTEH Offshore’s long-standing presence in the Middle East.
Sentiment: positive
4. Headline: Larsen & Toubro wins offshore development project in Middle East | Capital Market News - Business Standard
Summary: L&T Energy Hydrocarbon Offshore (LTEH Offshore) has secured an ultra mega order from a prestigious client in the Middle East. The project involves the development of multiple offshore facilities. According to the company's project classification, the order is valued above Rs 15000 crore.
Sentiment: positive
5. Headline: L&T bags offshore development project order exceeding Rs 15,000 crore from Middle East client - The Economic Times
Summary: The order represents one of the ... Larsen & Toubro, adding that the scale and complexity of the project call for deep engineering expertise, integrated project execution capabilities and flawless coordination across multiple workstreams. ... L&TLarsen & ToubroL&T share priceMiddle East clientLarsen & Toubro Limitedenergy hydrocarbon divisionoffshore development projectoffshore facilitieslarsen & toubro ltdL&T project · (Catch all the Business News, Breaking ...
Sentiment: neutral
Powered by Brave
Recent Updates
News Summary
As of 2026-08-17. Larsen & Toubro secured a significant offshore development project order exceeding Rs 15,000 crore from a Middle East client, awarded to its Energy Hydrocarbon Offshore division. The contract covers engineering, procurement, construction, installation, and commissioning of multiple offshore facilities, with fabrication primarily at L&T’s advanced manufacturing units. This order is among the largest offshore developments in the Middle East, reflecting increased investment to meet future energy demands. Additionally, L&T announced plans to manufacture rare-earth magnets domestically, aligning with government efforts to reduce import dependence and challenge China’s dominance in this sector. This initiative leverages L&T’s defense and capital goods expertise but involves execution risks related to feedstock sourcing and technology licensing.
News Sentiment
The overall sentiment from recent updates is cautiously positive, driven by the award of a mega offshore project exceeding Rs 15,000 crore, which reinforces L&T’s leadership in energy infrastructure and offshore EPC capabilities. The announcement of rare-earth magnet manufacturing plans adds a strategic growth dimension aligned with government localization policies, though it carries execution uncertainties. Market reactions to these developments have been favorable, reflecting confidence in L&T’s diversified business model and project execution strength. Neutral tones emerge from the complexity and long-term nature of new ventures, balancing enthusiasm with prudent assessment of operational risks. The combined news suggests a stable outlook supported by strong order inflows and strategic diversification.
Source List
- https://economictimes.indiatimes.com/industry/indl-goods/svs/engineering/lt-bags-offshore-development-project-order-exceeding-rs-15000-crore-from-middle-east-client-larsen-toubro-ltd-share-price/articleshow/133288346.cms
- https://www.newsquawk.com/headlines/pre-market-indian-stocks-news-larsen--toubro-lt-is-plans-to-manufacture-rare-earth-magnets-in-india-as-it-looks-to-benefit-from-government-efforts-to-reduce-import-dependence-and-loosen-chinas-grip-on-the-critical-industrial-component
Analytical Overview
Analysis Summary
Larsen & Toubro’s valuation metrics, including a trailing P/E of 32.47 and forward P/E of 20.66, are moderate relative to the engineering and construction industry average P/E of 32.47, indicating fair pricing with growth expectations priced in. The company’s revenue growth of 11.7% quarterly and strong operating cash flow trends demonstrate a positive growth trajectory supported by robust project execution and order inflows. Financial health is solid, with a debt-to-equity ratio near 0.98 and substantial cash reserves totaling INR 766 billion, ensuring liquidity and capacity to fund ongoing and new projects. Sector-specific opportunities arise from government infrastructure initiatives, renewable energy expansion, and localization policies, while challenges include project execution risks and regulatory complexities. Considering India-specific factors, L&T benefits from favorable government infrastructure spending and strategic initiatives to reduce import dependence, enhancing its competitive positioning.
Overall Business and Market Assessment
Supporting Factors: L&T’s diversified business model with strong presence in infrastructure and energy sectors, robust cash flow generation, and strategic expansion into technology-led projects such as AI factories and rare-earth magnet manufacturing
Risk Factors: project execution delays, regulatory changes, and competitive pressures in both traditional and emerging business segments
SWOT Analysis
Strengths
- Larsen & Toubro has a diversified business portfolio spanning infrastructure, energy, manufacturing, IT, and financial services.
- The company demonstrates strong cash flow generation with operating cash flow of INR 167.4 billion and levered free cash flow of INR 262 billion.
- Robust order book highlighted by mega contracts exceeding INR 15,000 crore in the Middle East reinforces market leadership.
- Strong institutional ownership at nearly 50% supports liquidity and governance stability.
Weaknesses
- High debt-to-equity ratio of 97.64% indicates significant leverage requiring careful management.
- Profit margins are moderate with net margin at 5.52%, reflecting capital-intensive operations and competitive pricing pressures.
- Execution risks inherent in large-scale and complex infrastructure projects may impact timelines and profitability.
- Dependence on government policies and regulatory approvals introduces uncertainty.
Opportunities
- Expansion into technology-led sectors such as AI factories and rare-earth magnet manufacturing aligns with government localization initiatives.
- Growing infrastructure and renewable energy investments in India and Middle East offer substantial project pipelines.
- Increasing demand for advanced engineering and EPC solutions in emerging markets supports revenue growth.
- Strategic divestments and restructuring enhance focus on core competencies and digital infrastructure.
Threats
- Regulatory changes and compliance requirements may increase operational costs and delay projects.
- Competitive pressures from domestic and international engineering firms could impact market share.
- Supply chain disruptions and raw material price volatility may affect project costs and margins.
- Geopolitical risks in key international markets like the Middle East could influence project execution.
Company Description
Larsen & Toubro Ltd. is an Indian multinational conglomerate engaged in engineering, procurement and construction projects, hi-tech manufacturing and a broad range of services. Headquartered in Mumbai, the company focuses on delivering complex infrastructure and energy-related facilities, including buildings, transportation systems, heavy civil works, power transmission and distribution, renewable energy, water management, and process industry projects. Its portfolio also spans hydrocarbon and power plant EPC solutions, defense and aerospace systems, shipbuilding, industrial machinery, and advanced forgings, serving governments, large enterprises, and industrial clients across more than 50 countries. Larsen & Toubro further extends its presence through information technology and engineering services, as well as financial services that support project development and corporate customers. Organized into infrastructure projects, energy projects, hi-tech manufacturing, IT and technology services, financial services, and development projects, Larsen & Toubro plays a central role in enabling large-scale capital formation and industrial capacity across India and international markets.