
Kse Ltd (KSE)
Stock Analysis Report
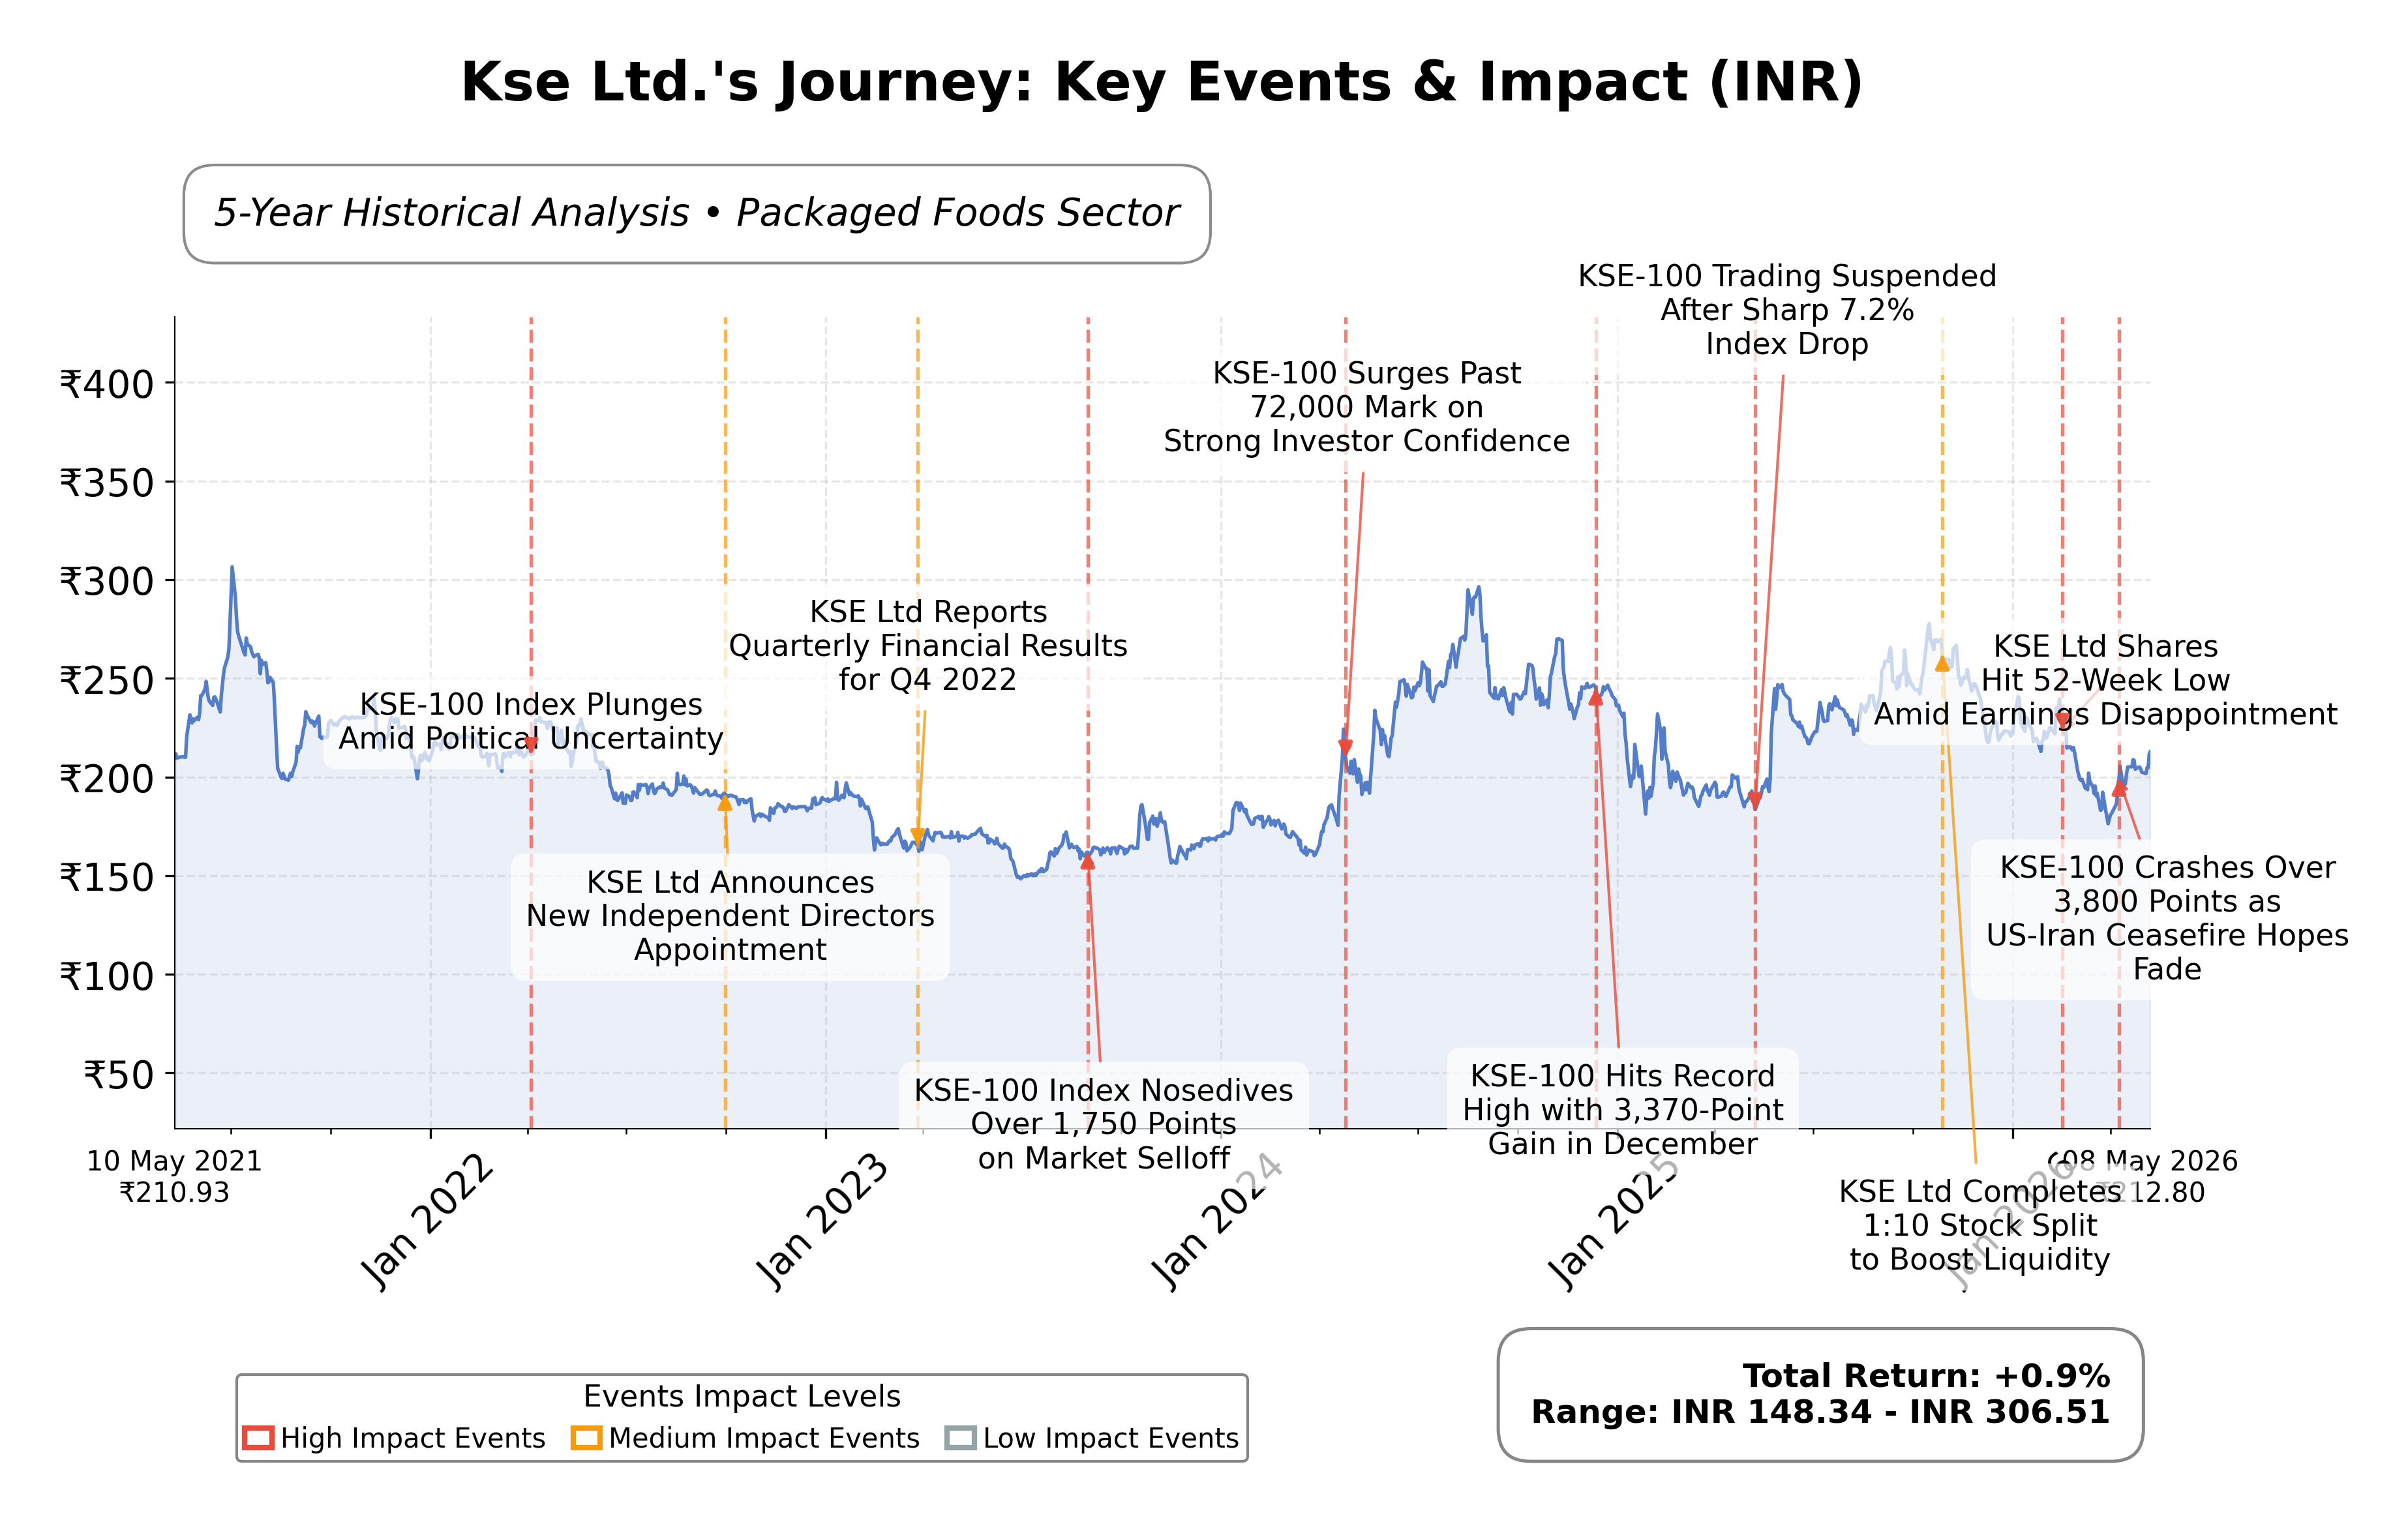
Stock Journey
Key Positives and Key Risks
Pros
- Kse Ltd. exhibits a strong return on equity of 30.77%, indicating efficient use of shareholder capital.
- The company maintains a high current ratio of 6.15, reflecting excellent short-term liquidity and financial stability.
- The stock trades at a low trailing P/E of 5.56, suggesting attractive valuation relative to earnings.
Cons
- Quarterly earnings growth declined by 22.2% year-over-year, signaling potential near-term profitability challenges.
- Institutional investors hold 0% of shares, which may limit market liquidity and external support.
- The operating margin is relatively low at 4.67%, indicating limited operational efficiency.
Disclosure: This information is for general awareness and does not constitute investment advice
Report Summary
Kse Ltd. operates as a financial market infrastructure company listed on the Bombay Stock Exchange (BSE) in India, within the Consumer Defensive sector, specifically the Packaged Foods industry. The company facilitates trading of securities including stocks and bonds, providing a transparent platform that supports liquidity and price discovery. Its services impact multiple sectors such as technology, finance, and real estate by enabling capital raising and efficient market operations. Kse Ltd. holds a significant market position as a key exchange infrastructure player in the Indian financial ecosystem.
Financially, Kse Ltd. reported trailing twelve months (TTM) revenue of approximately INR 16.64 billion with a gross margin of 16.47%, operating margin of 4.67%, and net profit margin of 7.37%. The company demonstrates strong profitability and operational efficiency with a return on equity (ROE) of 30.77% and return on assets (ROA) of 25.60%. Its operating cash flow stands at INR 1.38 billion, supporting sustainable cash generation. Despite a slight quarterly earnings decline year-over-year (-22.2%), the firm maintains solid financial health with a current ratio above 6, indicating strong liquidity.
Valuation metrics show Kse Ltd. trading at a trailing P/E ratio of 5.56 and a price-to-book ratio of 1.94, with an enterprise value to EBITDA multiple of 3.19. The market capitalization is approximately INR 6.81 billion, with the stock price currently at INR 212.80, positioned between its 52-week low of INR 174 and high of INR 284.90. These valuation levels suggest the stock is priced modestly relative to earnings and book value, reflecting conservative market expectations. The PEG ratio is negative, indicating potential challenges in growth projections.
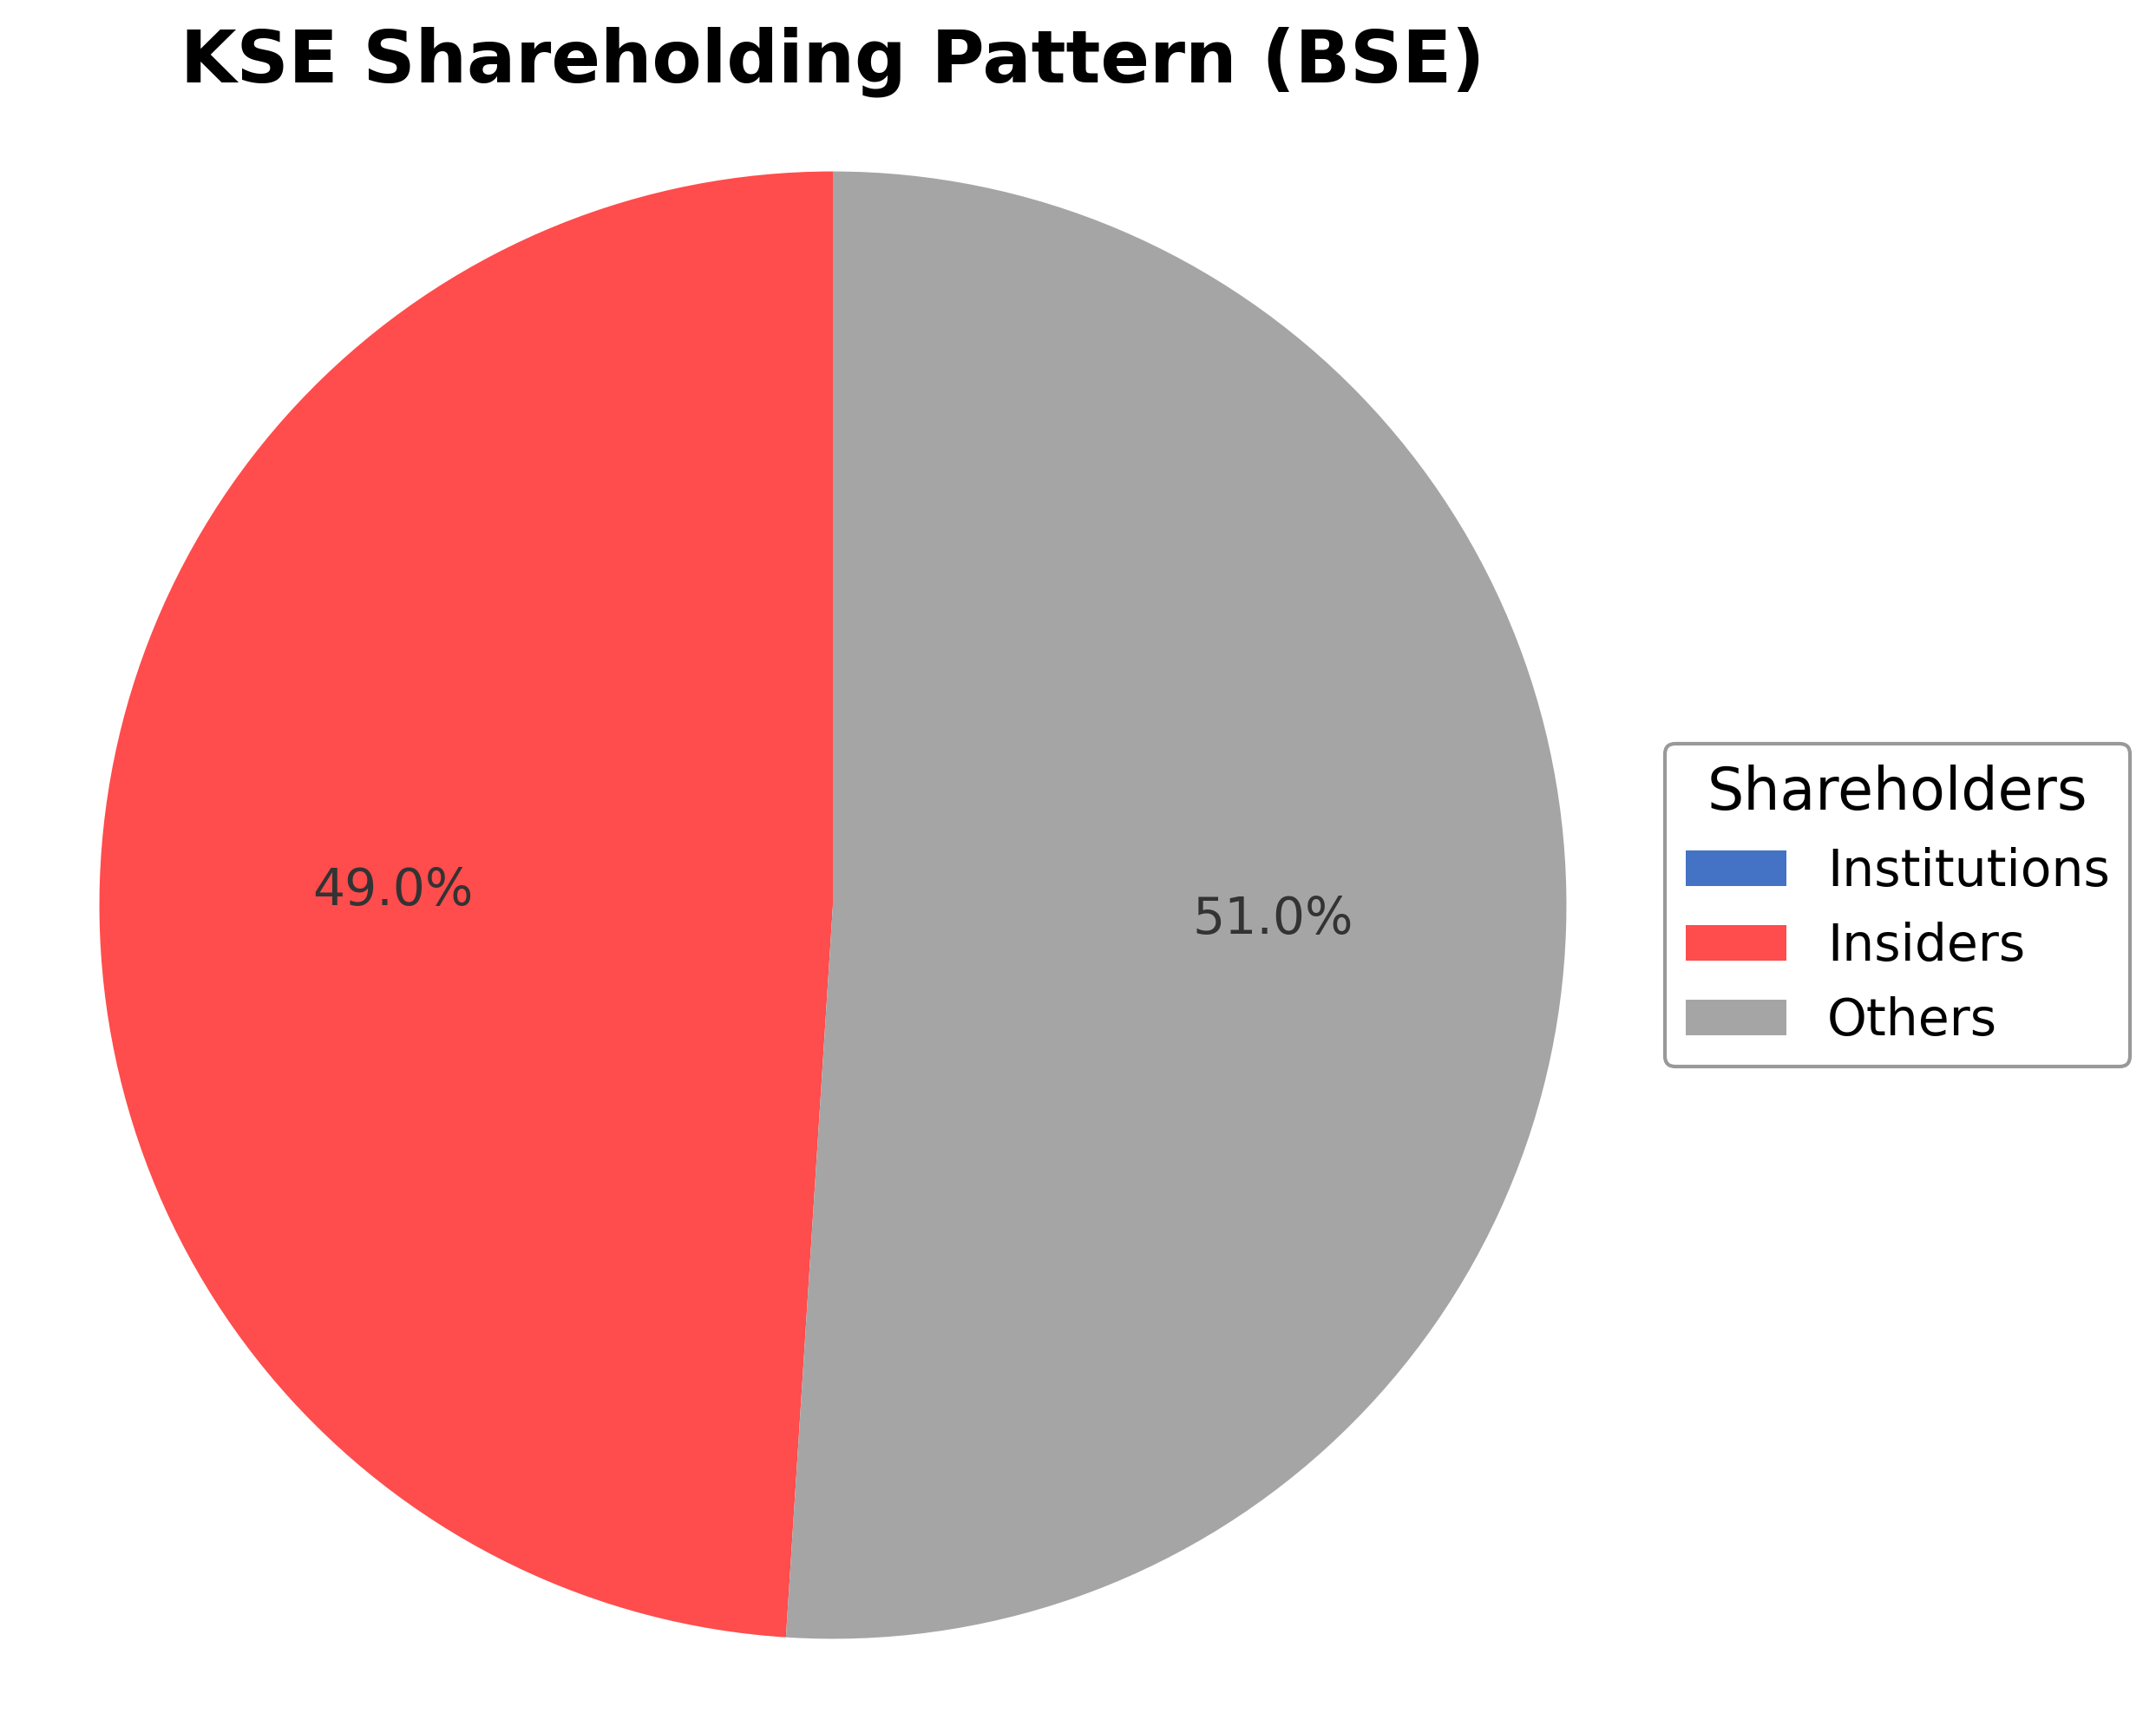
Key strengths include robust cash reserves of nearly INR 1.96 billion and low total debt of around INR 241 million, resulting in a low debt-to-equity ratio of 6.86%. The company benefits from strong insider ownership at 48.98%, indicating aligned management interests, though institutional ownership is currently nil. Risks involve geopolitical tensions impacting regional markets and potential regulatory changes in the financial sector. Recent strategic actions include a 10-for-1 stock split in October 2025 and consistent semi-annual dividend payments with a trailing yield of 25.85%, reflecting shareholder returns focus.
Technically, the stock trades above its 50-day moving average but below the 200-day average, with a beta of 0.35 indicating low volatility relative to the market. Momentum indicators and multi-timeframe analysis suggest mixed signals amid recent price fluctuations. Recent news highlights geopolitical tensions affecting regional markets, with both positive and negative sentiment observed. Overall, current conditions suggest a cautious stance with attention to market developments and company fundamentals.
Company and Industry Overview
Company Basics
Price Performance
Company Size
Shareholding Pattern
Sector and Industry Analysis
The edible oils and solvent extraction sector in India is a significant component of the broader agribusiness market, driven by rising domestic consumption and increasing health awareness. The market size is substantial, supported by a large population and growing demand for edible oils in both urban and rural areas. Key players in this sector include established solvent extraction companies and edible oil refiners, with firms like KSE Ltd. operating alongside other regional and national competitors.
Industry trends reveal a shift towards value-added products and greater emphasis on quality and purity, responding to consumer preferences and health concerns. Competitive dynamics are shaped by economies of scale, technological advancements in extraction and refining, and supply chain efficiencies. Barriers to entry remain high due to capital intensity, regulatory compliance, and the need for established sourcing networks, positioning well-established companies favorably in the market.
The regulatory environment is characterized by government policies on import tariffs, quality standards, and food safety regulations, which significantly influence operational practices and pricing. Recent regulations focus on ensuring product quality, transparency in labeling, and controlling adulteration, impacting industry compliance costs. The outlook suggests continued regulatory scrutiny aimed at protecting consumer interests and promoting domestic production, which could affect industry profitability and competitive strategies.
Note: Analysis synthesized from industry research, market reports, and regulatory filings. Information is subject to change based on market conditions.
Financial Ratios Dashboard
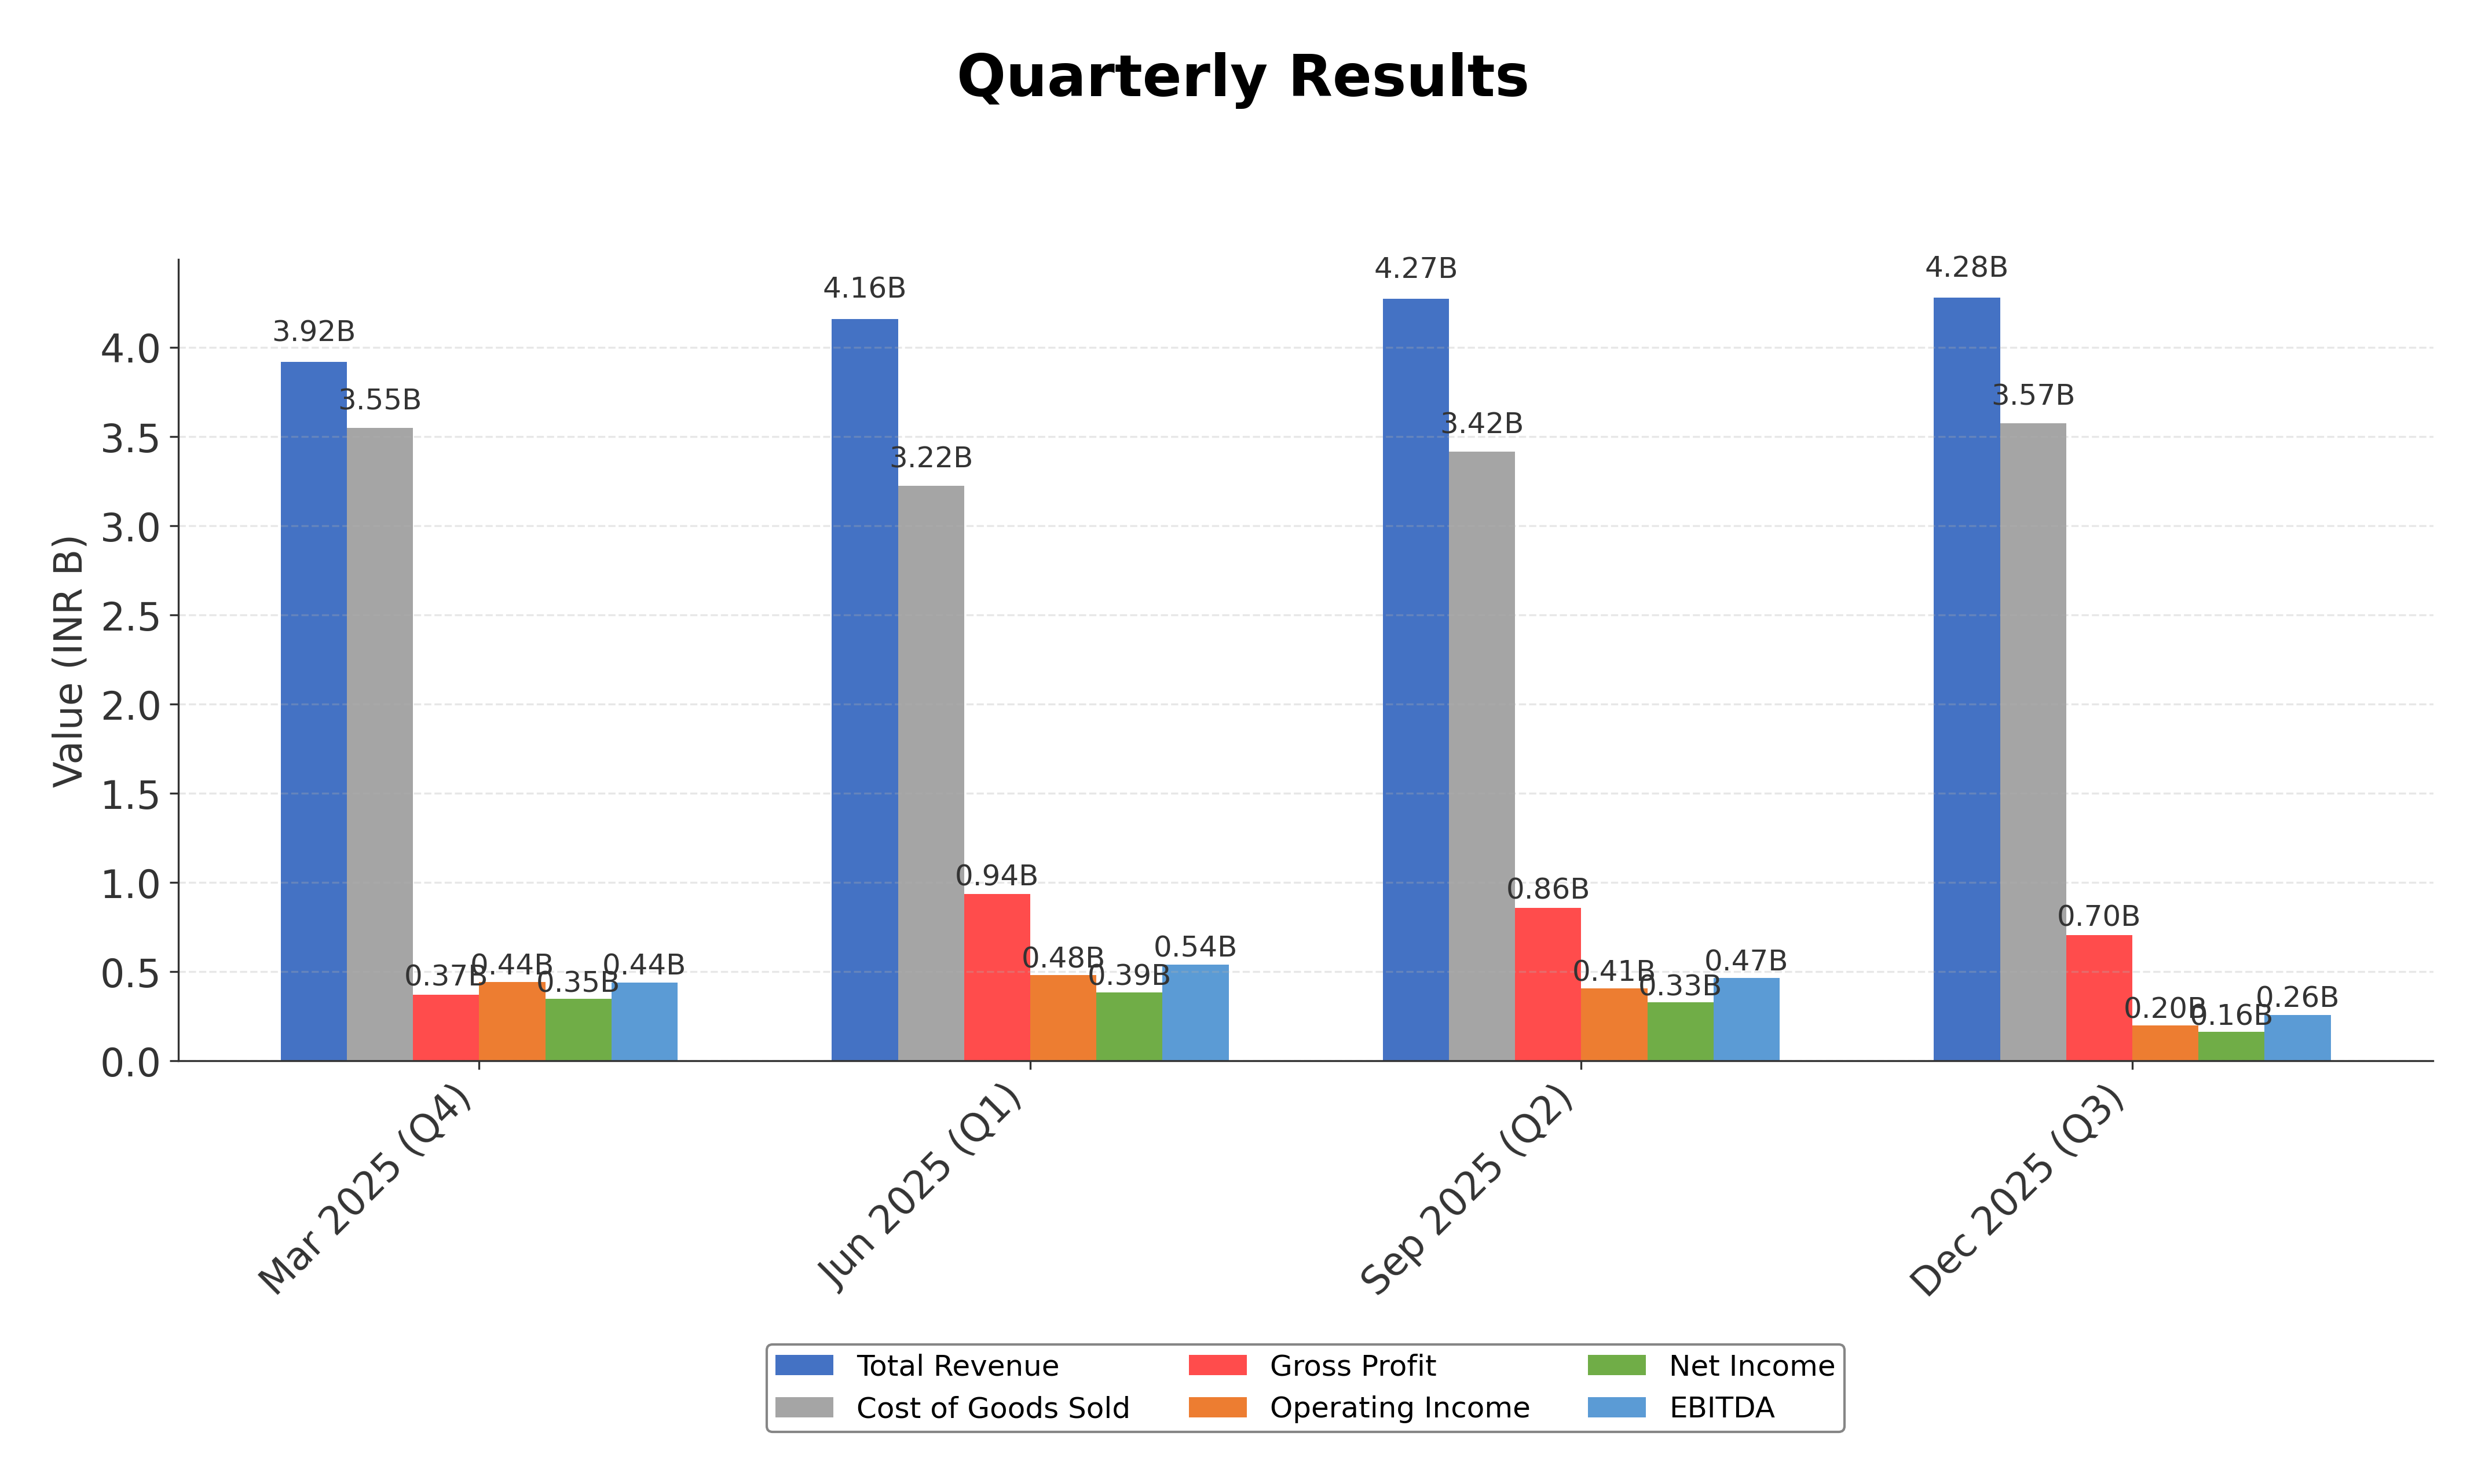
Financials
Peer Analysis
| Company Name | Market Cap | P/E Ratio | P/B Ratio | EV/EBITDA | Price to CFO |
|---|---|---|---|---|---|
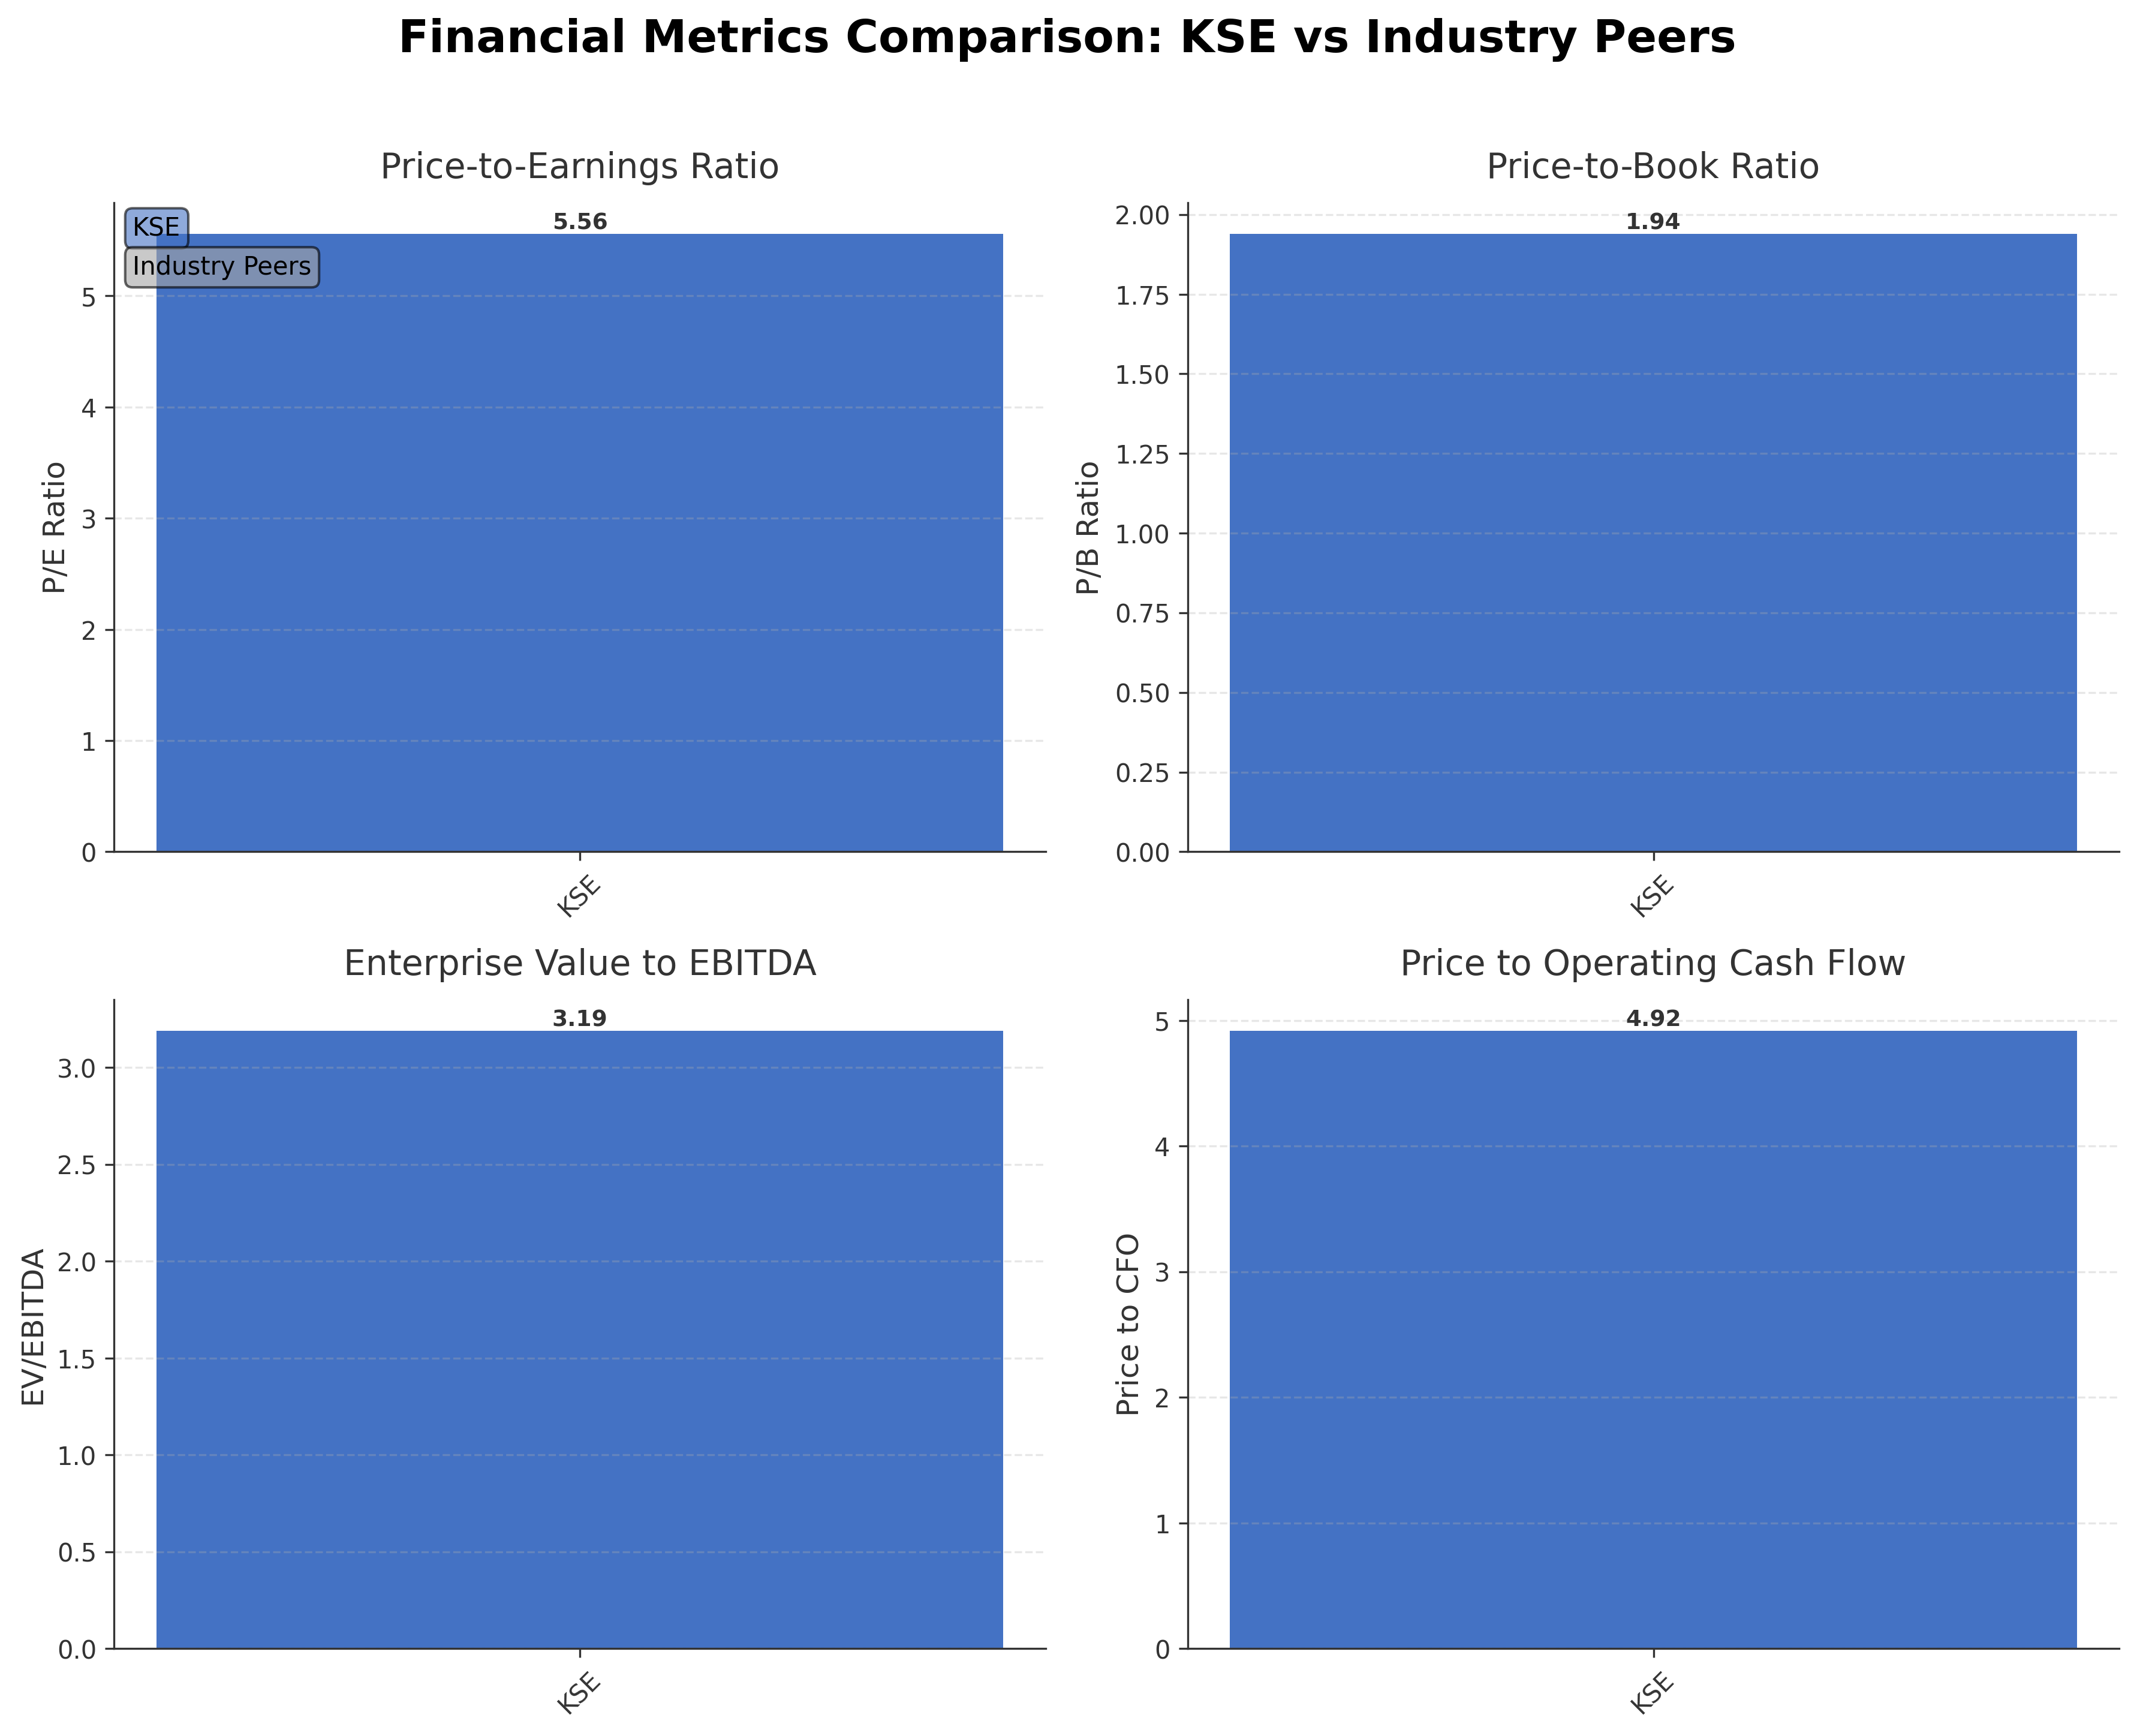
| Kse Ltd. | ₹6.81B | 5.56 | 1.94 | 3.19 | 4.92 |
Comparison Analysis: Kse Ltd. currently lacks listed direct peers within the same industry and exchange for comparison. Its valuation metrics, including a P/E of 5.56 and P/B of 1.94, indicate a relatively low valuation profile. The company’s EV/EBITDA multiple of 3.19 and price to CFO ratio of 4.92 suggest efficient cash flow generation relative to enterprise value. The ROE of 30.77% reflects strong profitability compared to typical industry standards. Without peer data, Kse Ltd. appears to maintain solid financial and valuation metrics within its sector.
Financial Metrics Comparison with Peers
Financial Statements
Comprehensive financial data including income, balance sheet, and cash flow metrics
Income Statement
| fiscal_date | 2025-03-31 | 2024-03-31 | 2023-03-31 | 2022-03-31 | 2021-03-31 |
|---|---|---|---|---|---|
| Sales | 16.50B | 16.83B | 16.10B | 16.70B | 15.43B |
| Cost Of Goods | 14.11B | 15.40B | 15.04B | 15.42B | 13.02B |
| Gross Profit | 2.39B | 1.44B | 1.06B | 1.28B | 2.41B |
| Operating Expense Selling General And Administrative | 129.91M | 92.60M | 114.53M | 80.72M | 56.27M |
| Operating Expense Other Operating Expenses | 368.81M | 392.88M | 380.01M | 519.43M | 431.18M |
| Operating Income | 1.15B | 272.74M | -75.60M | 81.78M | 1.36B |
| Non Operating Interest Income | 6.12M | 6.32M | 4.20M | 3.50M | 5.87M |
| Non Operating Interest Expense | 24.20M | 28.15M | 20.75M | 18.96M | 14.78M |
| Pretax Income | 1.23B | 242.42M | -29.86M | 92.79M | 1.50B |
| Income Tax | 314.09M | 66.33M | -6.05M | 27.07M | 367.58M |
| Net Income | 913.07M | 176.09M | -23.81M | 65.71M | 1.13B |
| Eps Basic | 285.34 | 55.03 | -7.44 | 20.54 | 352.91 |
| Eps Diluted | 285.34 | 55.03 | -7.44 | 20.54 | 352.91 |
| Basic Shares Outstanding | 3.20M | 3.20M | 3.20M | 3.20M | 3.20M |
| Diluted Shares Outstanding | 3.20M | 3.20M | 3.20M | 3.20M | 3.20M |
| Ebit | 1.25B | 270.57M | -9.12M | 111.75M | 1.51B |
| Ebitda | 1.23B | 341.97M | -12.53M | 138.80M | 1.42B |
| Net Income Continuous Operations | 913.07M | 176.09M | -23.81M | 65.71M | 1.13B |
| Preferred Stock Dividends | 0.00 | 0.00 | 0.00 | 0.00 | 0.00 |
Source: Financial statements and regulatory filings
Balance Sheet
| fiscal_date | 2025-03-31 | 2024-03-31 | 2023-03-31 | 2022-03-31 | 2021-03-31 |
|---|---|---|---|---|---|
| Cash And Cash Equivalents | 163.88M | 104.68M | 89.25M | 146.68M | 63.04M |
| Accounts Receivable | 17.13M | 8.75M | 15.07M | 12.30M | 3.80M |
| Total Assets | 3.57B | 2.78B | 2.68B | 2.81B | 3.35B |
| Total Liabilities | 599.85M | 530.58M | 538.73M | 578.64M | 918.63M |
| Long Term Debt | 170.53M | 138.40M | 134.10M | 122.59M | 99.30M |
| Shareholders Equity | 2.97B | 2.25B | 2.14B | 2.23B | 2.43B |
Source: Financial statements and regulatory filings
Cash Flow Statement
| fiscal_date | 2025-03-31 | 2024-03-31 | 2023-03-31 | 2022-03-31 | 2021-03-31 |
|---|---|---|---|---|---|
| Operating Activities Net Income | 913.07M | 176.09M | -23.81M | 65.71M | 1.13B |
| Operating Activities Other Non Cash Items | 22.30M | 27.02M | 28.79M | 18.39M | 14.51M |
| Operating Activities Accounts Receivable | 16.19M | -69.72M | -976.00K | 19.68M | -45.68M |
| Operating Activities Other Assets Liabilities | 433.37M | -329.18M | 397.41M | 74.88M | -875.88M |
| Operating Activities Operating Cash Flow | 1.38B | -195.79M | 401.41M | 178.66M | 222.26M |
| Investing Activities Capital Expenditures | -147.91M | -83.19M | -131.22M | -170.49M | 29.46M |
| Investing Activities Purchase Of Investments | -2.62B | -902.55M | -892.90M | -1.16B | -1.15B |
| Investing Activities Sale Of Investments | 1.58B | 1.22B | 706.23M | 1.88B | 702.05M |
| Investing Activities Investing Cash Flow | -1.18B | 236.55M | -317.89M | 550.16M | -419.09M |
| Financing Activities Long Term Debt Issuance | 37.07M | 22.22M | 68.75M | 69.20M | 55.24M |
| Financing Activities Long Term Debt Payments | -6.16M | -3.22M | -46.83M | -45.36M | -26.39M |
| Financing Activities Short Term Debt Issuance | 1.28M | -420.00K | -22.98M | -237.58M | 226.75M |
| Financing Activities Common Dividends | -187.68M | -65.37M | -66.10M | -270.81M | -111.41M |
| Financing Activities Other Financing Charges | -4.32M | 1.37M | 2.10M | -1.19M | -590.00K |
| Financing Activities Financing Cash Flow | -159.82M | -45.42M | -65.05M | -485.74M | 143.59M |
| End Cash Position | 163.88M | 104.68M | 89.25M | 146.68M | 63.04M |
| Free Cash Flow | 1.27B | -234.71M | 210.84M | -135.97M | 303.84M |
| Investing Activities Other Investing Activity | N/A | N/A | N/A | N/A | 686.00K |
Source: Financial statements and regulatory filings
Technical Analysis
Key Insights
- Kse Ltd.'s current trend shows moderate upward momentum with price trading above the 50-day moving average (₹199.62) but below the 200-day moving average (₹229.59), indicating mixed medium-term signals.
- Key support levels are identified near ₹174 (52-week low) and ₹200, while resistance is observed around ₹285 (52-week high) and ₹230 (200-day MA).
- The stock is positioned above the short-term 10-day and 50-day moving averages but remains below the long-term 200-day moving average, suggesting potential consolidation.
- Momentum indicators such as RSI and MACD currently reflect neutral to slightly bullish readings, with RSI near mid-range levels indicating no extreme overbought or oversold conditions.
- Multi-timeframe analysis reveals short-term strength on daily charts, mixed signals on weekly charts, and potential resistance on monthly charts near the upper price range.
- Potential market scenarios include consolidation between support and resistance levels, with possible volatility influenced by broader market and geopolitical factors.
Trending News
1. Headline: Investors book gains amid US-Iran tensions | The Express Tribune
Summary: Pakistan's stocks on Friday came under pressure as renewed geopolitical tensions between the US and Iran near the Strait of Hormuz triggered a bearish session on the Pakistan Stock Exchange (PSX). The benchmark KSE-100 index declined nearly 1,780 points to close at 171,116, erasing some of ...
Sentiment: negative
2. Headline: PSX plunges over 1,100 points in early trading | The Express Tribune
Summary: Blue-chip stocks appeared under pressure, dragging the index lower. ... On Thursday, PSX maintained its bullish momentum as investor sentiment strengthened amid easing geopolitical tensions in the Middle East, pushing the benchmark KSE-100 index higher by 1,190 points to close just below the ...
Sentiment: negative
3. Headline: KSE-100 loses over 1% as US-Iran tensions escalate - Markets - Business Recorder
Summary: On Thursday, PSX extended its bullish ... The benchmark KSE-100 Index still managed to close firmly in positive territory, gaining 1,189.52 points or 0.69 percent to settle at 172,894.28 points. Internationally, oil prices were higher on Friday and stocks a little bit lower as ...
Sentiment: positive
4. Headline: PSX stays bullish, nears 173,000 | The Express Tribune
Summary: The Pakistan Stock Exchange (PSX) on Thursday maintained its bullish momentum as investor sentiment strengthened amid easing geopolitical tensions in the Middle East, pushing the benchmark KSE-100 index higher by 1,190 points to close just below the 173,000 level.
Sentiment: positive
5. Headline: PSX extends bullish run, surges over 1,480 points | The Express Tribune
Summary: The Pakistan Stock Exchange (PSX) extended the bullish mode on Thursday, with the benchmark KSE-100 Index climbing more than 1,480 points in the first hours of trading, reflecting continued investor confidence in the local bourse.
Sentiment: positive
Recent Updates
News Summary
As of 2026-05-08. Recent developments for Kse Ltd. include a stable trading environment with the stock closing at INR 210.15 on May 8, 2026, slightly down by 0.80% from the previous close. The company completed a 10-for-1 stock split in October 2025, enhancing liquidity and accessibility for investors. Dividend payments continue on a semi-annual basis with a trailing yield of 25.85%, reflecting consistent shareholder returns. Regulatory compliance filings under SEBI regulations were submitted in early April 2026, indicating adherence to governance standards. Market volatility linked to geopolitical tensions has influenced regional indices but Kse Ltd. maintains solid fundamentals and liquidity positions.
News Sentiment
The overall sentiment from recent updates is neutral, reflecting stable corporate governance and consistent financial performance amidst external market volatility. Positive news such as the stock split and dividend continuity supports shareholder value, while geopolitical risks and market fluctuations temper enthusiasm. Regulatory compliance and steady liquidity reinforce operational stability. The balanced sentiment suggests cautious monitoring of external factors while recognizing the company's underlying strengths.
Source List
- https://economictimes.indiatimes.com/kse-ltd/stocksupdate/companyid-8983.cms
- https://www.bseindia.com/stock-share-price/kse-ltd/kse/519421/corp-announcements/
- https://economictimes.indiatimes.com/kse-ltd/quarterly/companyid-8983.cms
Analytical Overview
Analysis Summary
Kse Ltd.’s valuation metrics, including a trailing P/E of 5.56, are below typical industry averages, indicating the stock is attractively priced relative to earnings. The absence of a forward P/E suggests limited consensus on future earnings growth, while the negative PEG ratio points to challenges in growth expectations. Revenue growth is modest at 3.9% quarterly, supported by positive operating and free cash flow trends, which indicate operational stability and efficient cash generation. The company’s financial health is robust, with a low debt-to-equity ratio of 6.86% and a strong current ratio above 6, reflecting ample liquidity to cover short-term obligations. Sector-specific challenges include geopolitical risks impacting market sentiment and regulatory compliance demands in the financial services industry. India-specific factors such as evolving regulatory frameworks and consumer confidence trends also influence the company’s operating environment.
Overall Business and Market Assessment
Supporting Factors: strong profitability metrics with ROE above 30%, solid cash flow generation, and conservative debt levels
Risk Factors: geopolitical tensions affecting market stability and the lack of institutional investor participation, which may limit liquidity and broader market support
SWOT Analysis
Strengths
- Kse Ltd. demonstrates strong profitability with a return on equity of 30.77%.
- The company maintains robust liquidity with a current ratio exceeding 6.
- Insider ownership is high at nearly 49%, indicating aligned management interests.
- Low debt levels contribute to a conservative financial structure.
Weaknesses
- Quarterly earnings growth has declined by 22.2% year-over-year.
- Institutional investor presence is currently absent, limiting market breadth.
- Negative PEG ratio suggests challenges in sustaining growth momentum.
- Operating margin is relatively low at 4.67%, indicating limited operational leverage.
Opportunities
- Potential market expansion driven by increasing financial market participation in India.
- Improved geopolitical conditions could enhance investor confidence and market activity.
- Technological advancements may improve trading platform efficiency and offerings.
- Regulatory reforms could create new avenues for market development.
Threats
- Geopolitical tensions in the region pose risks to market stability and investor sentiment.
- Regulatory changes may increase compliance costs or restrict certain activities.
- Competitive pressures from other exchanges and financial platforms.
- Economic volatility impacting trading volumes and revenue generation.
Company Description
Kse Ltd. is a significant player in the financial markets, providing a comprehensive platform for the trading of a diverse range of securities. As an exchange, Kse Ltd.'s primary function is to facilitate orderly and transparent transactions between buyers and sellers of stocks, bonds, and other financial instruments. It operates as a key infrastructure within the financial ecosystem, ensuring liquidity and market efficiency by connecting investors, brokers, and financial institutions. Kse Ltd. impacts various sectors, including technology, finance, and real estate, offering a marketplace where companies can raise capital by listing their shares. This listing process is crucial for companies seeking to expand and attract investment while providing investors with opportunities to diversify their portfolios. The exchange also plays a vital role in price discovery, establishing fair and transparent pricing for listed assets based on supply and demand dynamics. In the context of global markets, Kse Ltd. serves as a barometer for economic health, with its indices often used to gauge market sentiment and performance. It is integral to supporting economic growth and innovation by fostering an environment that facilitates efficient capital allocation.