


KPR Mill Ltd (KPRMILL)
Stock Analysis Report
Stock Journey
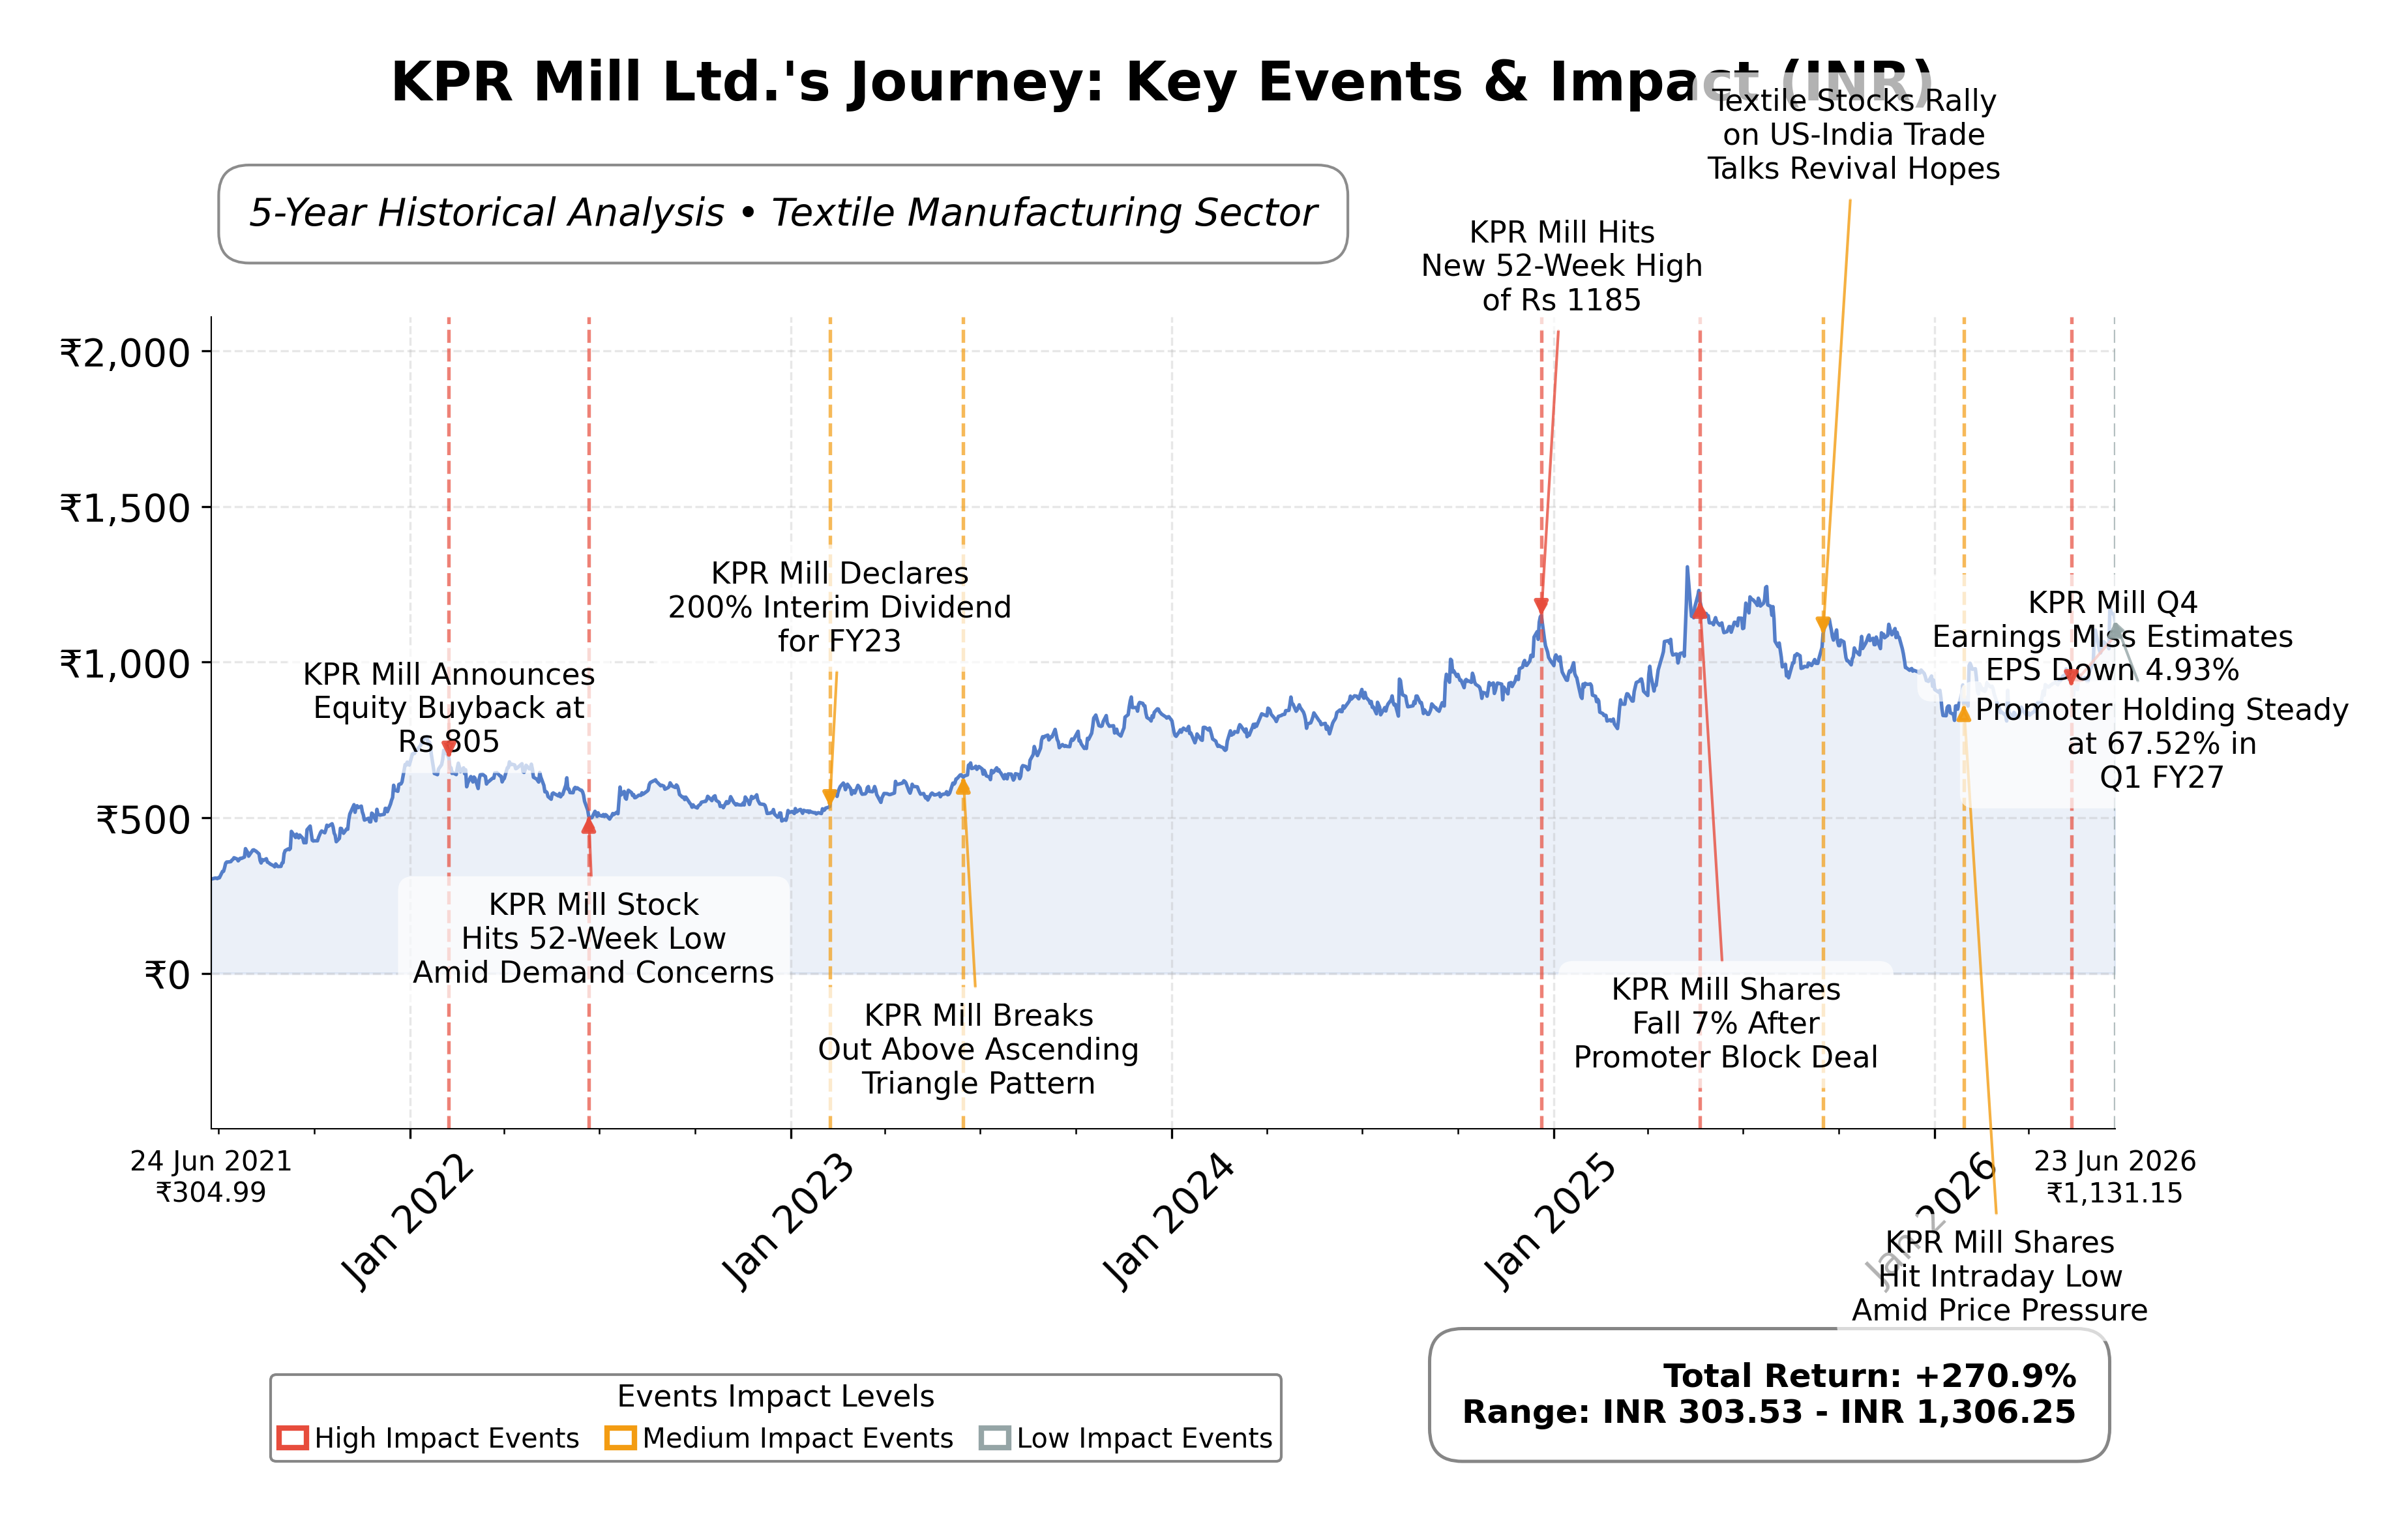
Key Positives and Key Risks
Pros
- Strong profitability with a return on equity (ROE) of 16.2%, indicating effective capital utilization.
- Robust liquidity demonstrated by a current ratio of 4.37 and low debt-to-equity ratio of 0.10, supporting financial stability.
- Positive cash flow generation with operating cash flow of ₹11.1 billion and free cash flow of ₹5.4 billion, enabling reinvestment and shareholder returns.
Cons
- High valuation multiples including a trailing P/E of 42.0 and price-to-book ratio of 6.81, suggesting premium pricing relative to peers.
- Modest revenue growth of 0.9% quarterly, indicating limited near-term expansion momentum.
- Significant promoter shareholding at 67.5%, which may limit public float and influence governance dynamics.
Disclosure: This information is for general awareness and does not constitute investment advice
Report Summary
KPR Mill Ltd. operates as a prominent textile manufacturing company headquartered in India, listed on the NSE under the Consumer Cyclical sector. The company is engaged in the integrated production of yarn, fabric, and garments, serving both domestic and international markets. Its business model encompasses the entire textile value chain, from raw cotton processing to finished apparel, positioning it as a key player within the textile manufacturing industry. KPR Mill’s diversified product portfolio includes knitted fabric, cotton yarn, and various apparel segments, contributing significantly to the textile export sector.
Financially, KPR Mill reported trailing twelve months (TTM) revenue of approximately ₹66.5 billion with a gross margin of 36.5%, operating margin of 16.5%, and a net profit margin of 13.0%. The company’s return on equity (ROE) stands at 16.2%, and return on assets (ROA) is 10.3%, indicating efficient utilization of equity and assets to generate profits. Its return on invested capital (ROIC) aligns with these metrics, reflecting solid operational efficiency and profitability. Quarterly revenue growth is modest at 0.9%, while earnings growth year-over-year is 11.1%, suggesting steady performance improvements.
Valuation metrics show a trailing price-to-earnings (P/E) ratio of 42.0 and a forward P/E of 29.6, which are in line with the industry average P/E of 42.0, indicating the stock is priced at a premium relative to earnings but with expectations of growth. The price-to-book (P/B) ratio is 6.81, and enterprise value to EBITDA (EV/EBITDA) is 28.1, suggesting a relatively high valuation compared to peers. The market capitalization is approximately ₹361.5 billion. The stock’s 52-week price range is ₹796.1 to ₹1,257, with the current price near ₹1,217, close to its recent high, reflecting strong market interest.
KPR Mill’s strengths include robust cash flow generation with operating cash flow of ₹11.1 billion and free cash flow of ₹5.4 billion, a low debt-to-equity ratio of 0.10, and a high current ratio of 4.37, indicating strong liquidity. The company benefits from market leadership in the textile sector and recent government policy support such as customs duty exemption on cotton imports. Key risks involve regulatory changes, competitive pressures within the textile industry, and macroeconomic factors affecting export demand. Recent strategic developments include positive market sentiment driven by US-India trade talks and tariff expectations, alongside promoter shareholding transparency.
Technically, the stock has demonstrated a strong upward trend with recent price surges and trading volumes increasing significantly. It trades above its 50-day and 200-day moving averages, with momentum indicators reflecting bullish conditions across multiple timeframes. The current technical setup suggests a favorable environment for market participation, though valuation levels warrant a measured approach. Overall, the data indicates a balanced view with conditions supportive of continued interest while monitoring for potential volatility.
Company and Industry Overview
Company Basics
Price Performance
Company Size
Shareholding Pattern
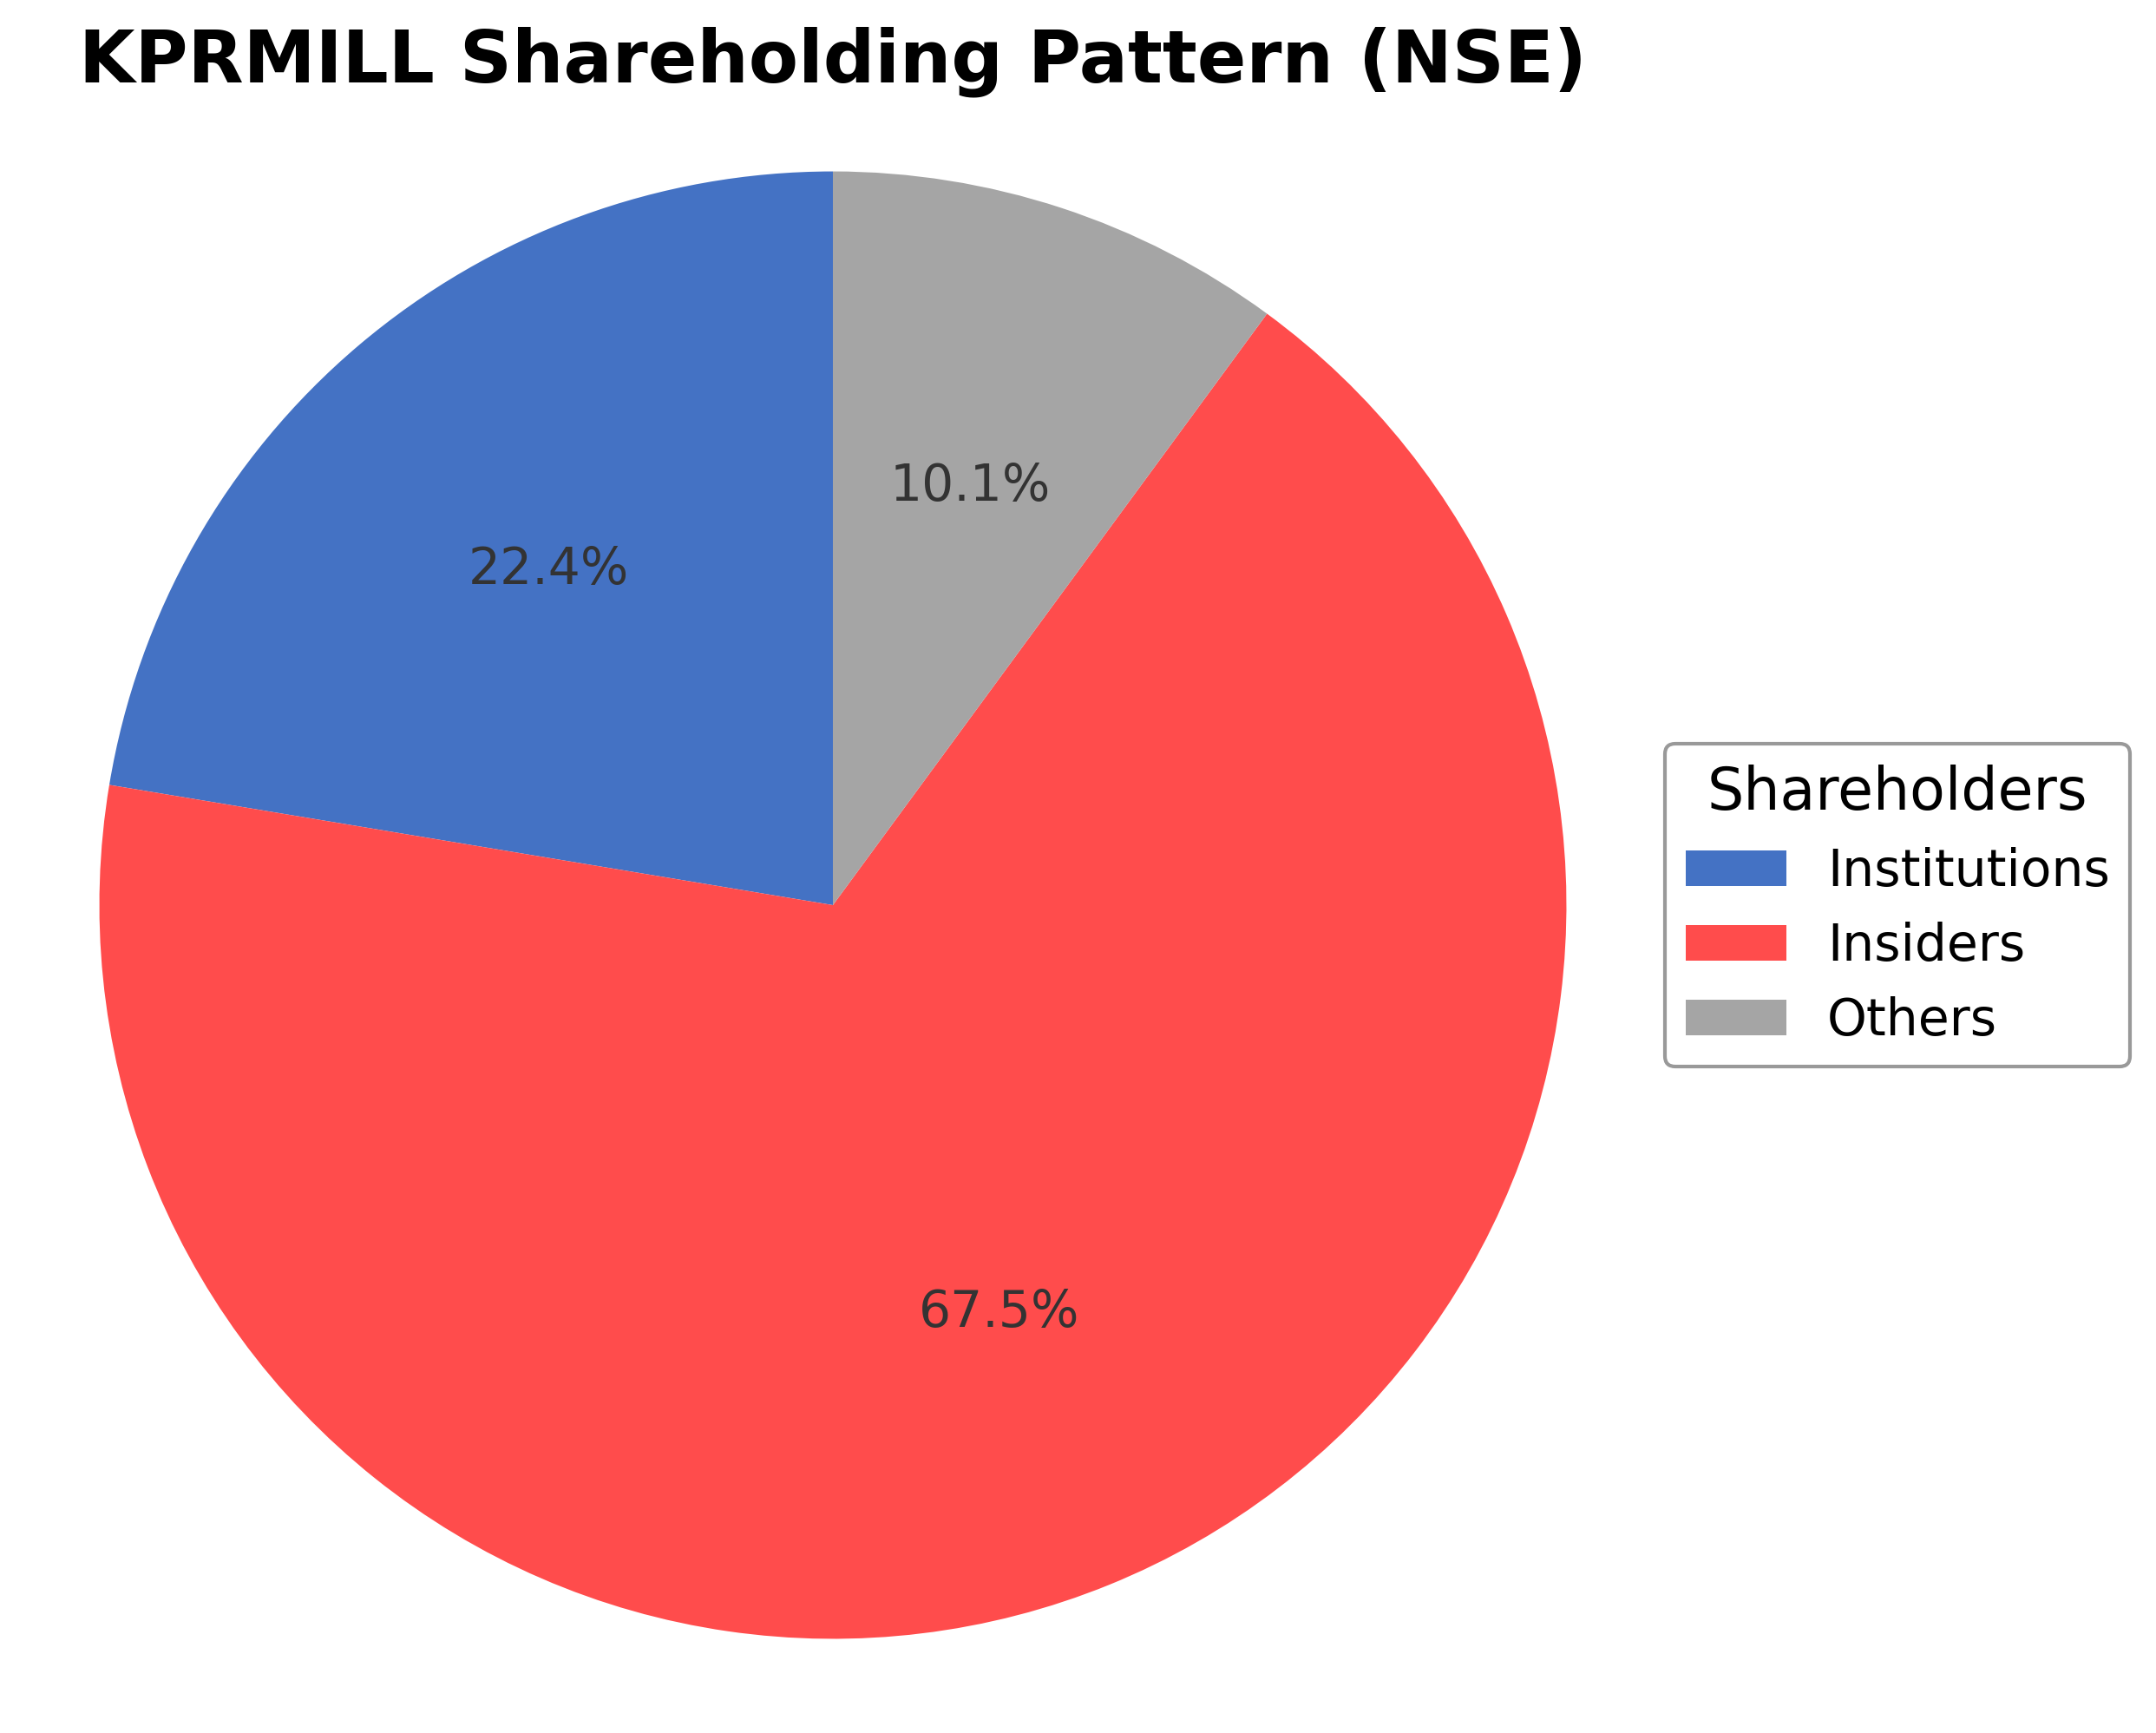
KPR Mill Ltd. exhibits a concentrated ownership structure with insiders, including executives and board members, holding approximately 67.54% of shares as of the most recent fiscal year-end. Institutional investors account for 22.38%, reflecting moderate institutional interest, while public and other shareholders constitute roughly 10.08%. Over the past 12-24 months, promoter holdings have remained stable, with no significant dilution or encumbrance, reinforcing confidence in management’s commitment. Institutional accumulation trends indicate steady positions by major mutual funds and asset managers, suggesting sustained market confidence. This ownership pattern supports strong governance and strategic continuity, positioning the company well for future corporate initiatives within the textile manufacturing sector.
Sector and Industry Analysis
The textiles sector in India is a significant contributor to the economy, with a market size running into billions of dollars and a strong growth trajectory driven by rising domestic demand and export opportunities. Key players include vertically integrated companies like KPR Mill, Arvind, and Vedant Fashions, which dominate through scale and diversified product portfolios. The sector benefits from India's competitive labor costs and expanding global market access, particularly in ready-made garments (RMG).
Industry trends highlight a shift towards sustainable and eco-friendly fabrics, with companies launching innovative products to meet evolving consumer preferences. Vertical integration and diversification into related segments such as power generation and ethanol production provide competitive advantages but also require substantial capital investment. Barriers to entry remain high due to the need for scale, technological capability, and compliance with stringent sustainability standards, while global trade dynamics and free trade agreements influence market positioning.
The regulatory environment is shaped by trade agreements like the India-UK and India-Australia FTAs, which enhance export prospects and market access for textile exporters such as KPR Mill. Additionally, mandates on ethanol blending and sustainability regulations impact operational strategies and cost structures. While these regulations create growth opportunities, companies must navigate risks related to currency fluctuations, environmental compliance, and regional concentration to sustain long-term competitiveness.
Note: Analysis synthesized from industry research, market reports, and regulatory filings. Information is subject to change based on market conditions.
Financial Ratios Dashboard
Illustrative Scenario Analysis
DCF Assumptions:
Method: Two-Stage EPS-Priority Model
Financials
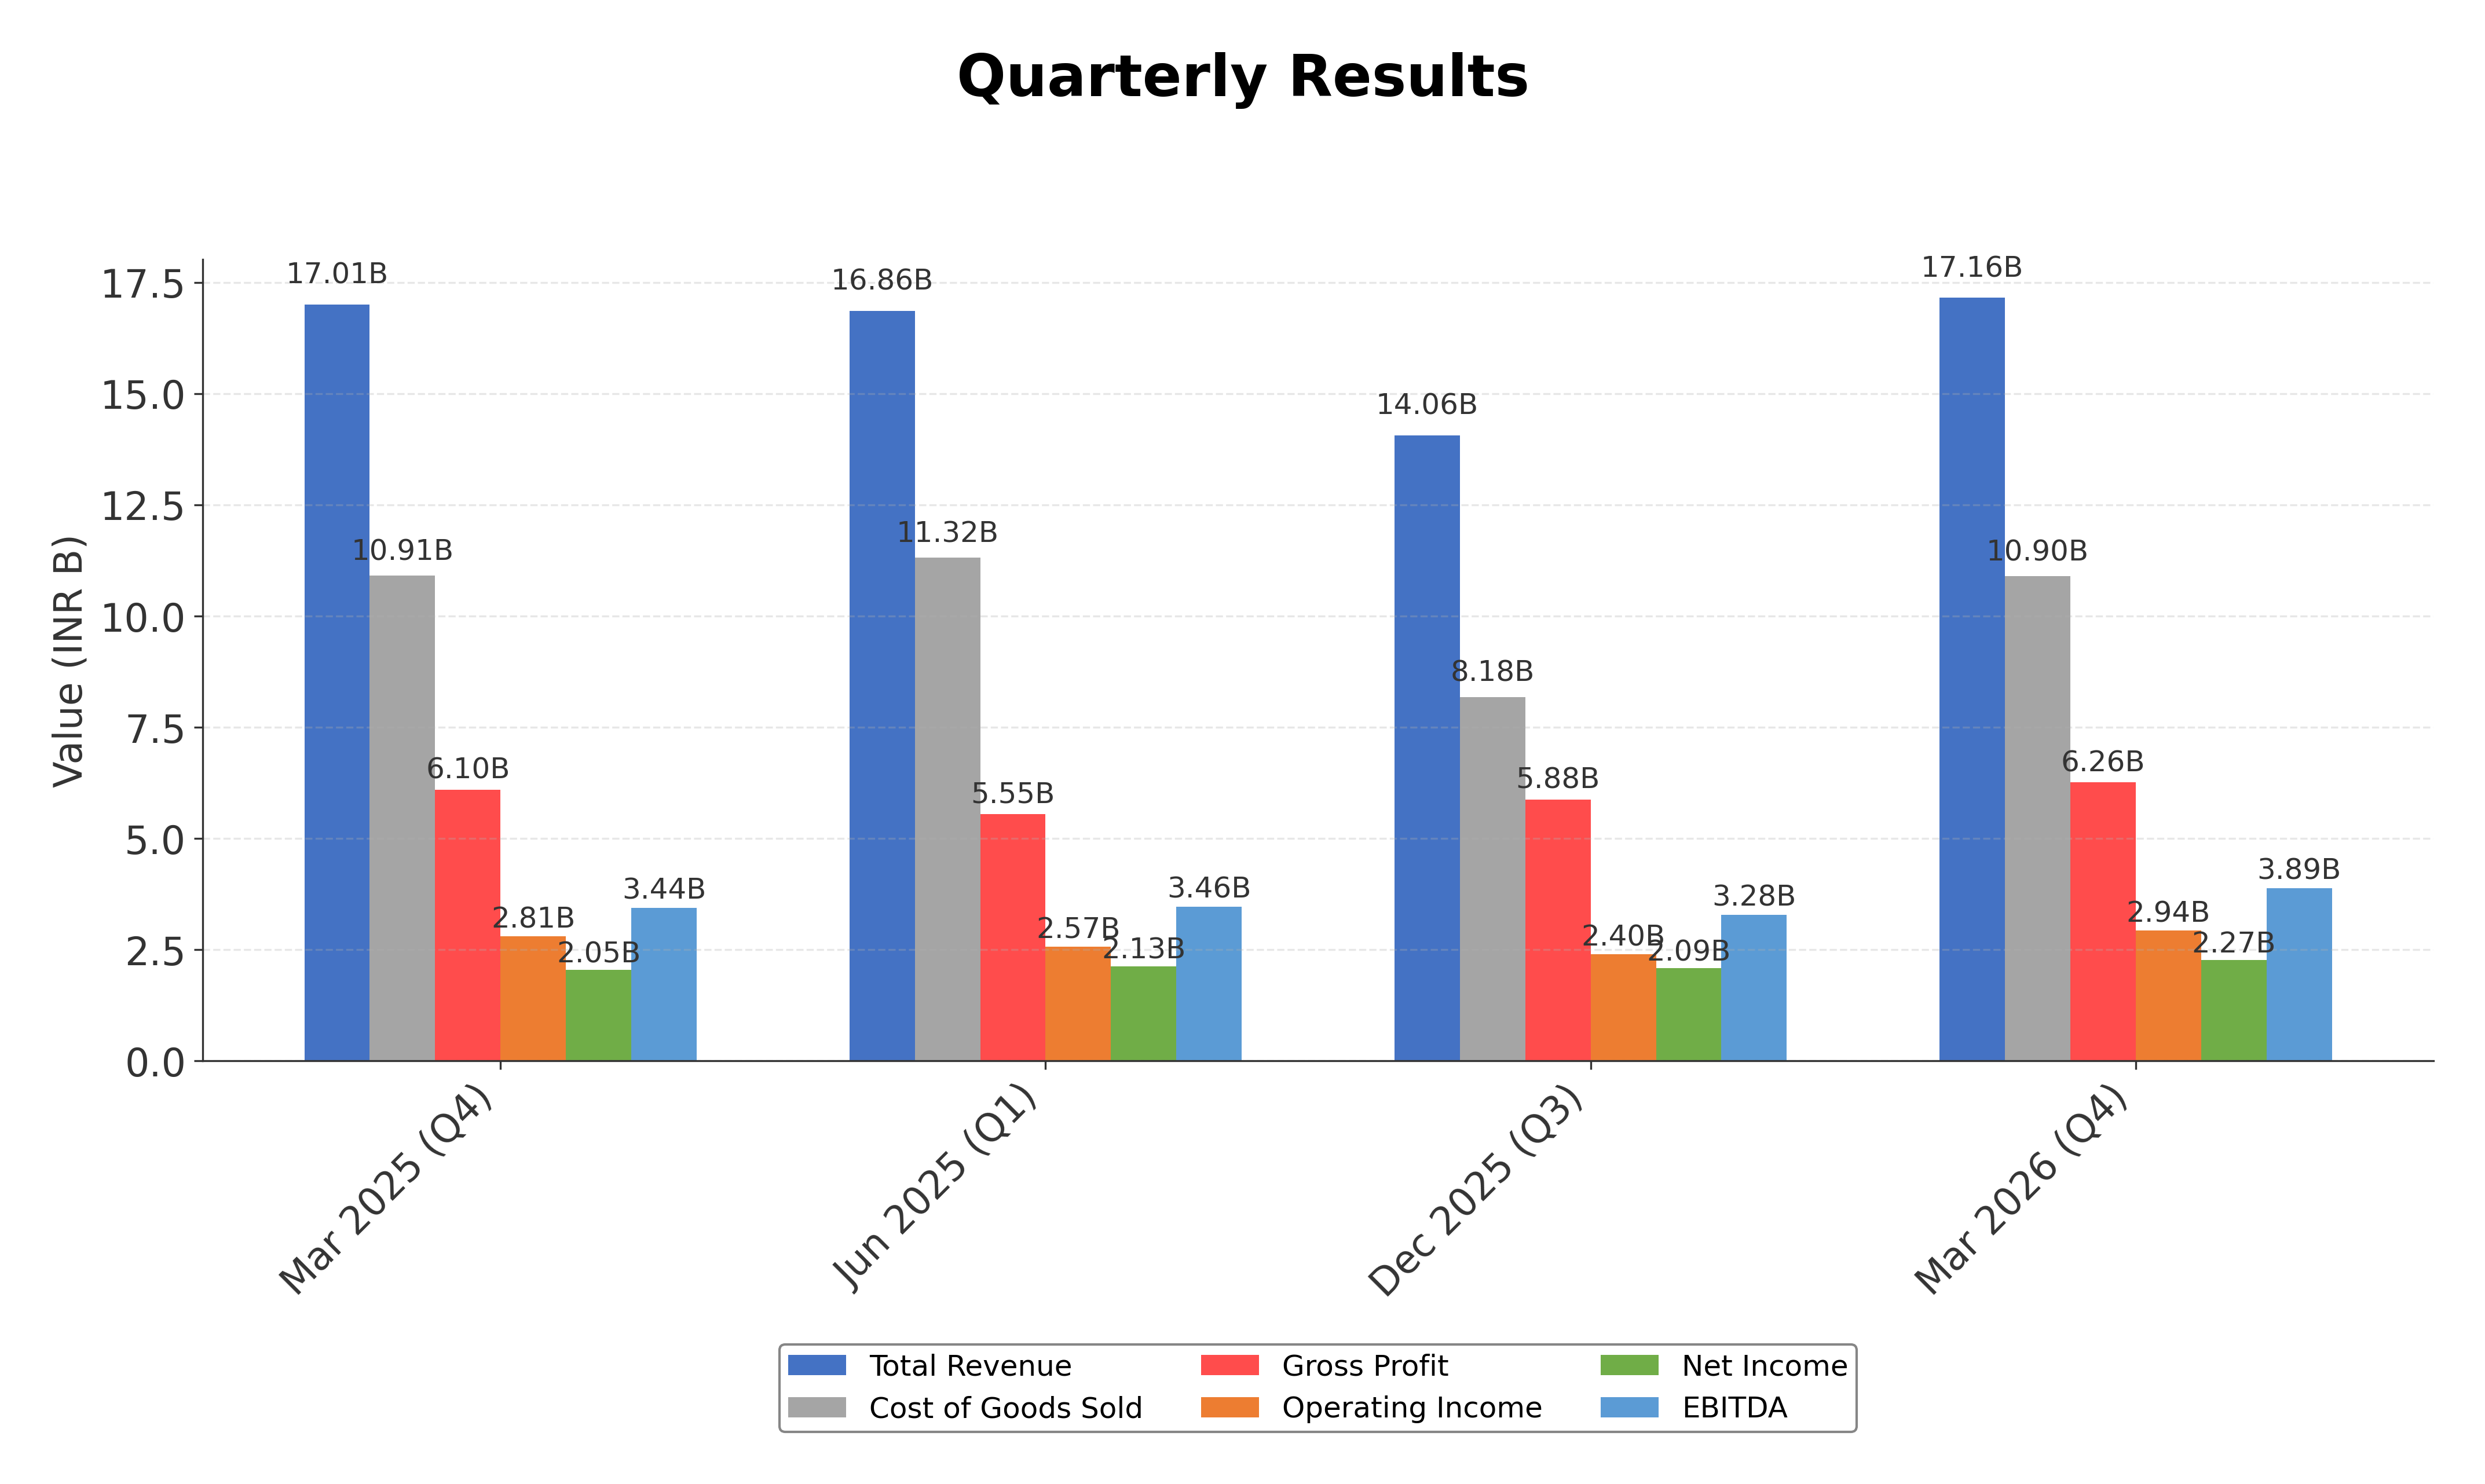
Peer Analysis
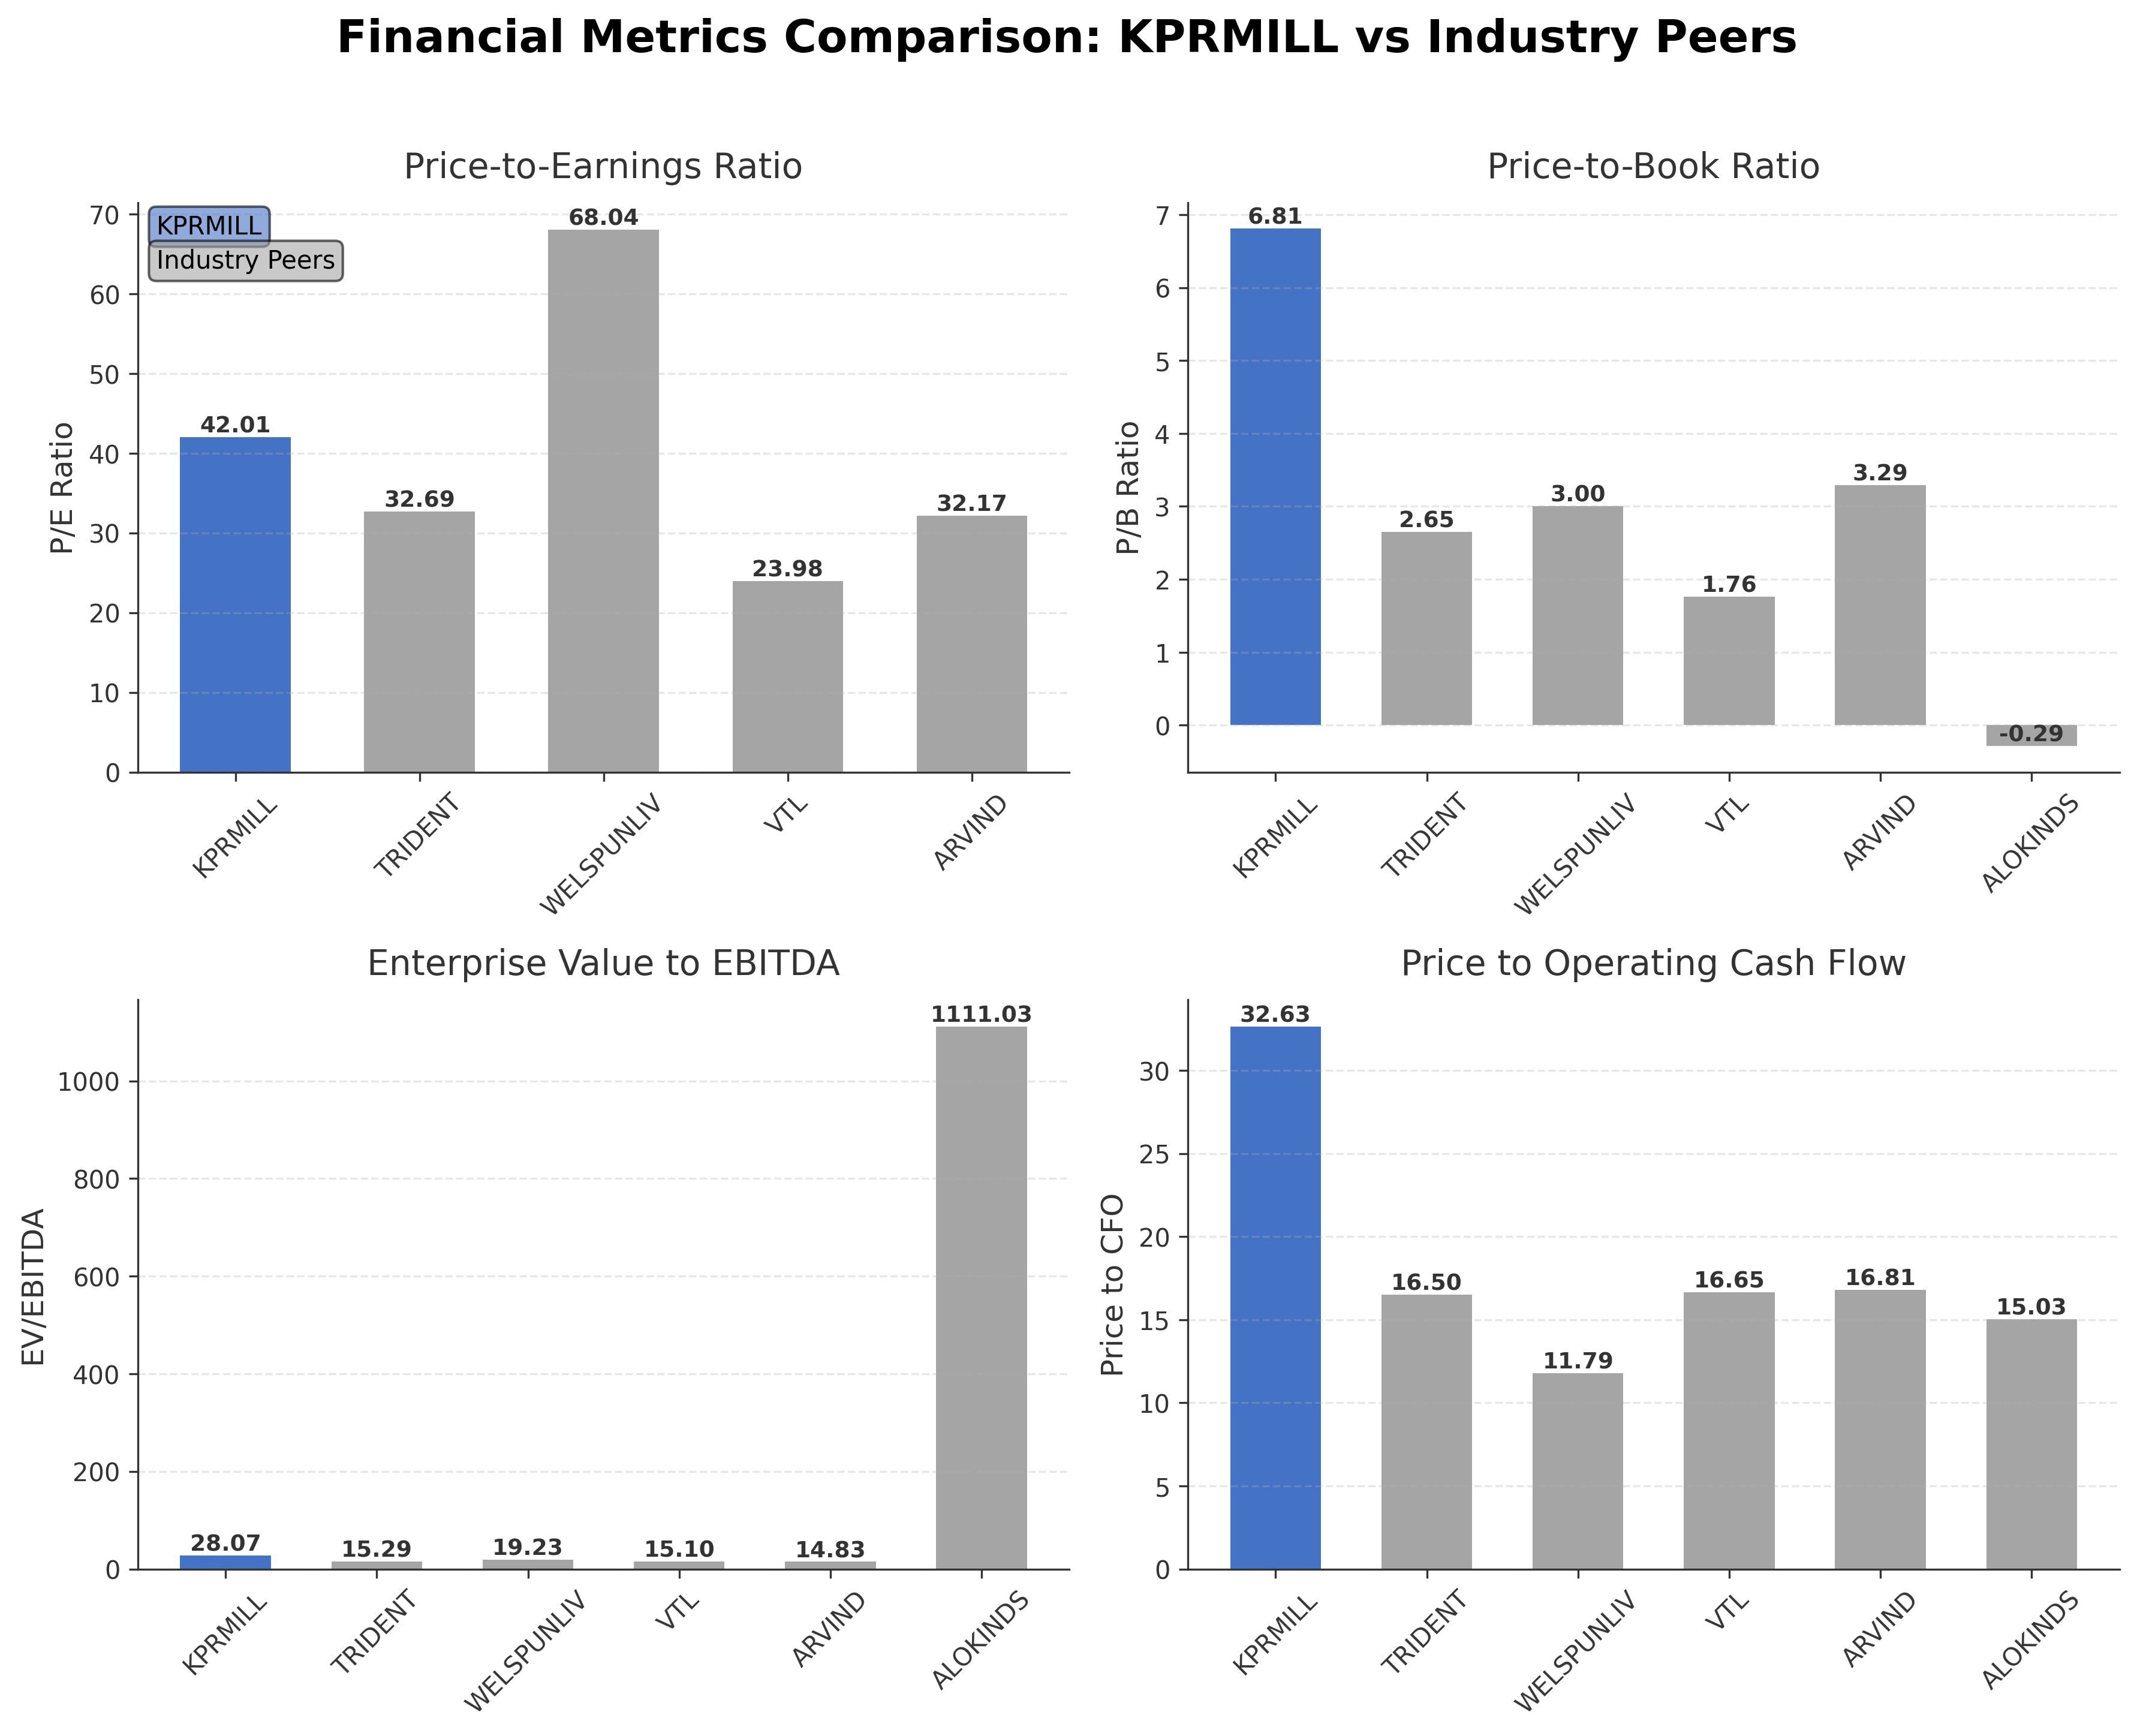
| Company Name | Market Cap | P/E Ratio | P/B Ratio | EV/EBITDA | Price to CFO |
|---|---|---|---|---|---|
| KPR Mill Ltd. | ₹361.52B | 42.01 | 6.81 | 28.07 | 32.63 |
| Trident Ltd. | ₹125.40B | 32.69 | 2.65 | 15.29 | 16.50 |
| Welspun Living Ltd. | ₹138.53B | 68.04 | 3.00 | 19.23 | 11.79 |
| Vardhman Textiles Ltd. | ₹184.50B | 23.98 | 1.76 | 15.10 | 16.65 |
| Arvind Ltd. | ₹145.76B | 32.17 | 3.29 | 14.83 | 16.81 |
| Alok Industries Ltd. | ₹63.01B | N/A | -0.29 | 1111.03 | 15.03 |
Comparison Analysis: KPR Mill Ltd. stands out among its Indian textile manufacturing peers with the highest market capitalization at ₹361.52 billion and a superior return on equity of 16.2%, indicating robust profitability. However, its valuation multiples, including a P/E of 42.01 and EV/EBITDA of 28.07, are significantly higher than most peers such as Trident Ltd. and Vardhman Textiles Ltd., which trade at more moderate multiples and lower P/B ratios. KPR Mill’s price to cash flow ratio of 32.63 also exceeds peer averages, reflecting premium pricing possibly justified by stronger growth prospects. Peers like Welspun Living Ltd. exhibit higher P/E ratios but lower returns, while Alok Industries Ltd. displays distressed valuation metrics. Overall, KPR Mill’s financial strength and market position differentiate it, albeit at a premium valuation.
Financial Metrics Comparison with Peers
Financial Statements
Comprehensive financial data including income, balance sheet, and cash flow metrics
Income Statement
| fiscal_date | 2026-03-31 | 2025-03-31 | 2024-03-31 | 2023-03-31 | 2022-03-31 |
|---|---|---|---|---|---|
| Sales | 63.78B | 61.36B | 58.24B | 59.60B | 46.75B |
| Cost Of Goods | 40.40B | 38.90B | 39.26B | 40.65B | 26.86B |
| Gross Profit | 23.38B | 22.46B | 18.98B | 18.96B | 19.89B |
| Operating Expense Other Operating Expenses | 5.60B | 5.80B | 1.49B | 1.45B | 4.73B |
| Operating Income | 10.52B | 10.38B | 10.74B | 11.14B | 10.78B |
| Non Operating Interest Expense | 516.00M | 497.70M | 649.00M | 706.20M | 232.90M |
| Pretax Income | 11.34B | 10.63B | 10.40B | 10.84B | 11.42B |
| Income Tax | 2.67B | 2.48B | 2.35B | 2.70B | 3.00B |
| Net Income | 8.66B | 8.15B | 8.05B | 8.14B | 8.42B |
| Eps Basic | 25.35 | 23.85 | 23.56 | 23.81 | 24.47 |
| Eps Diluted | 25.35 | 23.85 | 23.56 | 23.81 | 24.47 |
| Basic Shares Outstanding | 341.81M | 341.77M | 341.81M | 341.97M | 344.03M |
| Diluted Shares Outstanding | 341.81M | 341.77M | 341.81M | 341.97M | 344.03M |
| Ebit | 11.86B | 11.13B | 11.05B | 11.55B | 11.65B |
| Ebitda | 14.01B | 13.20B | 12.70B | 12.96B | 13.06B |
| Net Income Continuous Operations | 8.66B | 8.15B | 8.05B | 8.14B | 8.42B |
| Preferred Stock Dividends | 0.00 | 0.00 | 0.00 | 0.00 | 0.00 |
| Operating Expense Selling General And Administrative | N/A | 1.16B | 1.43B | 1.49B | 1.02B |
| Non Operating Interest Income | N/A | 177.60M | 56.70M | 21.70M | 31.80M |
| Minority Interests | N/A | N/A | 0.00 | 0.00 | 0.00 |
Data provided by Twelve Data
Balance Sheet
| fiscal_date | 2026-03-31 | 2025-03-31 | 2024-03-31 | 2023-03-31 | 2022-03-31 |
|---|---|---|---|---|---|
| Cash And Cash Equivalents | 638.60M | 1.15B | 751.30M | 1.09B | 1.21B |
| Accounts Receivable | 6.40B | 5.86B | 6.69B | 6.25B | 4.80B |
| Total Assets | 68.33B | 59.62B | 58.64B | 55.98B | 48.68B |
| Total Liabilities | 11.35B | 9.60B | 15.06B | 18.91B | 16.81B |
| Long Term Debt | 258.10M | 538.30M | 2.95B | 4.48B | 6.26B |
| Shareholders Equity | 56.98B | 50.02B | 43.58B | 37.07B | 31.87B |
Data provided by Twelve Data
Cash Flow Statement
| fiscal_date | 2026-03-31 | 2025-03-31 | 2024-03-31 | 2023-03-31 | 2022-03-31 |
|---|---|---|---|---|---|
| Operating Activities Net Income | 8.66B | 8.15B | 8.05B | 8.14B | 8.42B |
| Operating Activities Other Non Cash Items | -128.10M | 301.70M | 666.20M | 743.40M | 195.50M |
| Operating Activities Accounts Receivable | -589.00M | 847.50M | -440.30M | -1.47B | -1.61B |
| Operating Activities Other Assets Liabilities | 975.60M | 1.76B | -1.30B | -6.61B | -5.24B |
| Operating Activities Operating Cash Flow | 8.92B | 11.06B | 6.98B | 807.30M | 1.77B |
| Investing Activities Capital Expenditures | 626.00M | 77.50M | 88.10M | 284.00M | 57.10M |
| Investing Activities Other Investing Activity | -11.00B | -979.30M | 39.60M | 48.60M | 32.90M |
| Investing Activities Investing Cash Flow | -10.38B | -901.80M | 127.70M | 2.69B | -520.00M |
| Financing Activities Short Term Debt Issuance | 1.58B | -4.51B | -364.00M | 3.40B | 808.20M |
| Financing Activities Common Dividends | -1.71B | -1.71B | -1.54B | -734.90M | -51.60M |
| Financing Activities Financing Cash Flow | -127.30M | -6.22B | -1.90B | 460.10M | 756.60M |
| End Cash Position | 638.60M | 1.15B | 751.30M | 1.09B | 1.21B |
| Free Cash Flow | 7.93B | 12.33B | 3.54B | -803.40M | -3.98B |
| Financing Activities Common Stock Repurchase | N/A | N/A | 0.00 | -1.80B | 0.00 |
| Investing Activities Sale Of Investments | N/A | N/A | N/A | 2.36B | 0.00 |
| Financing Activities Other Financing Charges | N/A | N/A | N/A | -407.60M | N/A |
| Investing Activities Purchase Of Investments | N/A | N/A | N/A | N/A | -610.00M |
| Financing Activities Long Term Debt Payments | N/A | N/A | N/A | N/A | N/A |
Data provided by Twelve Data
Technical Analysis
Key Insights
- The current trend direction for KPR Mill Ltd. is strongly bullish, with recent price action showing a sharp upward movement culminating in a fresh 52-week high near ₹1,257.
- Key support levels are identified around ₹947 and ₹960, corresponding to the 50-day and 200-day moving averages respectively, while resistance is near the recent high of ₹1,257.
- The stock price is trading above its 10-day, 50-day, and 200-day moving averages, indicating sustained upward momentum across short, medium, and long-term timeframes.
- Momentum indicators show the Relative Strength Index (RSI) in an overbought zone above 70, MACD is positive with a bullish crossover, and Stochastic oscillator confirms strong upward momentum.
- Multi-timeframe analysis reveals consistent bullish signals on daily, weekly, and monthly charts, supporting the strength of the ongoing uptrend.
- Potential market scenarios include continuation of the upward trend supported by strong technical momentum, with possible consolidation near resistance levels before further advances.
Trending News
Summary: The Indian stock market saw solid gains on Wednesday, with the Nifty 50 and Sensex both climbing 1%. Financial stocks led the rally, bolstered by a rebound in tech shares. Lower crude oil prices improved sentiment, while expectations of static interest rates supported equity valuations.
Sentiment: positive
2. Headline: KPR Mill, Aether Industries, Trident shares gain amid spike in trading activity; check full list
Summary: The Indian equity benchmarks extended ... of India Ltd (CCIL) data. ... The SENSEX rose as much as 776 points and NIFTY50 index touched an intraday high of 24,014 led by gains in HDFC Bank, ICICI Bank, State Bank of India, Infosys, Axis Bank and Bajaj Finance. Here are stocks witnessing heavier than usual trading volumes: KPR Mill: Shares of ...
Sentiment: positive
Summary: MOFSL believes Gokaldas may deliver strong revenue growth driven by the India business through capacity expansion and the Africa business by higher utilisation after the renewal of the African Growth Opportunity Act (AGOA).
Sentiment: positive
4. Headline: KPR Mill shares jump 18%, the most in nearly two decades; Here's what is aiding the move - CNBC TV18
Summary: HomeMarket NewsKPR Mill shares jump 18%, the most in nearly two decades; Here's what is aiding the move · By Shloka Badkar June 24, 2026, 10:53:06 AM IST (Published) ... Shares of KPR Mill Ltd. gained 18% to hit a fresh 52-week high on Wednesday, June 24. This is its biggest single-day gain since October 13, 2008, when the stock ...
Sentiment: positive
Summary: KPR Mill Share Price: Find the latest news on KPR Mill Stock Price. Get all the information on KPR Mill with historic price charts for NSE / BSE. Experts & Broker view also get the KPR Mill Ltd. buy/sell tips detailed news, announcements, Forecasts, Analysts, Valuation, Earning forecasts, ...
Sentiment: neutral
Powered by Brave
Recent Updates
News Summary
As of June 24, 2026. KPR Mill Ltd. experienced a significant share price surge of 18%, marking its largest single-day gain in 18 years, driven by positive market sentiment linked to US-India trade discussions and tariff expectations. The promoter, P. Nataraj, confirmed no encumbrances on his substantial shareholding of over 65.9 million shares, reinforcing transparency and investor confidence. Additionally, the Indian government’s exemption of customs duty on cotton imports for five months starting June 1 is expected to benefit KPR Mill by improving raw material availability and reducing input costs, contributing to the recent rally in textile stocks. These developments collectively underscore a favorable business environment and enhanced growth prospects for the company.
News Sentiment
The overall sentiment from recent updates is predominantly positive, driven by strong price performance and supportive regulatory developments. The promoter’s confirmation of unencumbered shares adds to investor assurance, while government policy easing on cotton imports is viewed as a constructive factor for margin improvement. Neutral sentiment accompanies the customs duty exemption news, reflecting cautious optimism about its impact. The combination of these factors has bolstered market confidence, although ongoing monitoring of trade negotiations and sector dynamics remains prudent. The prevailing tone suggests a constructive outlook grounded in tangible business and regulatory catalysts.
Source List
- https://www.cnbctv18.com/market/kpr-mill-share-price-gains-most-in-18-years-motilal-oswal-triggers-us-india-trade-talks-tariffs-textile-19931165.htm
- https://scanx.trade/stock-market-news/companies/kpr-mill-promoter-confirms-no-encumbrance-on-shares-for-fy26/42277370
- https://m.economictimes.com/markets/stocks/news/explained-why-gokaldas-exports-kpr-mill-and-other-textile-stocks-soared-up-to-8-on-monday/articleshow/131434489.cms
Analytical Overview
Analysis Summary
KPR Mill Ltd.’s valuation metrics show a trailing P/E of 42.0 and forward P/E of 29.6, which are aligned with the textile industry average but higher than most peers, indicating a premium valuation reflective of growth expectations. The company’s revenue growth is modest at 0.9% quarterly, supported by positive earnings growth of 11.1% year-over-year, while cash flow remains strong with operating cash flow of ₹11.1 billion and free cash flow of ₹5.4 billion, demonstrating healthy financial performance. Financial health is robust, with a low debt-to-equity ratio of 0.10 and a high current ratio of 4.37, indicating strong liquidity and manageable leverage. Sector-specific opportunities include government support through customs duty exemptions on cotton imports, which may reduce input costs and enhance competitiveness, while challenges include regulatory risks and global market volatility. Considering India’s regulatory environment and evolving consumer trends, KPR Mill’s integrated business model and export orientation position it well to capitalize on sector growth.
Overall Business and Market Assessment
Supporting Factors: Key supporting factors include strong profitability metrics with a 16.2% ROE, solid cash flow generation, and favorable government policies aiding raw material availability. Risks to monitor involve valuation premiums relative to peers, potential regulatory shifts, and competitive pressures in the textile sector. The appropriate investment timeframe is medium to long-term, given the company’s steady growth profile and sector dynamics. Overall, KPR Mill presents a balanced risk-reward profile with strengths in financial health and market position tempered by valuation considerations.
Risk Factors: No data
SWOT Analysis
Strengths
- Integrated textile manufacturing capabilities spanning yarn, fabric, and garments.
- Strong profitability with a 16.2% return on equity and 13.0% net profit margin.
- Robust liquidity position with a current ratio of 4.37 and low debt-to-equity ratio of 0.10.
- Significant market capitalization and leadership within the Indian textile sector.
Weaknesses
- High valuation multiples compared to industry peers, including P/E of 42.0 and P/B of 6.81.
- Modest revenue growth rate of 0.9% quarterly, indicating limited near-term expansion.
- Relatively concentrated shareholding with over 67% held by promoters, potentially limiting public float.
- Dependence on raw material prices and import policies affecting input costs.
Opportunities
- Government exemption of customs duty on cotton imports improving raw material availability.
- Growing global demand for textiles and apparel supporting export potential.
- Technological advancements enabling efficiency and sustainability in production.
- Potential expansion through capacity increases and strategic partnerships.
Threats
- Regulatory changes and trade policy uncertainties impacting export dynamics.
- Intense competition within the textile manufacturing industry domestically and internationally.
- Volatility in raw material prices affecting cost structures and margins.
- Macroeconomic factors such as currency fluctuations and global demand slowdowns.
Company Description
KPR Mill Ltd. is an influential player in the textile manufacturing industry, recognized for its comprehensive production capabilities that encompass yarn, fabric, and garments. The company plays a pivotal role in the supply chain by providing fully integrated services from processing raw cotton into finished textiles, thereby catering to a global market. Headquartered in India, KPR Mill Ltd. has established itself as a key contributor to the textile export sector, bolstered by state-of-the-art production facilities and a strong commitment to quality. With its expansive product range that covers various segments such as knitted fabric, cotton yarn, and a variety of apparel, KPR Mill Ltd. positively impacts fashion, apparel, and retail industries worldwide. Its presence strengthens the textile sector's contribution to the economy while continually adapting to technological advancements to maintain efficiency and sustainability in production processes. This enables KPR Mill Ltd. to remain a significant force in global textile markets, reflecting its dedication to innovation and excellence.