
Kpit Technologies Ltd (KPITTECH)
Stock Analysis Report
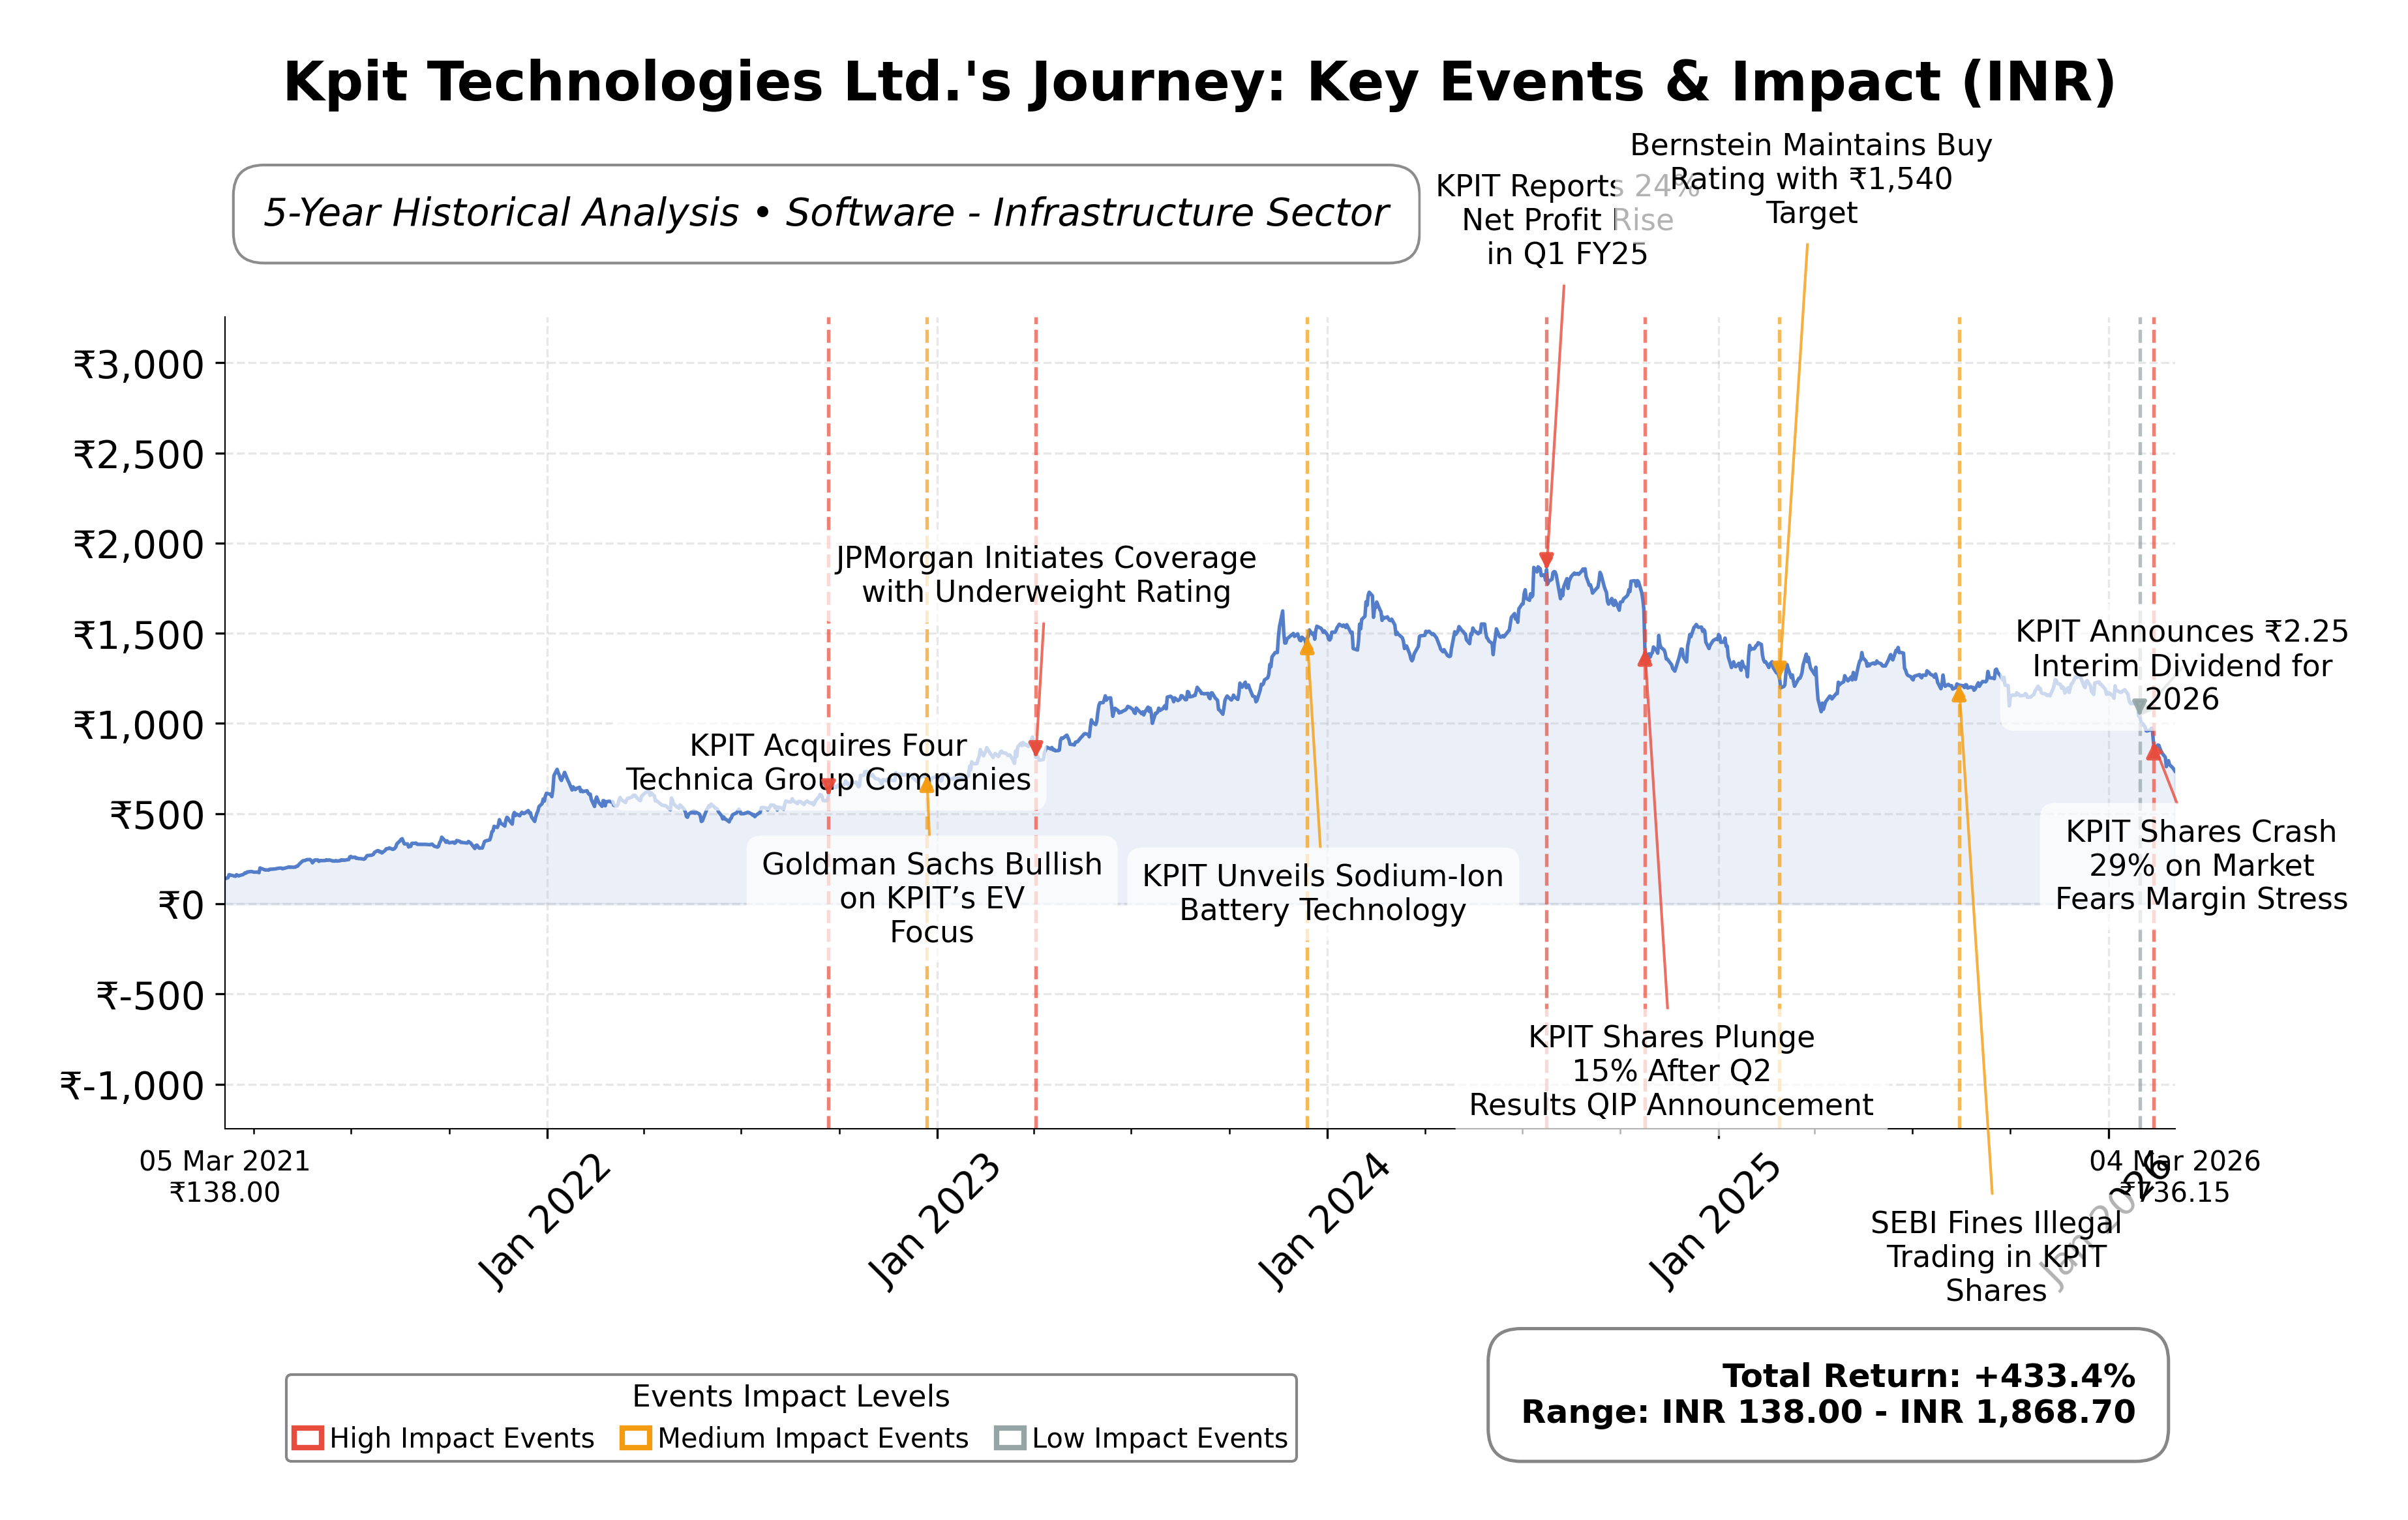
Stock Journey
Key Positives and Key Risks
Pros
- Return on equity of 28.83% demonstrates efficient capital utilization and profitability.
- Operating cash flow of ₹15.03 billion and free cash flow of ₹8.40 billion indicate strong cash generation supporting operations.
- Valuation metrics such as P/E ratio of 29.33 and forward P/E of 23.84 align closely with industry averages, suggesting fair market pricing.
Cons
- Stock price has declined approximately 50% from its 52-week high, reflecting significant downside risk and market skepticism.
- Negative quarterly earnings growth of -28.7% signals recent earnings volatility and potential performance challenges.
- Current ratio below 1 (0.93) may indicate short-term liquidity constraints requiring monitoring.
Disclosure: This information is for general awareness and does not constitute investment advice
Report Summary
Kpit Technologies Ltd. operates as a global IT consulting and services company specializing in software solutions for the automotive industry. The company focuses on connected, autonomous, shared, and electric mobility technologies, providing embedded systems and product engineering services to automotive OEMs and Tier 1 suppliers. Positioned in the Software - Infrastructure industry within the Indian market, Kpit Technologies leverages its expertise to support digital transformation and innovation in mobility solutions worldwide.
Financially, Kpit Technologies reports a market capitalization of approximately â¹210.05 billion and an enterprise value near â¹203.72 billion. The trailing P/E ratio stands at 29.33 with a forward P/E of 23.84, reflecting valuation metrics aligned with industry norms. The company posted trailing twelve months (TTM) revenue of â¹62.72 billion with a profit margin of 11.46% and operating margin of 15.6%. Return on equity (TTM) is robust at 28.83%, supported by strong operating cash flow of â¹15.03 billion and free cash flow of â¹8.40 billion. The stock price currently trades near â¹718.80, significantly below its 52-week high of â¹1434.50, indicating notable downside risk.
Technical indicators reveal a downward trend with the stock recently hitting a 52-week low and trading below its 50-day and 200-day moving averages, signaling bearish momentum. Recent strategic developments include leadership changes such as the appointment of an independent director and participation in investor conferences. Strengths include solid profitability and cash flow generation, while risks involve sector headwinds, valuation pressures, and stock price volatility. Market sentiment appears cautious amid ongoing challenges in the IT sector and competitive pressures.
Within the Indian Software - Infrastructure sector, Kpit Technologies compares with peers such as Oracle Financial Services Software Limited, One 97 Communications Ltd. (Paytm), Ce Info Systems Ltd., and Newgen Software Technologies Ltd. Kpitâs valuation metrics like P/E and EV/EBITDA are moderate relative to peers, with a market cap smaller than Paytm and Oracle Financial Services but larger than some smaller peers. Return on equity is competitive, though the stock price has underperformed recently compared to peers. The companyâs positioning reflects a mid-tier player with focused automotive industry expertise.
Kpit Technologies navigates a complex industry landscape marked by rapid technological change and competitive dynamics in automotive software solutions. Recent achievements include improved valuation perceptions and governance enhancements, while challenges persist in sustaining earnings growth and market confidence amid sector volatility. The company stands at a pivotal moment where strategic execution and market conditions will significantly influence its trajectory. Given the current financial and technical data, a balanced stance emphasizing monitoring of developments and valuation shifts may be appropriate for those evaluating the stock.
Company and Industry Overview
Company Basics
Price Performance
Company Size
Shareholding Pattern
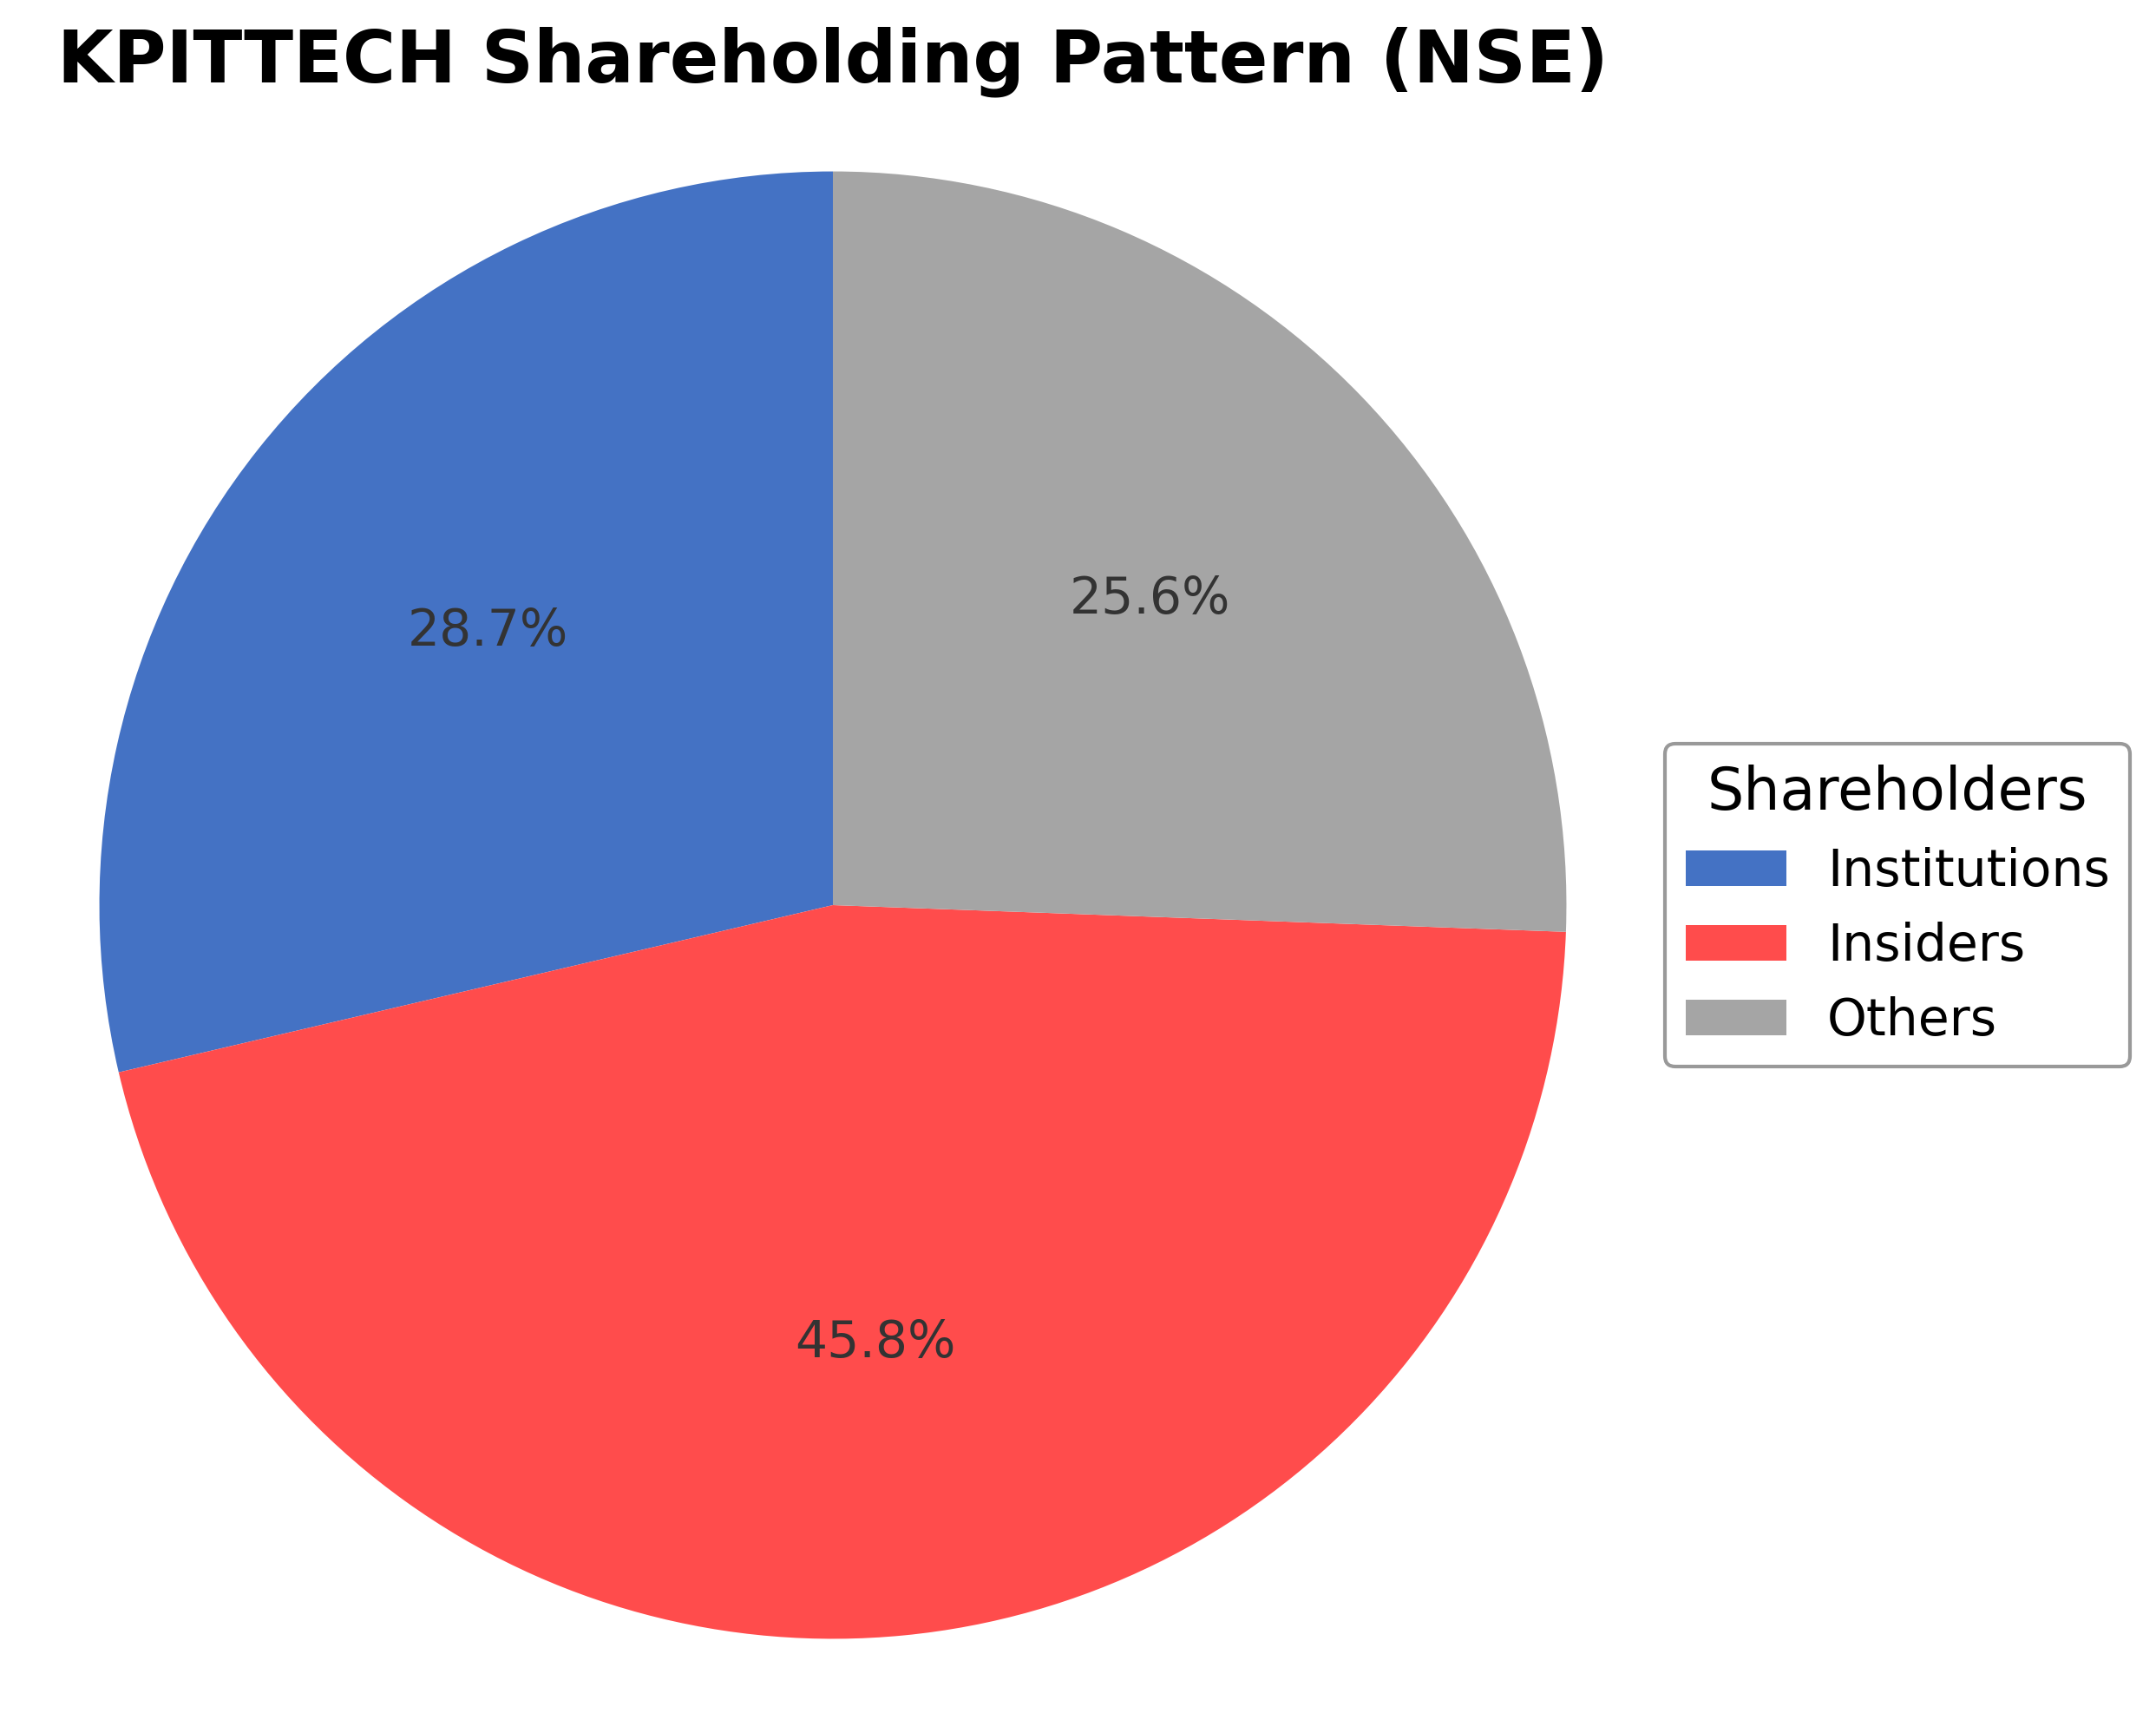
Kpit Technologies Ltd.'s ownership structure comprises approximately 45.76% held by insiders including executives and board members, with institutional investors holding about 28.66%, and the remaining 25.58% held by public and other shareholders. Over the past 12-24 months, institutional ownership has shown moderate activity with some accumulation noted among major mutual funds and asset managers, reflecting measured confidence in the company’s prospects. The shareholding pattern suggests a stable governance framework with significant promoter control balanced by institutional participation, which may influence strategic decisions and corporate actions. Market sentiment appears cautiously optimistic, with ownership trends indicating a watchful approach amid sector challenges.
Sector and Industry Analysis
KPIT Technologies Ltd operates within the broader Information Technology (IT) and Engineering Services sector, a critical and rapidly evolving segment of the global technology industry. The IT services sector in India, where KPIT is headquartered, is a major contributor to the national economy, with market size estimated in hundreds of billions of USD and a consistent growth trajectory driven by digital transformation initiatives across industries worldwide. Key players in this sector include large multinational corporations such as Tata Consultancy Services (TCS), Infosys, Wipro, and HCL Technologies, alongside specialized firms like KPIT that focus on engineering and product development services, particularly in automotive, manufacturing, and energy domains. The sector benefits from strong demand for software development, IT consulting, and engineering R&D services, supported by a skilled workforce and cost advantages.
Industry trends shaping KPIT’s operating environment include accelerated adoption of emerging technologies such as Artificial Intelligence (AI), Internet of Things (IoT), cloud computing, and autonomous vehicle technologies. The shift towards electric vehicles (EVs) and smart mobility solutions presents significant growth opportunities for engineering service providers specializing in automotive software and embedded systems, areas where KPIT has established expertise. Additionally, increasing emphasis on sustainability and energy efficiency is driving demand for innovative engineering solutions. Consumer behavior in enterprise IT is evolving towards integrated digital ecosystems, with clients seeking end-to-end solutions that combine software, hardware, and analytics, pushing service providers to expand capabilities and invest in R&D.
The regulatory landscape for KPIT and the IT services sector is shaped by data protection laws, intellectual property rights, export controls, and compliance with international standards such as GDPR in Europe and CCPA in the US. In India, policies promoting digital infrastructure development, Make in India initiatives, and incentives for technology innovation impact the sector positively. However, evolving cybersecurity regulations and cross-border data flow restrictions require firms to maintain robust compliance frameworks. Additionally, the sector faces scrutiny regarding labor practices and visa regulations, especially for companies with significant offshore delivery models.
Competitive dynamics in the IT and engineering services industry are characterized by a mix of large integrated players and niche specialists. Barriers to entry include the need for deep domain expertise, continuous technology innovation, and established client relationships. KPIT’s competitive positioning leverages its specialization in automotive and manufacturing engineering services, differentiating it from broader IT service providers. The market structure is moderately consolidated, with competition based on technological capabilities, delivery excellence, and pricing. Strategic partnerships, acquisitions, and investments in emerging technologies are common competitive strategies. Overall, the sector demands agility and innovation to maintain relevance amid rapid technological change and evolving client expectations.
Note: Analysis synthesized from industry research, market reports, and regulatory filings. Information is subject to change based on market conditions.
Illustrative Scenario Analysis
DCF Assumptions:
Method: Two-Stage EPS-Priority Model
Financials
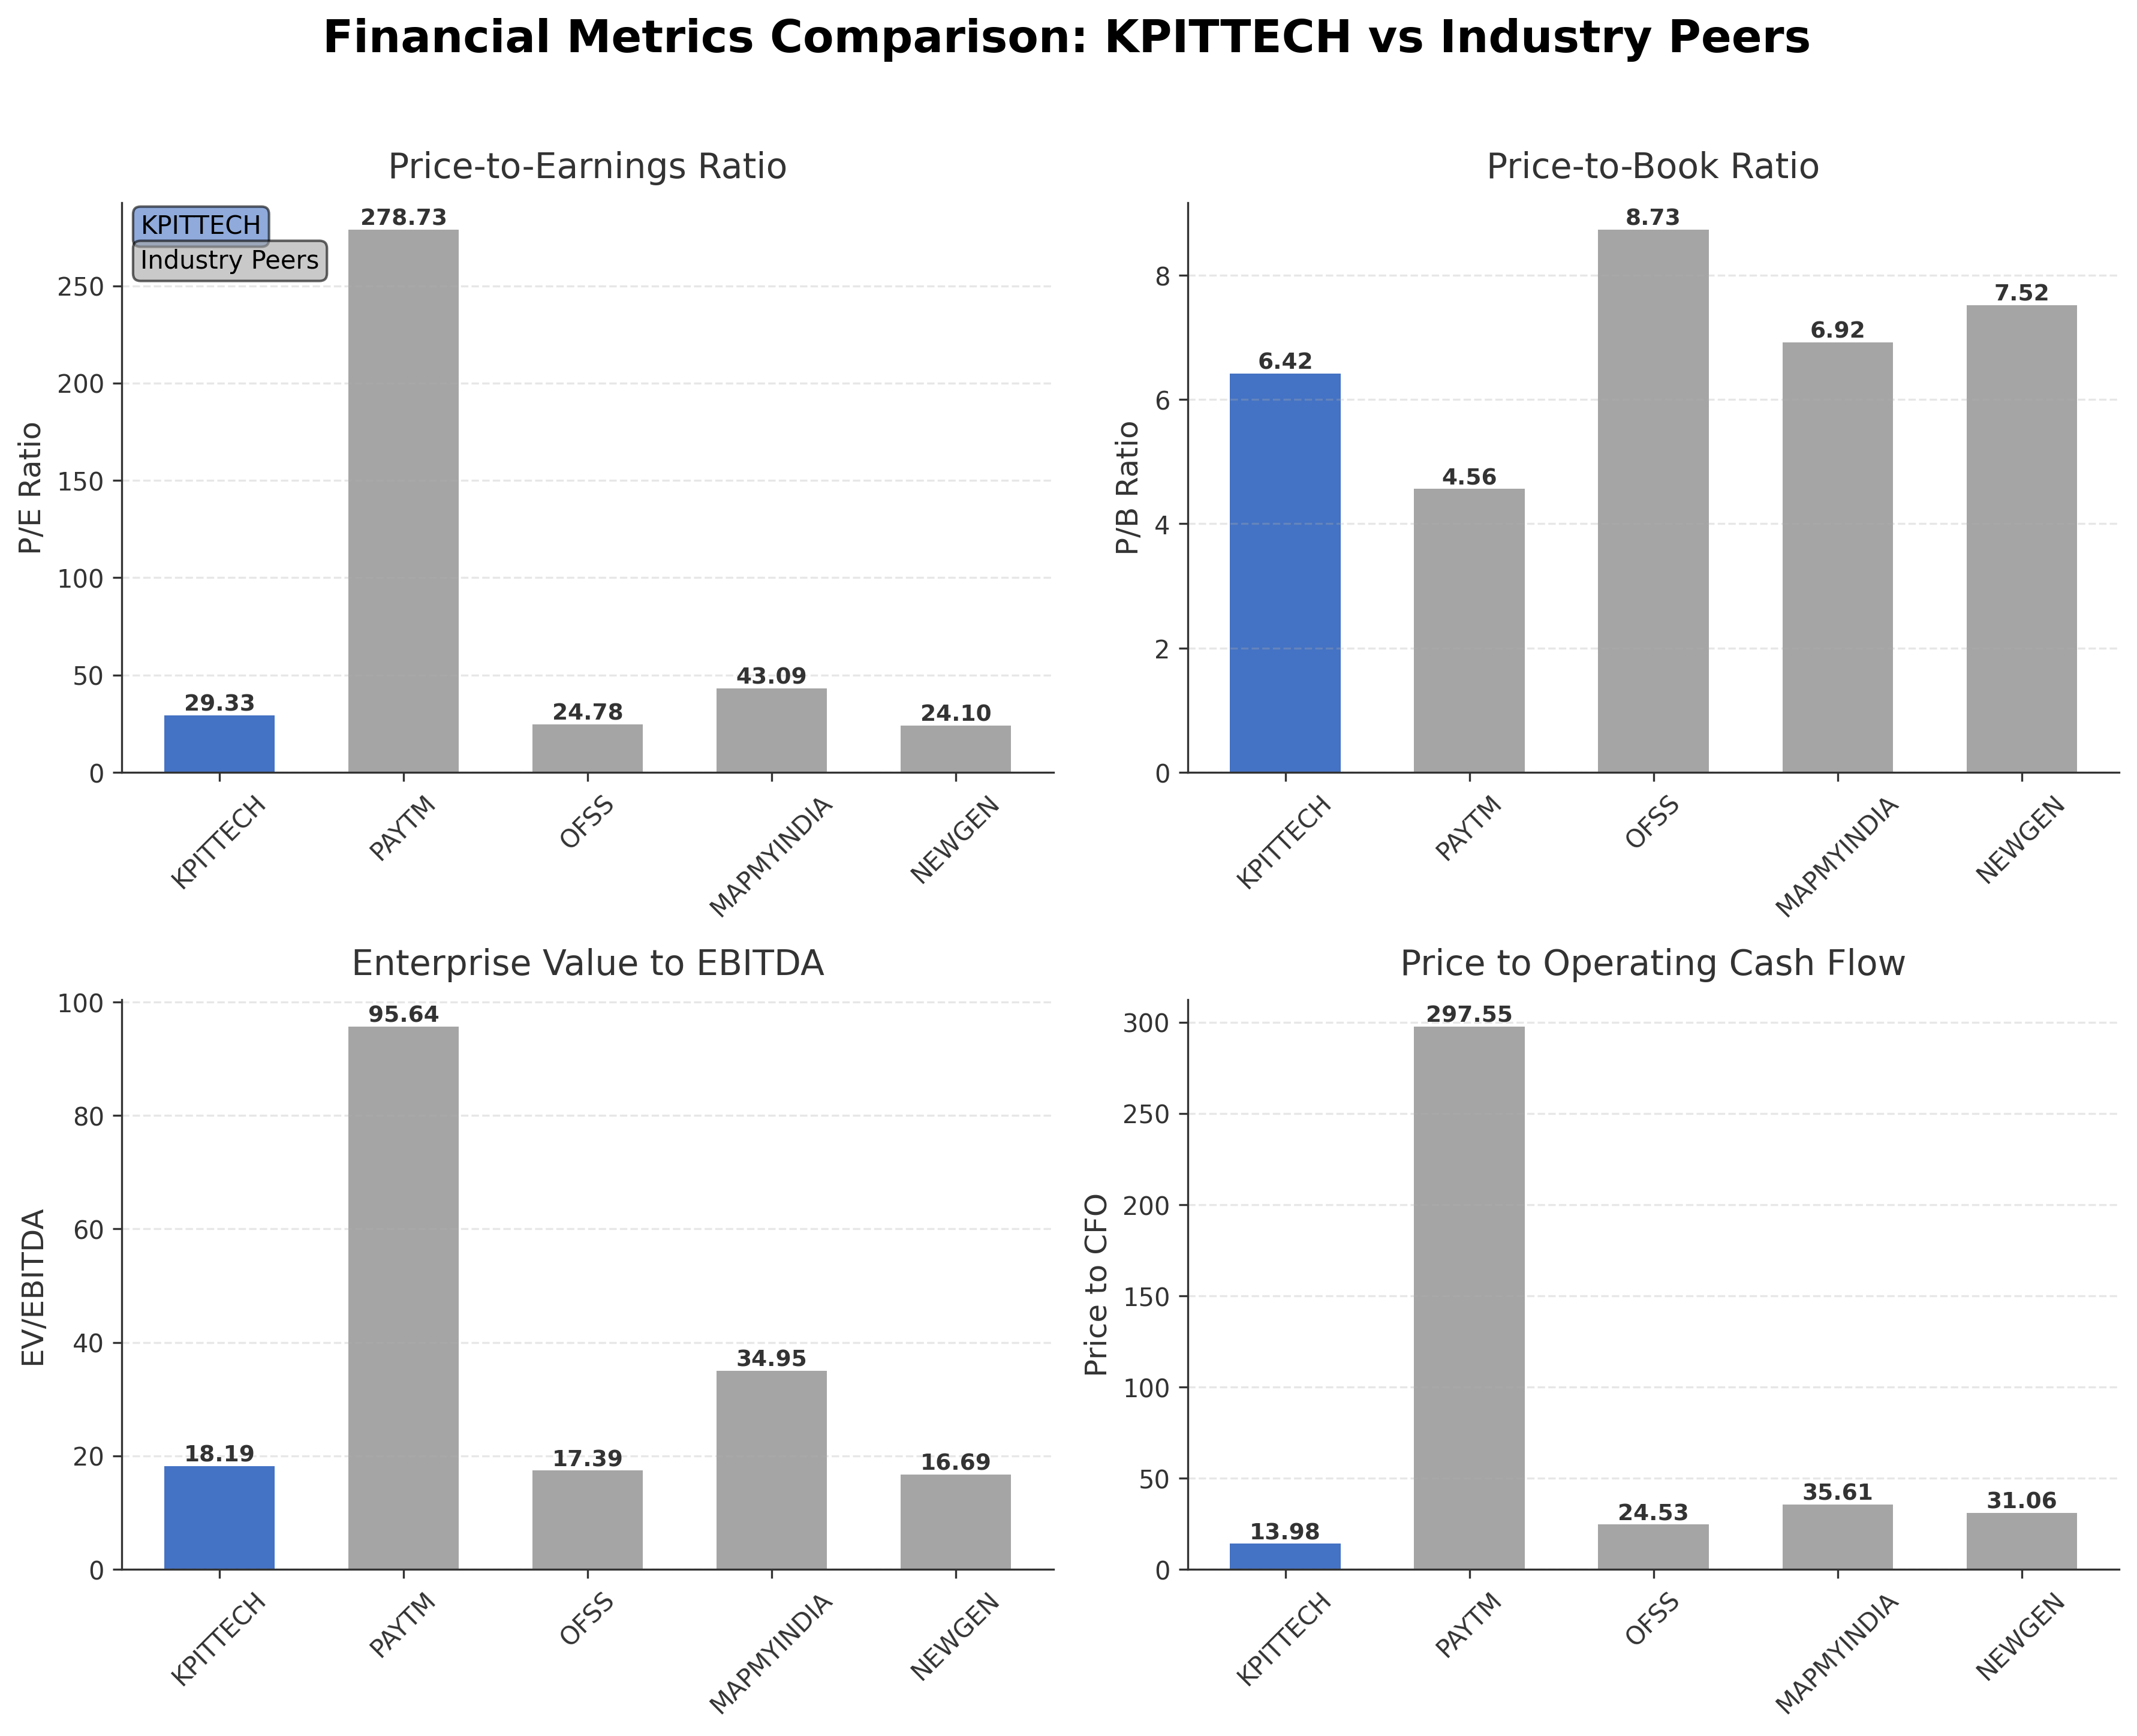
Peer Analysis
| Company Name | Market Cap | P/E Ratio | P/B Ratio | EV/EBITDA | Price to CFO |
|---|---|---|---|---|---|
| Kpit Technologies Ltd. | ₹210.05B | 29.33 | 6.42 | 18.19 | 13.98 |
| One 97 Communications Ltd. | ₹702.81B | 278.73 | 4.56 | 95.64 | 297.55 |
| Oracle Financial Services Software Limited | ₹603.61B | 24.78 | 8.73 | 17.39 | 24.53 |
| Ce Info Systems Ltd. | ₹56.59B | 43.09 | 6.92 | 34.95 | 35.61 |
| Newgen Software Technologies Ltd. | ₹71.63B | 24.10 | 7.52 | 16.69 | 31.06 |
Comparison Analysis: Kpit Technologies Ltd. presents a moderate valuation profile relative to its Indian software infrastructure peers, with a P/E ratio of 29.33 and EV/EBITDA of 18.19, positioning it between higher valued peers like Paytm and more moderately valued firms such as Oracle Financial Services and Newgen Software. The company’s return on equity at 28.83% is competitive, exceeding several peers, indicating efficient capital utilization. Price-to-CFO is lower than peers like Paytm and Ce Info Systems, suggesting relatively better cash flow valuation. Market capitalization places Kpit as a mid-sized player in the sector, with room for growth relative to larger competitors.
Financial Metrics Comparison with Peers
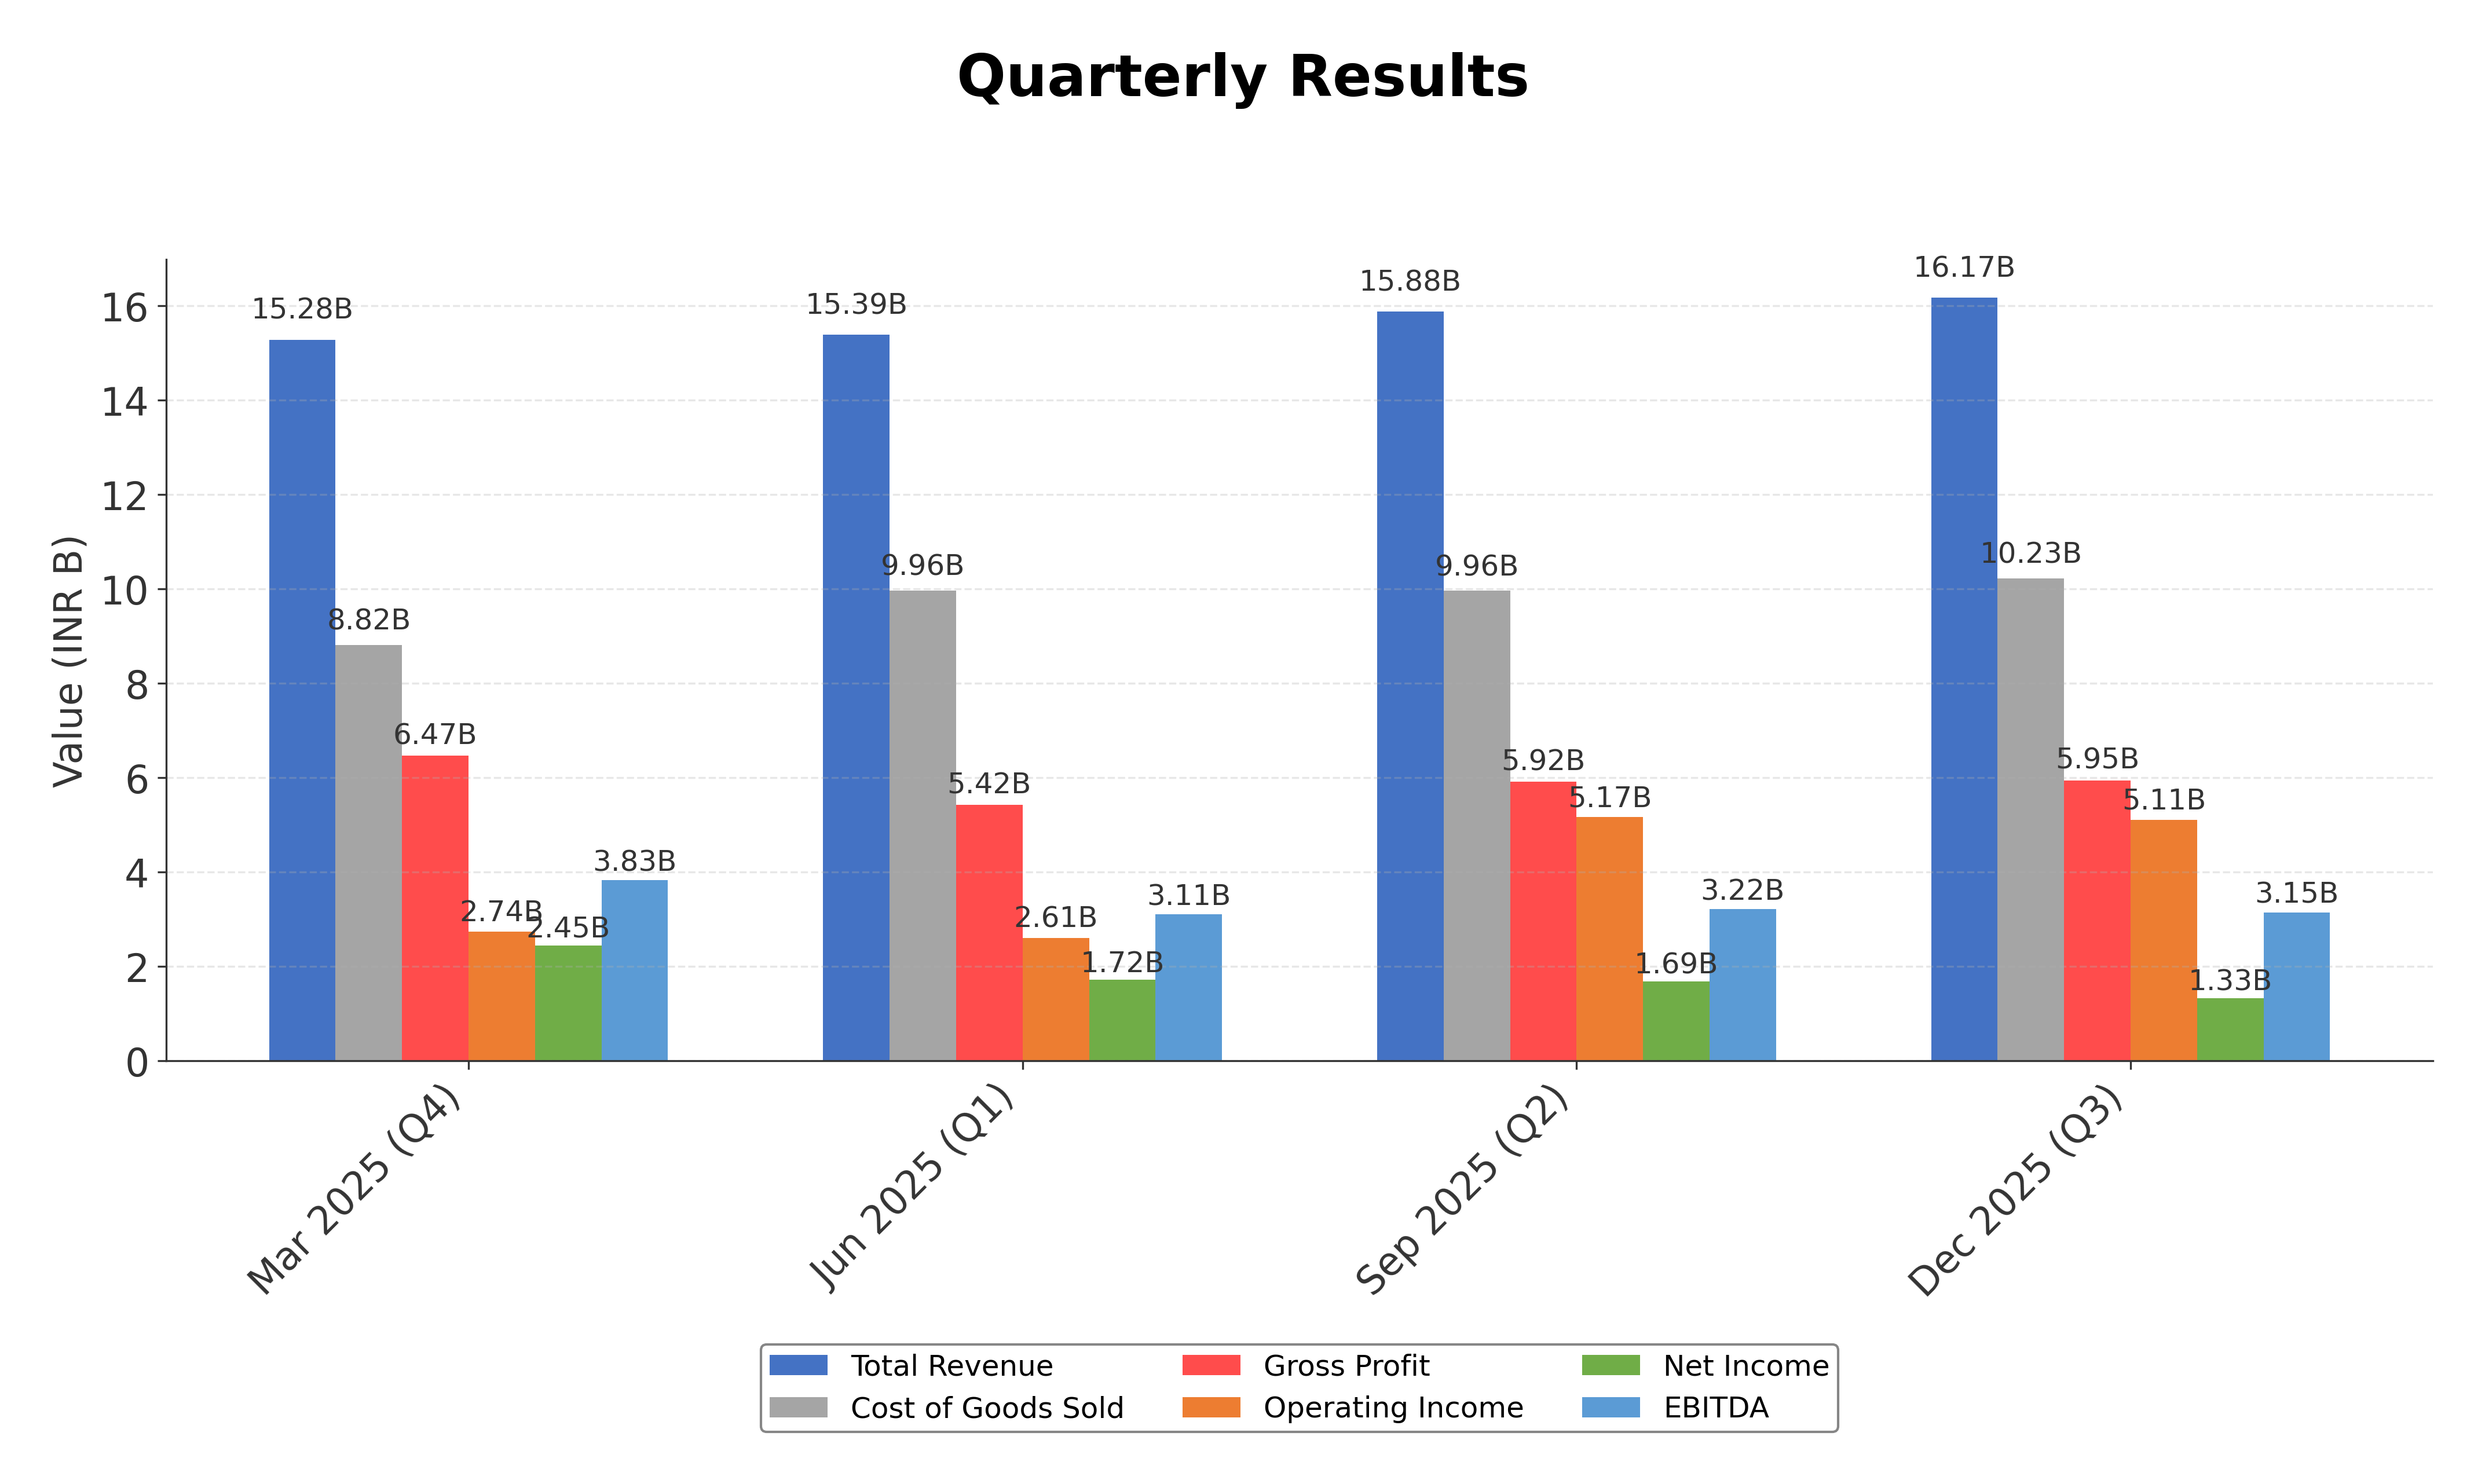
Financial Statements
Comprehensive financial data including income, balance sheet, and cash flow metrics
Income Statement
| fiscal_date | 2025-03-31 | 2024-03-31 | 2023-03-31 | 2022-03-31 | 2021-03-31 |
|---|---|---|---|---|---|
| Sales | 58.42B | 48.72B | 33.65B | 24.32B | 20.36B |
| Cost Of Goods | 36.60B | 31.39B | 21.77B | 15.96B | 13.21B |
| Gross Profit | 21.82B | 17.32B | 11.89B | 8.36B | 7.15B |
| Operating Expense Selling General And Administrative | 5.69B | 4.45B | 3.30B | 1.98B | 2.27B |
| Operating Expense Other Operating Expenses | 2.40B | 2.23B | 1.62B | 1.43B | 1.42B |
| Operating Income | 10.14B | 8.04B | 4.94B | 3.38B | 1.82B |
| Non Operating Interest Income | 149.96M | 112.35M | 140.59M | 194.33M | 104.19M |
| Non Operating Interest Expense | 423.92M | 546.04M | 323.13M | 193.95M | 172.53M |
| Pretax Income | 11.33B | 8.00B | 4.97B | 3.45B | 1.78B |
| Income Tax | 2.93B | 2.02B | 1.10B | 683.01M | 305.20M |
| Net Income | 8.40B | 5.99B | 3.87B | 2.76B | 1.47B |
| Eps Basic | 30.93 | 21.95 | 14.10 | 10.17 | 5.43 |
| Eps Diluted | 30.70 | 21.77 | 13.95 | 10.05 | 5.40 |
| Basic Shares Outstanding | 271.48M | 270.89M | 270.12M | 269.54M | 268.95M |
| Diluted Shares Outstanding | 271.48M | 270.89M | 270.12M | 269.54M | 268.95M |
| Ebit | 11.75B | 8.55B | 5.29B | 3.64B | 1.95B |
| Ebitda | 13.80B | 10.56B | 6.82B | 4.98B | 3.26B |
| Net Income Continuous Operations | 11.33B | 8.00B | 4.97B | 2.76B | 1.47B |
| Minority Interests | 0.00 | -39.80M | -58.65M | -20.10M | -9.66M |
| Preferred Stock Dividends | 0.00 | 0.00 | 0.00 | 0.00 | 0.00 |
Source: Financial statements and regulatory filings
Balance Sheet
| fiscal_date | 2025-03-31 | 2024-03-31 | 2023-03-31 | 2022-03-31 | 2021-03-31 |
|---|---|---|---|---|---|
| Cash And Cash Equivalents | 10.69B | 6.55B | 4.54B | 3.42B | 2.86B |
| Accounts Receivable | 7.55B | 7.49B | 5.92B | 3.71B | 3.08B |
| Total Assets | 50.33B | 41.68B | 34.01B | 23.36B | 19.68B |
| Total Liabilities | 21.21B | 20.05B | 17.37B | 10.11B | 7.58B |
| Long Term Debt | 2.66B | 2.17B | 1.87B | 1.85B | 1.92B |
| Shareholders Equity | 29.12B | 21.63B | 16.63B | 13.25B | 12.10B |
Source: Financial statements and regulatory filings
Cash Flow Statement
| fiscal_date | 2025-03-31 | 2024-03-31 | 2023-03-31 | 2022-03-31 | 2021-03-31 |
|---|---|---|---|---|---|
| Operating Activities Net Income | 11.33B | 8.00B | 4.97B | 2.76B | 1.47B |
| Operating Activities Stock Based Compensation | 671.73M | 91.65M | 118.74M | 87.97M | 103.60M |
| Operating Activities Other Non Cash Items | 270.02M | 435.01M | 173.72M | 21.76M | 20.41M |
| Operating Activities Accounts Receivable | 767.14M | -1.80B | -2.05B | -370.16M | 1.06B |
| Operating Activities Other Assets Liabilities | 1.99B | 1.93B | 405.75M | 1.26B | 1.51B |
| Operating Activities Operating Cash Flow | 15.03B | 8.65B | 3.62B | 3.77B | 4.17B |
| Investing Activities Capital Expenditures | -1.27B | -1.55B | -1.28B | -685.09M | -594.78M |
| Investing Activities Net Acquisitions | -2.28B | -3.56B | -6.21B | -1.07B | -206.13M |
| Investing Activities Purchase Of Investments | -26.65B | -31.06B | -16.52B | -4.35B | -6.02B |
| Investing Activities Sale Of Investments | 24.03B | 30.47B | 21.78B | 2.93B | 1.76B |
| Investing Activities Other Investing Activity | -226.83M | N/A | N/A | N/A | N/A |
| Investing Activities Investing Cash Flow | -6.40B | -5.69B | -2.23B | -3.17B | -5.06B |
| Financing Activities Long Term Debt Payments | -1.82B | -4.68B | -1.11B | -1.81B | -2.73B |
| Financing Activities Short Term Debt Issuance | -391.34M | -152.68M | -44.31M | 0.00 | -166.10M |
| Financing Activities Common Stock Issuance | 5.35M | 17.05M | 17.28M | 27.45M | 6.56M |
| Financing Activities Common Dividends | -1.93B | -1.29B | -891.63M | -741.30M | N/A |
| Financing Activities Financing Cash Flow | -4.14B | -6.11B | -2.25B | -2.52B | -2.89B |
| End Cash Position | 10.74B | 6.55B | 4.54B | 3.42B | 2.86B |
| Free Cash Flow | 12.60B | 8.46B | 3.33B | 4.06B | 5.68B |
| Financing Activities Common Stock Repurchase | N/A | 0.00 | -228.43M | 0.00 | N/A |
| Financing Activities Long Term Debt Issuance | N/A | N/A | N/A | N/A | 0.00 |
Source: Financial statements and regulatory filings
Technical Analysis
Key Insights
- The current trend direction is bearish, with the stock price declining and recently hitting a 52-week low, indicating sustained downward momentum.
- Key support levels are near ₹758 (52-week low), while resistance is observed around ₹1045 (50-day moving average) and ₹1188 (200-day moving average).
- The stock is trading below its 10-day, 50-day, and 200-day moving averages, reflecting weak price strength across short and long-term horizons.
- Momentum indicators show an RSI below neutral levels, MACD in negative territory, and stochastic oscillators indicating oversold conditions, suggesting bearish momentum but potential for consolidation.
- Multi-timeframe analysis confirms consistent downtrends on daily, weekly, and monthly charts, with no significant reversal signals currently evident.
- Potential market scenarios include continued downward pressure if support levels fail, or a stabilization phase if momentum indicators improve and price moves above key moving averages.
Trending News
1. Headline: Happiest Minds Technologies Ltd: Valuation Shifts Signal Renewed Price Attractiveness
Summary: However, the company’s PEG ratio ... like KPIT Technologies (27.12) and Zensar Technologies (0.99), suggesting either a lack of expected earnings growth or a temporary valuation anomaly. Investors should monitor upcoming earnings releases and guidance to better understand growth prospects and validate the current valuation stance. Is Happiest Minds Technologies Ltd your best ...
Sentiment: negative
2. Headline: KPIT Technologies Ltd Opens with Significant Gap Down Amid Market Concerns
Summary: KPIT Technologies Ltd commenced trading today with a significant gap down, opening nearly 10% lower than its previous close, reflecting heightened market apprehension following recent developments. The stock hit a fresh 52-week low, underperforming its sector and broader indices amid sustained ...
Sentiment: negative
3. Headline: KPIT Technologies Ltd Falls to 52-Week Low Amidst Continued Downtrend
Summary: KPIT Technologies Ltd has reached a new 52-week low of Rs.695.9 today, marking a significant decline in its stock price amid a sustained downward trend. The stock has underperformed its sector and broader market indices, reflecting a challenging period for the company within the Computers - ...
Sentiment: negative
4. Headline: KPIT Technologies Sees Sharp Open Interest Surge Amid Prolonged Downtrend
Summary: KPIT Technologies Ltd has witnessed a notable surge in open interest in its derivatives segment, coinciding with a sustained decline in its share price. The stock’s open interest rose by nearly 12% on 24 Feb 2026, signalling heightened market activity and shifting positioning among traders ...
Sentiment: positive
5. Headline: KPIT Technologies Participates in Two Major Investor Conferences in Mumbai
Summary: KPIT Technologies formally notified both BSE Limited and National Stock Exchange of India Ltd.
Sentiment: neutral
6. Headline: KPIT Tech Stock Plummets on Profit Drop, Sector Woes
Summary: KPIT Technologies faces a sharp stock decline following a Q3 profit miss, compounded by sector headwinds, AI disruption fears, and technical selling pressure.
Sentiment: negative
7. Headline: KPIT Tech falls 4% to over 2-yr low; analyst suggests 'sell on rise' | Markets News - Business Standard
Summary: KPIT Technologies shares today fell for the fifth straight session. An analyst has said that KPIT remains a 'sell on rise' candidate
Sentiment: negative
8. Headline: KPIT Tech and 4 Other Stocks with DII Holding Above 20% to Keep an Eye On
Summary: In the latest quarter, WeWork India Management Ltd saw a YoY revenue growth of 29 percent, going from Rs 492 Cr in Q3FY25 to Rs 634 Cr in Q3FY26, while the QoQ went up by 10 percent from Rs 575 Cr in Q2FY26. The company had made a Net loss of Rs 83 Cr in Q3FY25, this has now turned around to a profit of Rs 17 Cr in Q3FY26, while the QoQ growth stood at 183 percent from Rs 6 Cr in Q2FY26. KPIT Technologies ...
Sentiment: positive
9. Headline: KPIT Technologies Ltd Hits Intraday Low Amid Price Pressure on 13 Feb 2026
Summary: KPIT Technologies Ltd experienced a significant intraday decline on 13 Feb 2026, touching a new 52-week low of Rs 824.4 as the stock faced intense price pres...
Sentiment: negative
Summary: KPIT Tech Share Price: Find the latest news on KPIT Tech Stock Price. Get all the information on KPIT Tech with historic price charts for NSE / BSE. Experts & Broker view also get the KPIT Tech Ltd. buy/sell tips detailed news, announcements, Forecasts, Analysts, Valuation, Earning forecasts, ...
Sentiment: neutral
Recent Updates
News Summary
Recent news highlights a shift in market perception of Kpit Technologies Ltd., with an upgrade in investment rating from Sell to Hold driven by improved valuation and quality metrics. The company secured shareholder approval for the appointment of Parag Shah as an independent director, enhancing governance. Despite a notable 27% share price dip over recent months, valuation shifts suggest renewed price attractiveness. The company remains active in investor engagement through conferences, while broader sector challenges and stock price volatility persist. These developments collectively indicate a period of transition, with emphasis on governance, valuation, and market positioning.
News Sentiment
Sentiment across recent updates is cautiously positive, reflecting improved valuation perceptions and governance enhancements, balanced by neutral to negative views on share price performance and sector headwinds. The tone suggests measured optimism tempered by ongoing challenges, with sources indicating a watchful stance on future developments.
Analytical Overview
Analysis Summary
Valuation Metrics: Kpit Technologies’ trailing P/E of 29.33 and forward P/E of 23.84 are broadly in line with the industry average of 29.33, indicating a valuation consistent with sector norms. The PEG ratio is negative, reflecting recent earnings decline and growth concerns.
Growth Trajectory: Revenue growth stands at 9.4% quarterly, though quarterly earnings growth is negative at -28.7%, suggesting mixed signals on growth momentum. Operating and free cash flows remain strong, supporting operational stability.
Financial Health: The company maintains a low debt-to-equity ratio of 16.2%, with substantial cash reserves of ₹11.35 billion, indicating solid financial health and liquidity. The current ratio below 1 (0.93) may warrant monitoring for short-term obligations.
Sector Specific Factors: The automotive software sector faces challenges from rapid technological shifts and competitive pressures, alongside opportunities in electric and autonomous vehicle technologies. Indian market factors include regulatory dynamics and evolving consumer demand for mobility solutions.
Investment Conclusion
Supporting Factors: Strong return on equity at 28.83% and positive operating cash flow of ₹15.03 billion support financial robustness.
Risk Factors: Negative quarterly earnings growth and recent stock price decline highlight near-term performance risks.
SWOT Analysis
Strengths
- Strong expertise in automotive software solutions and embedded systems.
- Robust return on equity at 28.83% indicating efficient capital use.
- Healthy operating cash flow supporting operational needs.
- Significant promoter and institutional ownership ensuring governance stability.
Weaknesses
- Recent negative quarterly earnings growth indicating earnings volatility.
- Current ratio below 1 suggesting potential short-term liquidity concerns.
- Stock price trading significantly below 52-week high reflecting market skepticism.
- Negative PEG ratio signaling challenges in earnings growth expectations.
Opportunities
- Growing demand for connected, autonomous, and electric vehicle technologies.
- Expansion potential in global automotive digital transformation initiatives.
- Increasing investor interest following governance improvements.
- Participation in major investor conferences enhancing market visibility.
Threats
- Sector headwinds including technological disruption and competitive pressures.
- Volatility in stock price and market sentiment impacting valuation.
- Regulatory changes in automotive and technology sectors affecting operations.
- Potential macroeconomic challenges in the Indian and global markets.
Company Description
Kpit Technologies Ltd. is a global IT consulting and services company, primarily offering software solutions and technologies to the automotive industry. It focuses on connected, autonomous, shared, and electric mobility solutions, helping automotive companies accelerate their digital transformation and innovation initiatives. With a specialization in embedded systems, Kpit Technologies supports industries through software development services, integrated IT solutions, and product engineering enhancements. Its expertise influences various domains such as powertrain, autonomous driving, connected vehicles, and electric vehicle technology. Headquartered in India, Kpit Technologies operates worldwide, providing tailored technology solutions to major automotive OEMs and Tier 1 suppliers. The firm plays a critical role in shaping the future of mobility by addressing the industry's environmental, safety, and efficiency concerns with its advanced engineering capabilities and technological expertise.