
Kotyark Industries Limited (KOTYARK)
Stock Analysis Report
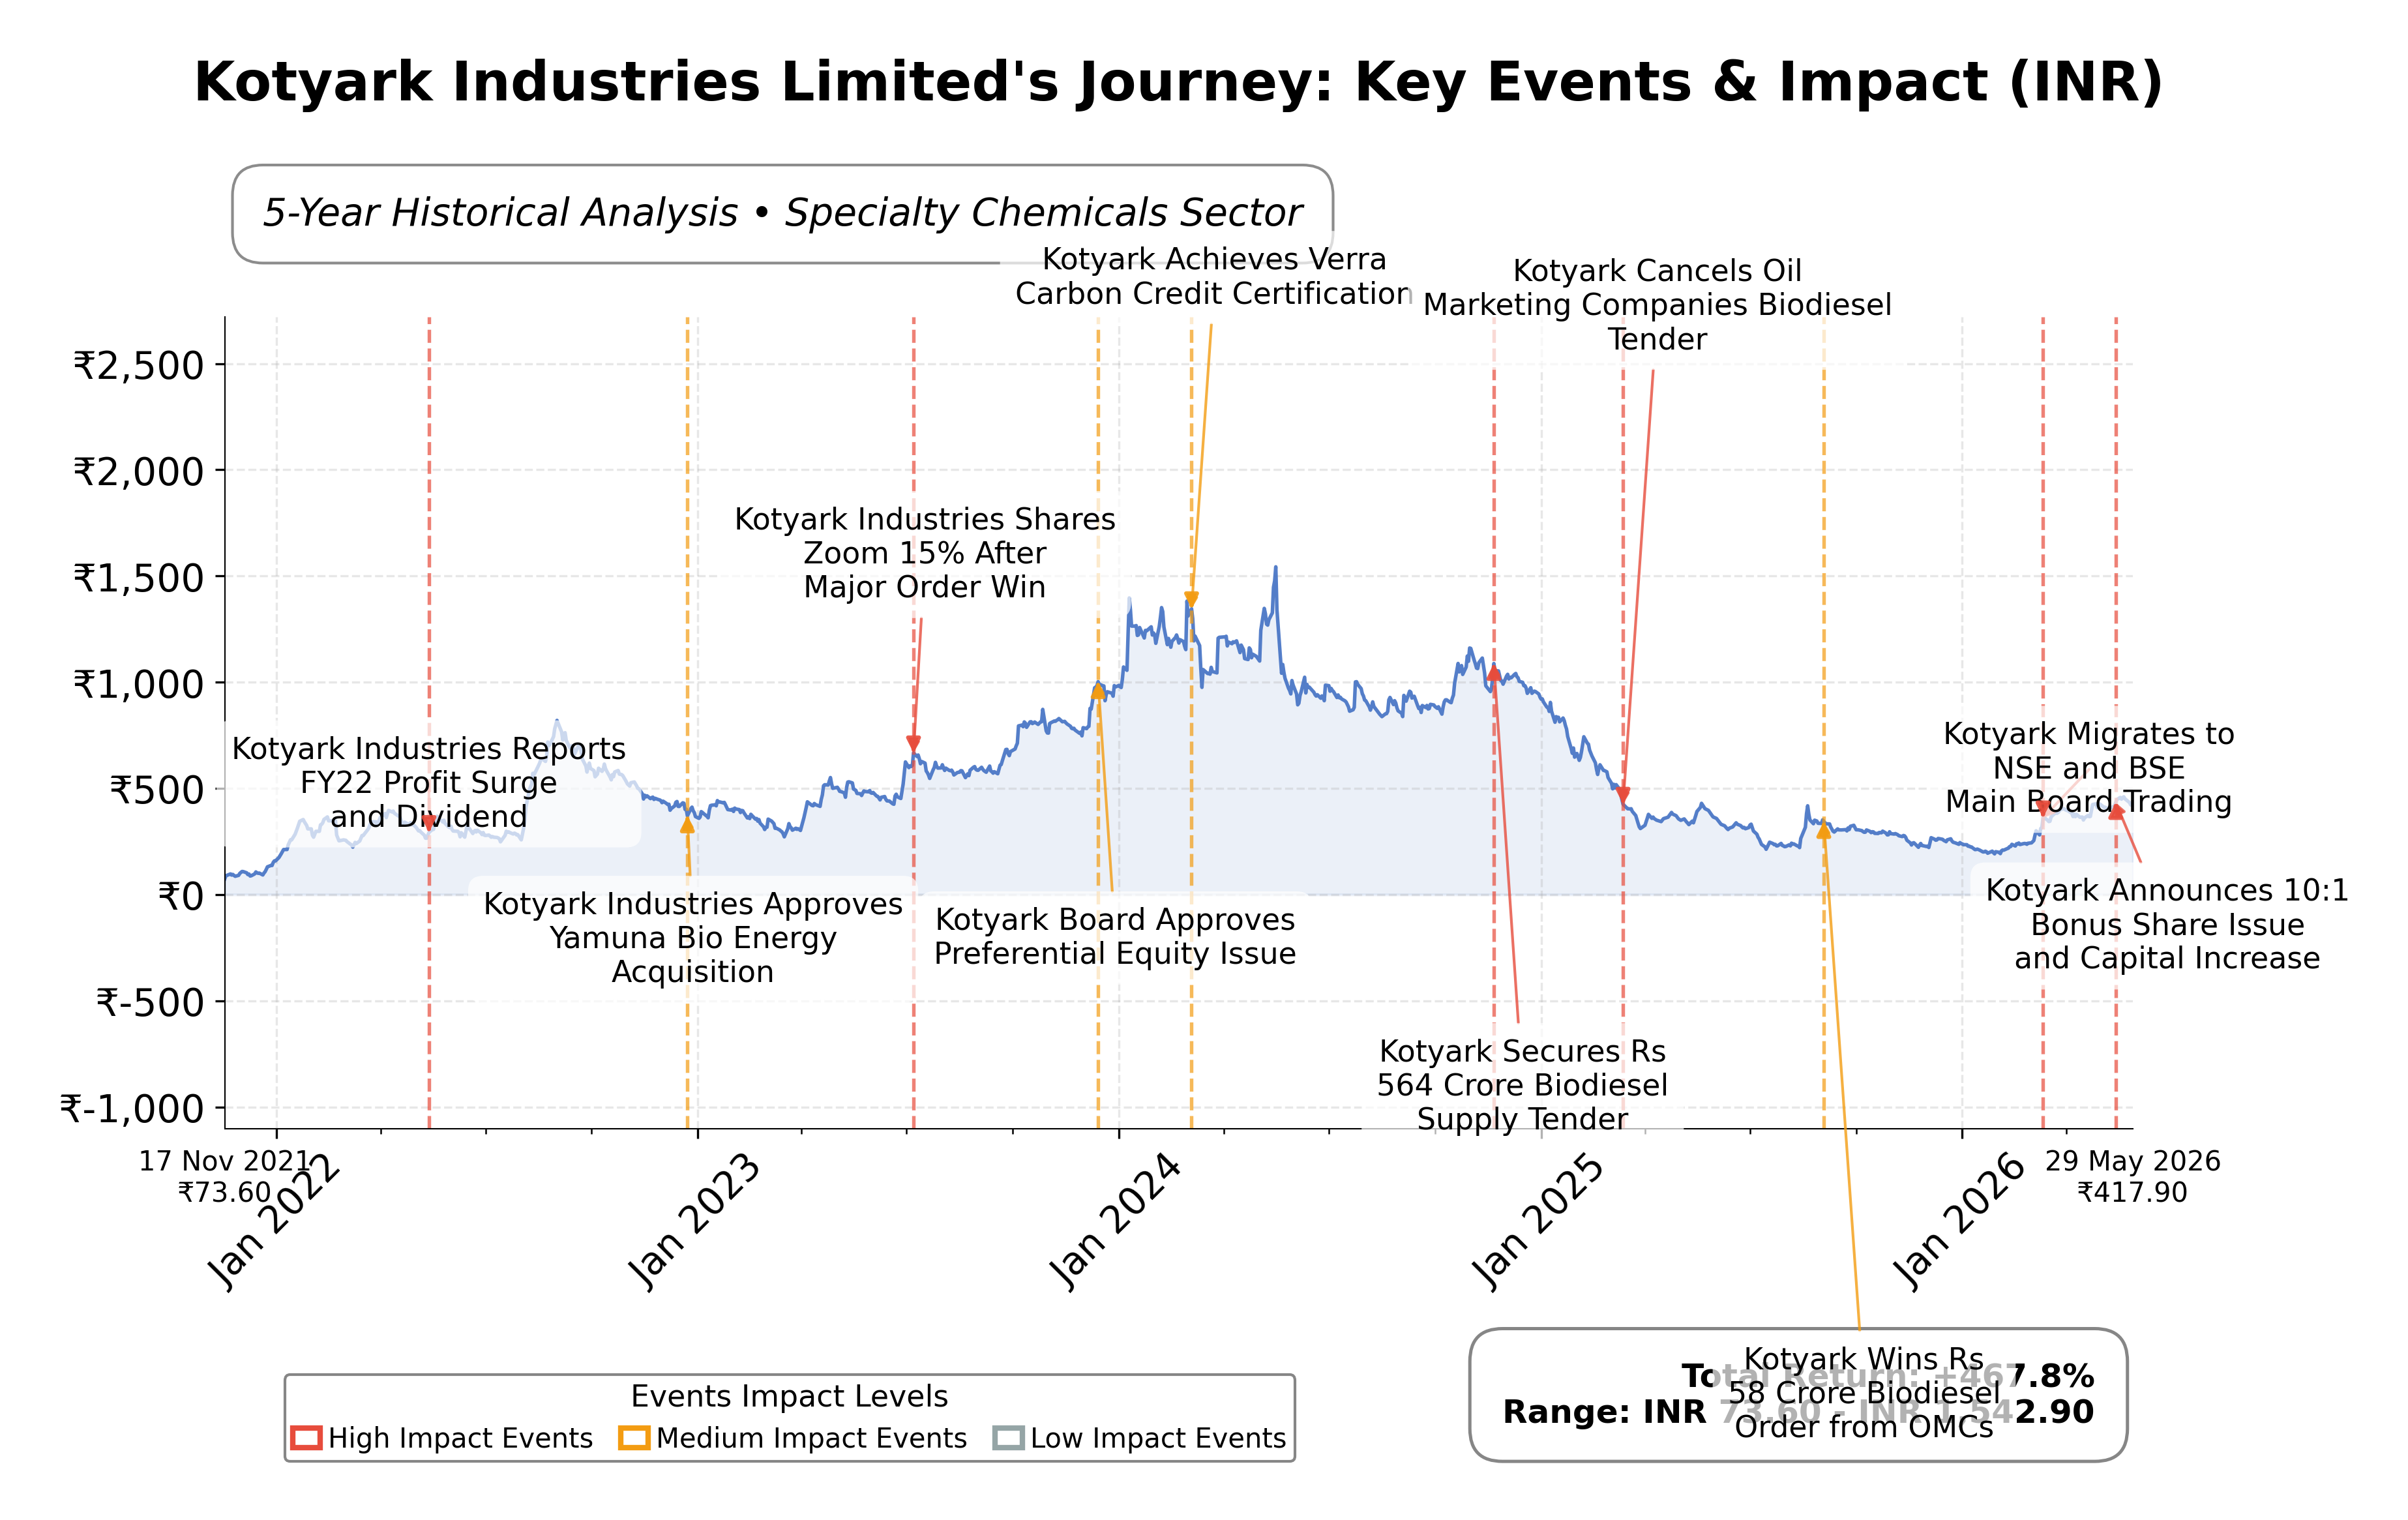
Stock Journey
Key Positives and Key Risks
Pros
- Kotyark Industries reported a 33.2% increase in FY26 PAT to ₹19.36 crore, indicating strong earnings growth.
- The company maintains a healthy current ratio of 3.22, reflecting solid liquidity to meet short-term obligations.
- Valuation metrics such as a trailing P/E of 22.89 and EV/EBITDA of 10.32 are lower than peer averages, suggesting relative undervaluation.
Cons
- Negative operating cash flow of ₹-3.92 crore and free cash flow of ₹-14.24 crore highlight cash generation challenges.
- Promoter shareholding decreased by 1.74%, which may raise concerns about insider confidence and governance.
- Absence of institutional investors and negative price to cash flow ratio (-110.40) indicate limited external funding and cash flow concerns.
Disclosure: This information is for general awareness and does not constitute investment advice
Report Summary
Kotyark Industries Limited operates in the specialty chemicals sector on the National Stock Exchange of India (NSE) under the symbol KOTYARK. The company specializes in manufacturing biodiesel and its by-products using an indigenous transesterification process. It serves diverse clients including oil marketing companies, transport contractors, and retail customers through its Green N Green brand. With production facilities in Rajasthan and Gujarat, Kotyark positions itself as a key player in India’s renewable biofuel industry, emphasizing sustainability and zero effluent discharge.
Financially, Kotyark reported trailing twelve months (TTM) revenue of approximately ₹314.87 crore with a gross margin of 38.39%, operating margin of 25.02%, and a net profit margin of 5.96%. The company’s return on equity (ROE) stands at 11.90%, and return on assets (ROA) at 8.86%, reflecting moderate profitability and efficient asset utilization. EBITDA margin improved to 15.23% in FY26, supporting a net income of ₹18.77 crore and earnings per share (EPS) of ₹18.26, indicating positive earnings growth.
Valuation metrics show a trailing price-to-earnings (P/E) ratio of 22.89, price-to-book (P/B) ratio of 2.38, and an enterprise value to EBITDA (EV/EBITDA) multiple of 10.32. The market capitalization is ₹4.33 billion, with the stock currently trading at ₹421.20 within a 52-week range of ₹191.20 to ₹464.25. These ratios suggest the stock is valued in line with industry peers but at a discount to larger specialty chemical companies in India, reflecting its micro-cap status and growth potential.
Kotyark’s strengths include a strong current ratio of 3.22 indicating liquidity, a relatively low debt-to-equity ratio of 35.58%, and a diversified feedstock platform. However, risks include promoter stake reduction by 1.74%, negative operating cash flow of ₹-3.92 crore, and negative free cash flow of ₹-14.24 crore, which may impact financial flexibility. Recent strategic actions include approval of a 10:1 bonus share issue and an increase in authorized share capital, signaling potential for enhanced liquidity and future capital raising.
Technically, the stock is trading above its 50-day (₹401.92) and 200-day (₹302.03) moving averages, with a negative beta of -0.68 indicating low correlation with market movements. Momentum indicators show mixed signals across timeframes. Overall, the data reflects a company in growth mode with improving profitability but some cash flow challenges, warranting a balanced view on near-term stock performance.
Company and Industry Overview
Company Basics
Price Performance
Company Size
Shareholding Pattern
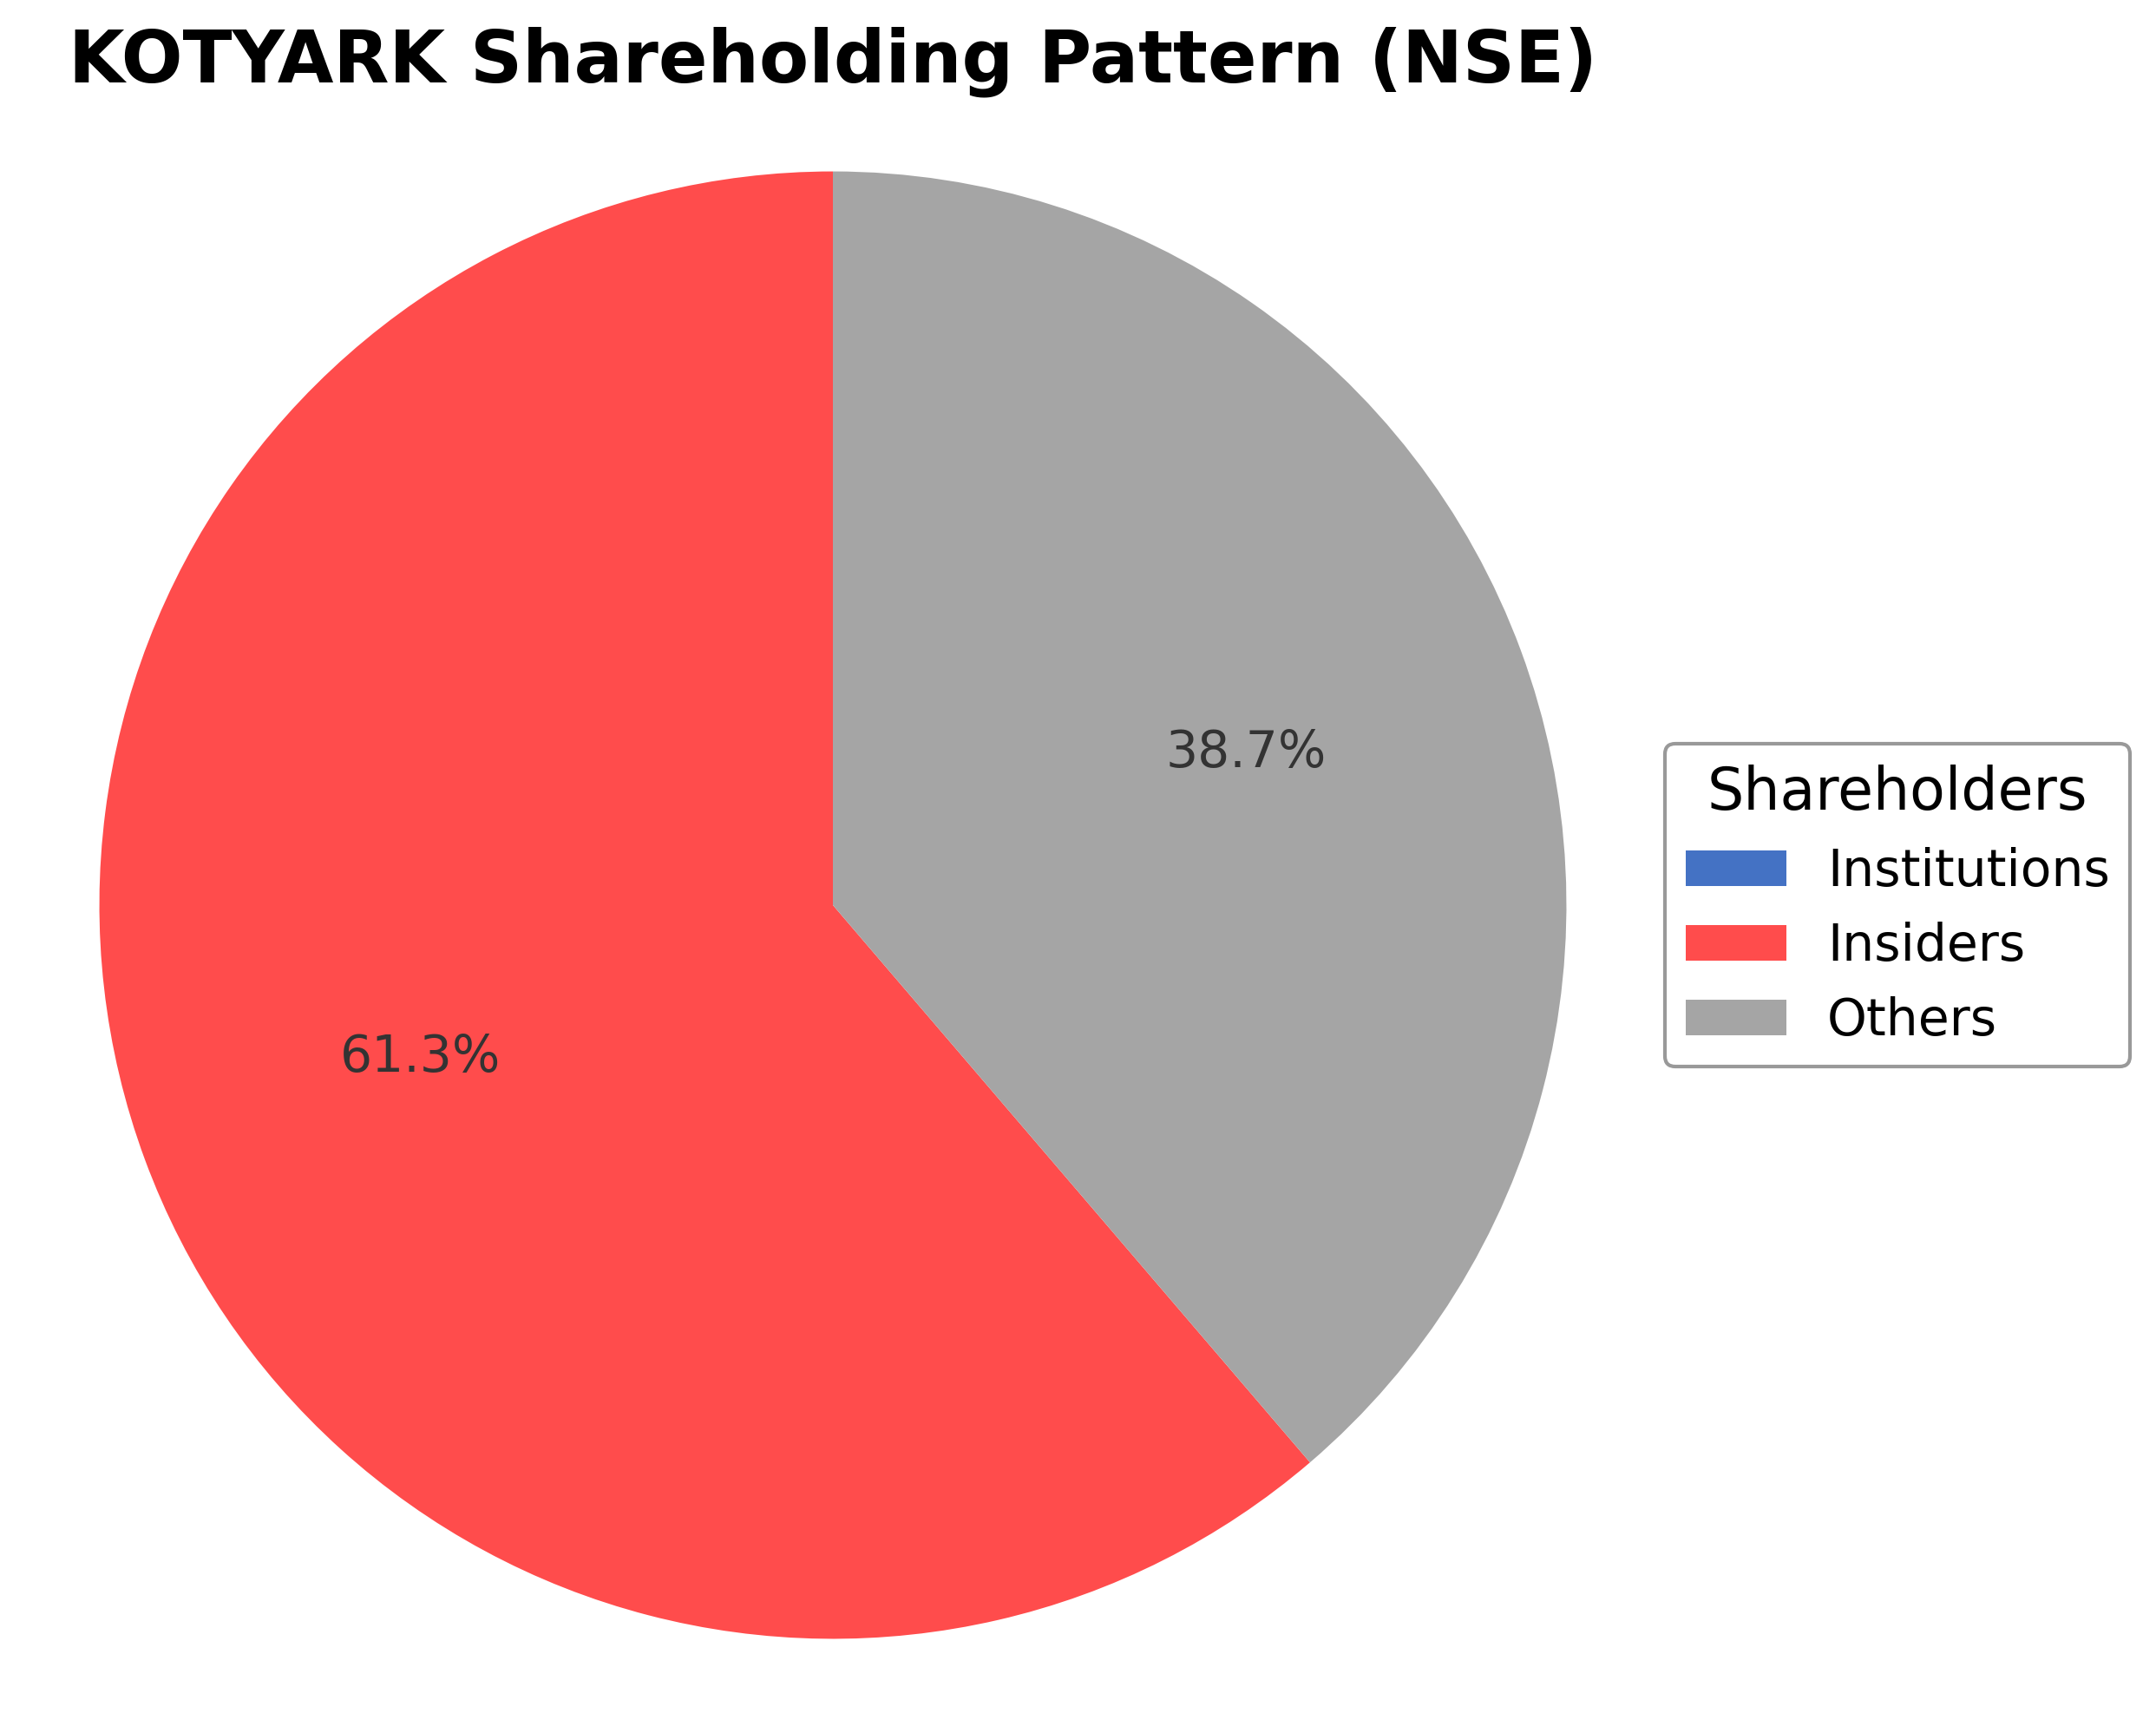
Kotyark Industries Limited’s shareholding is predominantly held by insiders including promoters and executives at 61.27%, with no institutional investor ownership reported and the remaining 38.73% held by public shareholders. Over the past 12-24 months, the promoter group has reduced its stake by 1.74%, indicating some repositioning. Institutional accumulation appears absent, with no major mutual funds or pension funds reported as shareholders, suggesting limited institutional interest or recent distribution. This ownership structure implies a concentrated control by promoters, which may influence governance and strategic decisions. The lack of institutional investors could reflect market sentiment focused on micro-cap risk and growth uncertainty within the specialty chemicals sector in India.
Sector and Industry Analysis
The biofuel sector in India is witnessing steady growth driven by increasing demand for renewable energy and government initiatives promoting cleaner fuels. The market size is expanding as biofuels gain traction as alternatives to fossil fuels, supported by rising environmental concerns and energy security needs. Key players include companies like Kotyark Industries Limited, IRM Energy Ltd, and Rajputana Biodiesel Ltd, which operate manufacturing units and supply biofuels to oil marketing companies and bulk industrial consumers.
Industry trends highlight a shift from pure trading to integrated manufacturing and processing of biofuels, as seen with Kotyark Industries transitioning to production and expanding capacity with glycerin processing plants. Competitive dynamics are influenced by technological advancements, product diversification, and strategic amalgamations to scale operations. Barriers to entry include capital-intensive plant setups, regulatory approvals, and establishing supply chains with oil marketing companies and bulk buyers.
The regulatory landscape is shaped by government policies aimed at increasing the blending of biofuels with conventional fuels, offering incentives and mandates to promote biofuel production and consumption. Compliance with environmental standards and quality certifications is critical for market participation. The outlook remains positive as regulatory support continues to encourage investment and expansion in the biofuel industry, aligning with India’s broader renewable energy goals.
Note: Analysis synthesized from industry research, market reports, and regulatory filings. Information is subject to change based on market conditions.
Financial Ratios Dashboard
Illustrative Scenario Analysis
DCF Assumptions:
Method: Two-Stage EPS-Priority Model
Financials
Peer Analysis
| Company Name | Market Cap | P/E Ratio | P/B Ratio | EV/EBITDA | Price to CFO |
|---|---|---|---|---|---|
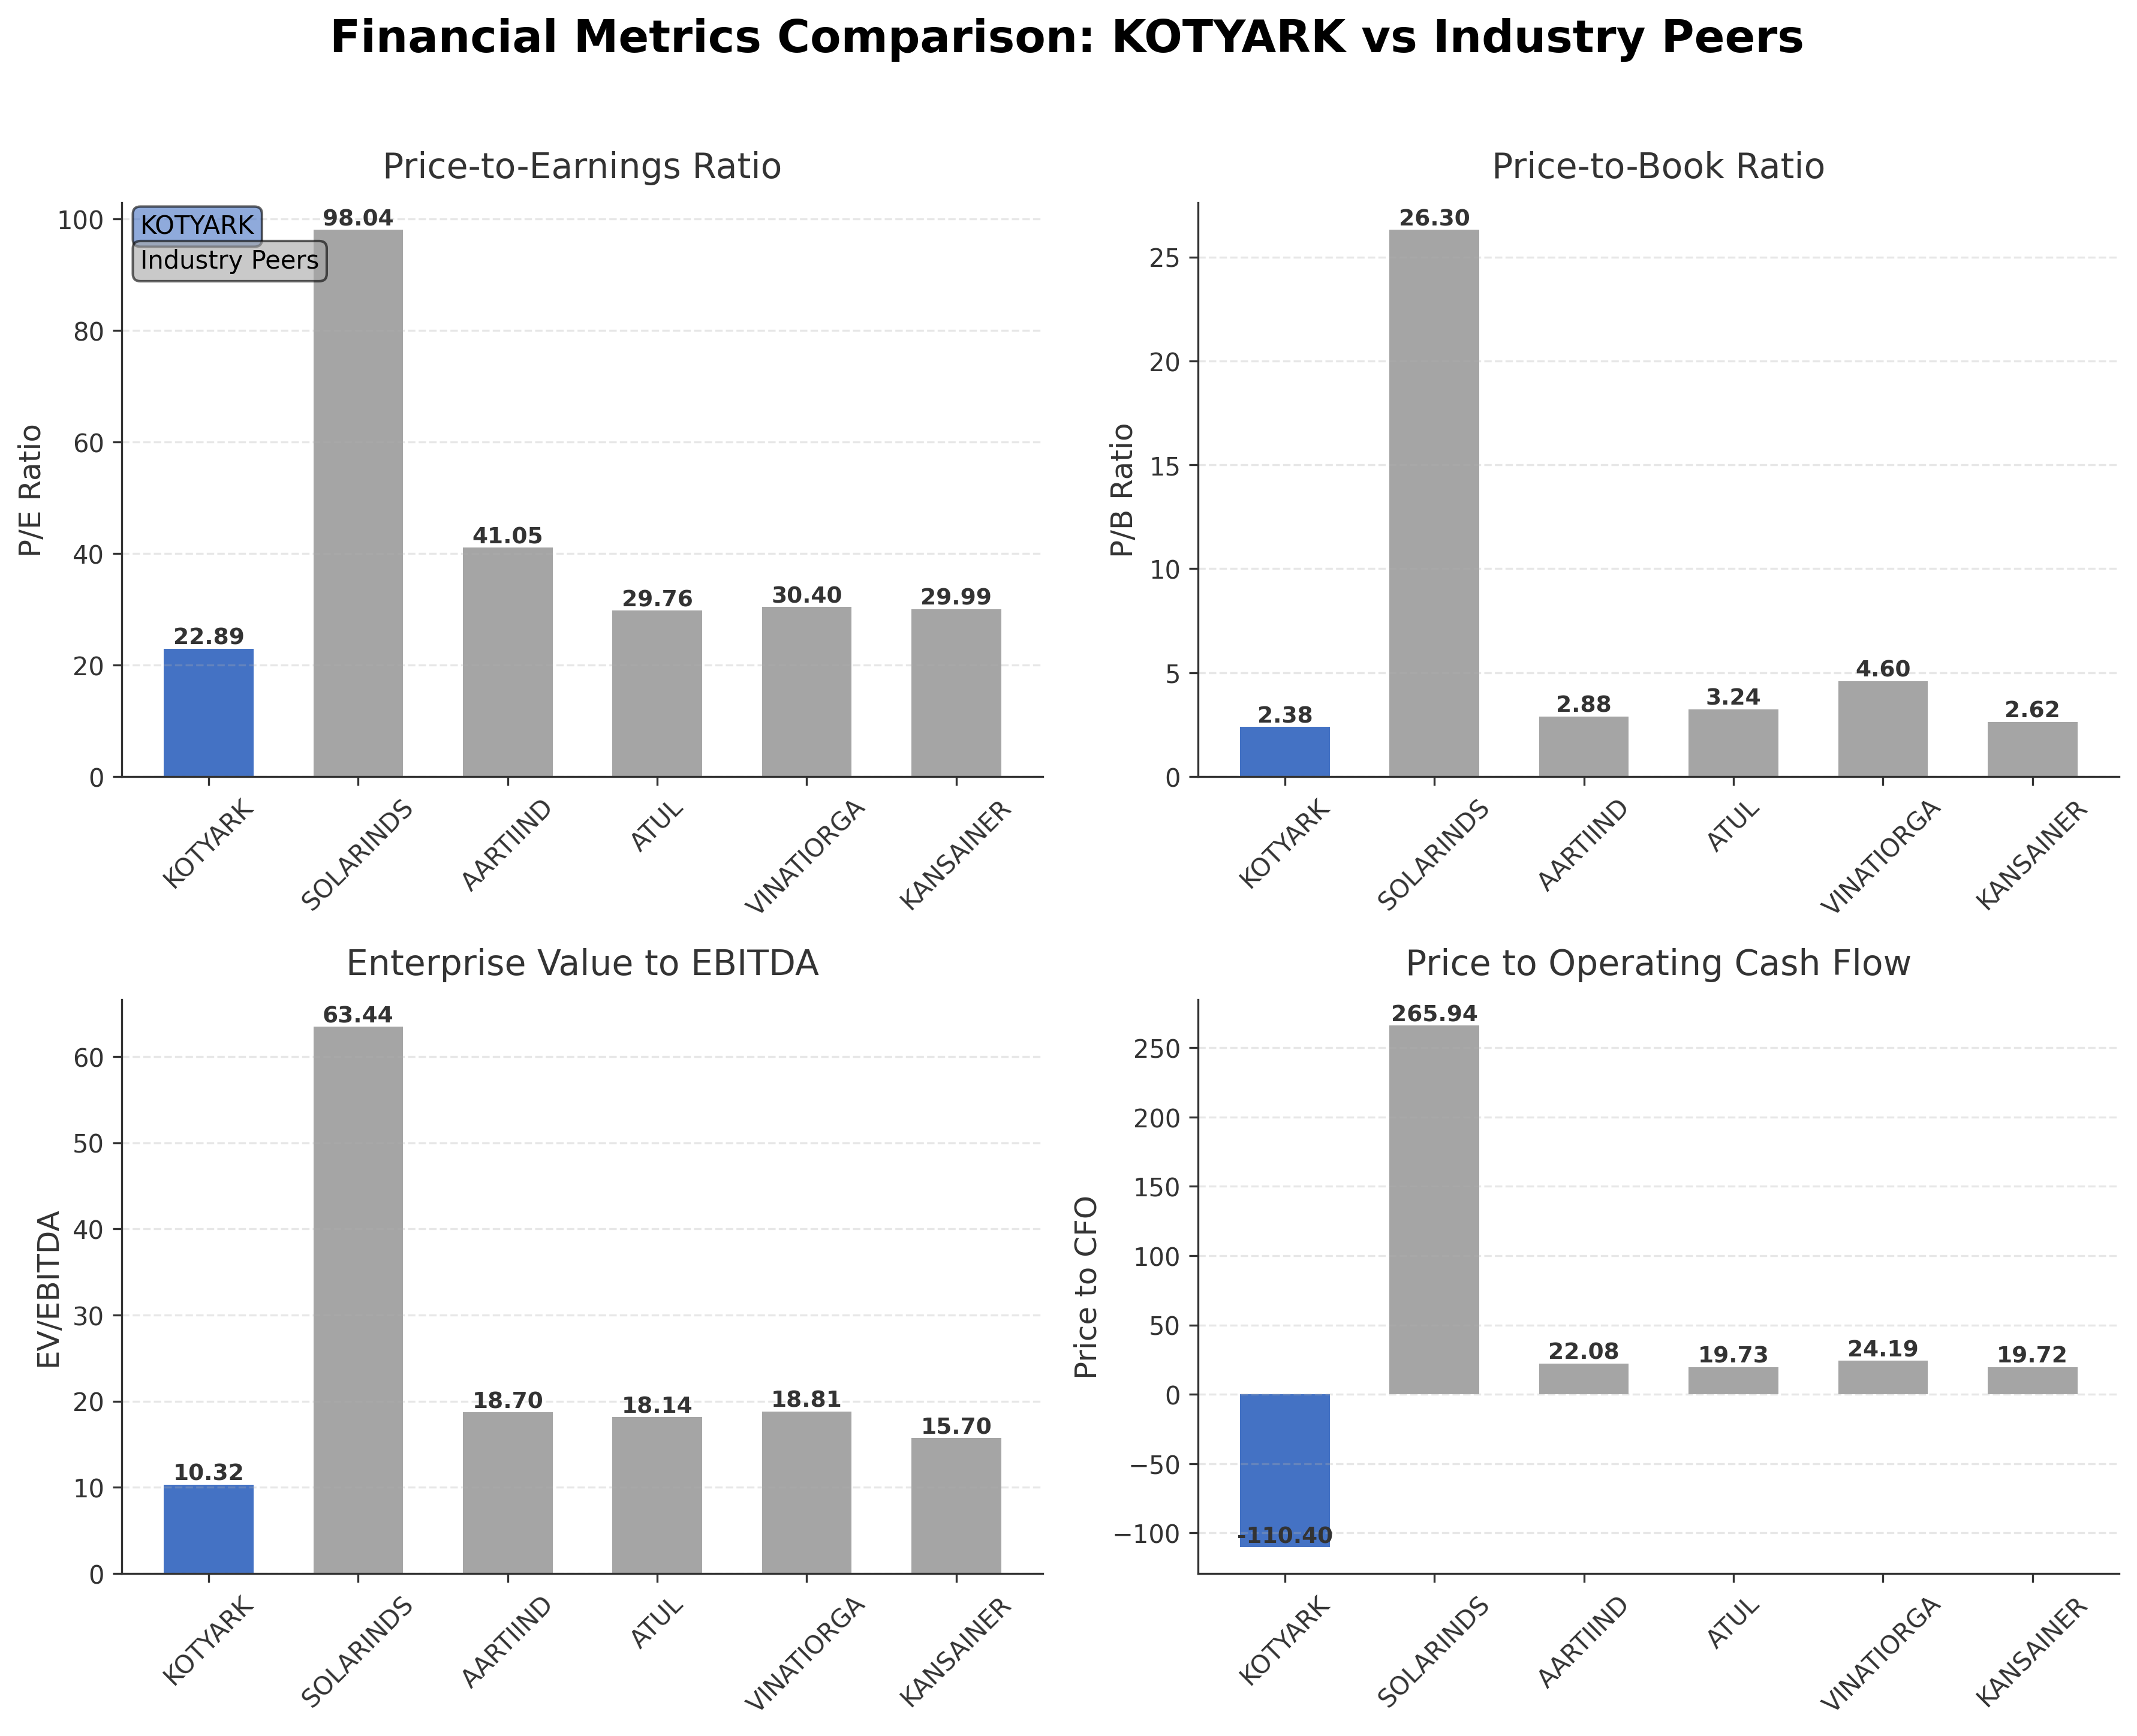
| Kotyark Industries Limited | ₹4.33B | 22.89 | 2.38 | 10.32 | -110.40 |
| Solar Industries India Ltd. | ₹1.65T | 98.04 | 26.30 | 63.44 | 265.94 |
| Aarti Industries Ltd. | ₹172.46B | 41.05 | 2.88 | 18.70 | 22.08 |
| Atul Ltd. | ₹201.84B | 29.76 | 3.24 | 18.14 | 19.73 |
| Vinati Organics Limited | ₹134.98B | 30.40 | 4.60 | 18.81 | 24.19 |
| Kansai Nerolac Paints Limited | ₹176.34B | 29.99 | 2.62 | 15.70 | 19.72 |
Comparison Analysis: Kotyark Industries Limited trades at a significantly lower market capitalization compared to its large-cap Indian specialty chemical peers. Its P/E ratio of 22.89 is substantially below the peer group average, which ranges from approximately 29.76 to 98.04, indicating a more modest valuation relative to earnings. The company’s EV/EBITDA multiple of 10.32 is also lower than peers, suggesting a more attractive valuation on an enterprise basis. However, Kotyark’s negative price to cash flow ratio contrasts with positive values for peers, highlighting cash flow challenges. Return on equity at 11.90% is competitive but below the highest peer returns, reflecting moderate profitability. Overall, Kotyark presents as an undervalued smaller player with growth potential but operational and liquidity considerations.
Financial Metrics Comparison with Peers
Financial Statements
Comprehensive financial data including income, balance sheet, and cash flow metrics
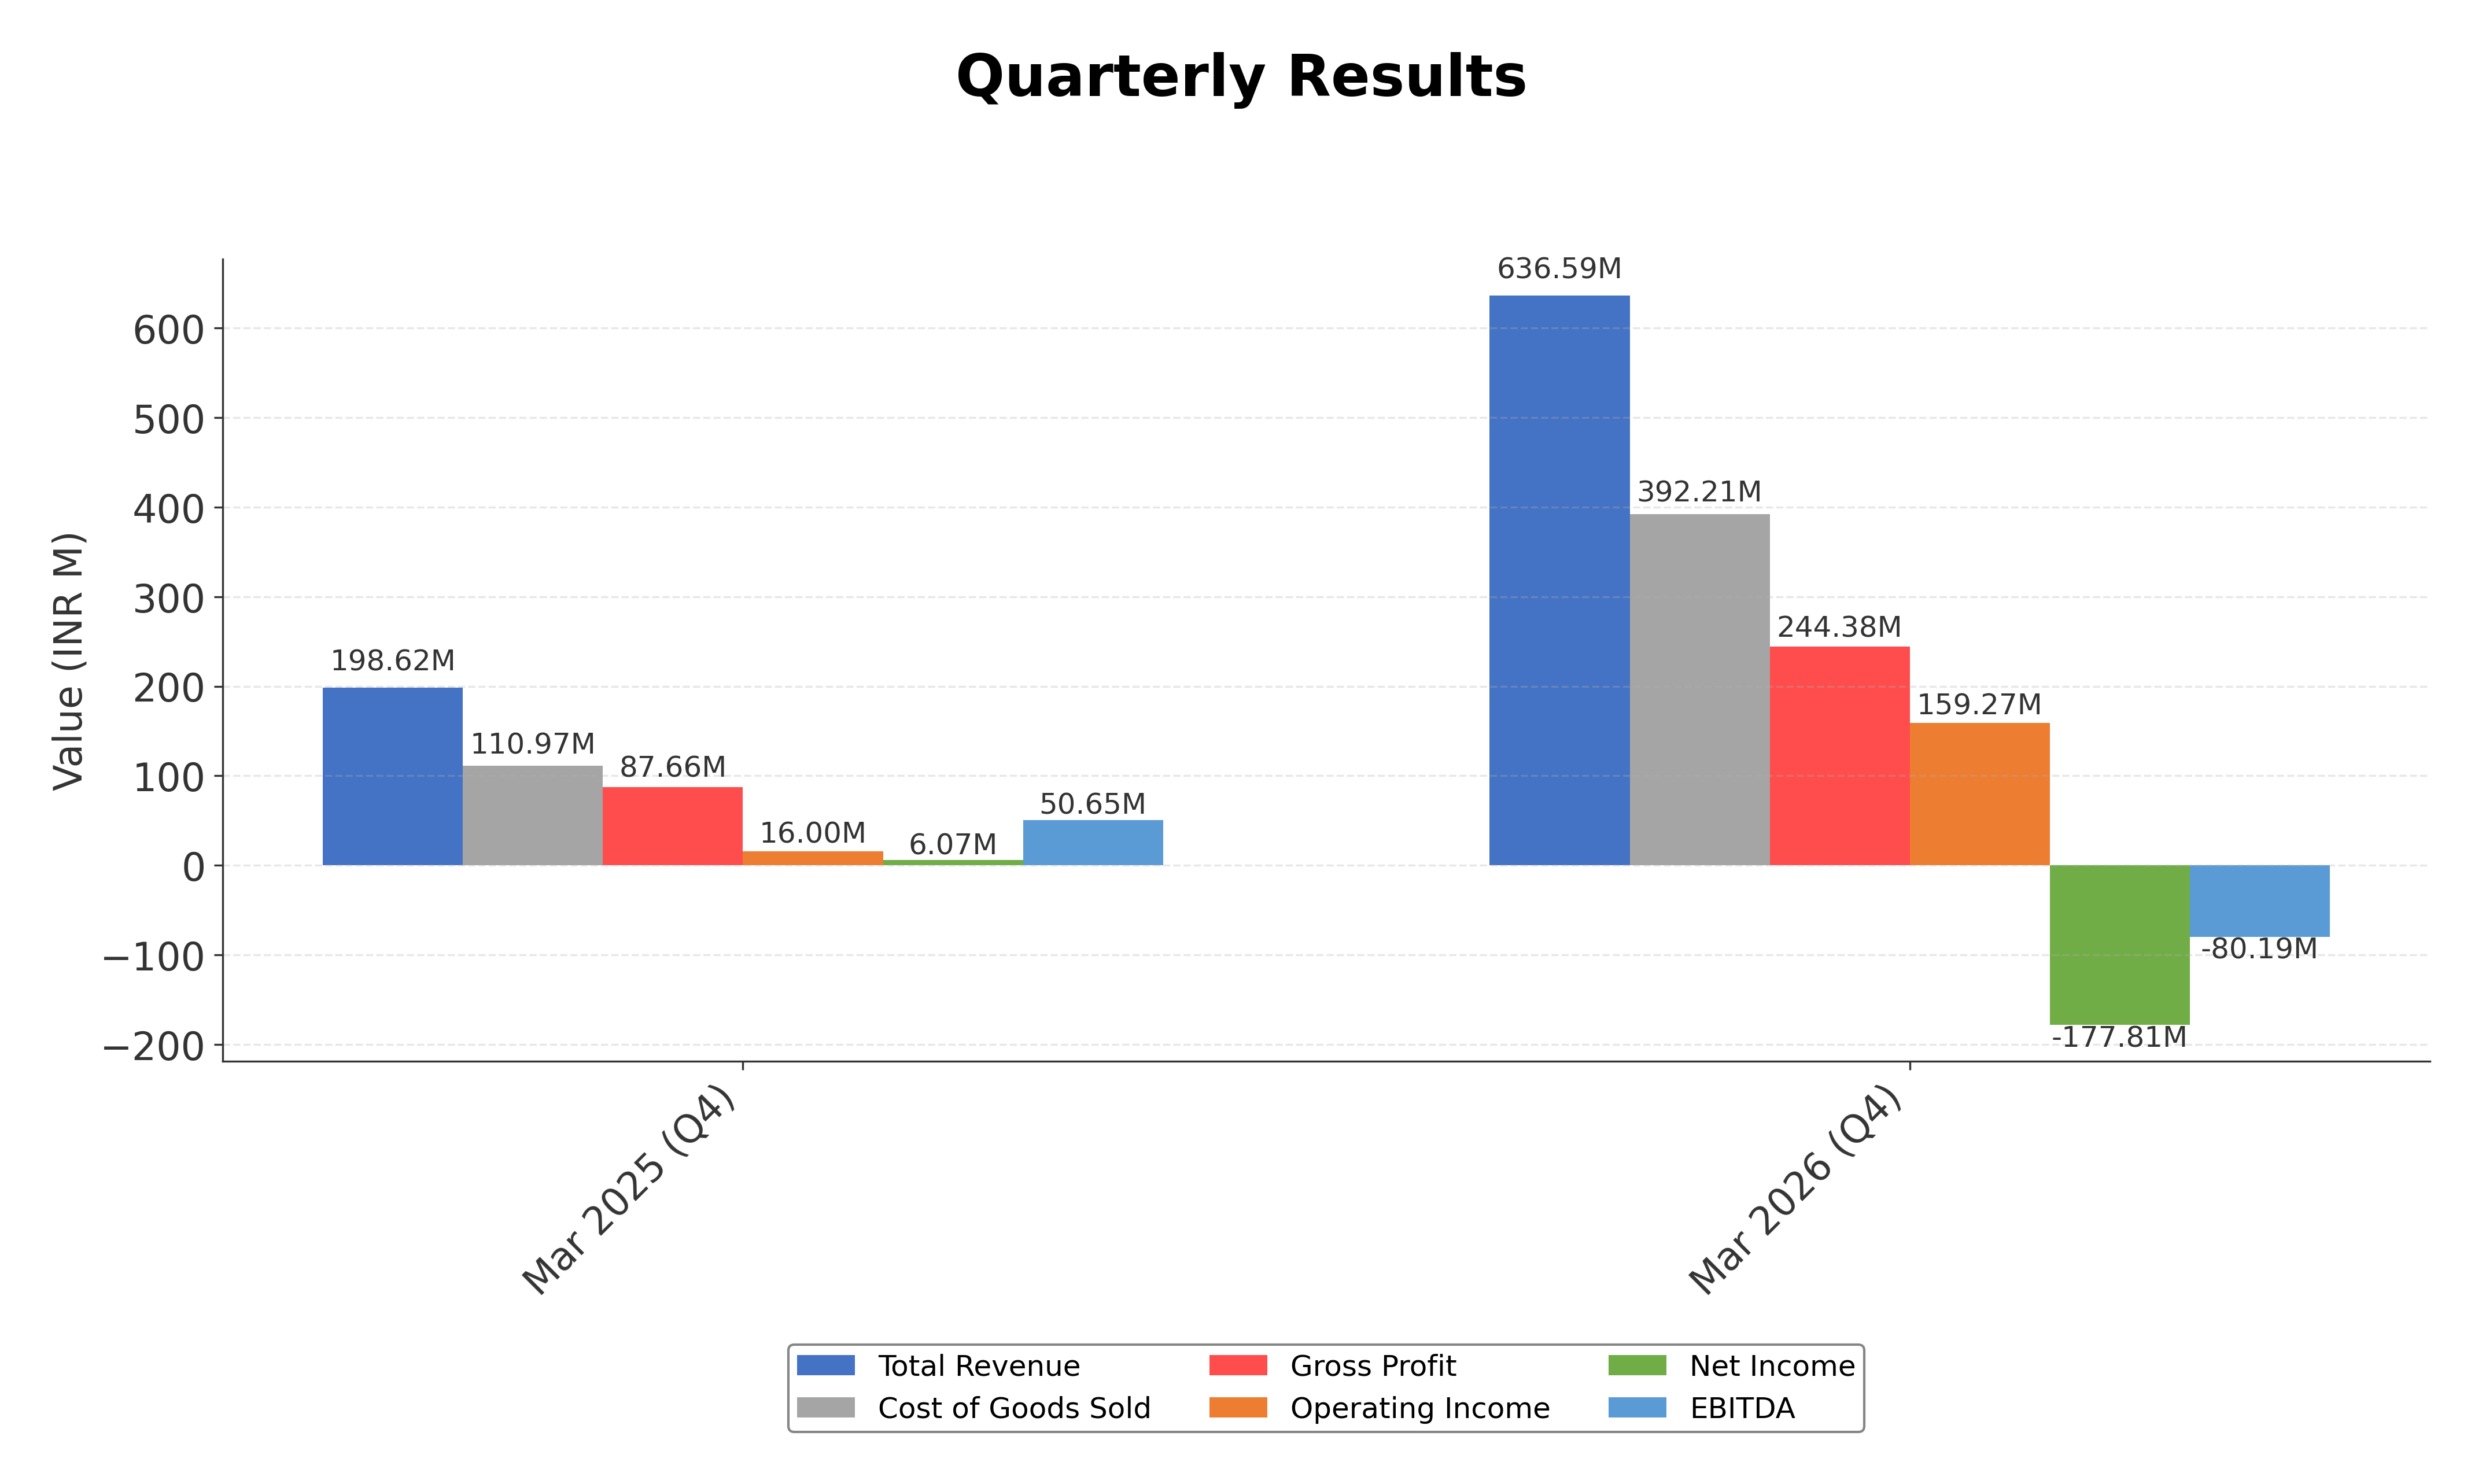
Income Statement
| fiscal_date | 2026-03-31 | 2025-03-31 | 2024-03-31 |
|---|---|---|---|
| Sales | 3.15B | 2.88B | 2.70B |
| Cost Of Goods | 2.48B | 2.30B | 2.12B |
| Gross Profit | 664.47M | 577.37M | 586.34M |
| Operating Expense Other Operating Expenses | 131.39M | 105.48M | 12.82M |
| Operating Income | 351.20M | 273.90M | 369.01M |
| Non Operating Interest Expense | 83.19M | 77.33M | 56.45M |
| Pretax Income | -268.46M | -204.08M | 306.05M |
| Income Tax | 74.83M | 58.74M | 84.06M |
| Net Income | -343.29M | -262.82M | 221.98M |
| Eps Basic | 18.26 | 14.08 | 22.76 |
| Eps Diluted | 18.26 | 14.03 | 22.76 |
| Basic Shares Outstanding | 10.28M | 10.28M | 9.76M |
| Diluted Shares Outstanding | 10.28M | 10.28M | 9.76M |
| Ebit | -185.27M | -126.75M | 362.49M |
| Ebitda | -57.10M | 25.84M | 451.78M |
| Net Income Continuous Operations | 268.46M | 204.08M | 306.05M |
| Minority Interests | -5.93M | -646.00K | 14.00K |
| Preferred Stock Dividends | 0.00 | 0.00 | 0.00 |
| Operating Expense Selling General And Administrative | N/A | 63.36M | 80.04M |
| Non Operating Interest Income | N/A | 100.00K | 235.00K |
Data provided by Twelve Data
Balance Sheet
| fiscal_date | 2026-03-31 | 2025-03-31 | 2024-03-31 |
|---|---|---|---|
| Cash And Cash Equivalents | 13.86M | 3.58M | 50.46M |
| Accounts Receivable | 176.98M | 96.16M | 344.37M |
| Total Assets | 2.61B | 2.35B | 2.22B |
| Total Liabilities | 782.94M | 918.08M | 775.79M |
| Long Term Debt | 207.76M | 292.70M | 305.31M |
| Shareholders Equity | 1.82B | 1.43B | 1.44B |
Data provided by Twelve Data
Cash Flow Statement
| fiscal_date | 2026-03-31 | 2025-03-31 | 2024-03-31 |
|---|---|---|---|
| Operating Activities Net Income | 268.46M | 204.08M | 306.05M |
| Operating Activities Other Non Cash Items | 80.93M | 75.17M | 54.26M |
| Operating Activities Accounts Receivable | -123.06M | 239.44M | -54.27M |
| Operating Activities Other Assets Liabilities | -218.93M | -419.20M | -472.09M |
| Operating Activities Operating Cash Flow | 7.40M | 99.49M | -166.05M |
| Investing Activities Capital Expenditures | -25.99M | -134.41M | -535.30M |
| Investing Activities Investing Cash Flow | -25.99M | -124.91M | -534.60M |
| Financing Activities Long Term Debt Issuance | 150.66M | 126.00M | 341.47M |
| Financing Activities Common Dividends | -3.31M | -154.19M | -43.67M |
| Financing Activities Other Financing Charges | 9.00M | N/A | 225.00K |
| Financing Activities Financing Cash Flow | 156.35M | -146.43M | 792.79M |
| End Cash Position | 13.86M | 3.65M | 50.46M |
| Free Cash Flow | -67.13M | 165.29M | -690.88M |
| Investing Activities Other Investing Activity | N/A | 9.50M | 700.00K |
| Financing Activities Long Term Debt Payments | N/A | -118.25M | N/A |
| Financing Activities Common Stock Issuance | N/A | 0.00 | 494.77M |
| Investing Activities Purchase Of Investments | N/A | N/A | 0.00 |
Data provided by Twelve Data
Technical Analysis
Key Insights
- Kotyark Industries is currently in an uptrend, trading above its 50-day moving average of ₹401.92 and 200-day moving average of ₹302.03, indicating medium to long-term bullish momentum.
- Key support levels are identified near ₹400 and ₹300, while resistance is observed near the 52-week high of ₹464.25.
- The stock price is above the 10-day, 50-day, and 200-day moving averages, suggesting sustained upward price momentum across short and long-term periods.
- Momentum indicators show a Relative Strength Index (RSI) near neutral levels, a slightly positive MACD histogram, and a stochastic oscillator indicating moderate buying pressure.
- Analysis across daily, weekly, and monthly timeframes confirms a consistent upward trend with occasional consolidation phases.
- Potential market scenarios include continuation of the current uptrend if support levels hold, or a pullback to the 50-day moving average if momentum weakens.
Trending News
1. Headline: Kotak Securities, HSBC & more: Top stocks to watch on June 01 - The Times of India
Summary: India Business News: UBS has downgraded MCX to neutral but raised the target price to Rs 3,600 from Rs 3,200 earlier. Analysts said that bourse’s peak earnings momentum is.
Sentiment: positive
2. Headline: Kotyark Industries FY26 PAT rises 33.2% to ₹19.36 crore
Summary: The company submitted its investor ... National Stock Exchange of India Limited and BSE Limited on May 27, 2026, pursuant to Regulation 30 of the SEBI (Listing Obligations and Disclosure Requirements) Regulations, 2015. The filing highlighted the company's integrated manufacturing facilities in Sirohi, Rajasthan, and Anand, Gujarat, which support a flexible multi-feedstock platform capable of processing 10–15 raw materials. Kotyark Industries’ total income ...
Sentiment: positive
3. Headline: Kotyark Industries Shares Investor Presentation and Performance Update - TipRanks.com
Summary: Discover high-conviction stock picks and new investing opportunities with the TipRanks Smart Investor Newsletter · Kotyark Industries Ltd.
Sentiment: neutral
4. Headline: Hindalco Industries Limited Stock 12‑Month Price Target Raised to INR 1117.96, Implies 1% Upside — TradingView News
Summary: Explore more price target data and ratings for Hindalco Industries Limited on the Forecasts tab, and track all previous and future analyst recommendations for Hindalco Industries Limited in the dedicated News Flow.Select reference data provided by FactSet. Copyright © 2026 FactSet Research ...
Sentiment: positive
5. Headline: 10:1 Bonus Shares: Stock Jumps 7% After Company Announces Bonus Issue
Summary: Along with it, Kotyark Industries Limited has approved an increase in its authorised share capital from ₹23 crore to ₹200 crore, subject to shareholder approval.
Sentiment: positive
Powered by Brave
Recent Updates
News Summary
As of May 27, 2026. Kotyark Industries Limited reported a 33.2% increase in profit after tax to ₹19.36 crore for FY26, supported by a 9.3% rise in revenue to ₹314.87 crore and an EBITDA margin improvement to 15.23%. The company’s EPS rose to ₹18.26 from ₹14.08 in the prior year. Additionally, the board approved a 10:1 bonus share issue and an increase in authorized share capital from ₹23 crore to ₹200 crore, subject to shareholder approval via postal ballot. These corporate actions aim to enhance liquidity and capital structure. Meanwhile, the promoter group reduced its stake by 1.74% through open market sales in early May, attracting investor scrutiny. The company also responded to NSE queries regarding its Q4FY26 financial results presentation format.
News Sentiment
The overall sentiment from recent updates is mixed to positive. The strong earnings growth and margin expansion provide a positive financial backdrop, reinforced by strategic capital actions such as the bonus issue and authorized capital increase. However, promoter stake reduction has introduced a neutral to cautious tone among investors, reflecting concerns about insider confidence. Regulatory compliance and transparent communication with exchanges support governance standards. The balance of positive operational performance and shareholder actions suggests a stable outlook with some watchfulness on ownership changes.
Source List
- https://scanx.trade/stock-market-news/companies/kotyark-industries-reports-fy26-pat-of-19-36-crore-revenue-rises-9-3/41543341
- https://scanx.trade/stock-market-news/companies/kotyark-industries-board-meeting-scheduled-on-may-14-2026-to-consider-authorised-share-capital-increase-and-bonus-share-issue/39807076
- https://whalesbook.com/corporate-news/English/chemicals/Kotyark-Promoter-Group-Sells-174percent-Stake-Investor-Scrutiny-Follows/69fd68f80fc858706ca93ffd
Analytical Overview
Analysis Summary
Kotyark Industries’ trailing P/E ratio of 22.89 is below the specialty chemicals industry average, indicating a relatively attractive valuation compared to peers trading at higher multiples. The absence of a forward P/E limits forward-looking valuation insights. Revenue growth of 39.4% quarterly and a 9.3% annual increase demonstrate a positive growth trajectory, although operating and free cash flow remain negative, suggesting operational cash challenges. The company maintains a healthy current ratio of 3.22 and a moderate debt-to-equity ratio of 35.58%, reflecting manageable financial leverage. Sector-specific opportunities include increasing demand for renewable biofuels in India, supported by government policies promoting sustainability, while challenges include feedstock price volatility and regulatory compliance. Given its Indian market context, Kotyark benefits from growing biofuel mandates but faces competition from larger players and raw material supply constraints.
Overall Business and Market Assessment
Supporting Factors: Key supporting factors include strong revenue growth, improving profitability margins, and strategic capital actions such as the bonus share issue enhancing shareholder value. Risks to monitor are negative cash flows, promoter stake reduction, and potential volatility in feedstock costs impacting margins. The company’s financial health and growth prospects suggest a medium to long-term investment horizon may be appropriate, with attention to operational cash flow improvements and ownership stability. Overall, Kotyark presents a balanced risk-reward profile within the specialty chemicals sector in India.
Risk Factors: No data
SWOT Analysis
Strengths
- Kotyark Industries has a diversified feedstock platform enabling flexibility in biodiesel production.
- The company maintains a strong current ratio of 3.22, indicating good short-term liquidity.
- Improved EBITDA margin to 15.23% reflects operational efficiency gains.
- Presence in the growing renewable biofuel sector aligns with sustainability trends.
Weaknesses
- Negative operating and free cash flow suggest challenges in cash generation.
- Promoter stake reduction by 1.74% may raise governance and confidence concerns.
- Relatively small market capitalization limits scale advantages compared to peers.
- Absence of institutional investors may restrict access to large-scale funding.
Opportunities
- Government policies promoting biofuels create growth potential for biodiesel producers.
- Expansion of authorized share capital may facilitate future fundraising or acquisitions.
- Increasing demand for green energy supports long-term market growth.
- Potential to secure long-term offtake agreements with oil marketing companies.
Threats
- Volatility in raw material prices could impact production costs and margins.
- Competitive pressures from larger specialty chemical and biofuel companies.
- Regulatory changes or delays may affect operational continuity.
- Market perception risks related to promoter share sales and ownership changes.
Company Description
Kotyark Industries Limited is an India-based company specializing in the manufacture and sale of biodiesel and its by-products. Its core product is biodiesel, a renewable biofuel produced from non-edible vegetable oils, alcohol, and catalysts through an indigenously designed transesterification process that yields up to 99% output. The company also processes crude glycerin, a key by-product generated at approximately 14 liters per 100 liters of biodiesel, further refining it for applications in food, pharmaceutical, and cosmetic industries. Kotyark Industries Limited operates two production facilities in Sirohi, Rajasthan, and Anand, Gujarat, serving diverse clients including oil marketing companies for diesel blending, bulk buyers such as transport contractors and mining firms, and retail customers via mobile outlets under the Green N Green brand. Committed to sustainable green energy, it emphasizes zero effluent discharge and environmentally friendly technology to support renewable fuel needs in transportation and industrial sectors. Founded in 2016 and headquartered in Vadodara, Gujarat, the company plays a vital role in India's biofuel ecosystem.