
Kothari Petrochemicals Ltd (KOTHARIPET)
Stock Analysis Report
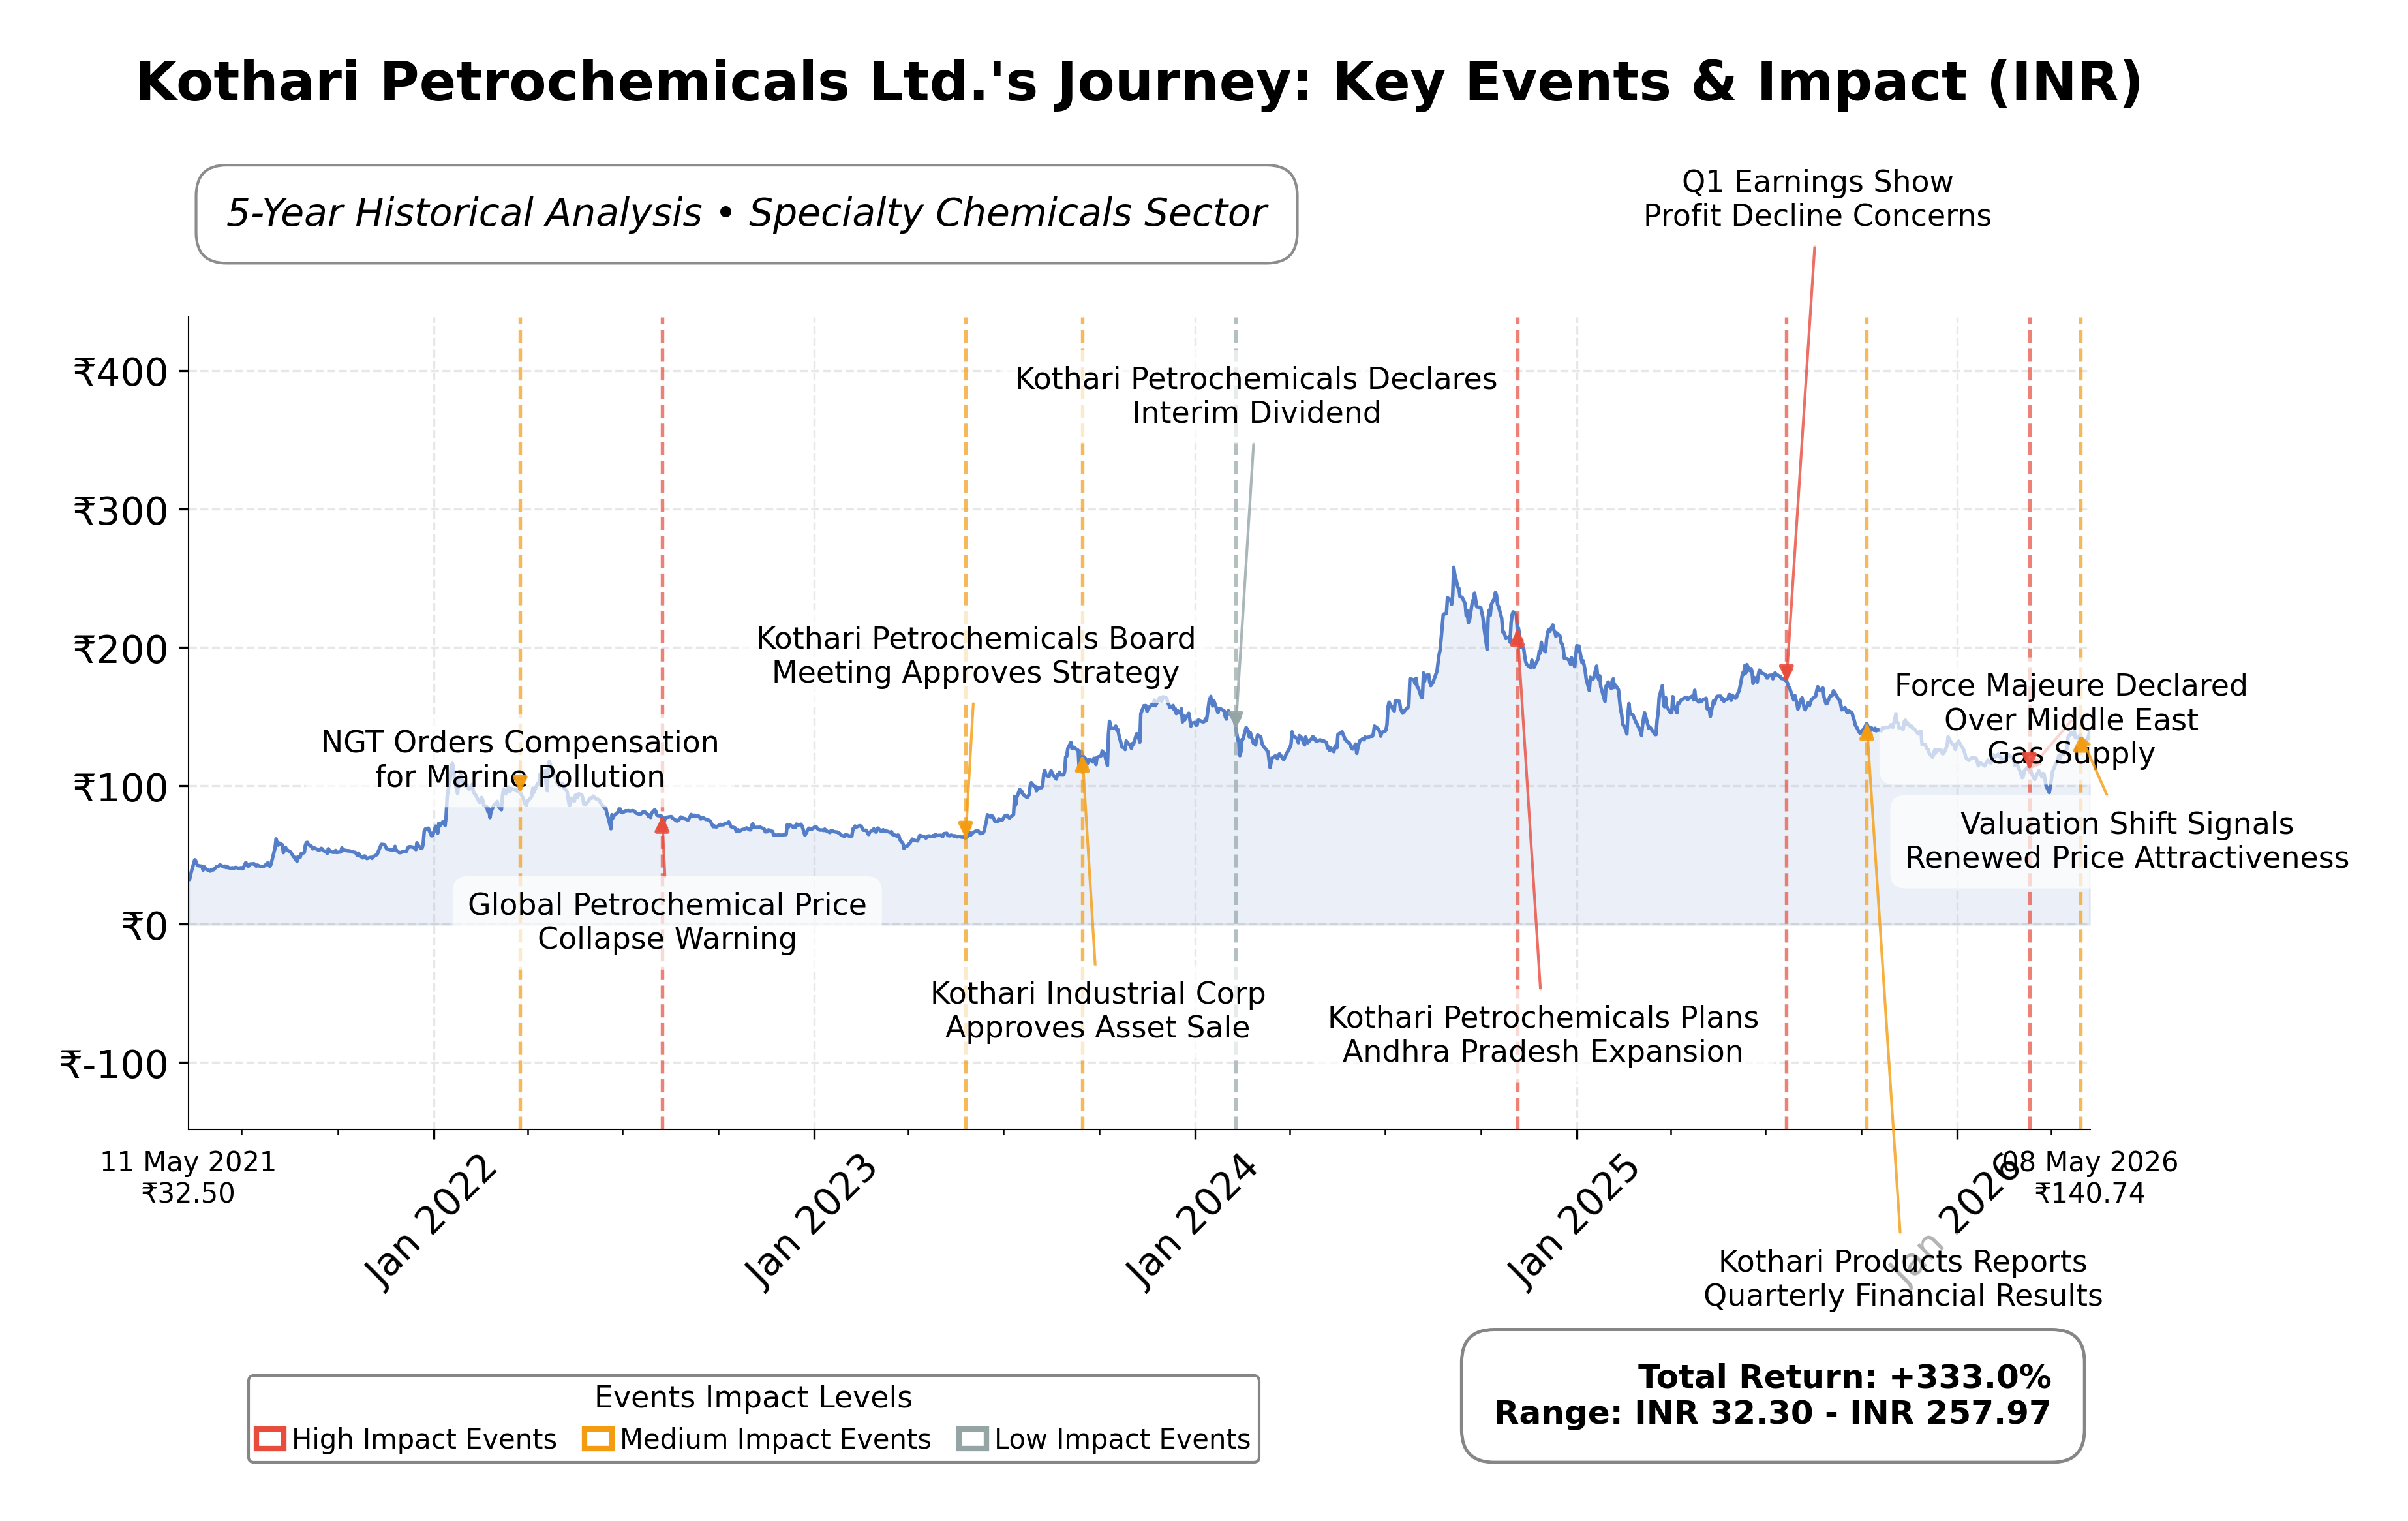
Stock Journey
Key Positives and Key Risks
Pros
- Kothari Petrochemicals reports a strong return on equity of 21.4%, indicating efficient use of shareholder capital.
- The company maintains low debt levels with a debt-to-equity ratio of 0.60, supporting financial stability and flexibility.
- The stock trades at a reasonable trailing P/E of 11.5 and EV/EBITDA of 7.43, suggesting attractive valuation relative to peers.
Cons
- Revenue growth is modest at 1.6% quarterly, reflecting steady but limited expansion momentum.
- The stock price has declined approximately 10.2% from its 52-week high, indicating recent market pressure.
- Limited disclosure on shareholding patterns restricts transparency on ownership and potential governance implications.
Disclosure: This information is for general awareness and does not constitute investment advice
Report Summary
Kothari Petrochemicals Ltd. operates primarily in the specialty chemicals sector, listed on the National Stock Exchange of India (NSE). The company specializes in manufacturing and distributing petrochemical products, notably various grades of polyisobutylene (PIB), which are essential inputs for industries such as pharmaceuticals, cosmetics, lubricants, and rubber manufacturing. With a strategic presence in India and exports to 20 countries, Kothari Petrochemicals holds a significant market position within the basic materials sector, serving critical industrial supply chains.
Financially, the company reported trailing twelve months (TTM) revenue of approximately INR 6.0 billion, with a gross margin of 35.7%, operating margin of 15.6%, and net profit margin of 12.1%. Return on equity (ROE) stands at 21.4%, and return on assets (ROA) at 14.9%, indicating efficient capital utilization and solid profitability. The company’s EBITDA margin and operating cash flow of INR 805 million further underscore operational strength and cash generation capabilities.
Valuation metrics show a trailing price-to-earnings (P/E) ratio of 11.5, price-to-book (P/B) ratio of 2.47, and an enterprise value to EBITDA (EV/EBITDA) multiple of 7.43. The market capitalization is approximately INR 8.28 billion. The stock price currently trades at INR 146.26, within a 52-week range of INR 94.75 to INR 191.95, reflecting a recent downside of about 10.2% from the high, suggesting a valuation discount relative to its peak.
Key strengths include strong cash flow generation with operating cash flow of INR 805 million and low debt levels, with total debt at INR 22.4 million and a healthy current ratio of 2.48. The company has demonstrated consistent revenue growth of 1.6% quarterly and a PEG ratio of 0.25, indicating undervaluation relative to growth. Risks include sector cyclicality, regulatory changes in chemical manufacturing, and competitive pressures from larger industry players. Recent strategic focus on sustainability and innovation supports its market positioning.
Technically, the stock is trading above its 50-day moving average but below the 200-day average, with momentum indicators showing mixed signals across timeframes. Recent news highlights dividend announcements and analyst upgrades, reflecting renewed market interest. Overall, the data suggests a cautious stance with potential for accumulation under favorable conditions, balanced by the need to monitor sector dynamics and valuation shifts.
Company and Industry Overview
Company Basics
Price Performance
Company Size
Shareholding Pattern
Sector and Industry Analysis
The petrochemicals sector in India is a significant contributor to the country's industrial output, with a market size driven by demand in automotive, packaging, construction, and consumer goods. It has experienced steady growth, supported by rising domestic consumption and export opportunities, with a compound annual growth rate (CAGR) in the double digits over recent years. Key players include large integrated firms and specialized producers like Kothari Petrochemicals Ltd, which focuses on polyisobutylene (PIB), a niche product used in lubricants, plastics, and rubber industries.
Industry trends reveal increasing specialization and product differentiation, with companies emphasizing low molecular weight PIB grades to cater to diverse industrial applications. Competitive dynamics are shaped by technological capabilities, cost efficiencies, and global supply chain linkages, creating moderate barriers to entry due to capital intensity and technical expertise requirements. Firms with established export networks and innovation in product quality maintain competitive advantages in this fragmented yet growing market.
The regulatory environment for petrochemicals in India involves environmental norms, import-export policies, and safety standards that influence operational costs and market access. Recent regulations focus on reducing carbon emissions and promoting sustainable manufacturing practices, impacting production processes and raw material sourcing. Continued government support through infrastructure development and export incentives is expected to bolster sector growth, although compliance costs and evolving standards remain key considerations for industry participants.
Note: Analysis synthesized from industry research, market reports, and regulatory filings. Information is subject to change based on market conditions.
Financial Ratios Dashboard
Illustrative Scenario Analysis
DCF Assumptions:
Method: Two-Stage EPS-Priority Model
Financials
Peer Analysis
| Company Name | Market Cap | P/E Ratio | P/B Ratio | EV/EBITDA | Price to CFO |
|---|---|---|---|---|---|
| Kothari Petrochemicals Ltd. | ₹8.28B | 11.52 | 2.47 | 7.43 | 10.29 |
| Vinati Organics Ltd. | ₹144.73B | 32.70 | 4.93 | 21.64 | 34.84 |
| Aarti Industries Ltd. | ₹176.25B | 42.18 | 3.10 | 19.97 | -65.76 |
| Balaji Amines Ltd. | ₹48.19B | 33.48 | 2.56 | 21.59 | 18.20 |
| Kansai Nerolac Paints Ltd. | ₹178.19B | 30.27 | 2.75 | 16.78 | 21.31 |
| Asian Paints Ltd. | ₹2.49T | 65.03 | 12.72 | 41.20 | 52.62 |
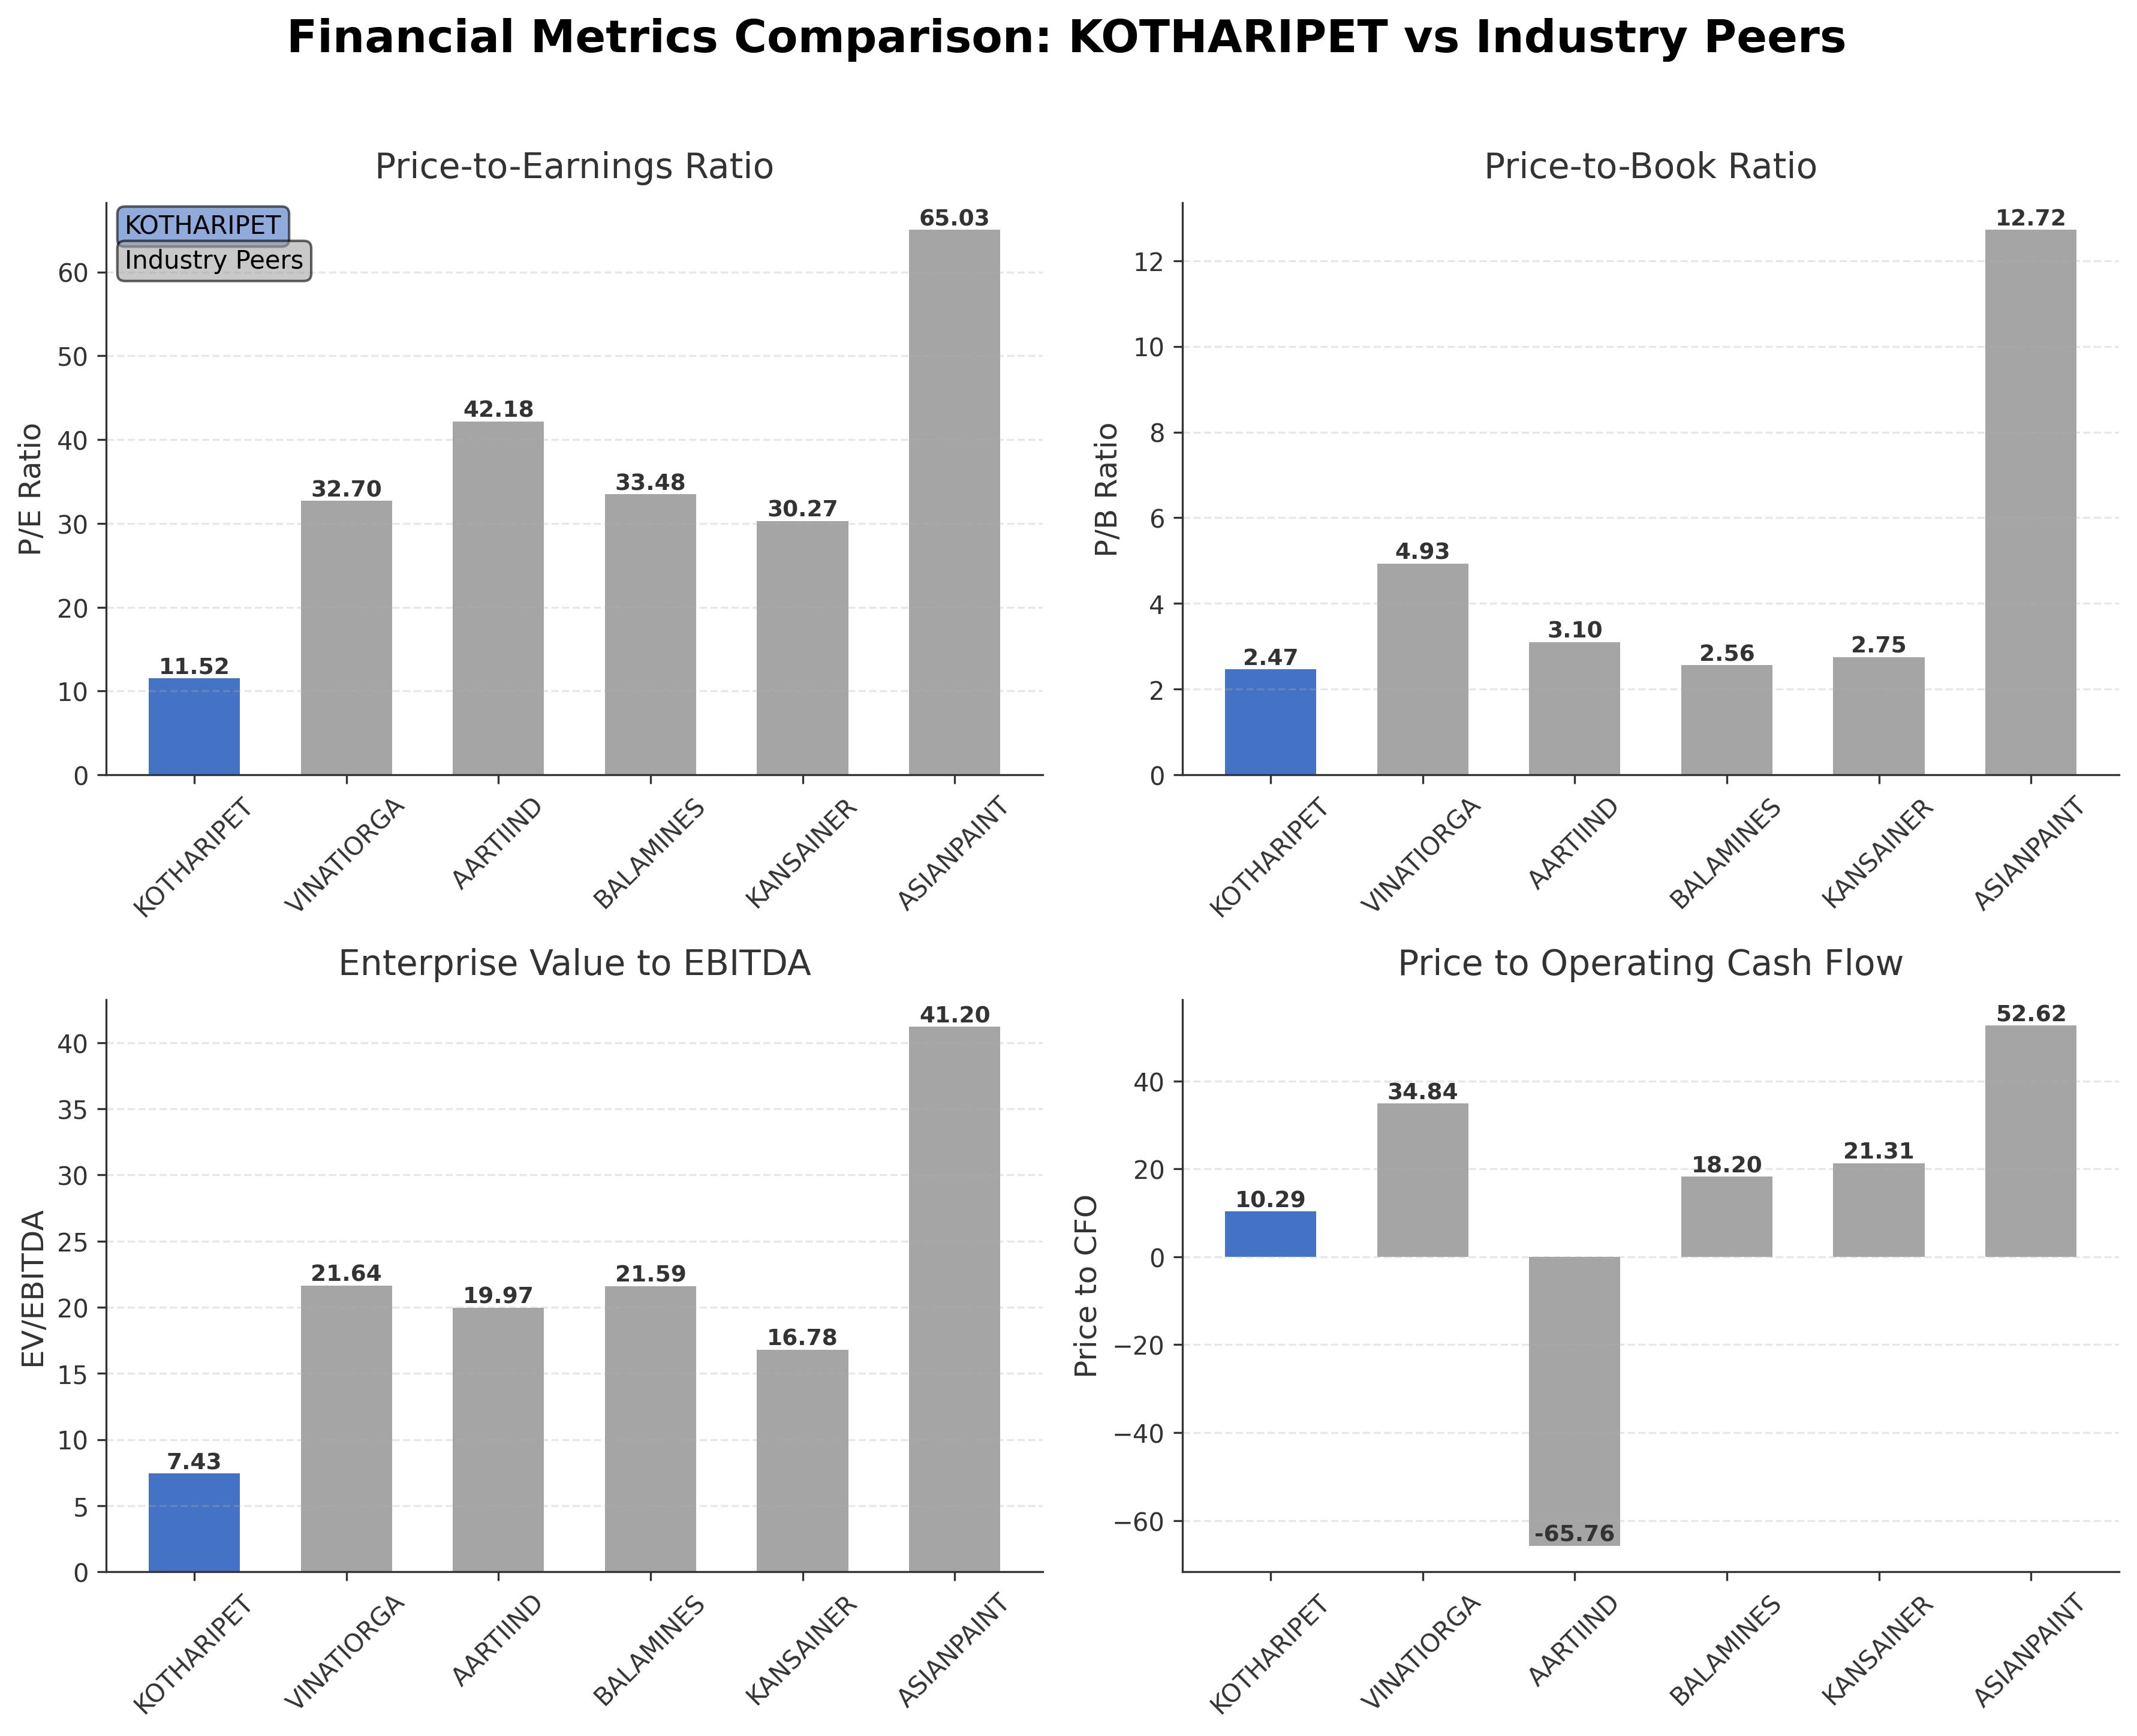
Comparison Analysis: Kothari Petrochemicals Ltd. trades at significantly lower valuation multiples compared to its larger specialty chemical peers, with a trailing P/E of 11.52 versus peer averages exceeding 30. Its P/B ratio of 2.47 is moderate relative to peers, and its EV/EBITDA of 7.43 is substantially below the peer group median, indicating a more attractive valuation. The company also demonstrates a higher return on equity (21.37%) than most peers, reflecting efficient capital use. However, its market capitalization is considerably smaller, reflecting its niche market position. Overall, Kothari Petrochemicals presents a value-oriented profile relative to its regional industry competitors.
Financial Metrics Comparison with Peers
Financial Statements
Comprehensive financial data including income, balance sheet, and cash flow metrics
Income Statement
| fiscal_date | 2025-03-31 | 2024-03-31 | 2023-03-31 | 2022-03-31 | 2021-03-31 |
|---|---|---|---|---|---|
| Sales | 5.74B | 5.99B | 4.79B | 3.80B | 2.26B |
| Cost Of Goods | 4.14B | 4.25B | 3.53B | 2.74B | 1.47B |
| Gross Profit | 1.59B | 1.75B | 1.26B | 1.06B | 783.60M |
| Operating Expense Research And Development | 11.55M | 14.27M | 16.55M | 8.44M | 7.12M |
| Operating Expense Selling General And Administrative | 141.90M | 178.69M | 121.85M | 78.99M | 76.74M |
| Operating Expense Other Operating Expenses | 380.07M | 346.05M | 373.02M | 299.57M | 195.52M |
| Operating Income | 718.23M | 884.56M | 504.90M | 449.41M | 284.87M |
| Non Operating Interest Income | 19.78M | 11.22M | 8.82M | 2.12M | 1.90M |
| Non Operating Interest Expense | 5.77M | 5.58M | 21.30M | 3.08M | 5.55M |
| Pretax Income | 822.08M | 950.84M | 552.09M | 460.70M | 314.76M |
| Income Tax | 163.90M | 313.00M | 160.32M | 131.85M | 89.33M |
| Net Income | 658.18M | 637.84M | 391.77M | 328.85M | 225.44M |
| Eps Basic | 11.18 | 10.84 | 6.66 | 5.59 | 3.83 |
| Eps Diluted | 11.18 | 10.84 | 6.66 | 5.59 | 3.83 |
| Basic Shares Outstanding | 58.85M | 58.85M | 58.85M | 58.85M | 58.85M |
| Diluted Shares Outstanding | 58.85M | 58.85M | 58.85M | 58.85M | 58.85M |
| Ebit | 827.85M | 956.42M | 573.39M | 463.78M | 320.31M |
| Ebitda | 855.25M | 1.00B | 614.71M | 534.65M | 371.64M |
| Net Income Continuous Operations | 822.08M | 950.84M | 552.09M | 460.70M | 314.76M |
| Preferred Stock Dividends | 0.00 | 0.00 | 0.00 | 0.00 | 0.00 |
Source: Financial statements and regulatory filings
Balance Sheet
| fiscal_date | 2025-03-31 | 2024-03-31 | 2023-03-31 | 2022-03-31 | 2021-03-31 |
|---|---|---|---|---|---|
| Cash And Cash Equivalents | 137.15M | 58.55M | 117.66M | 68.69M | 127.77M |
| Accounts Receivable | 520.13M | 586.68M | 469.57M | 289.82M | 188.09M |
| Total Assets | 3.78B | 3.19B | 2.70B | 2.23B | 1.71B |
| Total Liabilities | 723.44M | 724.21M | 782.71M | 671.95M | 475.47M |
| Long Term Debt | 22.38M | 0.00 | 154.78M | 86.78M | 22.62M |
| Shareholders Equity | 3.06B | 2.47B | 1.92B | 1.56B | 1.23B |
Source: Financial statements and regulatory filings
Cash Flow Statement
| fiscal_date | 2025-03-31 | 2024-03-31 | 2023-03-31 | 2022-03-31 | 2021-03-31 |
|---|---|---|---|---|---|
| Operating Activities Net Income | 822.08M | 950.84M | 552.09M | 460.70M | 314.76M |
| Operating Activities Other Non Cash Items | -32.65M | -17.84M | 815.00K | -17.10M | -14.88M |
| Operating Activities Accounts Receivable | 69.79M | -126.25M | -175.58M | -106.21M | 20.97M |
| Operating Activities Other Assets Liabilities | -135.53M | 45.88M | -43.42M | -144.30M | -27.41M |
| Operating Activities Operating Cash Flow | 723.68M | 852.62M | 333.90M | 193.09M | 293.45M |
| Investing Activities Capital Expenditures | 1.50M | 5.61M | 9.55M | 1.06M | -50.40M |
| Investing Activities Other Investing Activity | -828.82M | -167.67M | -214.17M | -153.12M | 23.62M |
| Investing Activities Investing Cash Flow | -827.32M | -162.05M | -204.62M | -152.06M | -26.78M |
| Financing Activities Long Term Debt Payments | 0.00 | -224.16M | -27.28M | -10.36M | -55.33M |
| Financing Activities Common Dividends | -58.85M | -88.27M | -29.42M | N/A | N/A |
| Financing Activities Financing Cash Flow | -58.85M | -313.23M | 79.17M | 89.04M | -29.79M |
| End Cash Position | 137.15M | 58.55M | 117.66M | 68.69M | 127.77M |
| Free Cash Flow | 587.72M | 715.22M | 262.16M | 185.31M | 251.84M |
| Financing Activities Long Term Debt Issuance | N/A | 0.00 | 141.57M | 97.81M | 25.00M |
| Financing Activities Other Financing Charges | N/A | -801.00K | -5.70M | 1.58M | 535.00K |
| Financing Activities Short Term Debt Issuance | N/A | N/A | N/A | N/A | N/A |
Source: Financial statements and regulatory filings
Technical Analysis
Key Insights
- Kothari Petrochemicals currently exhibits a mixed trend with price action above the 50-day moving average (INR 118.74) but below the 200-day moving average (INR 134.23), indicating potential consolidation.
- Key support levels are identified near INR 120 and INR 95, with resistance observed around INR 153 and the 52-week high of INR 191.95.
- The stock price is trading above the 10-day moving average, suggesting short-term momentum, while the gap below the 200-day average signals longer-term resistance.
- Momentum indicators show the Relative Strength Index (RSI) in a neutral range around 50-60, MACD near the signal line indicating limited momentum, and stochastic oscillators reflecting sideways movement.
- Analysis across daily, weekly, and monthly timeframes reveals short-term bullishness tempered by medium-term caution, with no clear breakout confirmed.
- Current technical setup suggests a scenario of range-bound trading with potential for upward movement if resistance levels are breached, balanced by support holding in downside cases.
Trending News
1. Headline: Top stocks in news: SBI, Hyundai, ABB India, Swiggy, Bank of Baroda, Urban Co, JSW Infra - BusinessToday
Summary: Stocks like SBI, Hyundai, ABB India, Swiggy, Bank of Baroda, Urban Co, JSW Infra, Tata Consumer, Niva Bupa will be in the spotlight on Monday, May 11.
Sentiment: neutral
2. Headline: Bonus issues, stock splits & dividends: SBI among 18 stocks turning ex-date this week. Do you own any? - LSD News
Summary: Stocks likely to be in focus include ... companies as on the record date in order to be eligible for the dividends, stock splits or bonus shares. Kothari Petrochemicals – Dividend...
Sentiment: neutral
3. Headline: Stocks to buy under ₹200: Mehul Kothari of Anand Rathi recommends three shares to buy or sell | Stock Market News
Summary: BSE Sensex and NSE Nifty ended lower on May 8 but closed the week with gains. The Nifty rose 1%, while broader markets outperformed, with Midcap and Smallcap indices up 4%. Market volatility persisted amid global tensions and profit booking.
Sentiment: positive
4. Headline: Mangalore Refinery & Petrochemicals Ltd. Sees Surge in Value Trading and Institutional Interest
Summary: Mangalore Refinery & Petrochemicals Ltd. (MRPL) emerged as one of the most actively traded stocks by value on 8 May 2026, registering a robust 8.04% gain and outperforming its sector by 7.75%. The stock’s impressive turnover and institutional interest underscore renewed investor confidence ...
Sentiment: positive
5. Headline: Mangalore Refinery & Petrochemicals Ltd. Sees Exceptional Volume Surge Amid Strong Market Outperformance
Summary: Mangalore Refinery & Petrochemicals Ltd. (MRPL) emerged as one of the most actively traded stocks on 8 May 2026, registering a remarkable volume surge alongside a significant price rally. The oil sector small-cap witnessed an 8.04% intraday gain, outperforming its sector and the broader Sensex, ...
Sentiment: positive
Recent Updates
News Summary
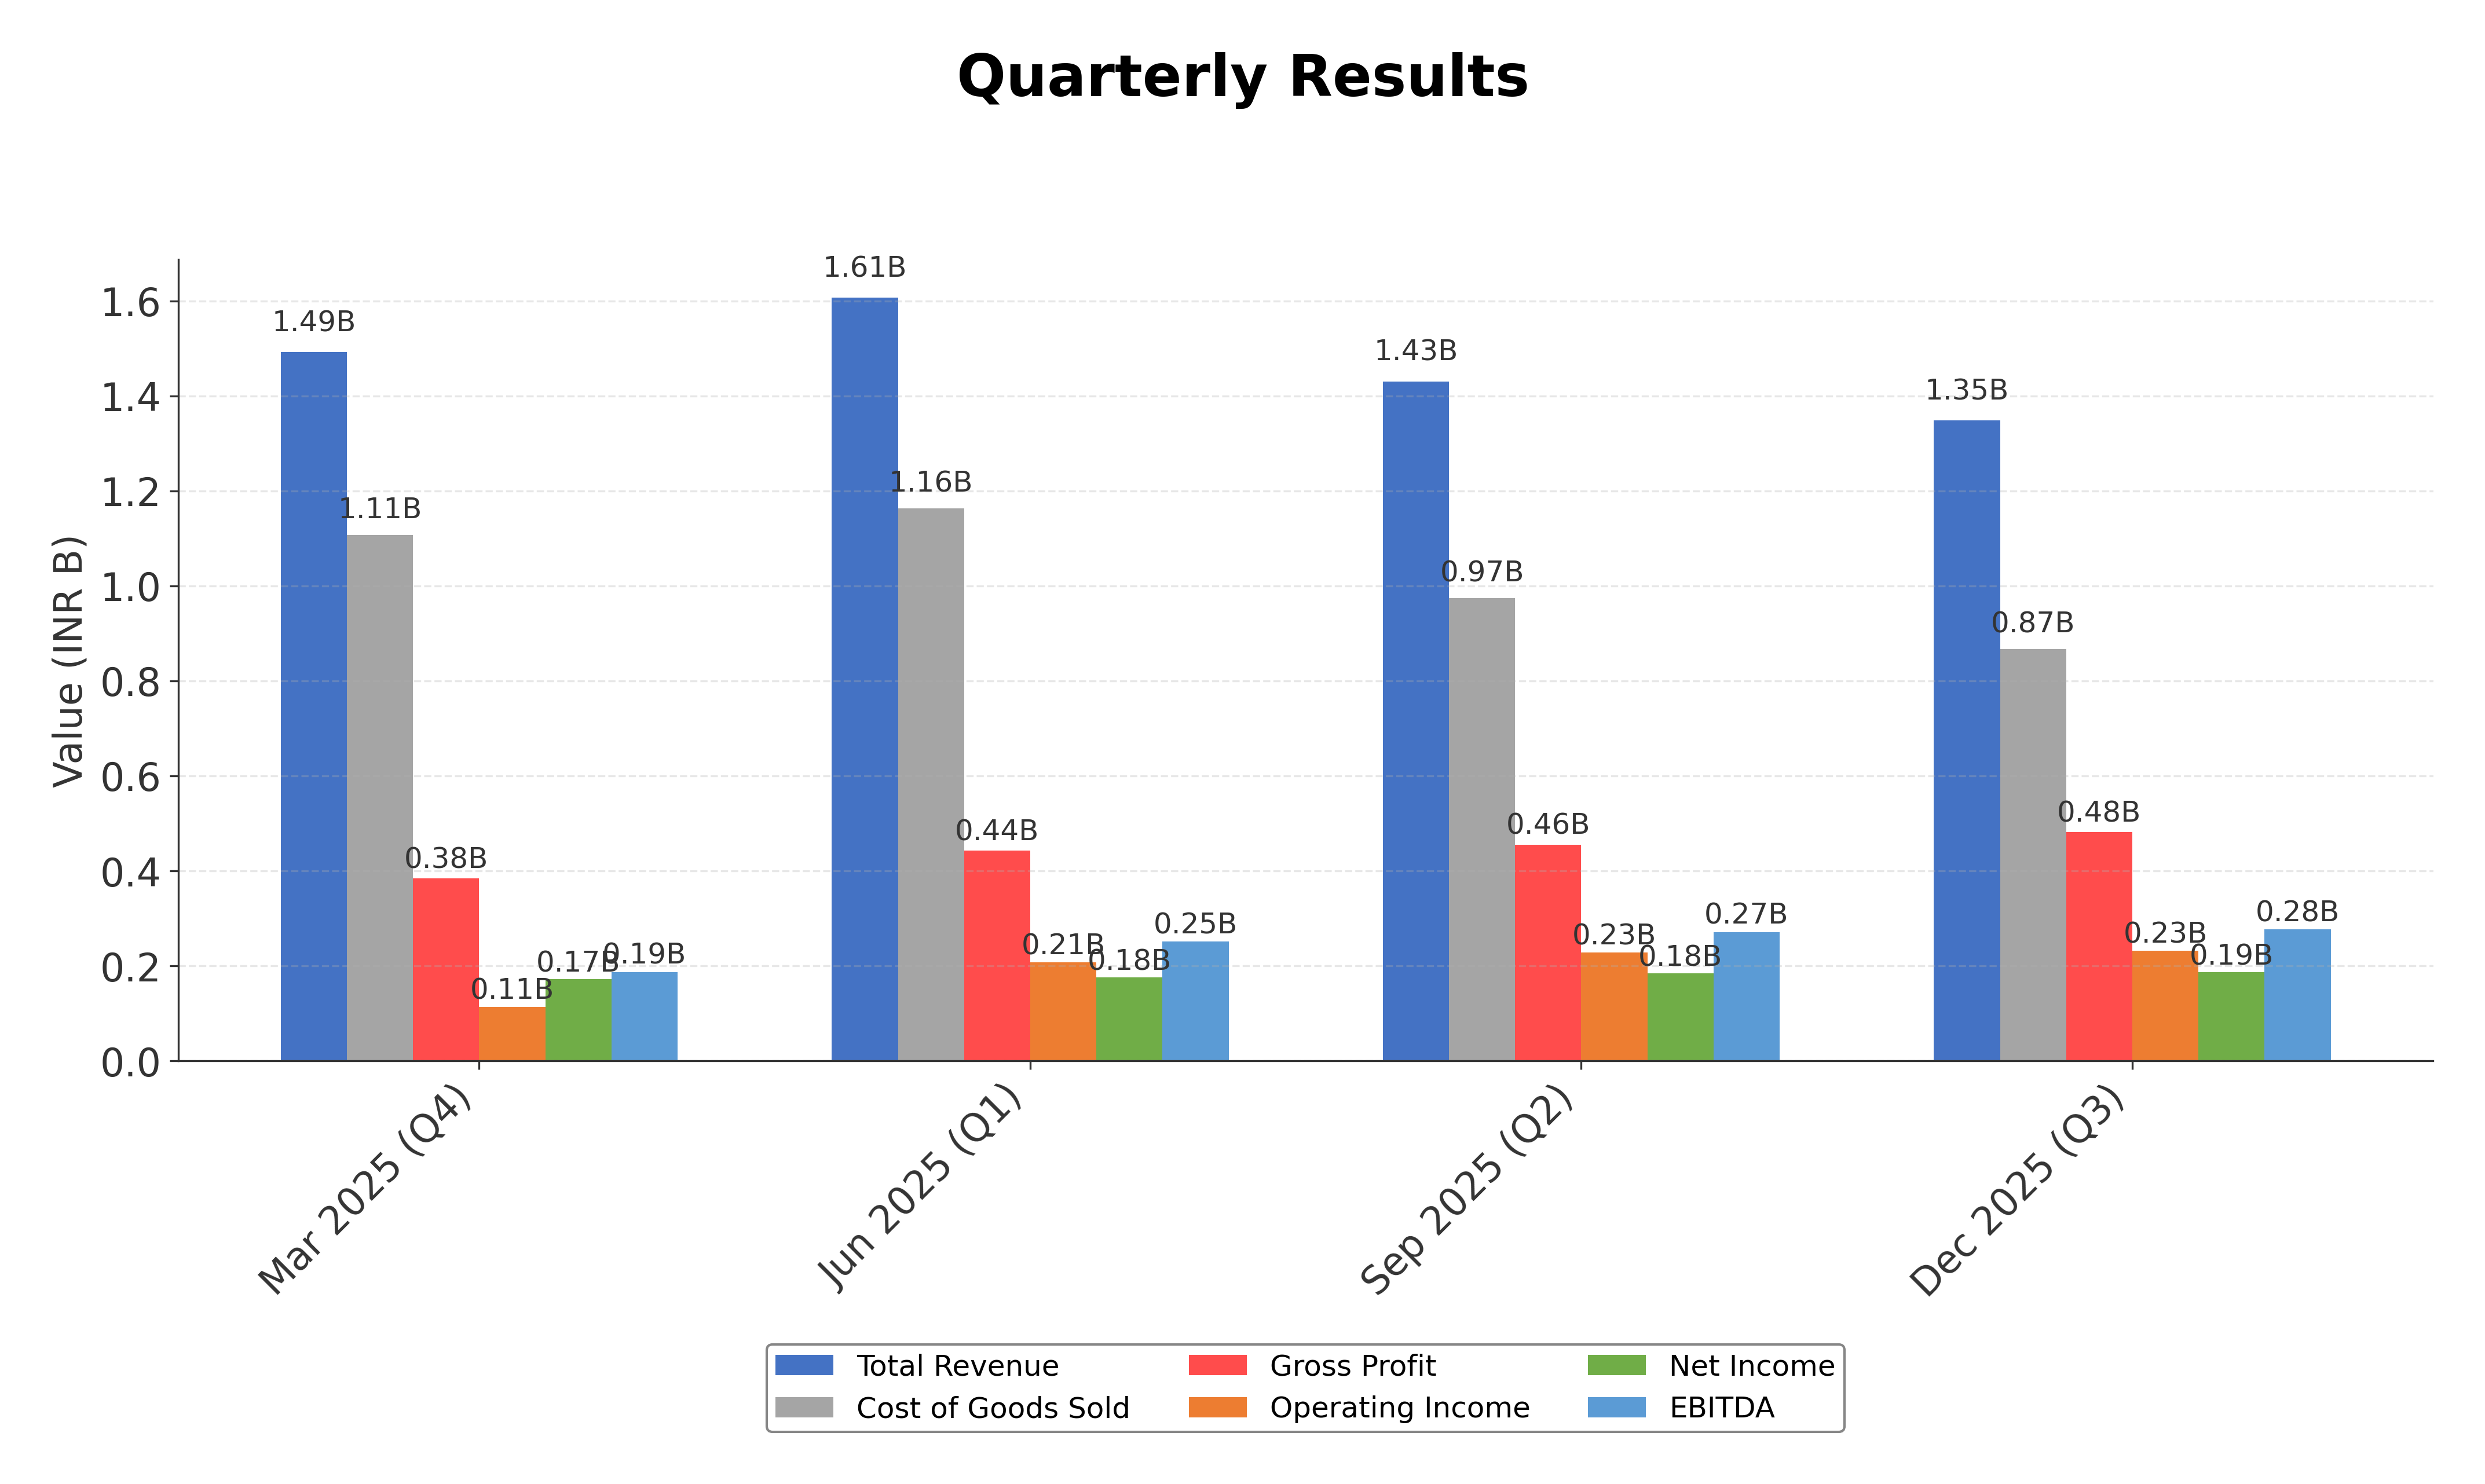
As of May 11, 2026. Kothari Petrochemicals Ltd is preparing to announce its Q4 FY26 results in June 2026, with analyst consensus projecting a 6% year-on-year revenue increase to Rs 402 crore and a 17% rise in PAT to Rs 35 crore. The quarter is pivotal for assessing the full-year financial trajectory and future guidance amid a recovering specialty chemicals sector. The company maintains strong profitability with a 12.1% net margin and robust returns on equity at 21.4%. Dividend announcements and valuation upgrades have recently enhanced market sentiment. Operationally, the company continues to generate strong cash flows with low debt levels, supporting financial stability and growth prospects.
News Sentiment
The overall sentiment from recent updates is cautiously positive, driven by expectations of revenue and profit growth in the upcoming quarterly results and a favorable valuation reassessment. Dividend declarations and analyst recognition further contribute to constructive market perception. However, the absence of detailed insider or institutional shareholding data and sector-specific risks temper the outlook. The sentiment balances optimism on operational momentum with prudent attention to external factors influencing the specialty chemicals industry.
Source List
- https://www.screener.in/company/KOTHARIPET/
- https://finance.yahoo.com/quote/KOTHARIPET.NS/
- https://www.nseindia.com/get-quotes/equity?symbol=KOTHARIPET
Analytical Overview
Analysis Summary
Kothari Petrochemicals' valuation metrics, including a trailing P/E of 11.5 and a P/B ratio of 2.47, are notably lower than industry averages, suggesting the stock trades at a discount relative to peers. The company exhibits a strong growth trajectory with consistent revenue growth of 1.6% quarterly and positive earnings momentum, supported by a PEG ratio of 0.25 indicating undervaluation relative to growth prospects. Financial health is robust, with a low debt-to-equity ratio of 0.60 and solid operating cash flow of INR 805 million, reflecting prudent capital management and liquidity. Sector-specific opportunities arise from the recovering specialty chemicals market and increased export demand driven by global supply chain shifts, while challenges include regulatory compliance and competitive pressures. Given the company's Indian market context, factors such as evolving regulatory frameworks, consumer demand trends, and macroeconomic conditions play a significant role in shaping its outlook.
Overall Business and Market Assessment
Supporting Factors: strong profitability with a 21.4% ROE, healthy cash flow generation, and attractive valuation multiples relative to peers
Risk Factors: No data
SWOT Analysis
Strengths
- Kothari Petrochemicals maintains strong profitability with a 21.4% return on equity.
- The company has low debt levels, with a debt-to-equity ratio of 0.60, supporting financial stability.
- Consistent cash flow generation is evidenced by operating cash flow of INR 805 million.
- The firm holds a significant market position in specialty chemicals with diversified product applications.
Weaknesses
- Limited public disclosure on shareholding patterns restricts transparency on ownership dynamics.
- Revenue growth is moderate at 1.6% quarterly, indicating steady but unspectacular expansion.
- Stock price volatility is notable, with a 10.2% decline from the 52-week high.
- Dependence on cyclical petrochemical industry exposes the company to demand fluctuations.
Opportunities
- Growing global demand for specialty chemicals driven by supply chain diversification benefits the company.
- Increased export opportunities due to China Plus One sourcing trends support revenue growth.
- Potential for margin improvement through operational efficiencies and cost management.
- Expansion into new geographic markets could enhance market share and revenue streams.
Threats
- Regulatory changes in chemical manufacturing could increase compliance costs.
- Intense competition from larger domestic and international chemical producers.
- Macroeconomic volatility and raw material price fluctuations may impact profitability.
- Environmental and sustainability regulations could require additional capital expenditure.
Company Description
Kothari Petrochemicals Ltd. is a significant player in the petrochemical industry, primarily engaged in the production and distribution of various petrochemical products. Specializing in the manufacturing of liquid paraffin and other allied chemicals, the company serves as a critical supplier to industries ranging from pharmaceuticals to cosmetics, where its products are essential in formulation processes. Its operations are strategically aligned with enhancing supply chains in these sectors, given the growing demand for quality chemical inputs. Kothari Petrochemicals Ltd. prides itself on a commitment to sustainability and innovation, employing state-of-the-art technology to ensure products meet rigorous international standards. In the financial market, the company represents a sturdy backbone for numerous industries reliant on consistent and high-quality petrochemical supplies. Situated within the broader chemical sector, Kothari Petrochemicals Ltd.'s market presence underscores its role in bolstering industrial productivity and supporting economic activity by fulfilling various critical industrial needs.