

KCP Sugar & Industries Corporation Ltd (KCPSUGIND)
Stock Analysis Report
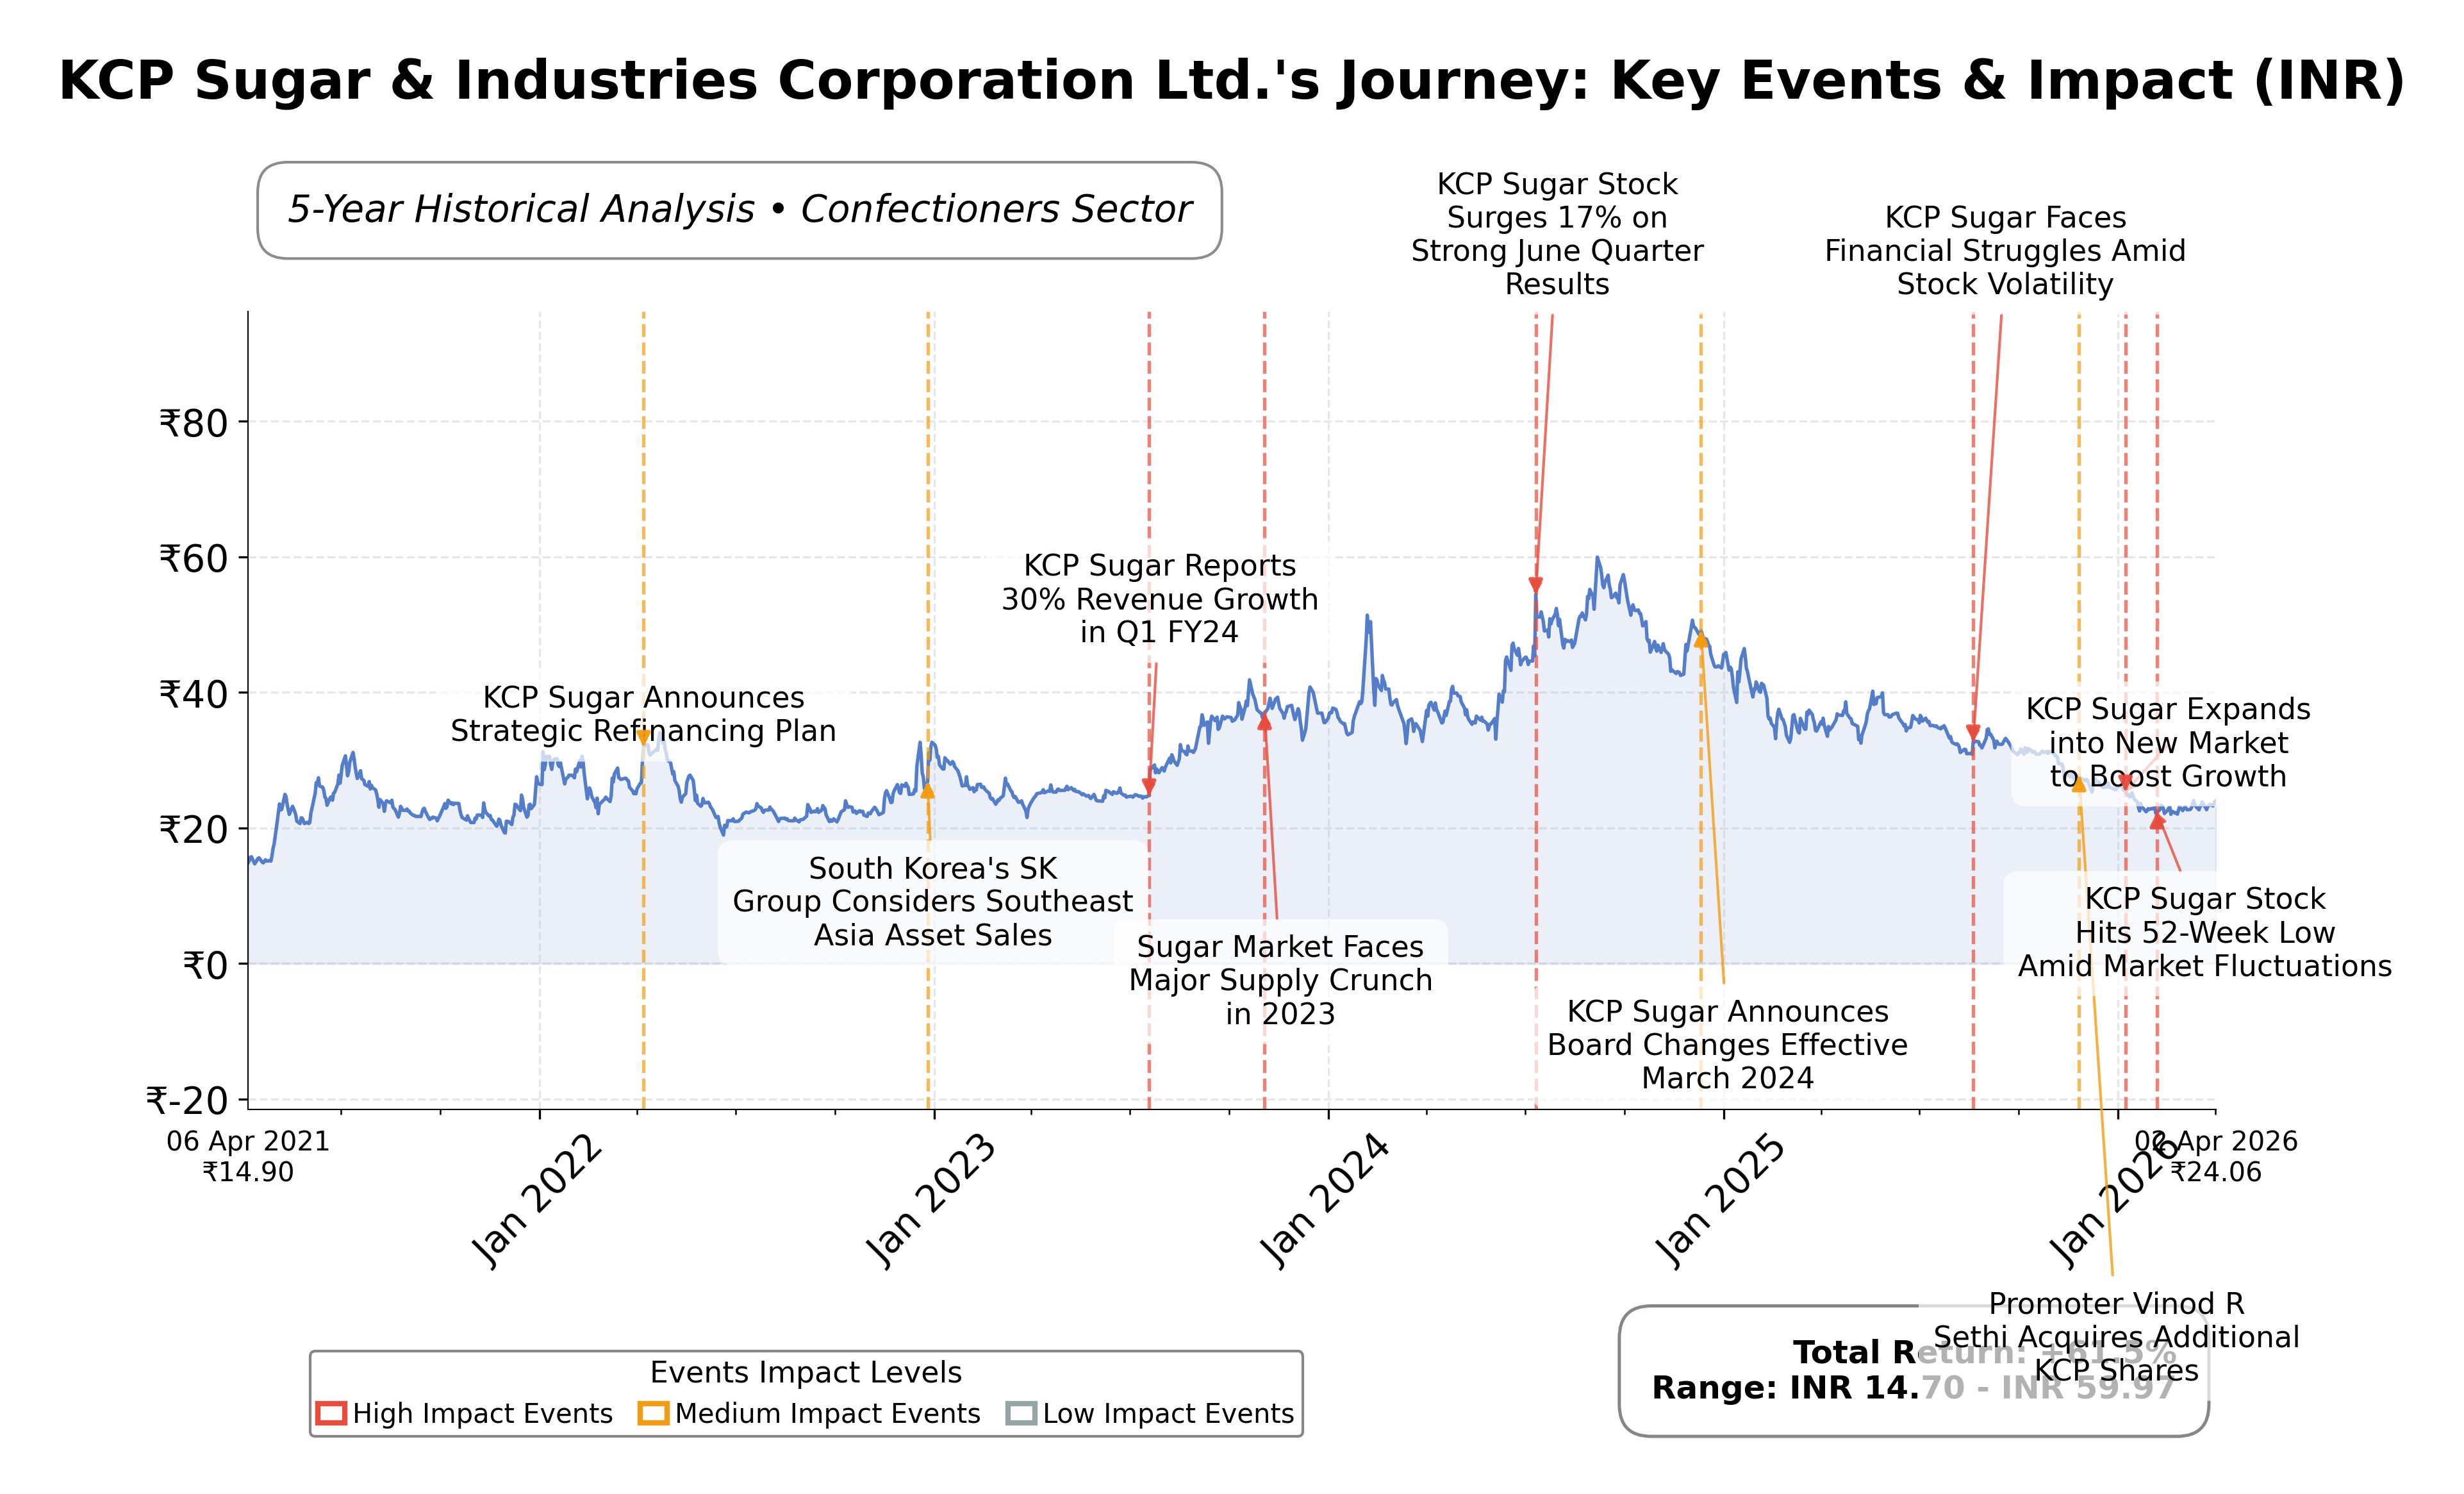
Stock Journey
Key Positives and Key Risks
Pros
- Strong liquidity position with a current ratio of 8.39 and total cash of ₹1.49 billion exceeding total debt of ₹610.8 million, indicating financial resilience.
- Operational diversification into sugar, alcohol production, and power generation through cogeneration enhances resource utilization and cost efficiency.
- Recent promoter share acquisition increased insider stake to 0.83%, reflecting confidence in the company’s prospects.
Cons
- Negative quarterly revenue growth of -23.2% and earnings decline of -23.17% year-over-year indicate operational challenges.
- High trailing P/E ratio of 66.83 suggests the stock is valued at a premium relative to earnings, despite modest profitability.
- Absence of institutional investor holdings may limit market support and influence governance dynamics.
Disclosure: This information is for general awareness and does not constitute investment advice
Report Summary
KCP Sugar & Industries Corporation Ltd. operates primarily in the Indian sugar industry, focusing on sugar production, sugarcane cultivation, and processing. The company also diversifies into alcohol production and power generation through cogeneration plants utilizing by-products like bagasse. Positioned within the Consumer Defensive sector under the Confectioners industry, KCP Sugar plays a significant role in the agro-industrial landscape of India, supporting rural economies and aligning with sustainable agricultural and renewable energy policies.
Financially, the company reports a market capitalization of approximately â¹2.75 billion and an enterprise value near â¹1.83 billion. It has a trailing P/E ratio of 66.83, a price-to-book ratio of 0.54, and an EV/EBITDA multiple of 4.53. Revenue for the trailing twelve months stands at about â¹2.57 billion with a modest net income of â¹41.1 million, reflecting a profit margin of 1.6%. The company maintains a strong current ratio of 8.39 and holds cash reserves of approximately â¹1.49 billion against total debt of â¹610.8 million, indicating solid liquidity and low leverage.
Technically, the stock trades at â¹24.75, below its 52-week high of â¹41.10, with a beta of 0.176 suggesting low volatility. Recent promoter activity includes a stake increase by Vinod R. Sethi, enhancing insider confidence. Key strengths include robust cash flow generation and a conservative debt profile, while risks involve declining quarterly revenue growth (-23.2%) and earnings growth (-23.17%). The companyâs PEG ratio is negative, reflecting challenges in earnings growth relative to valuation. These factors provide nuanced insights for market participants considering exposure to this stock.
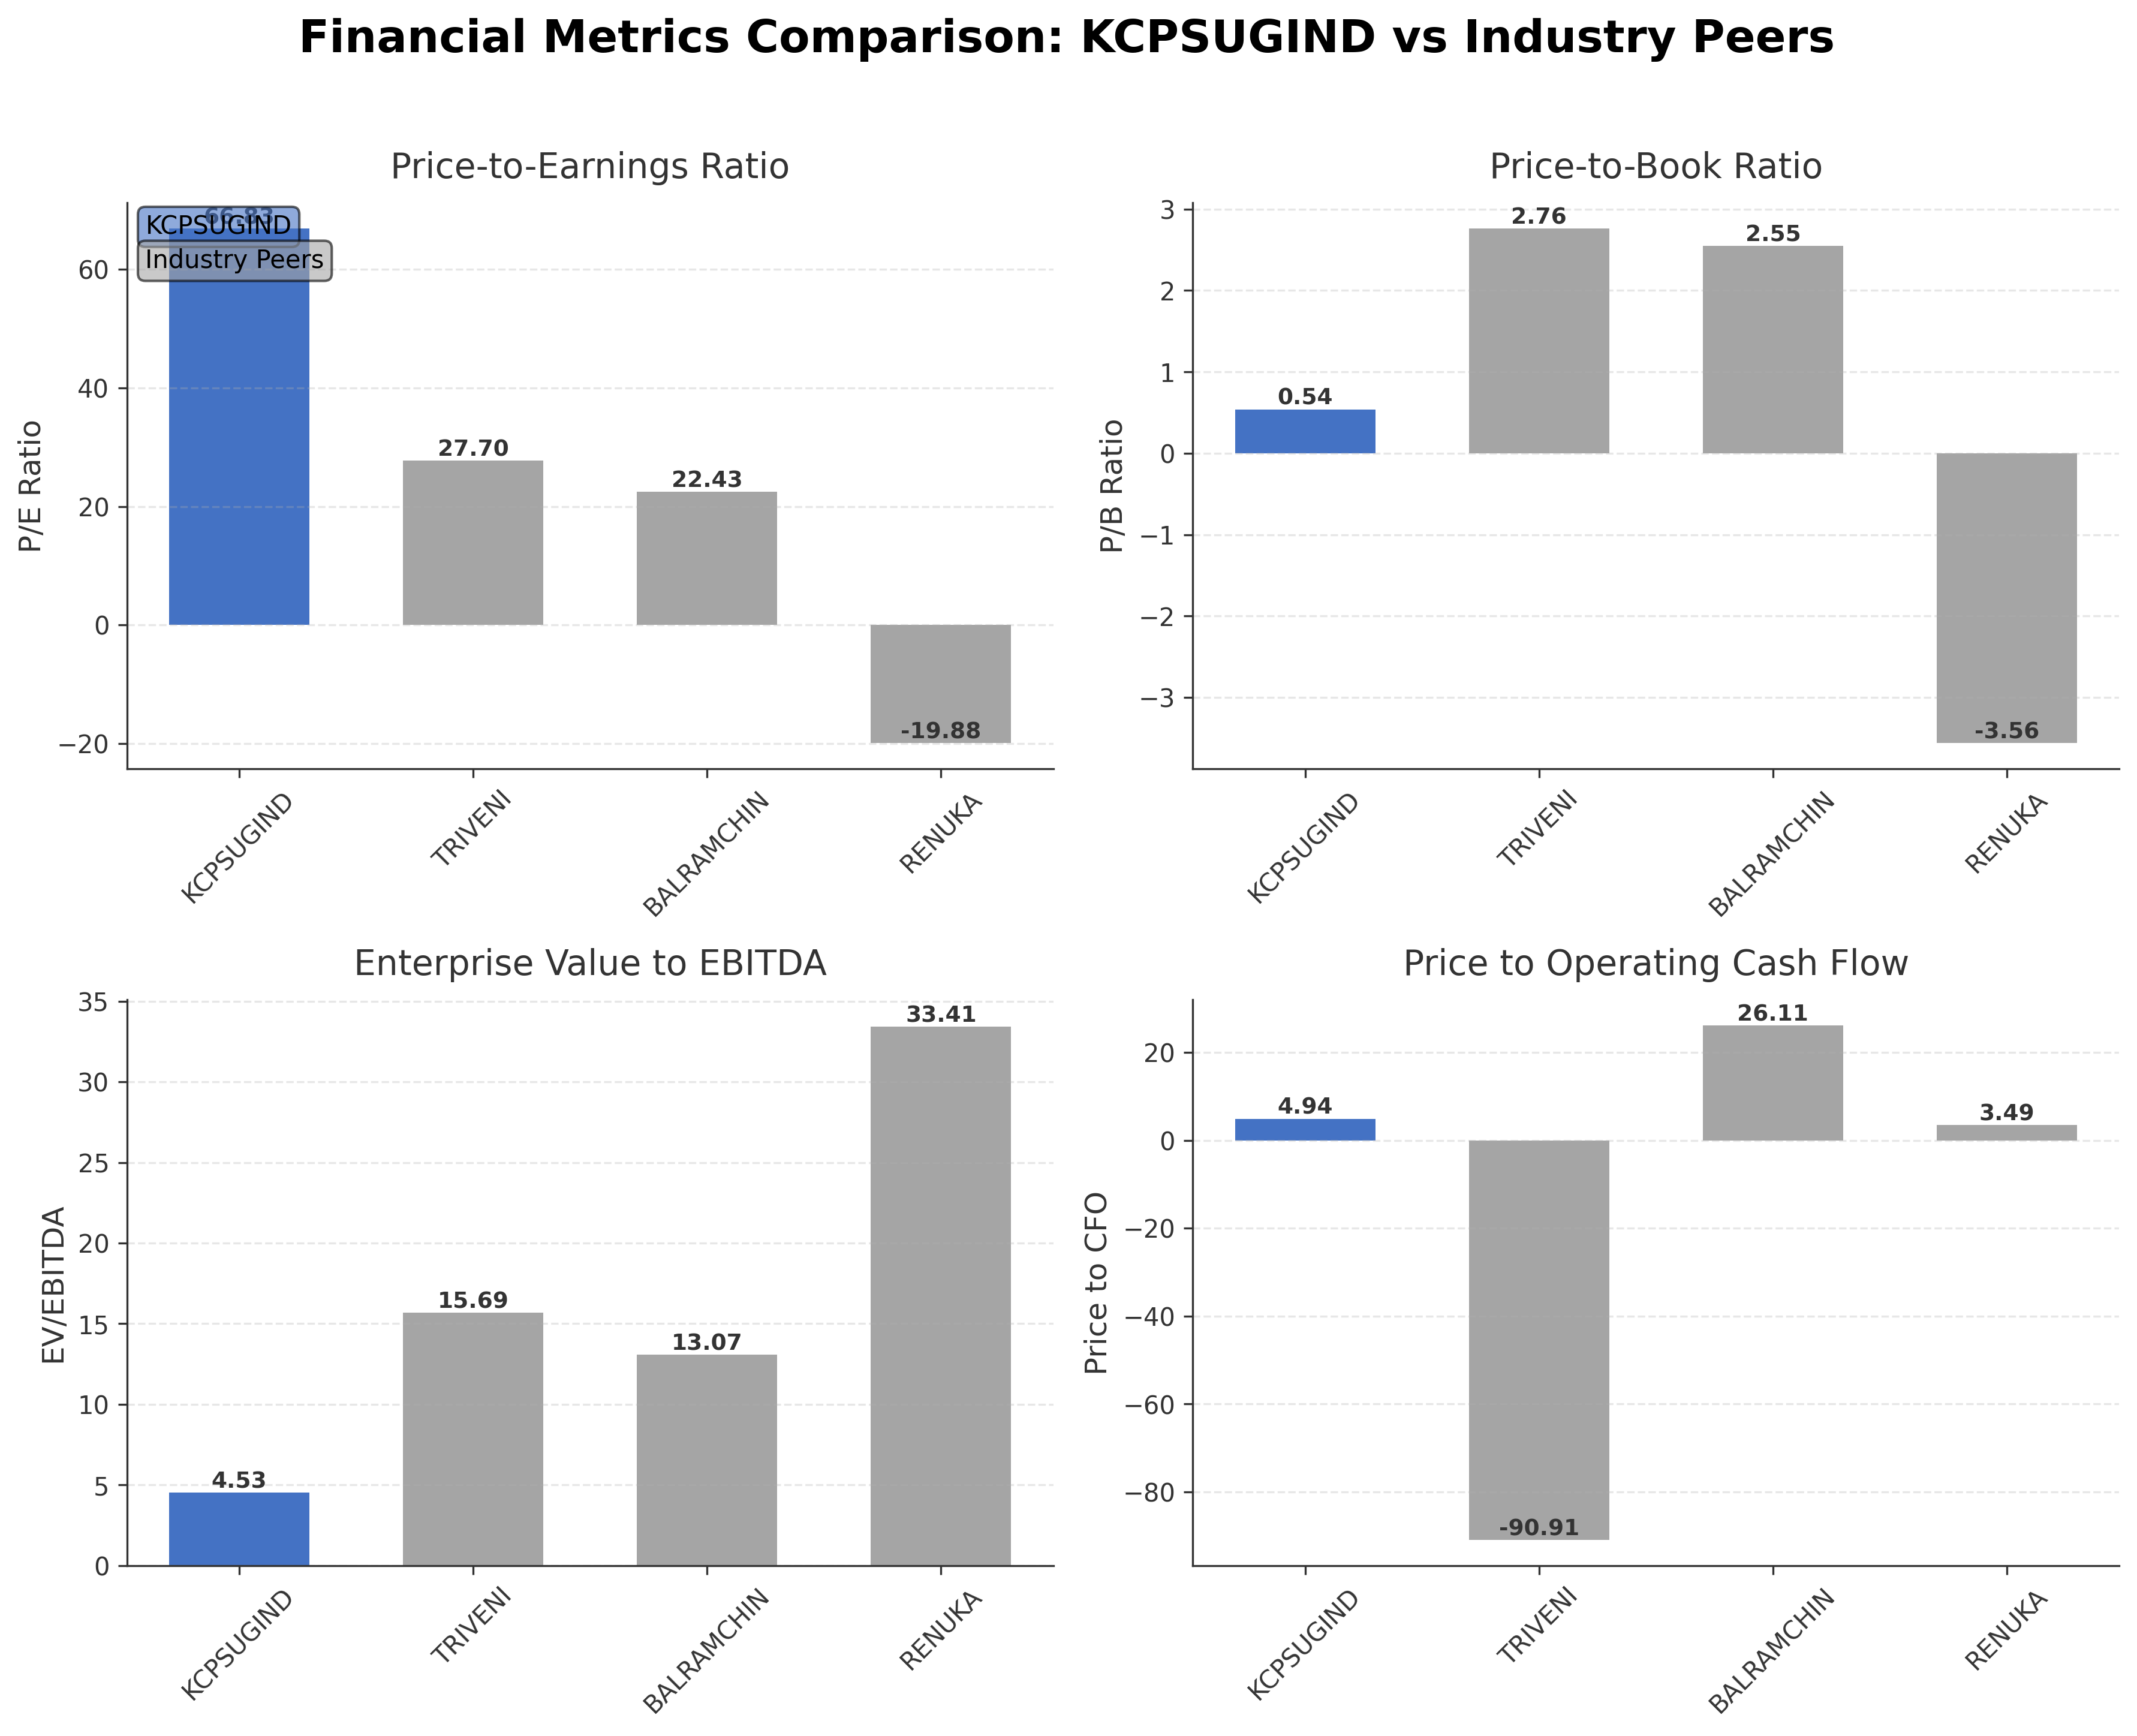
Peer analysis within the Indian sugar and allied industries shows KCP Sugarâs market capitalization is significantly smaller compared to peers like Balrampur Chini Mills Ltd. (â¹98.89 billion) and Triveni Engineering & Industries Ltd. (â¹84.99 billion). Its valuation multiples such as P/E (66.83) and EV/EBITDA (4.53) differ notably from peers, with KCP Sugar exhibiting a lower EV/EBITDA but higher P/E ratio. Return on equity (0.03%) is also below peers, indicating relatively lower profitability. This comparison highlights KCP Sugarâs distinct market positioning and scale within the regional industry landscape.
KCP Sugar & Industries Corporation Ltd. navigates a complex industry environment characterized by commodity price volatility and regulatory dynamics. Recent promoter share acquisitions and steady liquidity underscore ongoing commitment and financial stability, while operational challenges such as declining revenue growth present pivotal moments. The company stands to benefit from sustainable energy initiatives and rural economic contributions but faces risks from market fluctuations and competitive pressures. Given the current data, a balanced perspective may be appropriate for those monitoring the stockâs trajectory amid evolving industry conditions.
Company and Industry Overview
Company Basics
Price Performance
Company Size
Shareholding Pattern
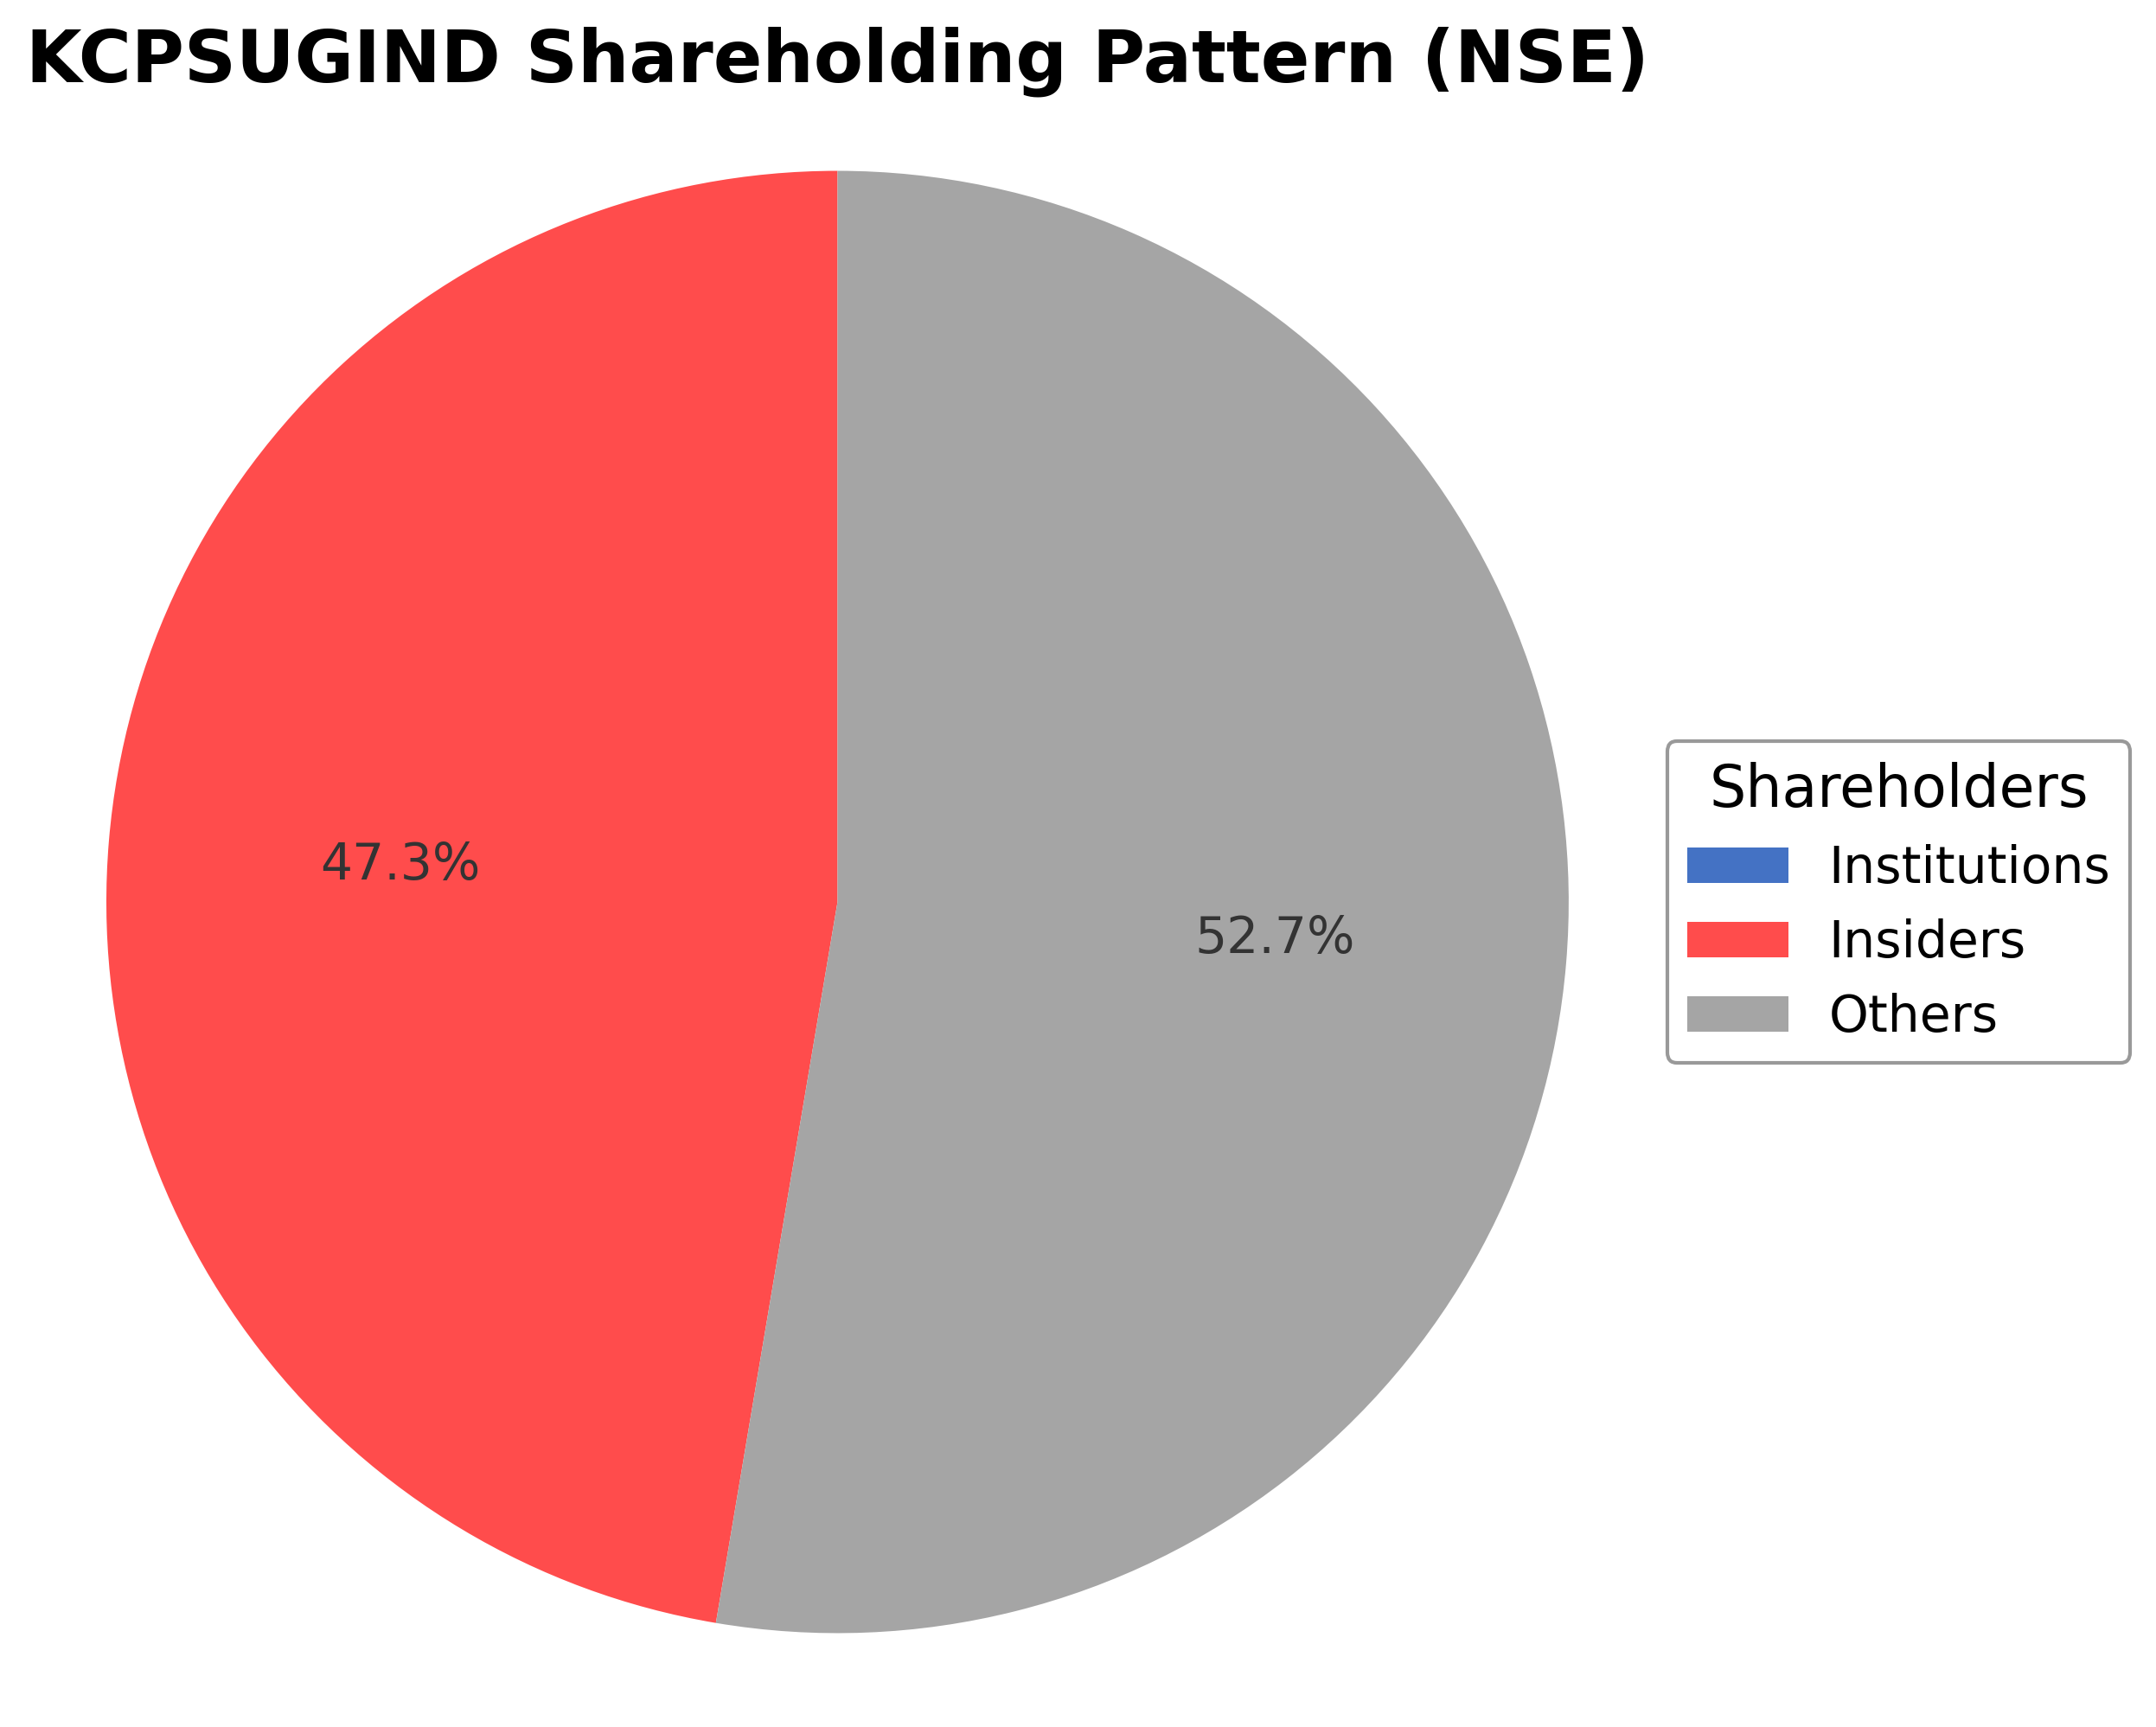
The ownership structure of KCP Sugar & Industries Corporation Ltd. shows promoters holding approximately 0.83% following recent acquisitions by Vinod R. Sethi, indicating increased insider participation. Institutional investors currently hold no reported stake, while the public and other shareholders constitute the majority at 99.17%. Over the past 12-24 months, promoter stake has seen modest accumulation, reflecting confidence in the company’s prospects. The absence of institutional holdings suggests limited large-scale fund involvement, which may influence governance dynamics and strategic decision-making. This shareholding pattern points to a predominantly retail-driven market sentiment and a governance framework reliant on promoter and public shareholder engagement.
Sector and Industry Analysis
KCP Sugar & Industries Corporation Ltd. operates primarily within the sugar manufacturing sector, which is a significant segment of the broader agribusiness and food processing industry. The global sugar industry is sizable, with market estimates valuing it in the hundreds of billions of dollars, driven by demand in food and beverage manufacturing, biofuels, and industrial applications. Growth trajectories in this sector are generally moderate, influenced by factors such as agricultural output variability, commodity price fluctuations, and evolving consumer preferences. Key players include integrated sugar producers and refiners with diversified portfolios spanning ethanol production and power cogeneration, reflecting the industry's vertical integration trend.
Industry trends are shaped by technological advancements in agricultural practices, such as precision farming and genetically improved crop varieties, which enhance yield and reduce costs. Additionally, there is a growing consumer shift toward healthier and alternative sweeteners, pressuring traditional sugar producers to innovate or diversify. The rise of bioethanol as a renewable energy source presents an emerging opportunity for sugar companies to leverage byproducts like molasses. Furthermore, digitalization in supply chain management and sustainability initiatives, including water and energy efficiency, are increasingly critical for operational competitiveness and meeting stakeholder expectations.
The regulatory environment for the sugar sector is complex and varies significantly by geography, often involving tariffs, export-import quotas, and subsidies that impact global trade flows and pricing. Compliance with food safety standards, environmental regulations related to agricultural runoff and emissions, and labor laws are critical. In India, where KCP Sugar is based, government policies such as minimum support prices for sugarcane, ethanol blending mandates, and export incentives heavily influence operational economics. Recent policy shifts toward promoting ethanol production for energy security have introduced both opportunities and compliance challenges for sugar manufacturers.
Competitive dynamics in the sugar industry are characterized by moderate to high barriers to entry due to capital-intensive production facilities, land acquisition for sugarcane cultivation, and regulatory approvals. Market structure tends toward oligopolistic competition with a few large integrated players dominating, supported by economies of scale and established supply chains. Competitive positioning hinges on cost leadership, product diversification (e.g., sugar, ethanol, power), and geographic reach. Companies that can effectively manage agricultural risks, optimize production efficiency, and align with government policies maintain a strategic advantage. Additionally, strategic alliances and backward integration into farming operations are common to secure raw material supply and mitigate volatility.
Note: Analysis synthesized from industry research, market reports, and regulatory filings. Information is subject to change based on market conditions.
Illustrative Scenario Analysis
DCF Assumptions:
Method: Two-Stage EPS-Priority Model
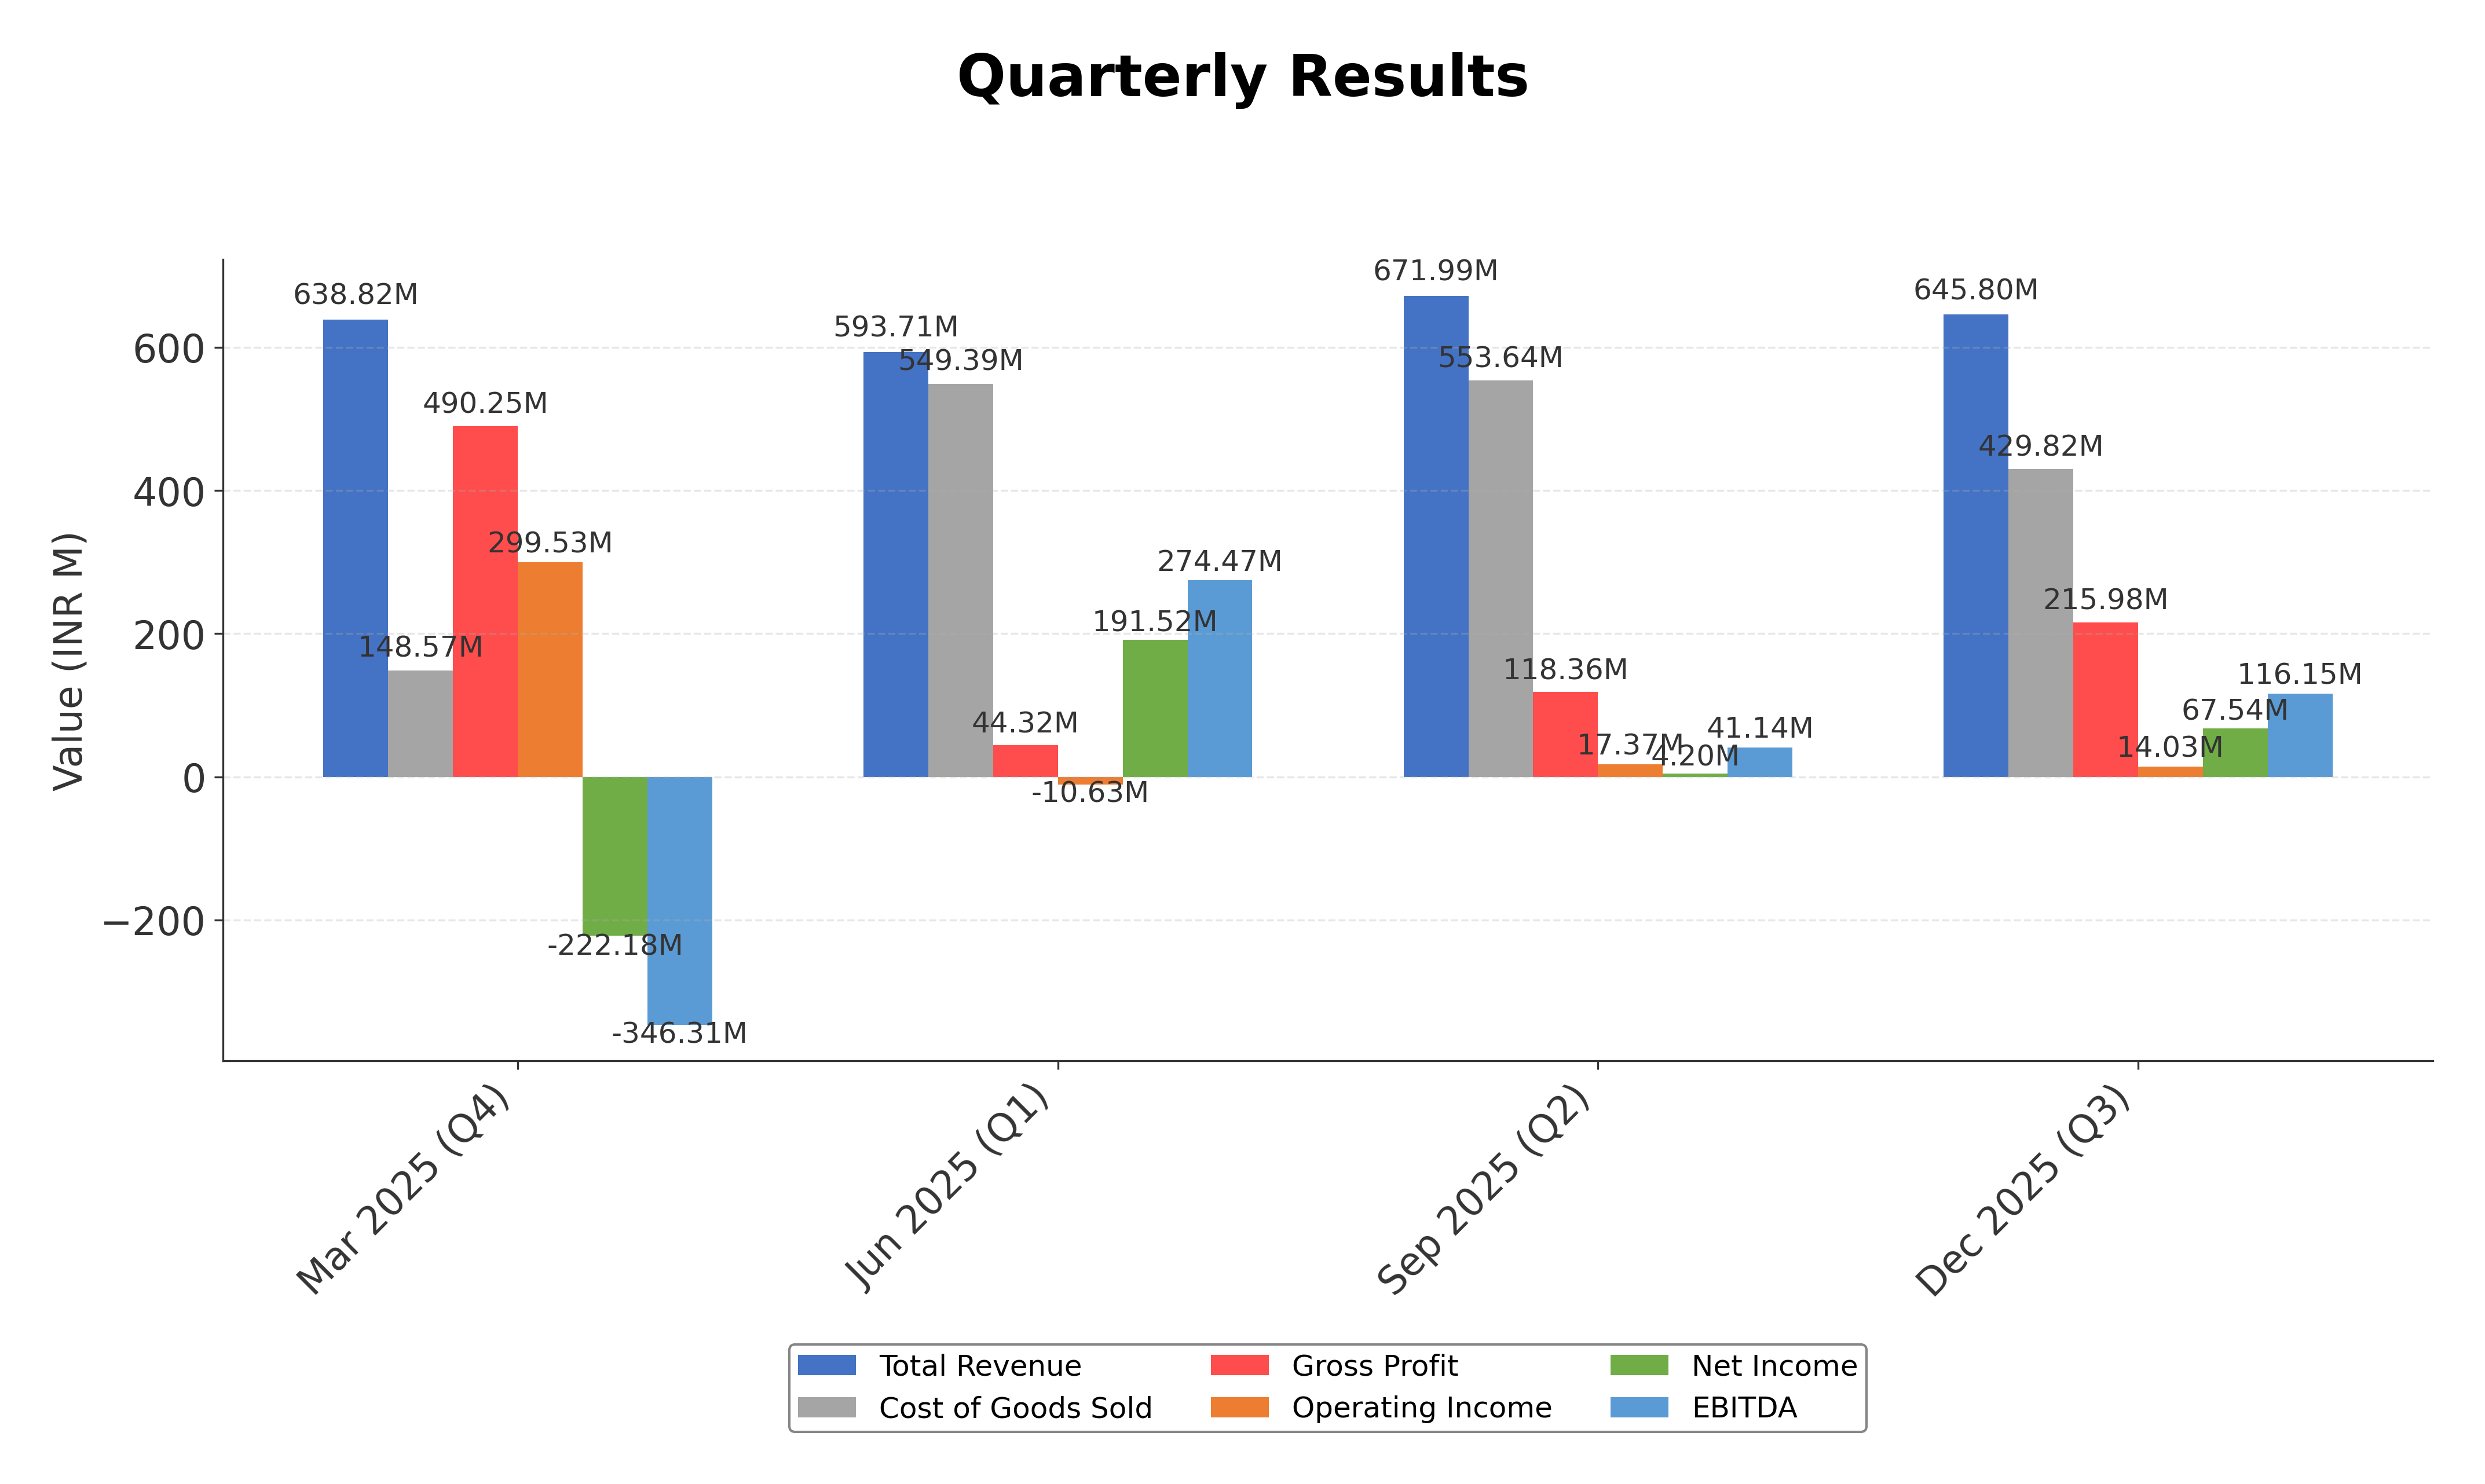
Financials
Peer Analysis
| Company Name | Market Cap | P/E Ratio | P/B Ratio | EV/EBITDA | Price to CFO |
|---|---|---|---|---|---|
| KCP Sugar & Industries Corporation Ltd. | ₹2.75B | 66.83 | 0.54 | 4.53 | 4.94 |
| Triveni Engineering & Industries Ltd. | ₹84.99B | 27.70 | 2.76 | 15.69 | -90.91 |
| Balrampur Chini Mills Ltd. | ₹98.89B | 22.43 | 2.55 | 13.07 | 26.11 |
| Shree Renuka Sugars Ltd. | ₹59.94B | -19.88 | -3.56 | 33.41 | 3.49 |
Comparison Analysis: KCP Sugar & Industries Corporation Ltd. is smaller in market capitalization compared to its regional peers such as Balrampur Chini Mills Ltd. and Triveni Engineering & Industries Ltd. The company exhibits a higher P/E ratio (66.83) relative to peers, indicating a premium valuation despite lower profitability metrics like return on equity (0.03%). Its price-to-book ratio is significantly lower (0.54), suggesting undervaluation on a book value basis. The EV/EBITDA multiple (4.53) is also lower than peers, reflecting potentially more attractive operational valuation. Price to CFO is positive and moderate compared to peers. Overall, KCP Sugar presents a distinct valuation and profitability profile within the Indian sugar industry.
Financial Metrics Comparison with Peers
Financial Statements
Comprehensive financial data including income, balance sheet, and cash flow metrics
Income Statement
| fiscal_date | 2025-03-31 | 2024-03-31 | 2023-03-31 | 2022-03-31 | 2021-03-31 |
|---|---|---|---|---|---|
| Sales | 3.10B | 34.15B | 2.89B | 3.19B | 3.28B |
| Cost Of Goods | 2.19B | 2.52B | 2.02B | 2.27B | 2.61B |
| Gross Profit | 911.10M | 31.63B | 867.05M | 920.21M | 677.26M |
| Operating Expense Research And Development | 737.00K | 1.08M | 267.00K | 244.00K | 141.00K |
| Operating Expense Selling General And Administrative | 59.12M | 66.14M | 64.80M | 81.98M | 62.92M |
| Operating Expense Other Operating Expenses | 265.66M | 220.79M | 266.66M | 219.73M | 194.35M |
| Operating Income | 84.74M | 30.87B | 28.62M | 168.59M | -55.06M |
| Non Operating Interest Income | 46.40M | 58.27M | 23.69M | 12.62M | 12.30M |
| Non Operating Interest Expense | 79.88M | 100.70M | 134.85M | 196.95M | 243.63M |
| Pretax Income | 280.23M | 788.62M | 702.09M | 51.54M | 171.14M |
| Income Tax | 136.35M | 127.03M | 120.35M | 15.76M | -61.88M |
| Net Income | 143.87M | 661.60M | 581.74M | 35.77M | 233.02M |
| Eps Basic | 1.27 | 5.83 | 5.13 | 0.32 | 2.22 |
| Eps Diluted | 1.27 | 5.83 | 5.13 | 0.32 | 2.22 |
| Basic Shares Outstanding | 113.29M | 113.48M | 113.40M | 111.79M | 104.96M |
| Diluted Shares Outstanding | 113.29M | 113.48M | 113.40M | 111.79M | 104.96M |
| Ebit | 360.11M | 889.33M | 836.94M | 248.49M | 414.77M |
| Ebitda | 269.23M | 335.31M | 151.42M | 282.65M | 90.18M |
| Net Income Continuous Operations | 280.23M | 788.62M | 702.06M | 51.54M | 171.14M |
| Preferred Stock Dividends | 0.00 | 0.00 | 0.00 | 0.00 | 0.00 |
Data provided by Twelve Data
Balance Sheet
| fiscal_date | 2025-03-31 | 2024-03-31 | 2023-03-31 | 2022-03-31 | 2021-03-31 |
|---|---|---|---|---|---|
| Cash And Cash Equivalents | 201.41M | 229.54M | 379.47M | 178.40M | 43.09M |
| Accounts Receivable | 486.24M | 292.03M | 221.13M | 293.09M | 463.00M |
| Total Assets | 6.19B | 6.66B | 6.28B | 5.78B | 6.43B |
| Total Liabilities | 1.68B | 2.27B | 2.55B | 2.62B | 3.30B |
| Long Term Debt | 333.26M | 328.89M | 427.39M | 721.87M | 926.46M |
| Shareholders Equity | 4.50B | 4.39B | 3.73B | 3.15B | 3.13B |
Data provided by Twelve Data
Cash Flow Statement
| fiscal_date | 2025-03-31 | 2024-03-31 | 2023-03-31 | 2022-03-31 | 2021-03-31 |
|---|---|---|---|---|---|
| Operating Activities Net Income | 280.23M | 788.62M | 702.06M | 51.54M | 171.14M |
| Operating Activities Other Non Cash Items | -35.12M | 76.45M | 99.36M | 228.12M | -82.57M |
| Operating Activities Accounts Receivable | -198.02M | -70.90M | 63.10M | 169.90M | -91.80M |
| Operating Activities Other Assets Liabilities | 509.98M | 167.88M | -3.71M | 633.24M | 703.68M |
| Operating Activities Operating Cash Flow | 557.07M | 962.06M | 860.82M | 1.08B | 700.45M |
| Investing Activities Capital Expenditures | 26.79M | 31.76M | 121.95M | -39.76M | -144.00M |
| Investing Activities Purchase Of Investments | -111.64M | -100.84M | -326.49M | 0.00 | -28.42M |
| Investing Activities Sale Of Investments | 26.25M | 26.42M | 432.88M | 959.00K | 0.00 |
| Investing Activities Other Investing Activity | 1.00K | -127.11M | -13.83M | 9.64M | 11.26M |
| Investing Activities Investing Cash Flow | -58.59M | -169.76M | 214.51M | -29.16M | -161.16M |
| Financing Activities Common Dividends | -22.68M | -22.68M | -11.34M | -11.34M | -11.34M |
| Financing Activities Financing Cash Flow | -22.68M | -22.68M | -61.00M | -819.22M | -11.34M |
| End Cash Position | 201.41M | 229.54M | 379.47M | 178.40M | 43.09M |
| Free Cash Flow | 424.18M | 356.28M | -17.81M | 1.10B | 6.58M |
| Financing Activities Long Term Debt Payments | N/A | N/A | -49.66M | -807.88M | N/A |
| Financing Activities Other Financing Charges | N/A | N/A | 1.00K | 1.00K | 1.00K |
| Investing Activities Net Acquisitions | N/A | N/A | N/A | 0.00 | 0.00 |
| Financing Activities Long Term Debt Issuance | N/A | N/A | N/A | 0.00 | N/A |
Data provided by Twelve Data
Technical Analysis
Key Insights
- The current trend shows the stock trading below its 200-day moving average (₹28.57) and near its 50-day moving average (₹22.92), indicating a neutral to slightly bearish price action pattern.
- Key support levels are observed near ₹21.75 (52-week low) and ₹22.92 (50-day MA), while resistance is noted around ₹28.57 (200-day MA) and the recent high of ₹41.10.
- The stock price is positioned between the 10-day and 50-day moving averages, suggesting consolidation with no strong directional bias.
- Momentum indicators show a moderate RSI level, indicating neither overbought nor oversold conditions; MACD and Stochastic readings reflect a neutral momentum state.
- Multi-timeframe analysis reveals consistent sideways movement on daily and weekly charts, with monthly trends showing mild downward pressure.
- Potential market scenarios include a continuation of consolidation within the current price range or a breakout if key resistance or support levels are decisively breached.
Recent Updates
News Summary
Recent news for KCP Sugar & Industries Corporation Ltd. highlights a 'Sell' rating by MarketsMOJO as of February 2026, reflecting market caution. Promoter Vinod R. Sethi has increased his stake by acquiring 75,000 shares in March 2026, signaling insider confidence. CEO compensation has been evaluated as appropriate relative to company size and performance. Financial results indicate a nine-month profit of ₹18.69 crore, demonstrating ongoing operational profitability. Overall, the news cycle reflects a mix of cautious external sentiment and positive internal developments.
News Sentiment
The sentiment across recent updates is predominantly neutral with a slight positive tilt due to promoter share purchases and executive compensation transparency. The absence of significant negative news or regulatory challenges suggests stable market perception, though the sell rating indicates external caution. This balanced sentiment may contribute to measured market responses.
Analytical Overview
Analysis Summary
Valuation Metrics: KCP Sugar's trailing P/E ratio of 66.83 is substantially higher than the industry average, indicating a premium valuation relative to earnings. The price-to-book ratio of 0.54 suggests the stock is trading below book value, which contrasts with the higher P/E, reflecting mixed valuation signals.
Growth Trajectory: The company experienced a negative quarterly revenue growth of -23.2% and a similar decline in earnings growth year-over-year, indicating short-term headwinds in growth momentum. However, positive operating cash flow and free cash flow generation support operational stability.
Financial Health: With a current ratio of 8.39 and total cash of ₹1.49 billion against total debt of ₹610.8 million, the company demonstrates strong liquidity and a conservative debt profile, supporting financial resilience.
Sector Specific Factors: The Indian sugar industry faces regulatory challenges and commodity price volatility, but opportunities exist through sustainable agriculture and renewable energy initiatives. KCP Sugar's integration of cogeneration and alcohol production aligns with these sector trends.
India Specific Factors: Regulatory environment in India, including sugar pricing and export policies, alongside consumer trends favoring sustainable products, influence the company's market positioning. Economic outlook factors such as rural demand and agricultural policies are also relevant.
Overall Business and Market Assessment
Supporting Factors: Strong liquidity position with a current ratio of 8.39 and cash reserves exceeding debt levels.
Risk Factors: Declining revenue and earnings growth indicate near-term operational challenges.
SWOT Analysis
Strengths
- Strong liquidity with a current ratio of 8.39 and cash reserves exceeding debt.
- Diversified operations including sugar production, alcohol, and power generation.
- Promoter shareholding increased recently, indicating insider confidence.
- Low leverage with total debt to equity ratio of 0.13.
Weaknesses
- Negative quarterly revenue and earnings growth reflect operational challenges.
- High trailing P/E ratio of 66.83 suggests valuation may not align with earnings.
- Limited institutional investor presence could impact market support.
- Profit margin remains low at approximately 1.6%.
Opportunities
- Growing focus on sustainable agriculture and renewable energy in India.
- Potential to leverage by-products for enhanced operational efficiency.
- Alignment with national policies on renewable energy and rural development.
- Scope for market expansion through technological advancements.
Threats
- Volatility in sugar prices and regulatory changes in the Indian sugar sector.
- Competitive pressures from larger industry peers with greater scale.
- Economic fluctuations impacting rural demand and agricultural inputs.
- Exposure to commodity price risks affecting profitability.
Company Description
KCP Sugar & Industries Corporation Ltd. is a prominent player in the Indian sugar industry, engaged primarily in the production and distribution of sugar and its by-products. The company operates in the agricultural sector, particularly focusing on sugarcane cultivation and processing. Additionally, KCP Sugar & Industries Corporation Ltd. diversifies its operations through the production of alcohol and power generation, utilizing by-products like bagasse in cogeneration plants. This integration not only enhances resource efficiency but also reduces operational costs. As a vital component of the agro-industrial landscape in India, the company plays a significant role in contributing to the rural economy, impacting thousands of farmers by providing stable markets and employment opportunities. Furthermore, its commitment to sustainable practices and technological advancements enhances its market relevance, helping it remain competitive amidst fluctuating sugar prices and regulatory challenges. KCP Sugar & Industries Corporation Ltd. continues to contribute to the economy by aligning with national policies on renewable energy and sustainable agriculture.