

KCP Sugar & Industries Corporation Ltd (KCPSUGIND)
Stock Analysis Report
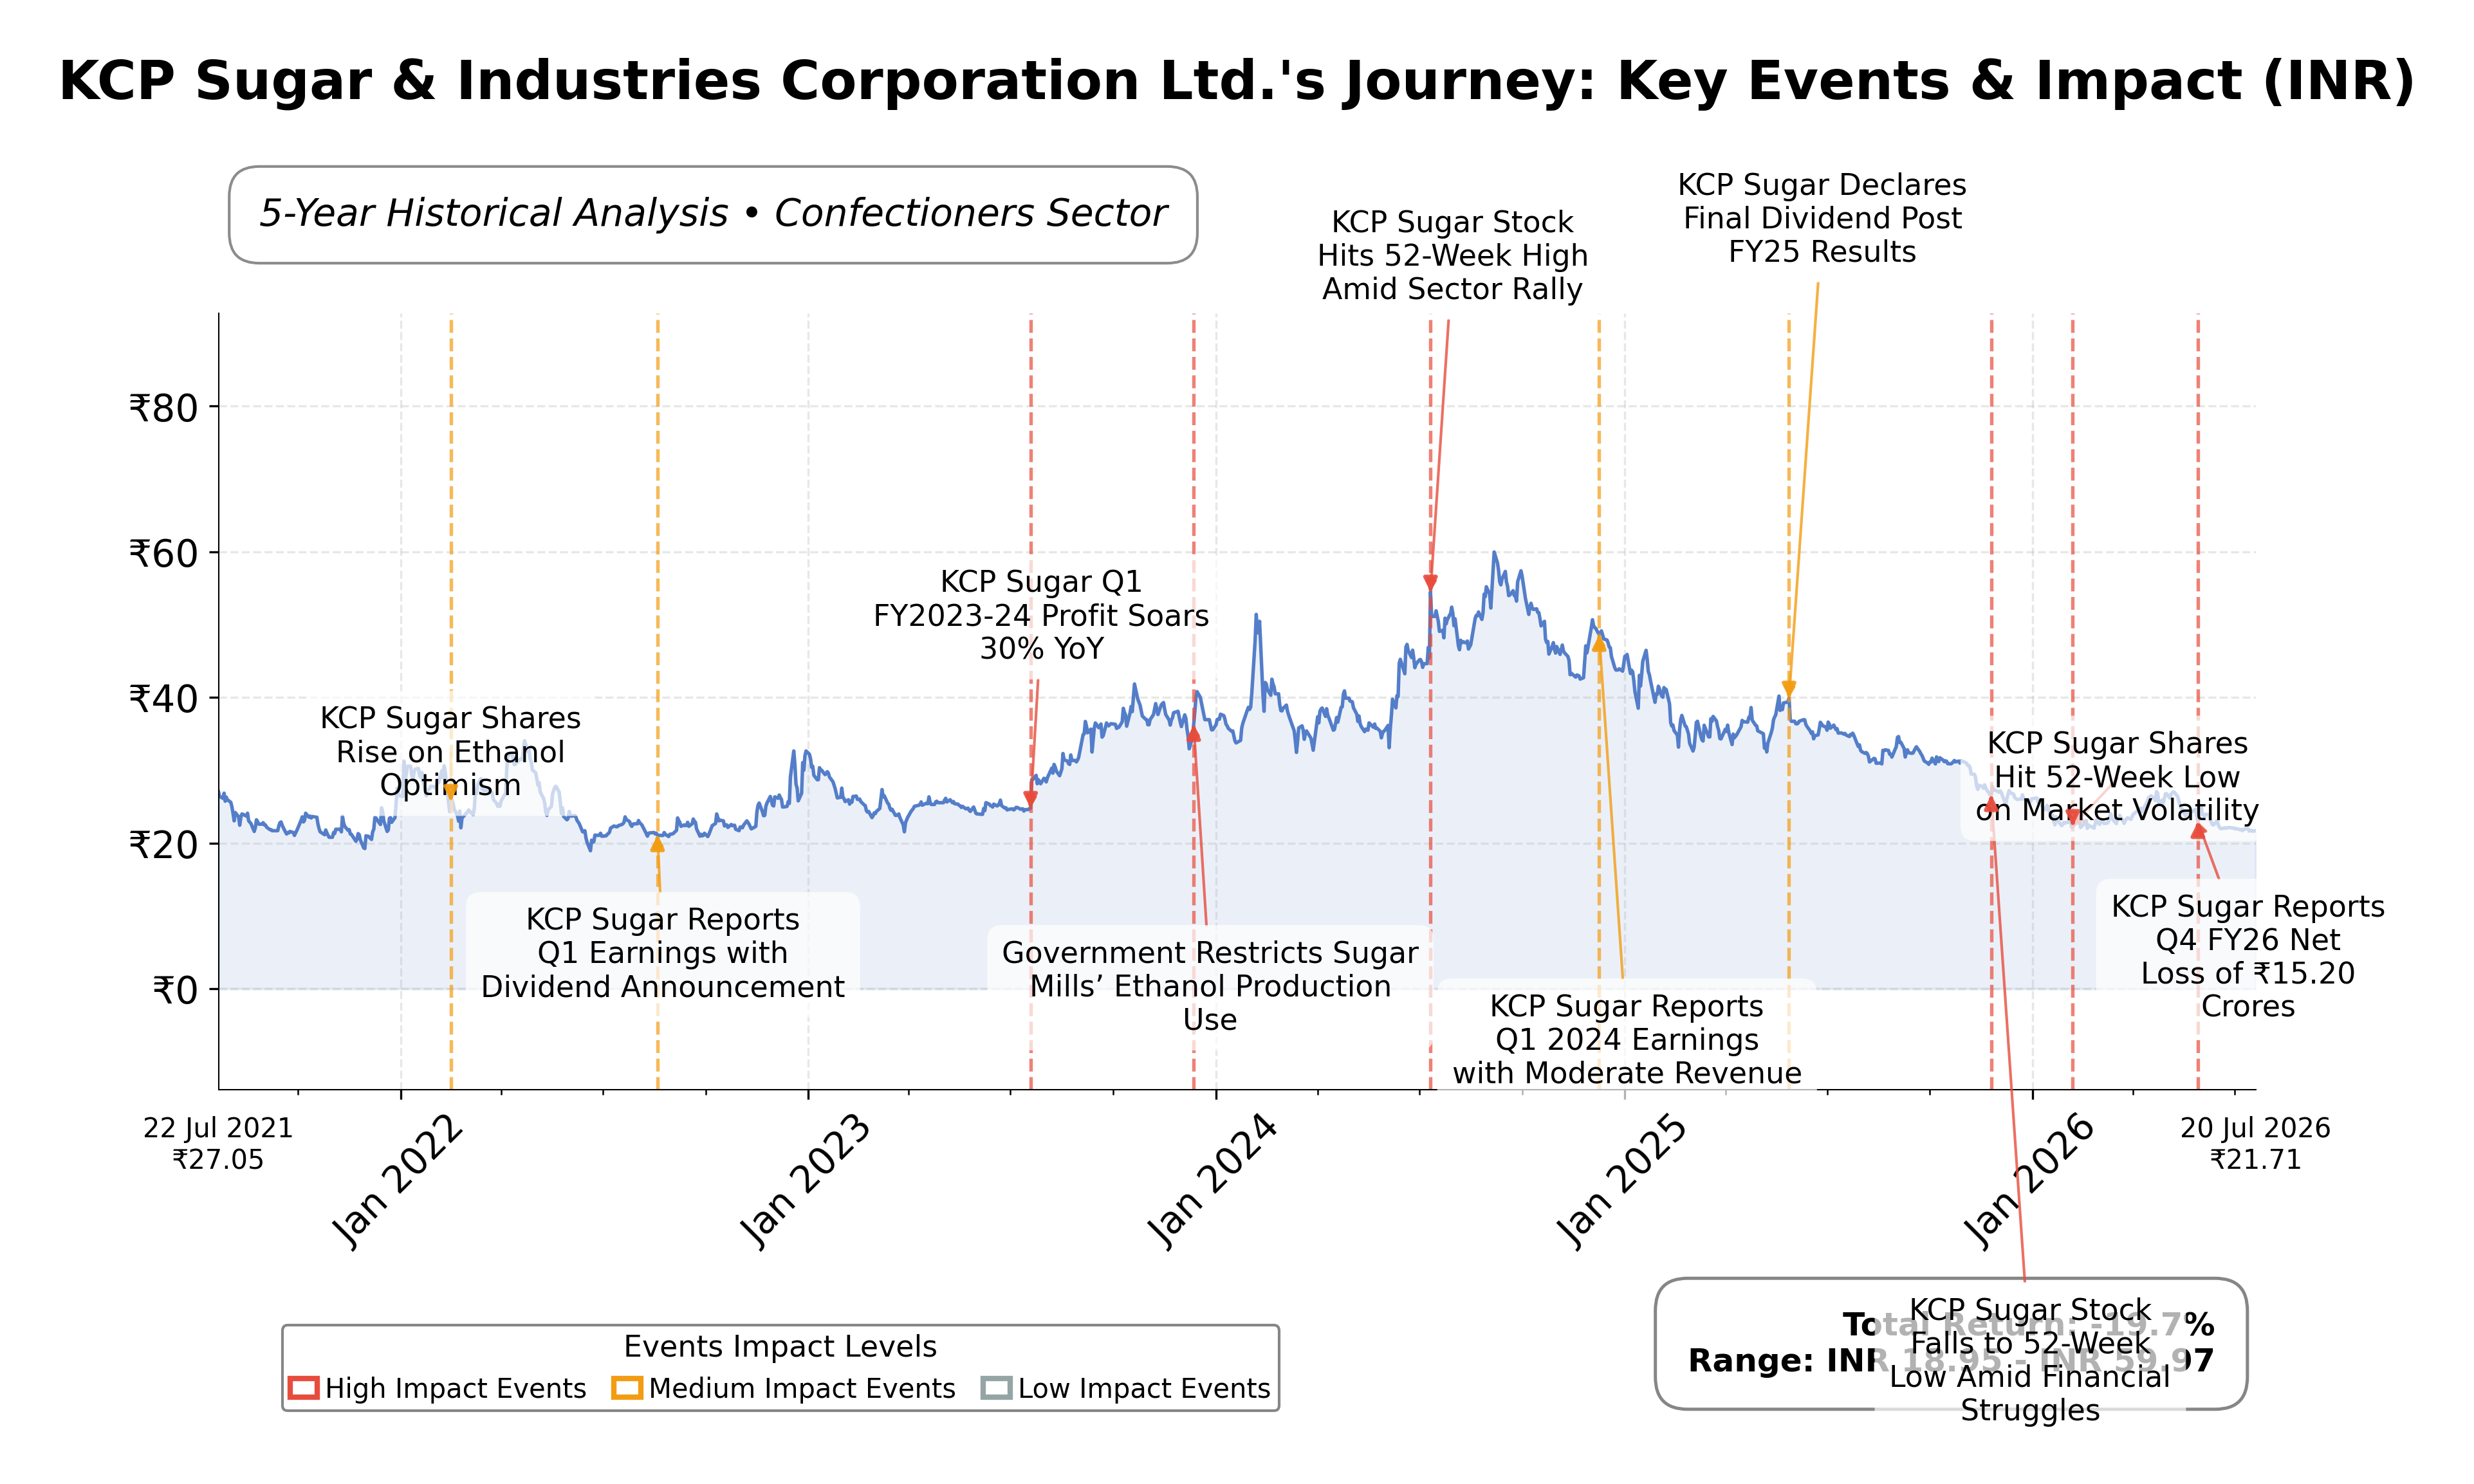
Stock Journey
Key Positives and Key Risks
Pros
- KCP Sugar & Industries Corporation Ltd. has a strong current ratio of 2.74, indicating solid liquidity to meet short-term obligations.
- The stock trades at a price-to-book ratio of 0.53, suggesting potential undervaluation relative to its net assets.
- The company maintains a low debt-to-equity ratio of 0.28, reflecting conservative leverage and manageable financial risk.
Cons
- Operating margin is negative at -10.42%, highlighting ongoing operational inefficiencies impacting profitability.
- Free cash flow is negative at approximately -₹315.6 million, indicating challenges in cash generation.
- Return on equity is low at 2.45%, suggesting limited returns to shareholders compared to industry peers.
Disclosure: This information is for general awareness and does not constitute investment advice
Report Summary
KCP Sugar & Industries Corporation Ltd. operates primarily in the Indian sugar industry, focusing on the production and distribution of sugar and related by-products. Listed on the NSE under the Consumer Defensive sector, the company also engages in alcohol production and power generation through cogeneration plants using bagasse. Its integrated operations support resource efficiency and cost reduction, positioning it as a significant player within the agricultural and agro-industrial landscape in India. The company’s diversified product portfolio and alignment with sustainable agricultural practices contribute to its market relevance amid regulatory and price volatility.
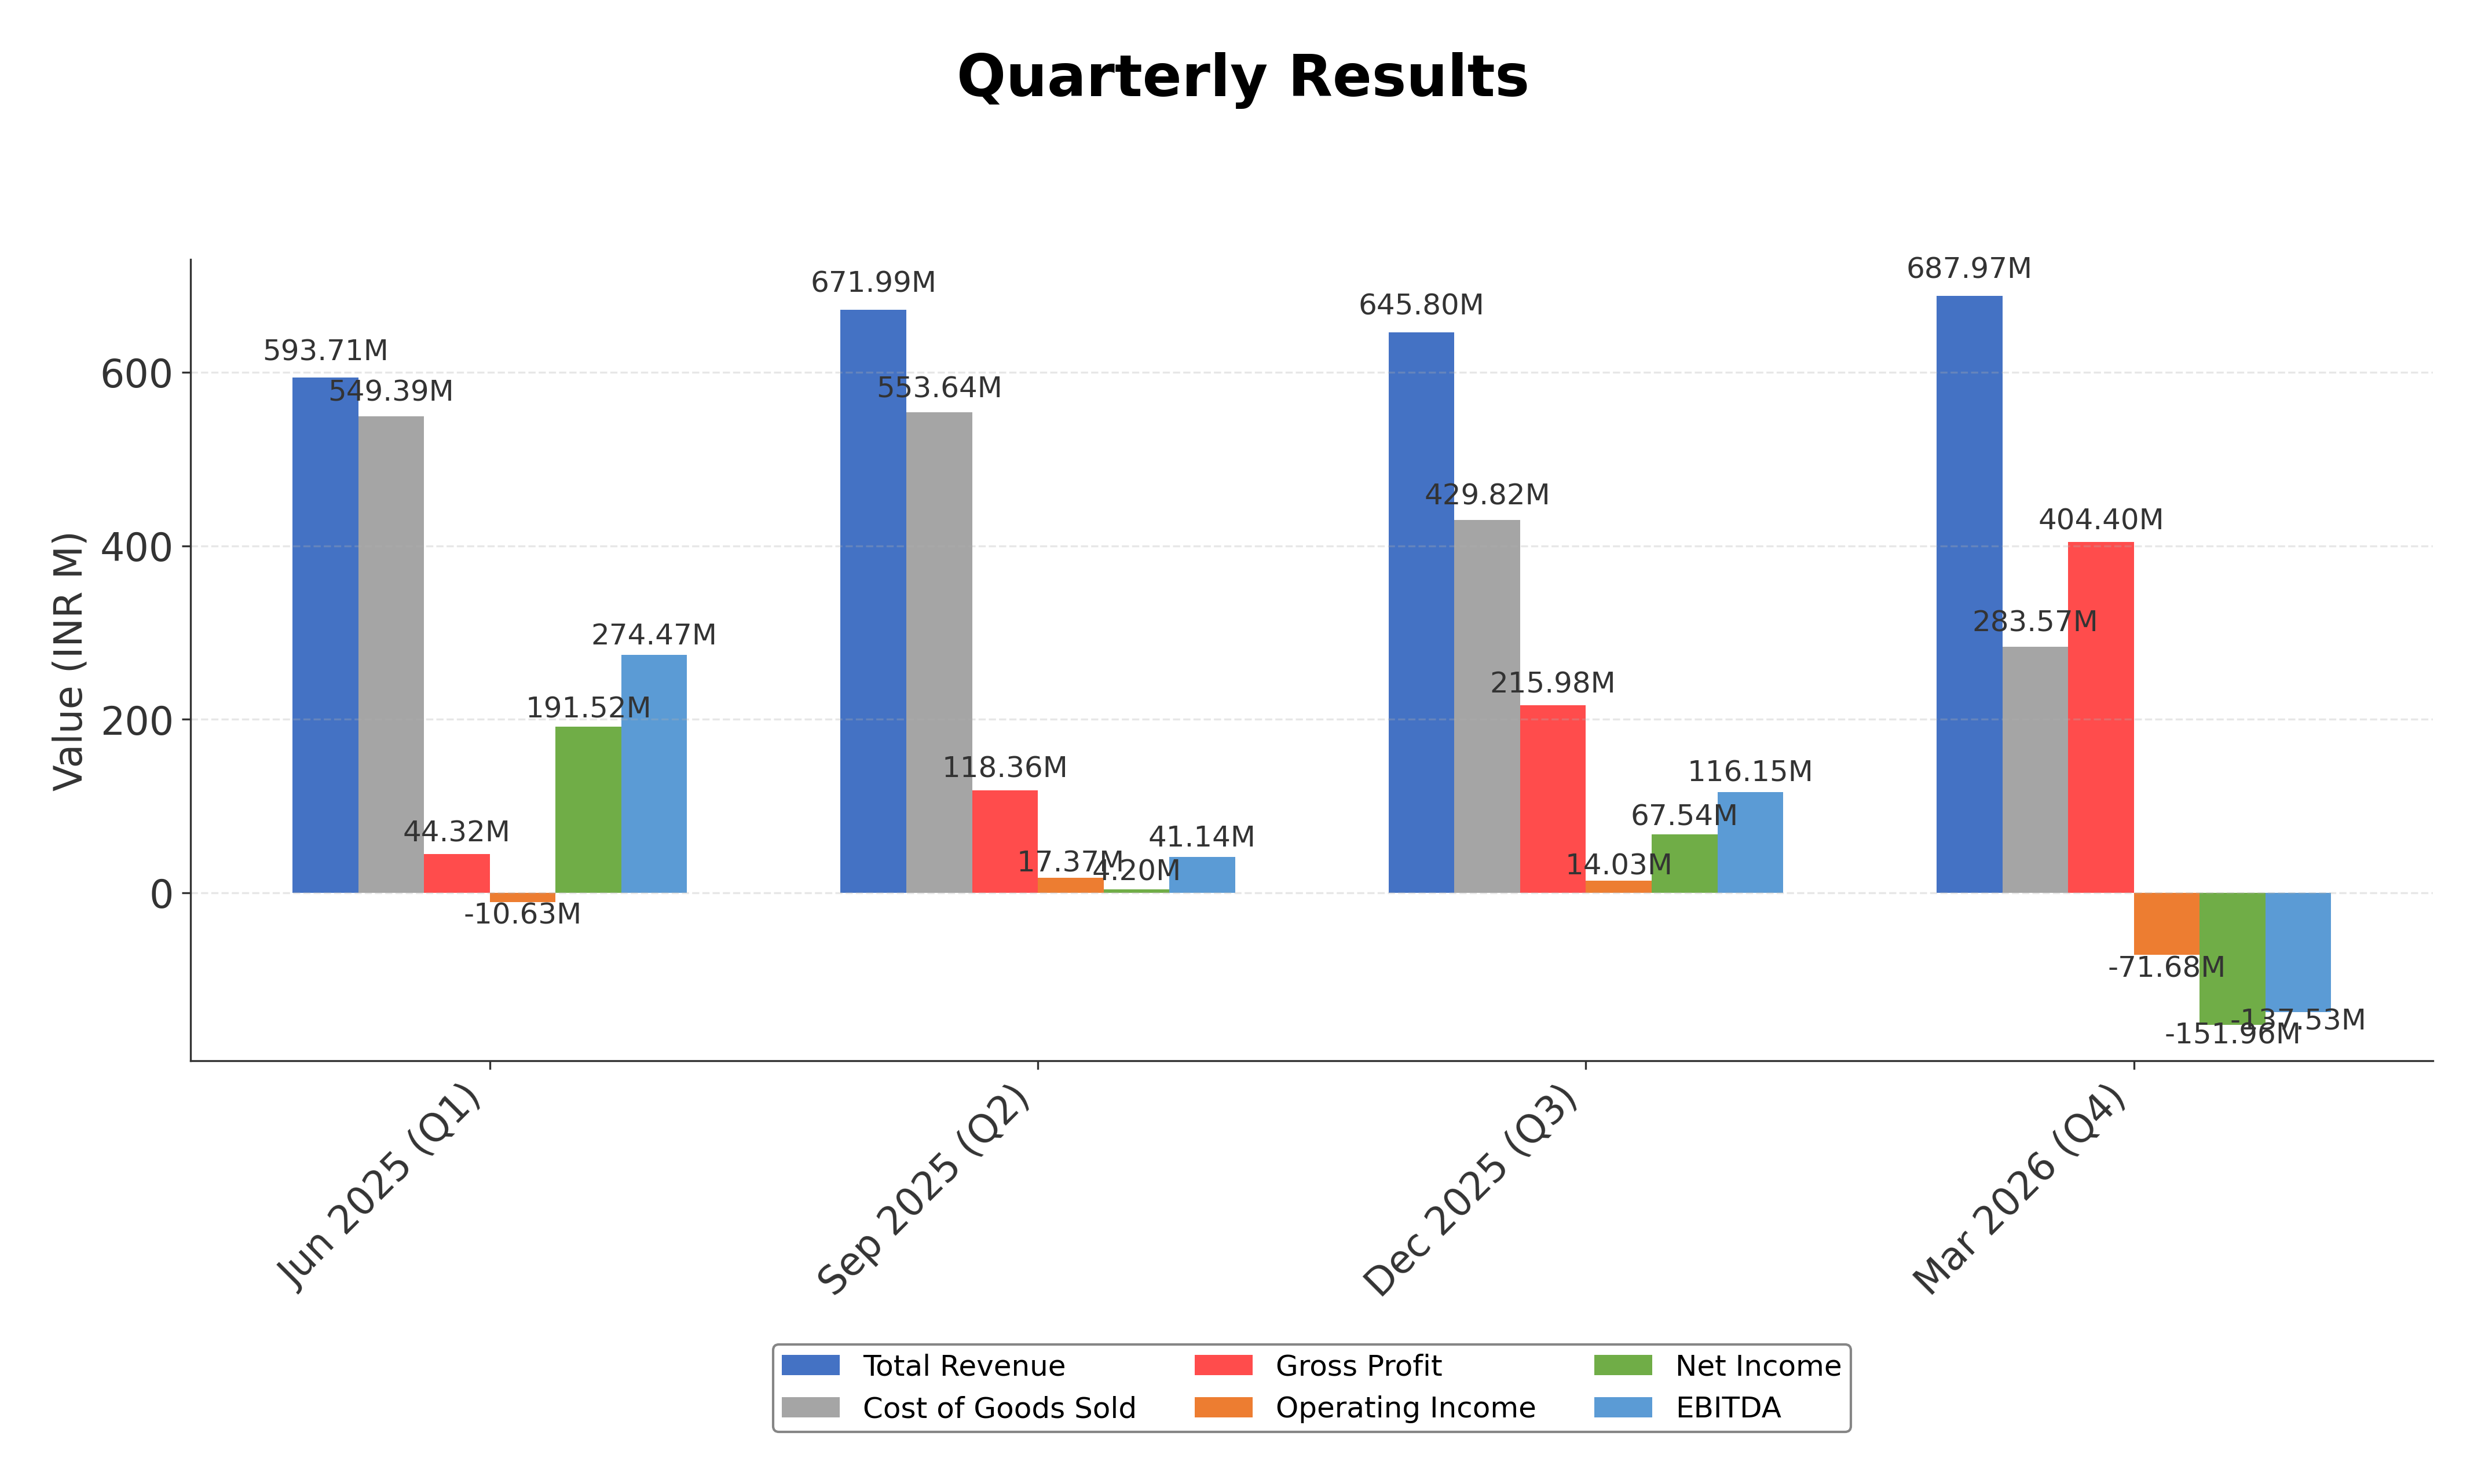
Financially, KCP Sugar & Industries reported trailing twelve months (TTM) revenue of approximately ₹2.6 billion with a gross margin of 58.78%, indicating strong production efficiency. However, operating margin stands negative at -10.42%, with a modest net profit margin of 4.28%, reflecting some operational challenges. Return on equity (ROE) is low at 2.45%, and return on assets (ROA) is slightly negative at -0.50%, suggesting limited profitability and asset utilization efficiency. The company’s operating cash flow and free cash flow are negative, indicating cash generation issues despite a healthy current ratio of 2.74.
Valuation metrics show a trailing price-to-earnings (P/E) ratio of 22.07, aligning closely with the industry average for confectioners. The price-to-book (P/B) ratio is 0.53, suggesting the stock trades below its book value, which may indicate undervaluation or market concerns. Enterprise value to EBITDA (EV/EBITDA) is notably high at 285.18, reflecting low EBITDA relative to enterprise value. The stock price currently stands at ₹25.42, within a 52-week range of ₹21.45 to ₹36.95, indicating a significant decline of over 37% from its high.
Key strengths include a strong cash position of approximately ₹1.27 billion, low debt-to-equity ratio at 0.28, and a current ratio of 2.74, indicating solid liquidity. The company benefits from integrated operations and a diversified product base. Risks involve negative operating margins, declining quarterly revenues and profits in recent quarters, and sectoral challenges such as fluctuating sugar prices and regulatory pressures. Recent strategic developments include an increase in institutional stake by Sethi Funds Management, which raised its holding to 0.96%, signaling potential confidence in the company’s prospects.
Technically, the stock trades above its 50-day moving average but below the 200-day moving average, with a low beta of 0.157 indicating limited volatility relative to the market. Momentum indicators show mixed signals with recent price declines but some recovery attempts. Overall, the data suggests a cautious stance with potential for accumulation if operational improvements materialize, balanced against ongoing profitability and cash flow concerns.
Company and Industry Overview
Company Basics
Price Performance
Company Size
Shareholding Pattern
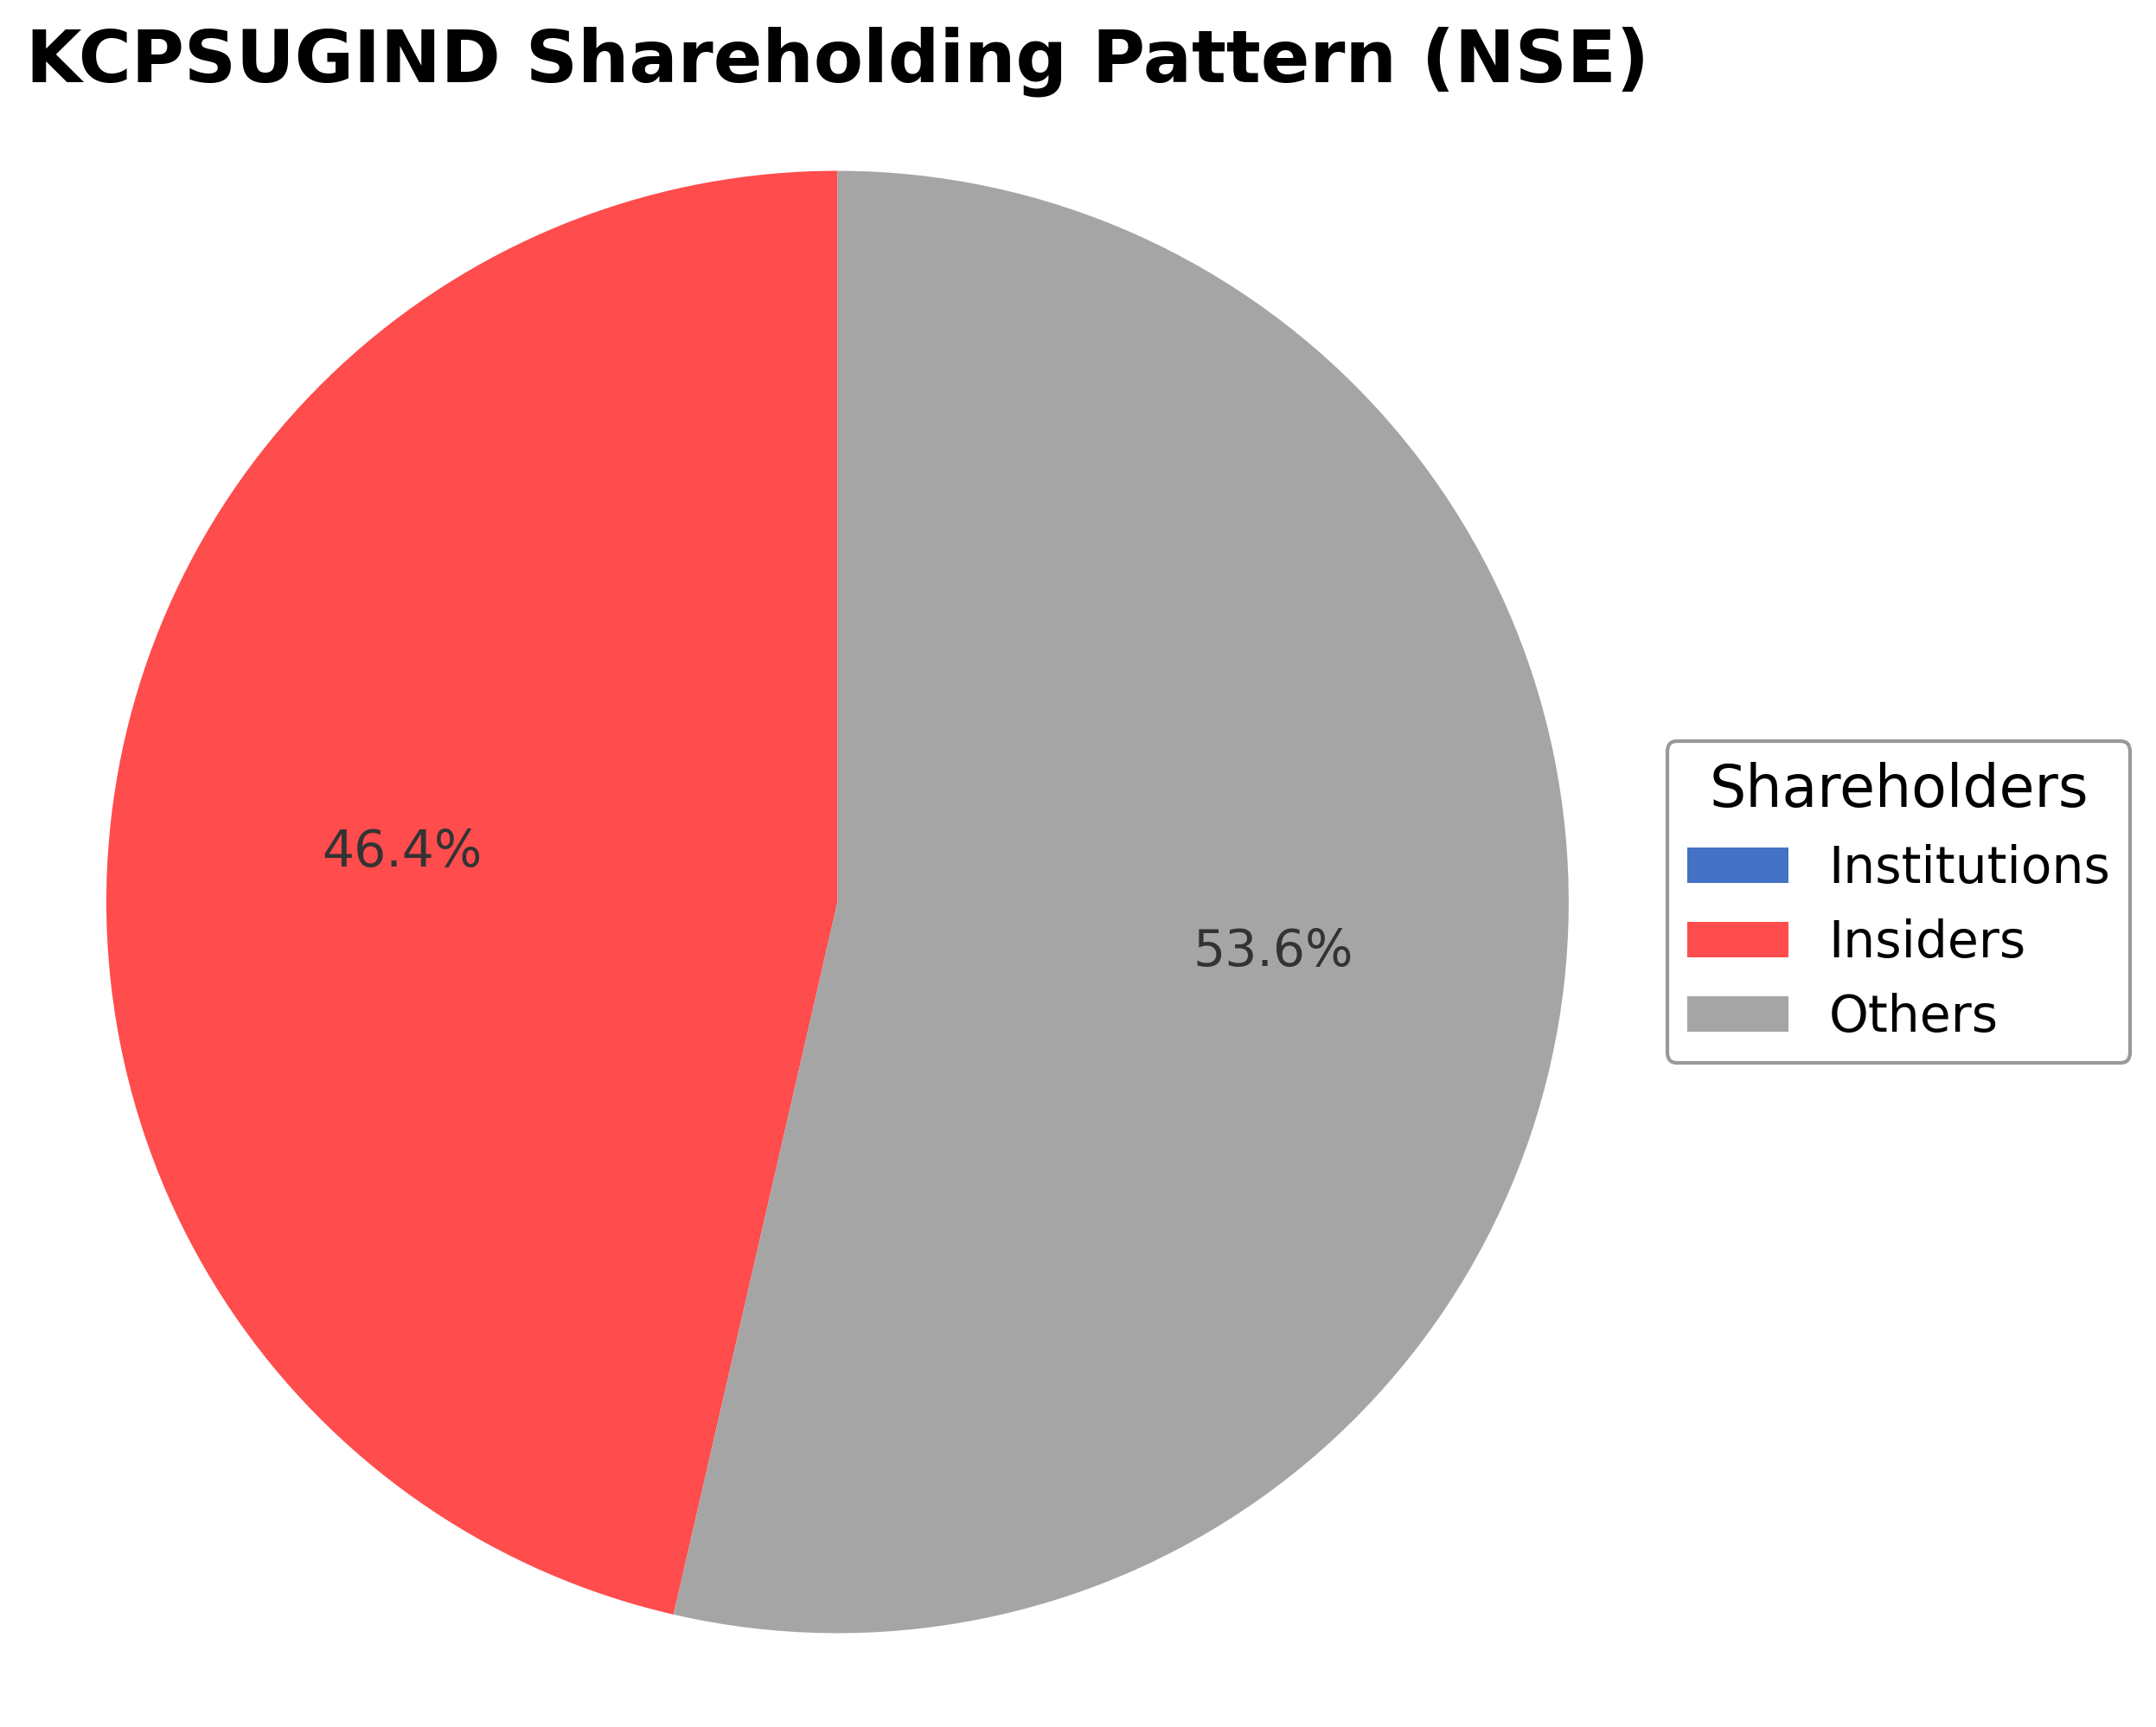
KCP Sugar & Industries Corporation Ltd. exhibits a shareholding structure dominated by insiders holding 46.40% of shares, including executives and board members. Institutional investors currently hold a modest 0.96%, reflecting recent accumulation by Sethi Funds Management, which increased its stake from 0.68% to 0.96% over June 2026. The public and other shareholders constitute approximately 52.64% of the equity. Over the past 12-24 months, institutional interest has been limited but shows signs of cautious accumulation. This ownership distribution suggests stable promoter control with emerging institutional participation, potentially influencing governance and strategic decisions. The company operates in the confectioners industry within the consumer defensive sector, facing typical sectoral challenges such as commodity price volatility and regulatory oversight.
Sector and Industry Analysis
The sugar and allied industries sector in India is a significant contributor to the agricultural economy, with the country being one of the largest producers and consumers of sugar globally. The sector has witnessed steady growth driven by rising domestic demand, export opportunities, and government support for sugarcane farmers. Key players include large integrated companies such as KCP Sugar & Industries Corporation Ltd., Bajaj Hindusthan Sugar Ltd., and Balrampur Chini Mills, which dominate production and distribution.
Industry trends show a shift towards diversification with companies expanding into ethanol production and power generation from bagasse to improve profitability and sustainability. Competitive dynamics are influenced by fluctuating sugar prices, monsoon-dependent raw material availability, and operational efficiencies. Barriers to entry remain high due to capital-intensive infrastructure, regulatory compliance, and the need for extensive supply chain networks.
The regulatory landscape is shaped by government policies on sugar pricing, export quotas, and ethanol blending mandates aimed at stabilizing the market and supporting farmers. Recent reforms encourage ethanol production to reduce import dependence on crude oil, benefiting sugar mills with additional revenue streams. Compliance with environmental regulations and subsidies for bioenergy projects also impact operational strategies and sector outlook.
Note: Analysis synthesized from industry research, market reports, and regulatory filings. Information is subject to change based on market conditions.
Financial Ratios Dashboard
Illustrative Scenario Analysis
DCF Assumptions:
Method: Two-Stage EPS-Priority Model
Financials
Peer Analysis
| Company Name | Market Cap | P/E Ratio | P/B Ratio | EV/EBITDA | Price to CFO |
|---|---|---|---|---|---|
| KCP Sugar & Industries Corporation Ltd. | ₹2.48B | 22.07 | 0.53 | 285.18 | -8.03 |
| Shree Renuka Sugars Ltd. | ₹47.61B | -6.01 | -1.79 | 50.7 | -39.09 |
| Triveni Engineering & Industries Ltd. | ₹104.04B | 38.61 | 3.11 | 22.81 | 55.37 |
| Balrampur Chini Mills Ltd. | ₹127.70B | 32.46 | 2.95 | 20.74 | 21.3 |
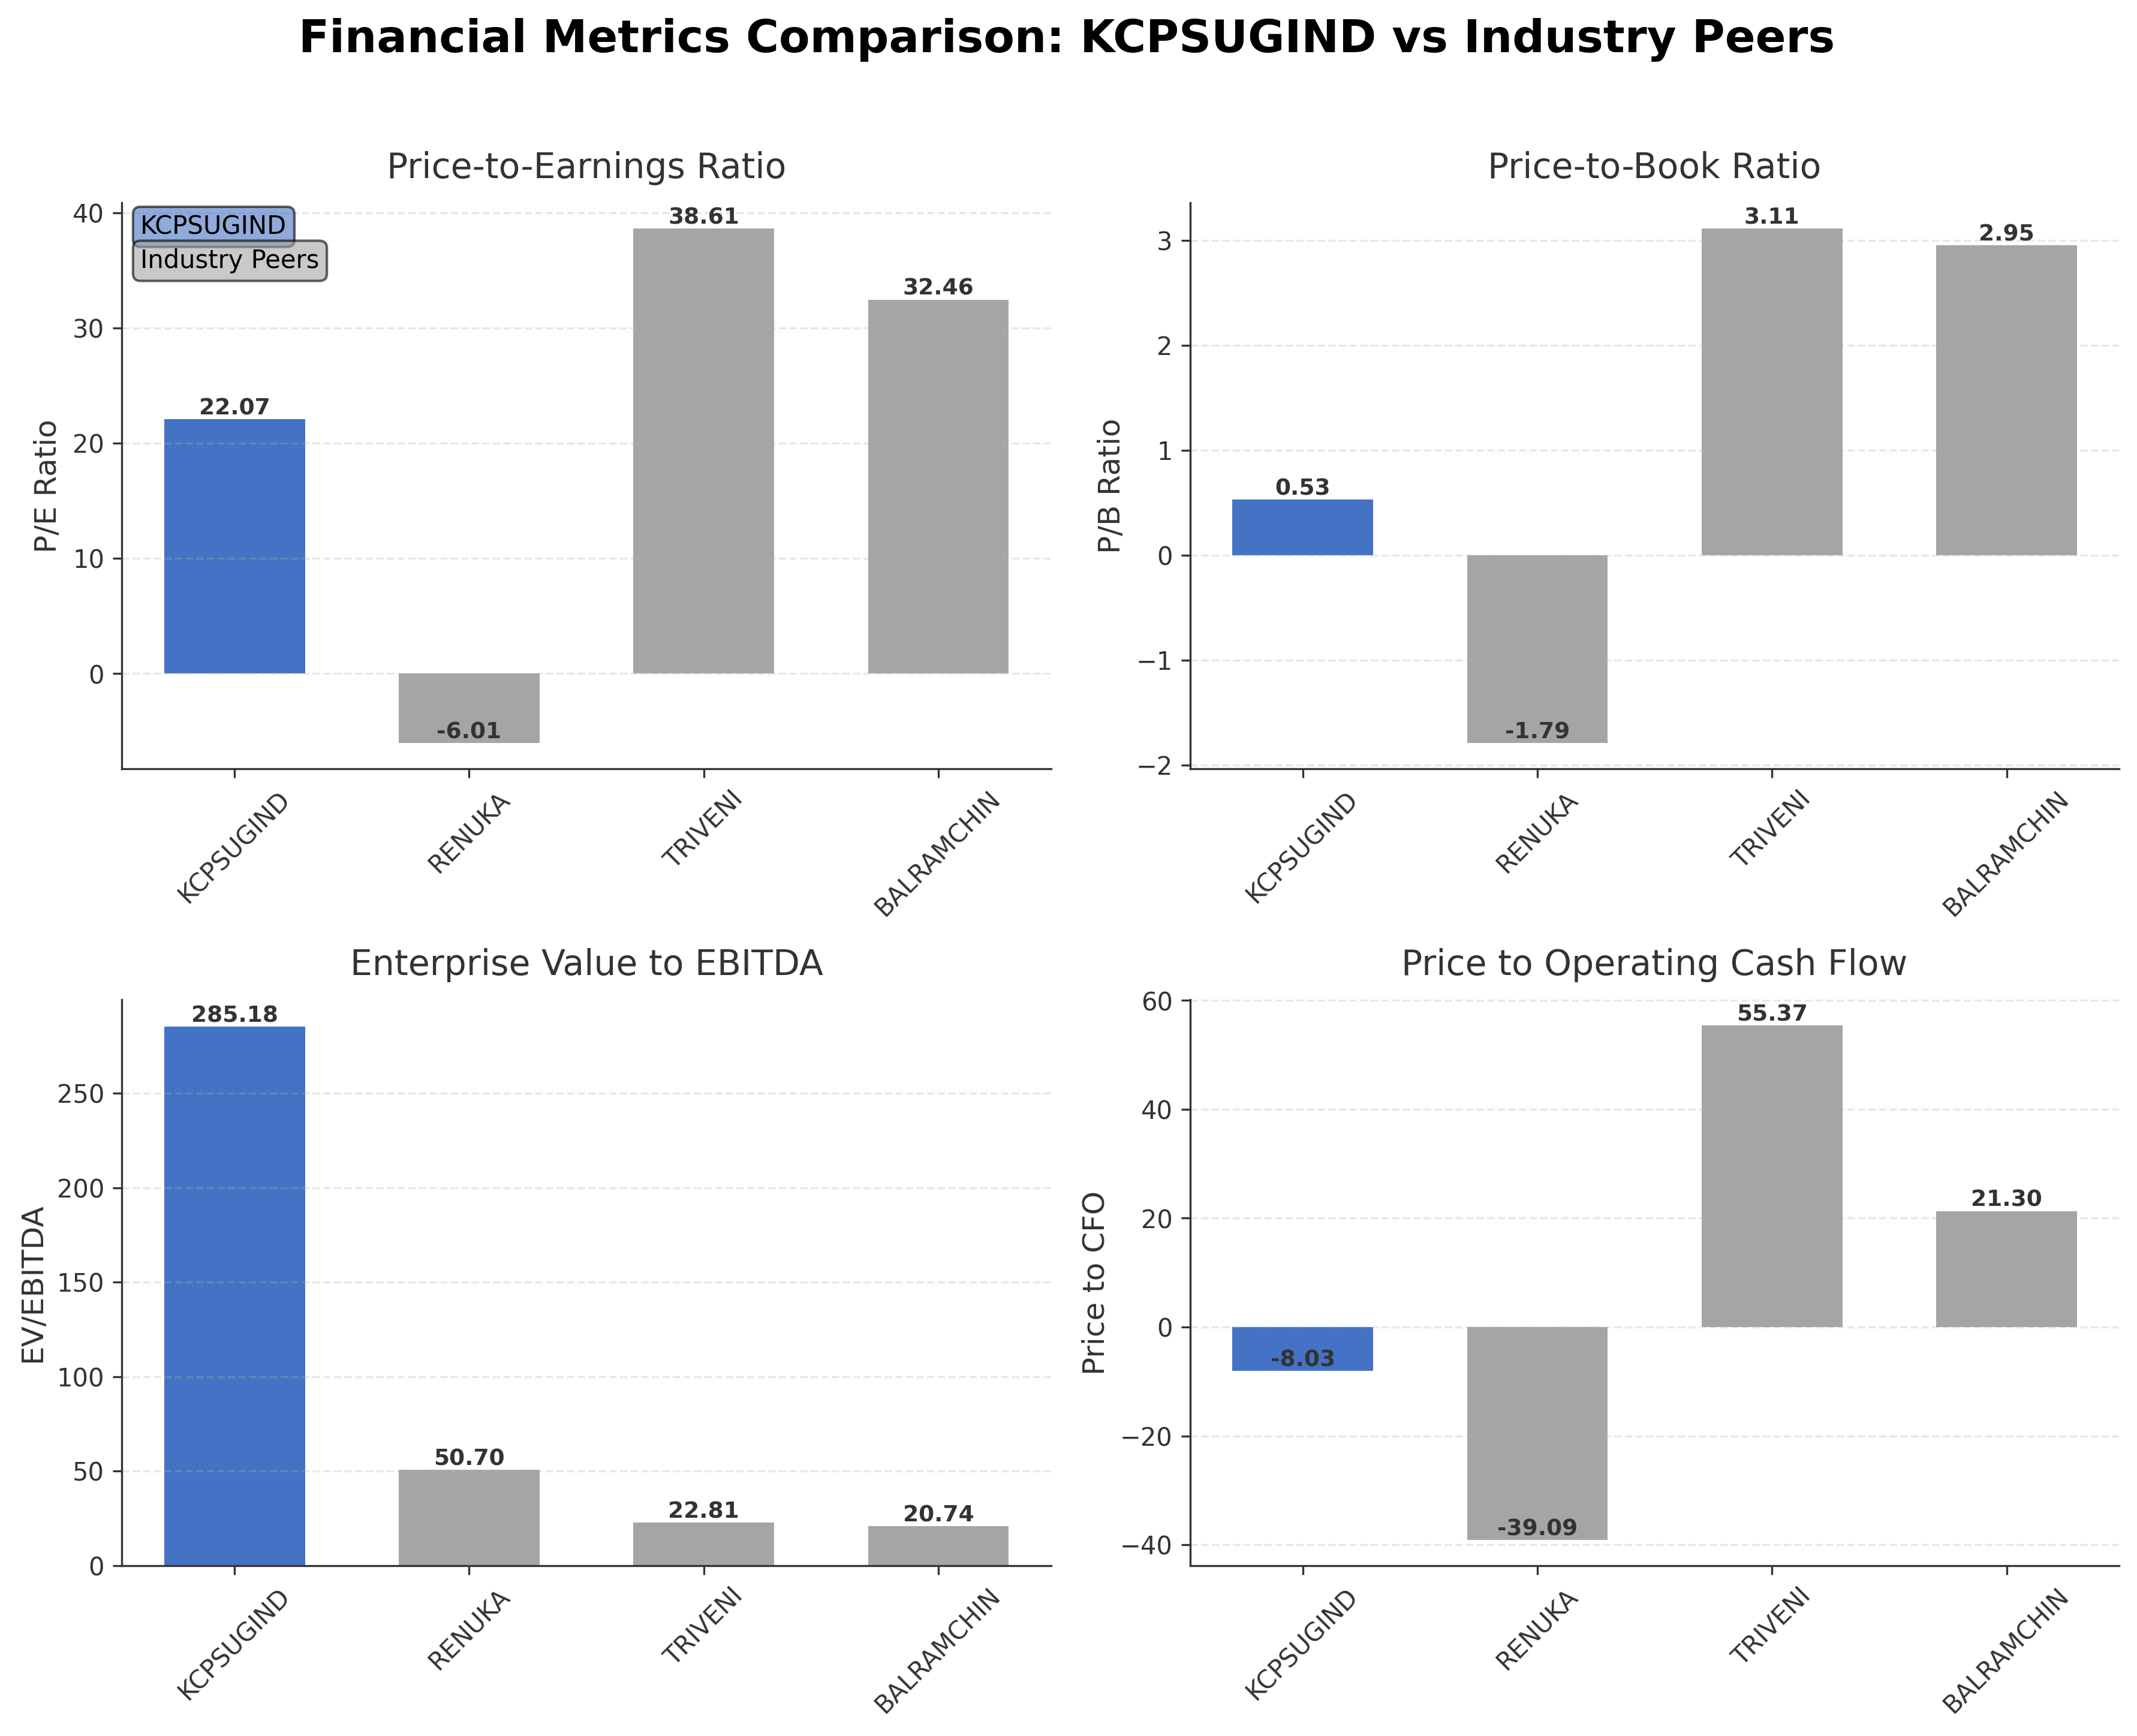
Comparison Analysis: KCP Sugar & Industries Corporation Ltd. is significantly smaller in market capitalization compared to its regional peers such as Balrampur Chini Mills and Triveni Engineering. Its trailing P/E ratio of 22.07 is moderate but lower than Triveni and Balrampur Chini, indicating relatively lower market expectations or valuation. The company’s P/B ratio at 0.53 is substantially below peers, suggesting undervaluation or asset-heavy balance sheet concerns. The EV/EBITDA ratio is markedly higher at 285.18, reflecting very low EBITDA relative to enterprise value, which contrasts with more efficient peers. Return on equity is also the lowest among the group at 2.45%, indicating weaker profitability. Price to CFO is negative, highlighting cash flow challenges compared to positive values for most peers.
Financial Metrics Comparison with Peers
Financial Statements
Comprehensive financial data including income, balance sheet, and cash flow metrics
Income Statement
| fiscal_date | 2026-03-31 | 2025-03-31 | 2024-03-31 | 2023-03-31 | 2022-03-31 |
|---|---|---|---|---|---|
| Sales | 2.60B | 3.10B | 34.15B | 2.89B | 3.19B |
| Cost Of Goods | 1.82B | 2.19B | 2.52B | 2.02B | 2.27B |
| Gross Profit | 783.05M | 911.10M | 31.63B | 867.05M | 920.21M |
| Operating Expense Other Operating Expenses | 436.41M | 265.66M | 220.79M | 266.66M | 219.73M |
| Operating Income | -50.90M | 84.74M | 30.87B | 28.62M | 168.59M |
| Non Operating Interest Expense | 77.46M | 79.88M | 100.70M | 134.85M | 196.95M |
| Pretax Income | 157.25M | 280.23M | 788.62M | 702.09M | 51.54M |
| Income Tax | 45.94M | 136.35M | 127.03M | 120.35M | 15.76M |
| Net Income | 111.31M | 143.87M | 661.60M | 581.74M | 35.77M |
| Ebit | 234.71M | 360.11M | 889.33M | 836.94M | 248.49M |
| Ebitda | 294.24M | 269.23M | 335.31M | 151.42M | 282.65M |
| Net Income Continuous Operations | 157.25M | 280.23M | 788.62M | 702.06M | 51.54M |
| Preferred Stock Dividends | 0.00 | 0.00 | 0.00 | 0.00 | 0.00 |
| Operating Expense Research And Development | N/A | 737.00K | 1.08M | 267.00K | 244.00K |
| Non Operating Interest Income | N/A | 46.40M | 58.27M | 23.69M | 12.62M |
| Eps Basic | N/A | 1.27 | 5.83 | 5.13 | 0.32 |
| Eps Diluted | N/A | 1.27 | 5.83 | 5.13 | 0.32 |
| Basic Shares Outstanding | N/A | 113.29M | 113.48M | 113.40M | 111.79M |
| Diluted Shares Outstanding | N/A | 113.29M | 113.48M | 113.40M | 111.79M |
| Operating Expense Selling General And Administrative | N/A | N/A | 66.14M | 64.80M | 81.98M |
Data provided by Twelve Data
Balance Sheet
| fiscal_date | 2026-03-31 | 2025-03-31 | 2024-03-31 | 2023-03-31 | 2022-03-31 |
|---|---|---|---|---|---|
| Cash And Cash Equivalents | 148.49M | 201.41M | 229.54M | 379.47M | 178.40M |
| Accounts Receivable | 574.00M | 486.24M | 292.03M | 221.13M | 293.09M |
| Total Assets | 6.60B | 6.19B | 6.66B | 6.28B | 5.78B |
| Total Liabilities | 2.00B | 1.68B | 2.27B | 2.55B | 2.62B |
| Long Term Debt | 355.52M | 333.26M | 328.89M | 427.39M | 721.87M |
| Shareholders Equity | 4.60B | 4.50B | 4.39B | 3.73B | 3.15B |
Data provided by Twelve Data
Cash Flow Statement
| fiscal_date | 2026-03-31 | 2025-03-31 | 2024-03-31 | 2023-03-31 | 2022-03-31 |
|---|---|---|---|---|---|
| Operating Activities Net Income | 157.25M | 280.23M | 788.62M | 702.06M | 51.54M |
| Operating Activities Other Non Cash Items | -72.64M | -35.12M | 76.45M | 99.36M | 228.12M |
| Operating Activities Accounts Receivable | -89.69M | -198.02M | -70.90M | 63.10M | 169.90M |
| Operating Activities Other Assets Liabilities | -326.29M | 509.98M | 167.88M | -3.71M | 633.24M |
| Operating Activities Operating Cash Flow | -331.37M | 557.07M | 962.06M | 860.82M | 1.08B |
| Investing Activities Capital Expenditures | -52.05M | 26.79M | 31.76M | 121.95M | -39.76M |
| Investing Activities Purchase Of Investments | -16.46M | -111.64M | -100.84M | -326.49M | 0.00 |
| Investing Activities Sale Of Investments | 17.62M | 26.25M | 26.42M | 432.88M | 959.00K |
| Investing Activities Other Investing Activity | 32.97M | 1.00K | -127.11M | -13.83M | 9.64M |
| Investing Activities Investing Cash Flow | -17.91M | -58.59M | -169.76M | 214.51M | -29.16M |
| Financing Activities Common Dividends | -11.34M | -22.68M | -22.68M | -11.34M | -11.34M |
| Financing Activities Financing Cash Flow | -11.34M | -22.68M | -22.68M | -61.00M | -819.22M |
| End Cash Position | 148.49M | 201.41M | 229.54M | 379.47M | 178.40M |
| Free Cash Flow | -502.69M | 424.18M | 356.28M | -17.81M | 1.10B |
| Financing Activities Long Term Debt Payments | N/A | N/A | N/A | -49.66M | -807.88M |
| Financing Activities Other Financing Charges | N/A | N/A | N/A | 1.00K | 1.00K |
| Investing Activities Net Acquisitions | N/A | N/A | N/A | N/A | 0.00 |
| Financing Activities Long Term Debt Issuance | N/A | N/A | N/A | N/A | 0.00 |
Data provided by Twelve Data
Technical Analysis
Key Insights
- KCP Sugar & Industries Corporation Ltd. shows a mixed trend with recent price recovery after a significant decline, currently trading around ₹25.42.
- Key support levels are near ₹21.45, the 52-week low, while resistance is observed near ₹36.95, the 52-week high.
- The stock price is above the 50-day moving average (~₹23.09) but below the 200-day moving average (~₹25.08), indicating short-term strength but longer-term caution.
- Momentum indicators such as RSI and MACD suggest moderate momentum with no extreme overbought or oversold conditions.
- Analysis across daily and weekly timeframes indicates consolidation after a downtrend, with monthly trends showing overall weakness.
- Potential scenarios include a rebound if the stock sustains above the 50-day MA or further correction if it fails to breach the 200-day MA resistance.
Trending News
1. Headline: Stocks surge at PSX, KSE-100 gains over 2,000 points on Middle East mediation news - Markets - Business Recorder
Summary: Subscribing is the best way to get our best stories immediately · The Pakistan Stock Exchange surged nearly 2,000 points on Tuesday, driven by strong buying momentum amid reports of US-Iran mediation efforts easing geopolitical tensions and lowering oil prices
Sentiment: positive
2. Headline: South Korea Financial Markets | Associated Press | kdhnews.com
Summary: Currency traders work near a screen showing the Korea Composite Stock Price Index (KOSPI), SK Hynix and Samsung Electronics Co. stock price at the foreign exchange dealing room of the
Sentiment: neutral
3. Headline: Why these 10 stocks will be in focus on Tuesday - The HinduBusinessLine
Summary: TAFE, CDSL, SPML Infra, Emcure Pharma, Redington, Wanbury, RITES, KCP Sugar, Mafatlal and Monarch Surveyors will be in focus today
Sentiment: neutral
Summary: Major stock indexes finished lower to begin a busy week of earnings, while oil prices rose after President Donald Trump said Iran “will pay” for the deaths of American soldiers.
Sentiment: negative
5. Headline: South Korean Stocks Face Another Bloodbath: Kospi Tumbles 4%, Samsung and SK Hynix Slump Over 3%
Summary: The KOSPI Index plummeted more than 4%, while Samsung Electronics and SK Hynix both fell over 3%, once again breaking below key levels.
Sentiment: negative
Powered by Brave
Recent Updates
News Summary
As of July 21, 2026. Sethi Funds Management Private Limited increased its stake in KCP Sugar & Industries Corporation Ltd. to 0.96% through open market purchases in late June 2026, signaling growing institutional interest. The company reported a significant quarterly loss of ₹15.2 crore for the quarter ended March 2026, a sharp reversal from the previous quarter's profit of ₹6.75 crore, accompanied by an 18.1% decline in revenue. Despite this, the stock price surged by 17.54% on July 21, 2026, reflecting positive market sentiment possibly influenced by institutional buying. The company also closed its trading window ahead of the Q1 FY27 results, adhering to SEBI regulations. Overall, these developments highlight a mixed operational performance with emerging investor interest.
News Sentiment
The overall sentiment from recent updates is mixed to neutral. Institutional accumulation by Sethi Funds Management indicates some confidence in the company’s prospects. However, the sharp quarterly loss and revenue decline weigh on operational performance. The positive stock price movement suggests market optimism possibly driven by the increased institutional stake. Regulatory compliance actions such as trading window closure reflect standard governance practices. The balance of these factors results in a cautiously neutral tone regarding near-term outlook.
Source List
- https://scanx.trade/stock-market-news/companies/sethi-funds-management-acquires-0-17-stake-in-kcp-sugar/44285061
- https://blinkx.in/insights/results/kcp-sugar-industries-corporation-ltd-quarterly-result
- https://economictimes.indiatimes.com/kcp-sugar-industries-corporation-ltd/stocksupdate/companyid-4815.cms
Analytical Overview
Analysis Summary
KCP Sugar & Industries Corporation Ltd’s trailing P/E ratio of 22.07 aligns closely with the confectioners industry average, indicating valuation in line with sector norms. However, the absence of a forward P/E and a high EV/EBITDA ratio of 285.18 suggest caution regarding future earnings and operational efficiency. Revenue growth is modest at 4.4% quarterly, but recent quarterly results show declines in revenue and profitability, signaling volatility in growth trajectory. Negative operating and free cash flows highlight financial health concerns, despite a strong current ratio of 2.74 and low debt-to-equity ratio of 0.28, which provide liquidity comfort. Sector-specific challenges include fluctuating sugar prices and regulatory pressures in India, while opportunities exist in diversification into alcohol and power generation.
Overall Business and Market Assessment
Supporting Factors: the company’s strong liquidity position, low leverage, and diversified operations that enhance resilience
Risk Factors: No data
SWOT Analysis
Strengths
- KCP Sugar & Industries Corporation Ltd. has a diversified product portfolio including sugar, alcohol, and power generation.
- The company maintains strong liquidity with a current ratio of 2.74 and low debt-to-equity ratio of 0.28.
- Gross margin is robust at 58.78%, indicating efficient production processes.
- Established presence in the Indian agro-industrial sector with integrated operations.
Weaknesses
- Operating margin is negative at -10.42%, reflecting operational inefficiencies.
- Negative operating and free cash flows indicate cash generation challenges.
- Return on equity is low at 2.45%, suggesting limited shareholder profitability.
- Recent quarterly results show declining revenue and net losses.
Opportunities
- Expansion in alcohol and power generation segments leveraging by-products.
- Increasing institutional investor interest may support governance and capital allocation.
- Alignment with national policies on renewable energy and sustainable agriculture.
- Potential market recovery could improve financial performance.
Threats
- Volatility in sugar prices poses revenue and margin risks.
- Regulatory changes in the sugar and alcohol sectors could impact operations.
- Competitive pressures from larger regional players with stronger profitability.
- Macroeconomic factors affecting agricultural inputs and demand.
Company Description
KCP Sugar & Industries Corporation Ltd. is a prominent player in the Indian sugar industry, engaged primarily in the production and distribution of sugar and its by-products. The company operates in the agricultural sector, particularly focusing on sugarcane cultivation and processing. Additionally, KCP Sugar & Industries Corporation Ltd. diversifies its operations through the production of alcohol and power generation, utilizing by-products like bagasse in cogeneration plants. This integration not only enhances resource efficiency but also reduces operational costs. As a vital component of the agro-industrial landscape in India, the company plays a significant role in contributing to the rural economy, impacting thousands of farmers by providing stable markets and employment opportunities. Furthermore, its commitment to sustainable practices and technological advancements enhances its market relevance, helping it remain competitive amidst fluctuating sugar prices and regulatory challenges. KCP Sugar & Industries Corporation Ltd. continues to contribute to the economy by aligning with national policies on renewable energy and sustainable agriculture.