
KCP Ltd (KCP)
Stock Analysis Report
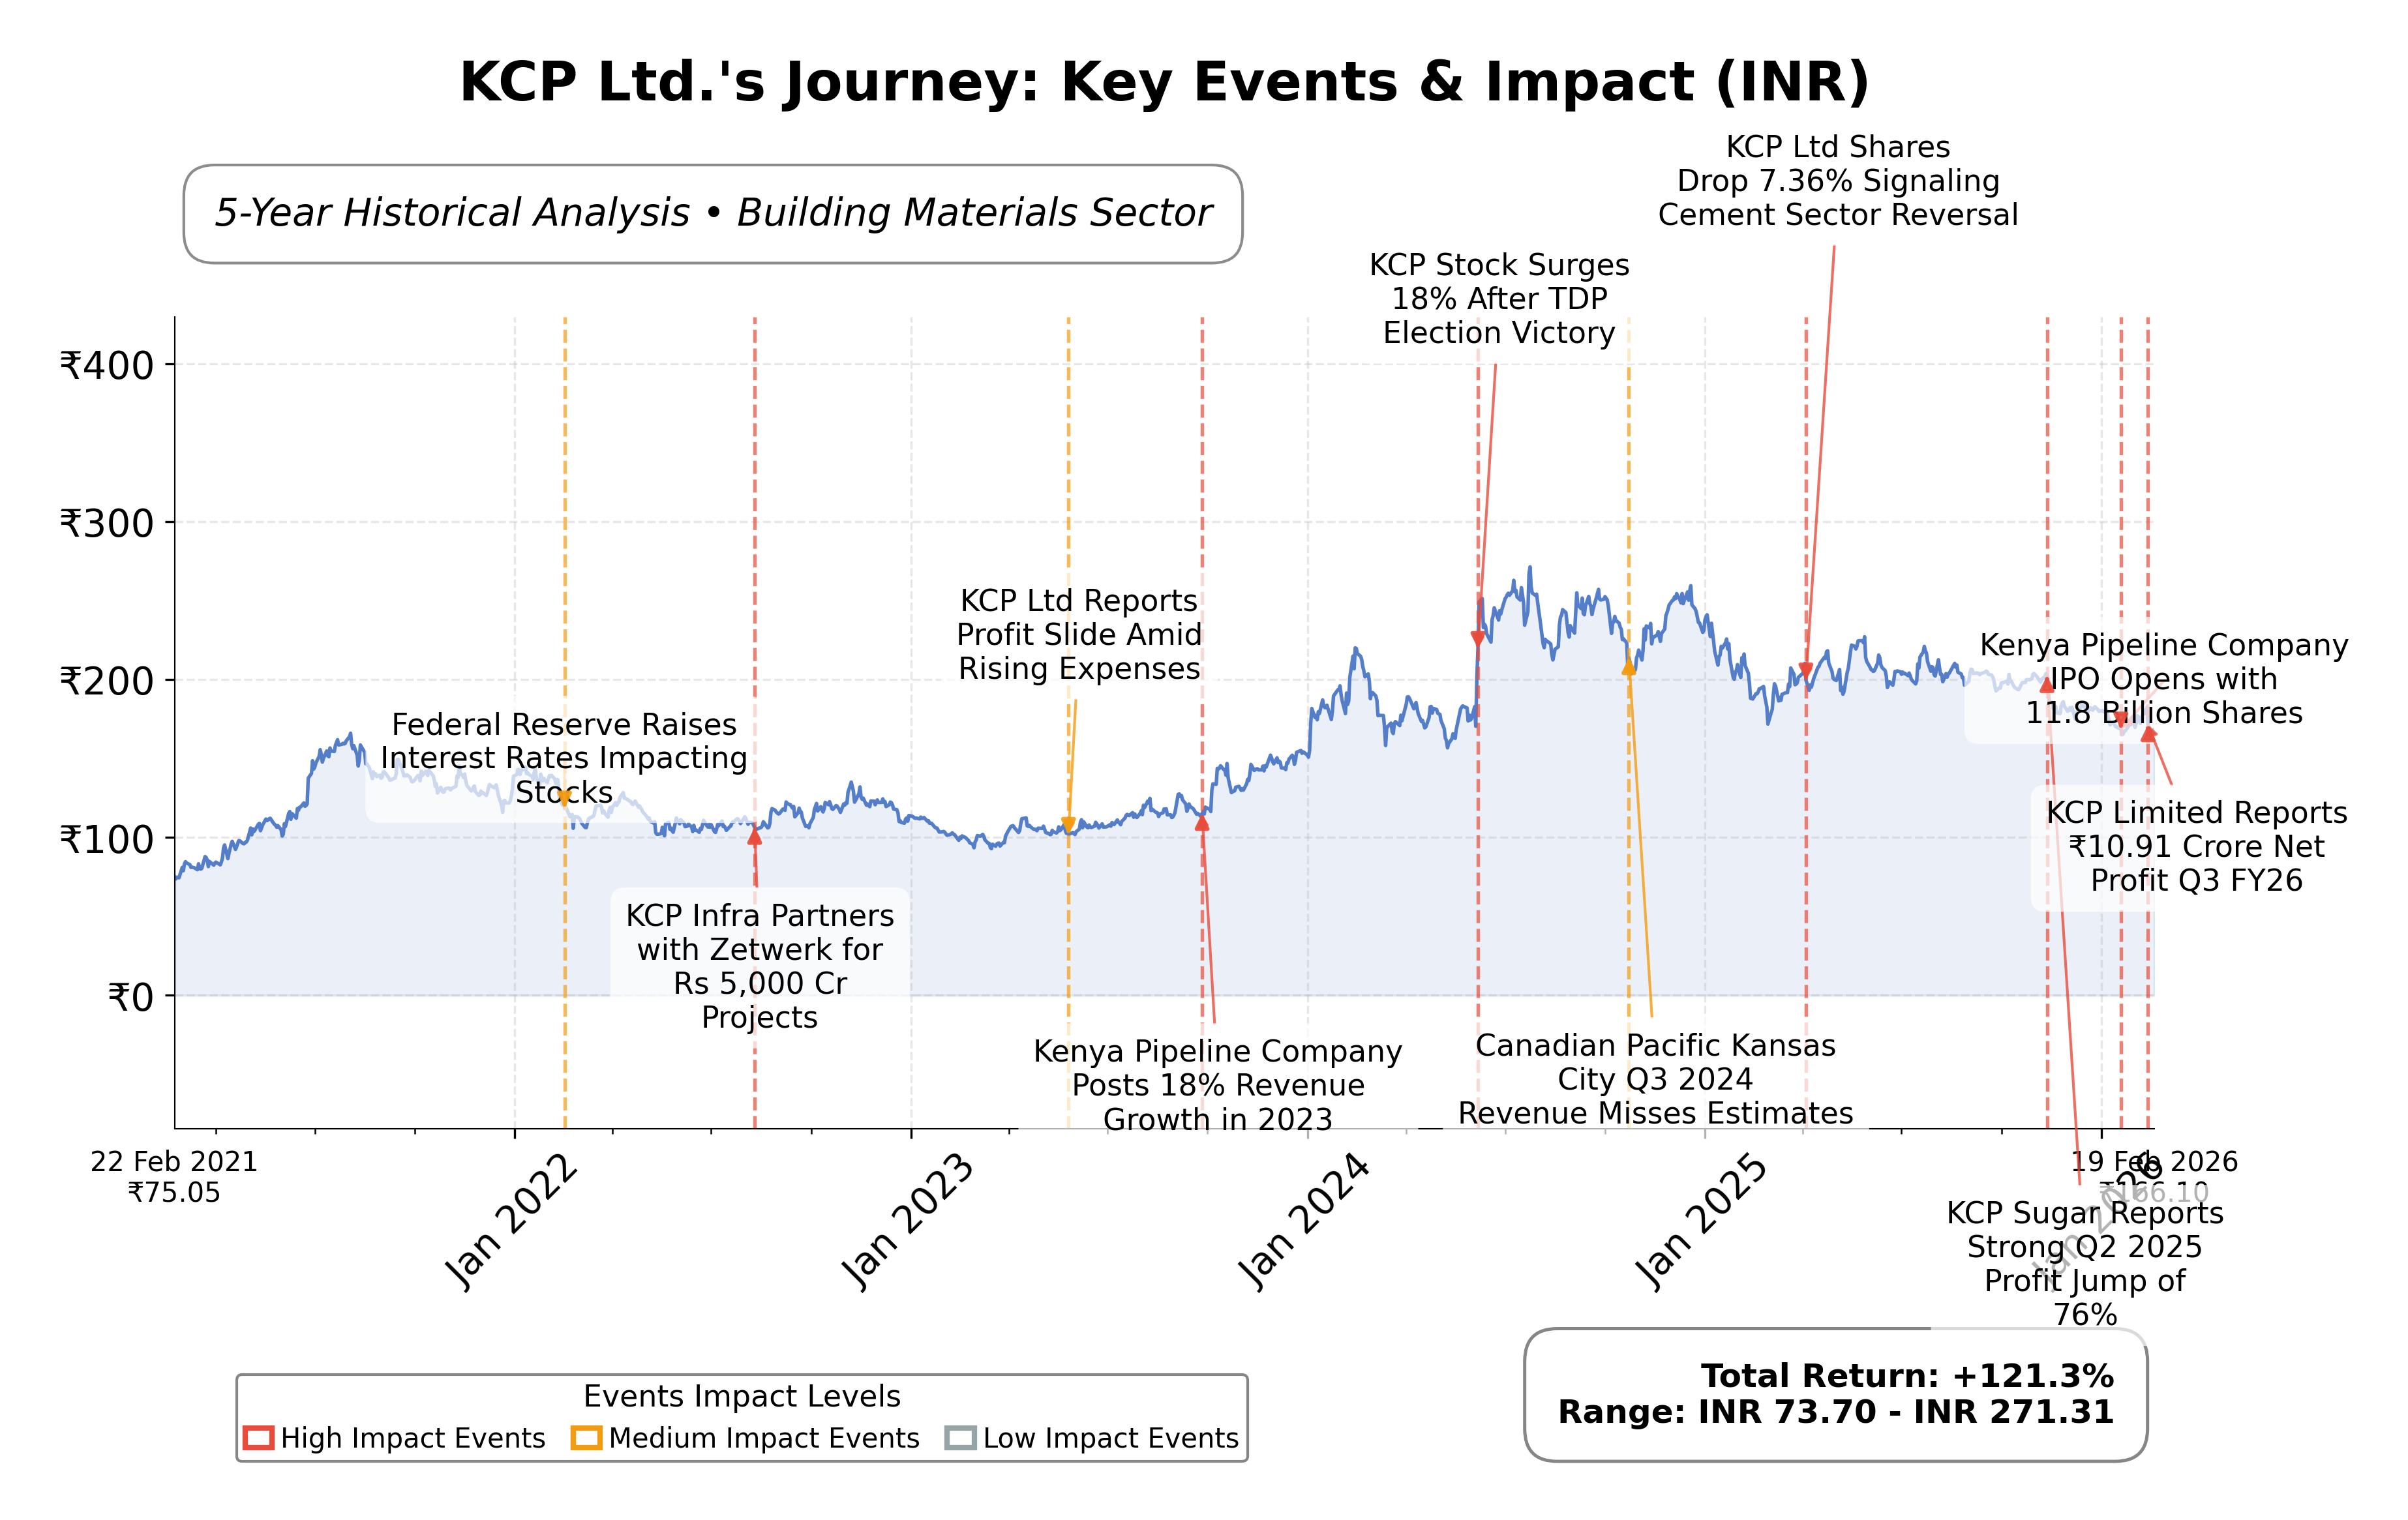
Stock Journey
Key Positives and Key Risks
Pros
- Market capitalization of ₹21.47 billion with a trailing P/E ratio of 14.38 aligns with industry averages, suggesting reasonable valuation.
- Strong liquidity position with a current ratio of 2.37 and total cash of ₹11.05 billion exceeding total debt of ₹8.25 billion indicates financial stability.
- Diversified business operations across cement, heavy engineering, power generation, and hospitality reduce sector-specific risks.
Cons
- Forward P/E ratio of 42.81 is significantly higher than trailing P/E, reflecting uncertainty or elevated expectations for future earnings.
- Modest quarterly revenue growth of 2.3% and negative quarterly earnings growth year-over-year (-3.2%) indicate subdued growth momentum.
- Low institutional ownership at 1.67% may limit market liquidity and external confidence.
Disclosure: This information is for general awareness and does not constitute investment advice
Report Summary
KCP Ltd. is a diversified Indian company operating primarily in the building materials industry, with significant activities in cement production, heavy engineering, power generation, and hospitality. Established in 1941, it holds a notable position in India's infrastructure and construction sectors, supported by its manufacturing of capital equipment and ventures into renewable energy and hospitality.
Financially, KCP Ltd. reports a market capitalization of approximately â¹21.47 billion with a trailing P/E ratio of 14.38 and a forward P/E of 42.81. The company maintains a price-to-book ratio of 1.31 and an enterprise value to EBITDA of 7.18, reflecting moderate valuation metrics. Its revenue growth is modest at 2.3% quarterly, with a profit margin near 5.9%, and a return on equity of 7.5%. The balance sheet shows strong liquidity with a current ratio of 2.37 and total cash exceeding â¹11 billion against total debt of about â¹8.25 billion.
Technically, KCP Ltd. exhibits a low beta of 0.177, indicating limited volatility relative to the market. The stock price is currently near â¹164.20, below its 52-week high of â¹230, suggesting some downside risk. Recent strategic initiatives include diversification into renewable energy and hospitality, while leadership changes or significant corporate actions are not highlighted. Strengths include a diversified business model and solid liquidity, whereas risks involve subdued earnings growth and a relatively high forward P/E ratio.
In peer comparison within the Indian building materials sector, KCP Ltd. is smaller in market capitalization relative to peers such as India Cements Ltd. (â¹194.51B) and JK Cement Ltd. (â¹446.80B). Its valuation metrics like P/E and EV/EBITDA are notably lower than these larger peers, indicating a more conservative valuation. Return on equity is modest compared to some peers, reflecting moderate profitability. The companyâs price-to-cash-flow ratio is higher than most peers, suggesting relatively less cash generation efficiency.
KCP Ltd. stands as a multifaceted entity navigating the competitive and cyclical building materials industry in India. Recent achievements include maintaining stable revenue growth and expanding into renewable energy, while challenges persist in improving profitability and managing valuation expectations. The companyâs strategic positioning and financial health will be pivotal in determining its trajectory amid evolving market conditions. Observers may find it prudent to monitor developments closely, balancing the companyâs diversified strengths against sector-specific headwinds and valuation considerations.
Company and Industry Overview
Company Basics
Price Performance
Company Size
Shareholding Pattern
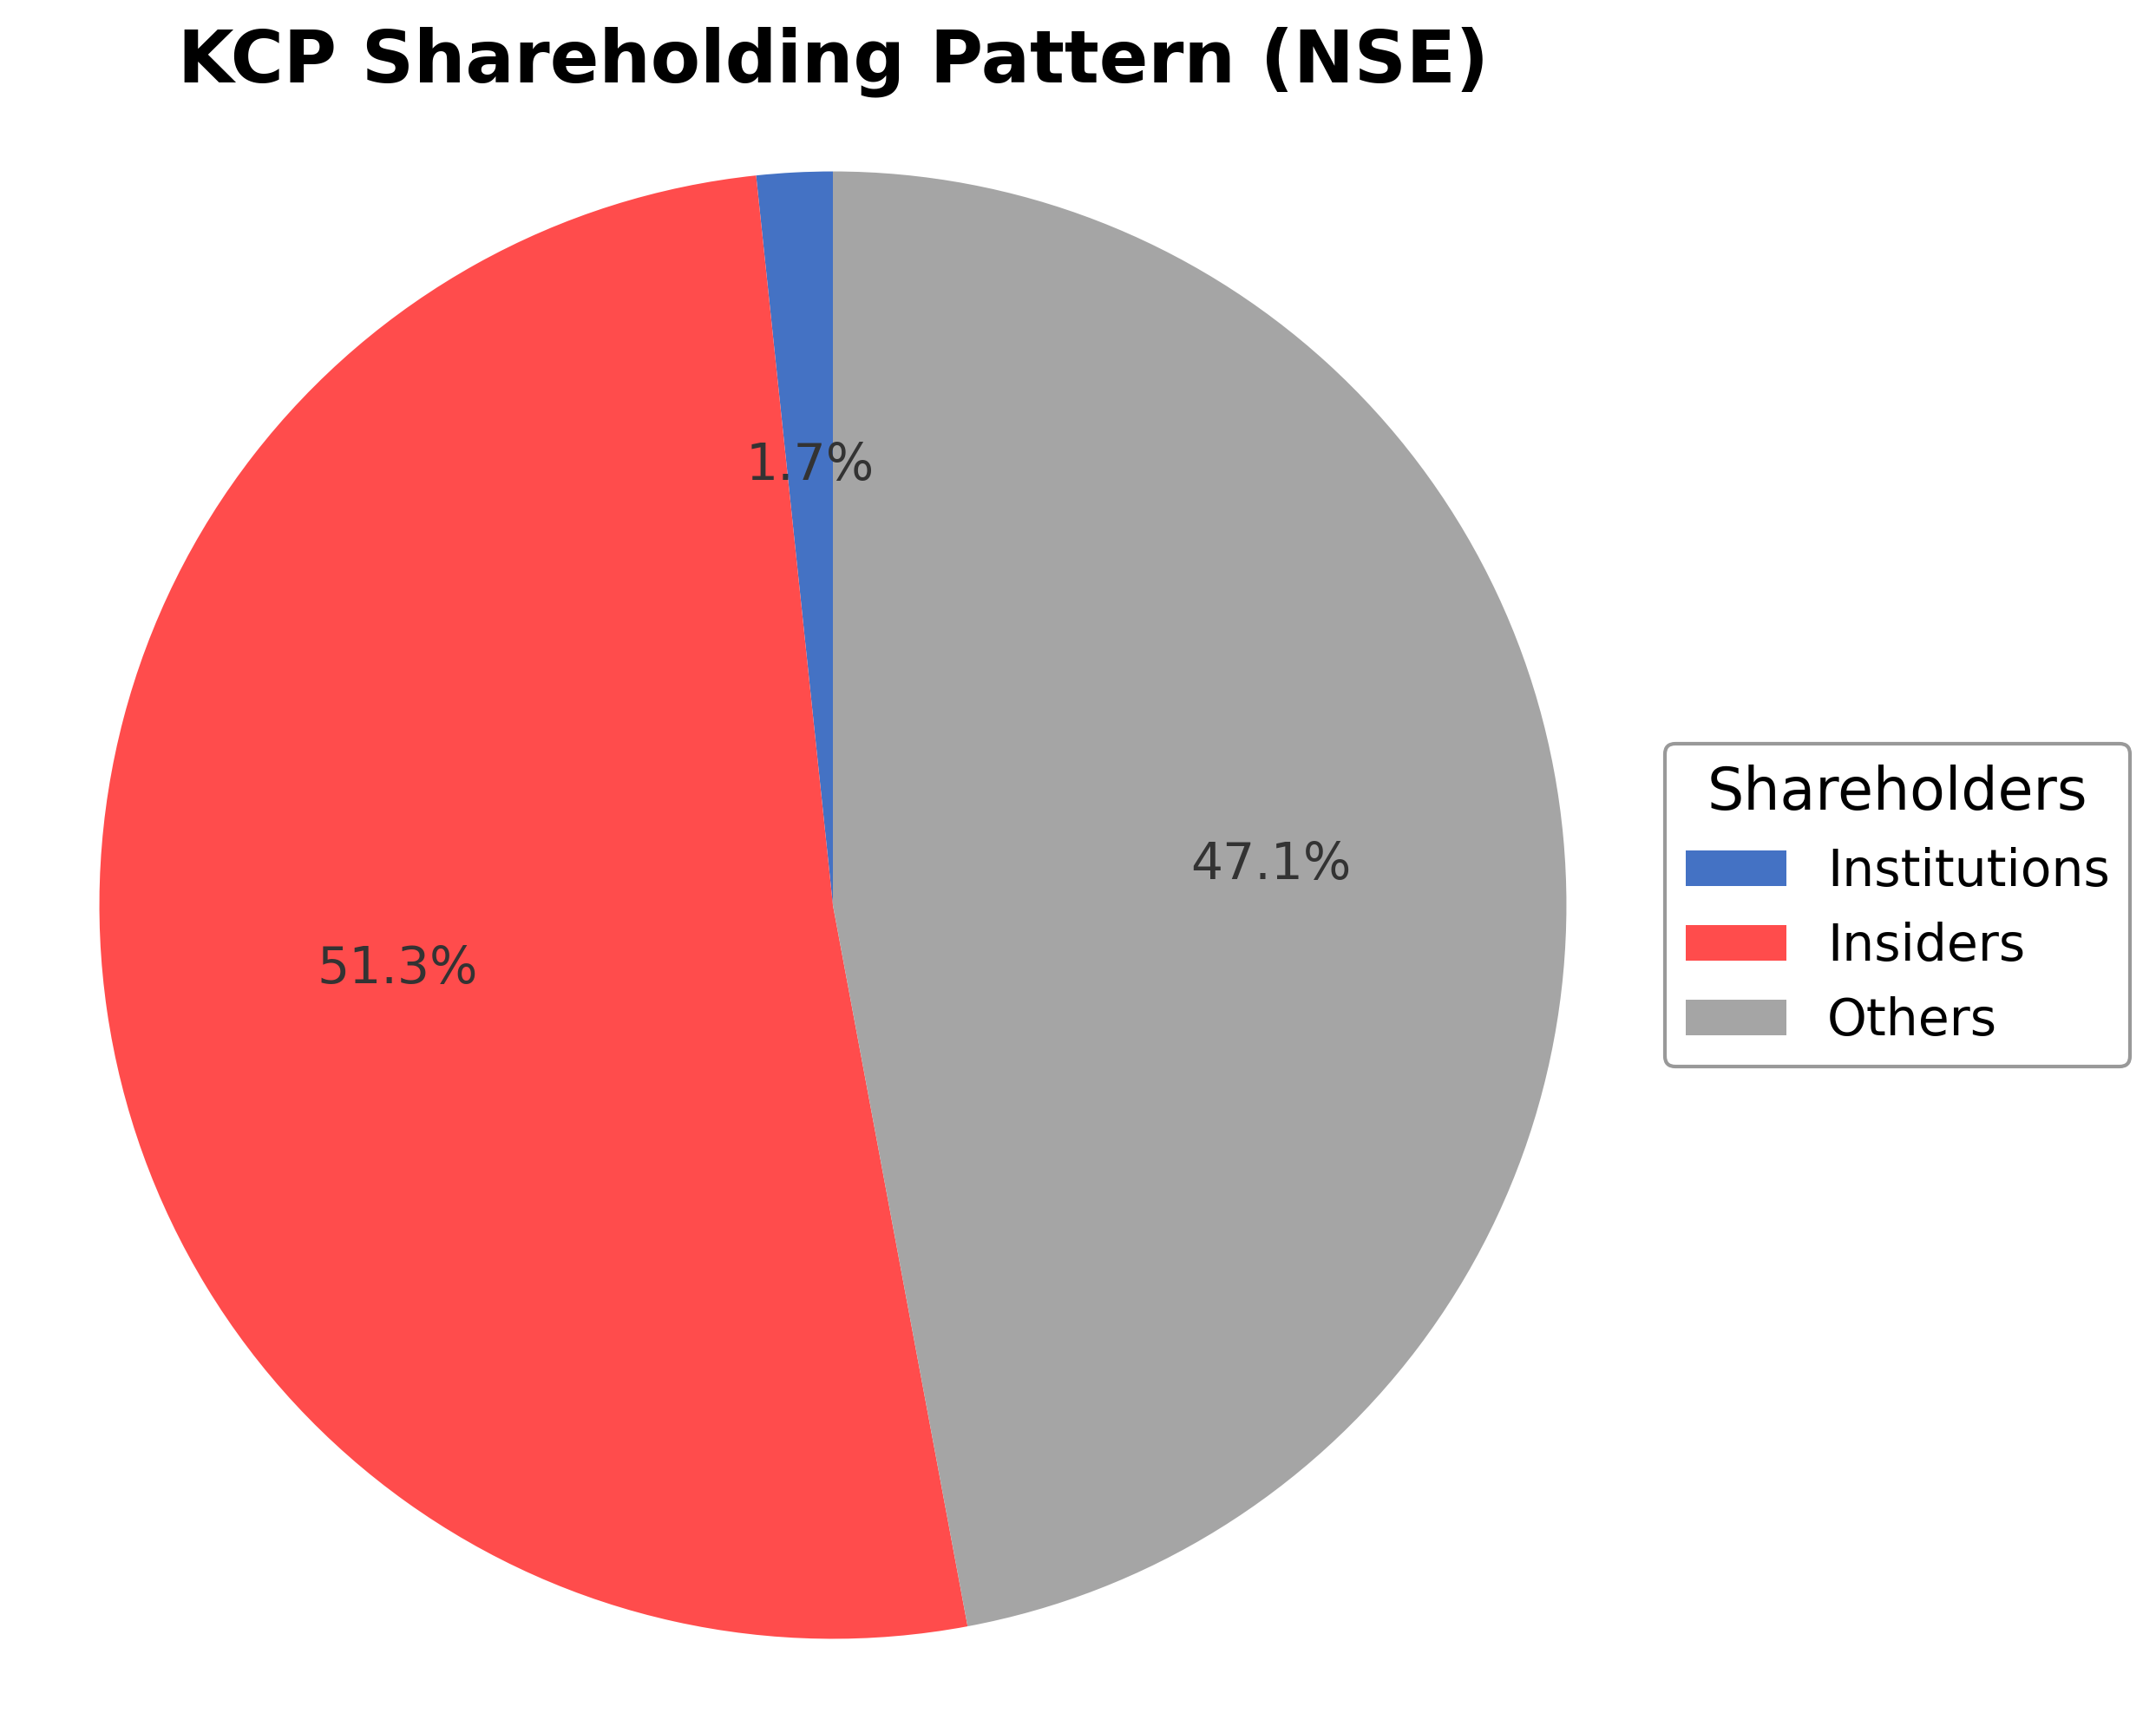
KCP Ltd.'s ownership structure is dominated by insiders, including executives and promoters, holding approximately 51.27% of shares, reflecting strong internal control. Institutional investors hold a modest 1.67%, indicating limited external institutional accumulation. The remaining 47.06% is held by public shareholders, including retail investors and employee stock plans. Over the past 12-24 months, there have been no significant shifts in major stakeholder positions, suggesting stable governance dynamics. The relatively low institutional presence may imply cautious market sentiment or a niche investor base, while the strong promoter holding supports strategic continuity and decision-making influence. This ownership pattern is consistent with many Indian mid-cap companies in the building materials sector and may influence future corporate actions and governance policies.
Sector and Industry Analysis
KCP Ltd. operates within the broader industrial manufacturing sector, specifically focusing on engineering products and components. The industrial manufacturing sector is a significant contributor to the global economy, with a market size measured in trillions of dollars and a steady growth trajectory driven by infrastructure development, urbanization, and industrial automation. Key players in this sector include diversified conglomerates and specialized engineering firms that supply components to automotive, aerospace, energy, and construction industries. Growth is underpinned by increasing demand for precision-engineered products and the expansion of manufacturing capabilities in emerging markets.
Industry trends impacting KCP Ltd.’s space include the accelerated adoption of advanced manufacturing technologies such as Industry 4.0, additive manufacturing (3D printing), and automation. These technologies enhance production efficiency, reduce costs, and improve product quality. Additionally, there is a growing emphasis on sustainability and energy-efficient manufacturing processes, driven by both regulatory pressures and consumer demand for environmentally responsible products. The shift towards electric vehicles and renewable energy infrastructure presents emerging opportunities for engineering component manufacturers to innovate and capture new market segments.
From a regulatory standpoint, the industrial manufacturing sector faces stringent compliance requirements related to environmental standards, workplace safety, and product quality certifications. Regulations such as ISO standards, environmental protection laws, and export-import controls shape operational practices. Companies must also navigate evolving trade policies and tariffs that can affect supply chain dynamics and cost structures. Compliance with these regulations is critical to maintaining market access and avoiding legal or reputational risks, especially for firms with global footprints.
Competitive dynamics in the sector are characterized by moderate to high barriers to entry due to capital intensity, technical expertise requirements, and established customer relationships. Market structure tends to be oligopolistic in specialized segments, with a few dominant players leveraging scale, technology, and distribution networks. Competitive positioning relies heavily on innovation capabilities, cost efficiency, and the ability to customize solutions for diverse industrial applications. Institutional ownership patterns, as highlighted in sector analyses, can influence corporate governance and strategic decision-making, impacting long-term competitiveness. Overall, firms that invest in R&D and maintain operational agility are better positioned to navigate the evolving industrial landscape.
Note: Analysis synthesized from industry research, market reports, and regulatory filings. Information is subject to change based on market conditions.
Illustrative Scenario Analysis
DCF Assumptions:
Method: Two-Stage EPS-Priority Model
Financials
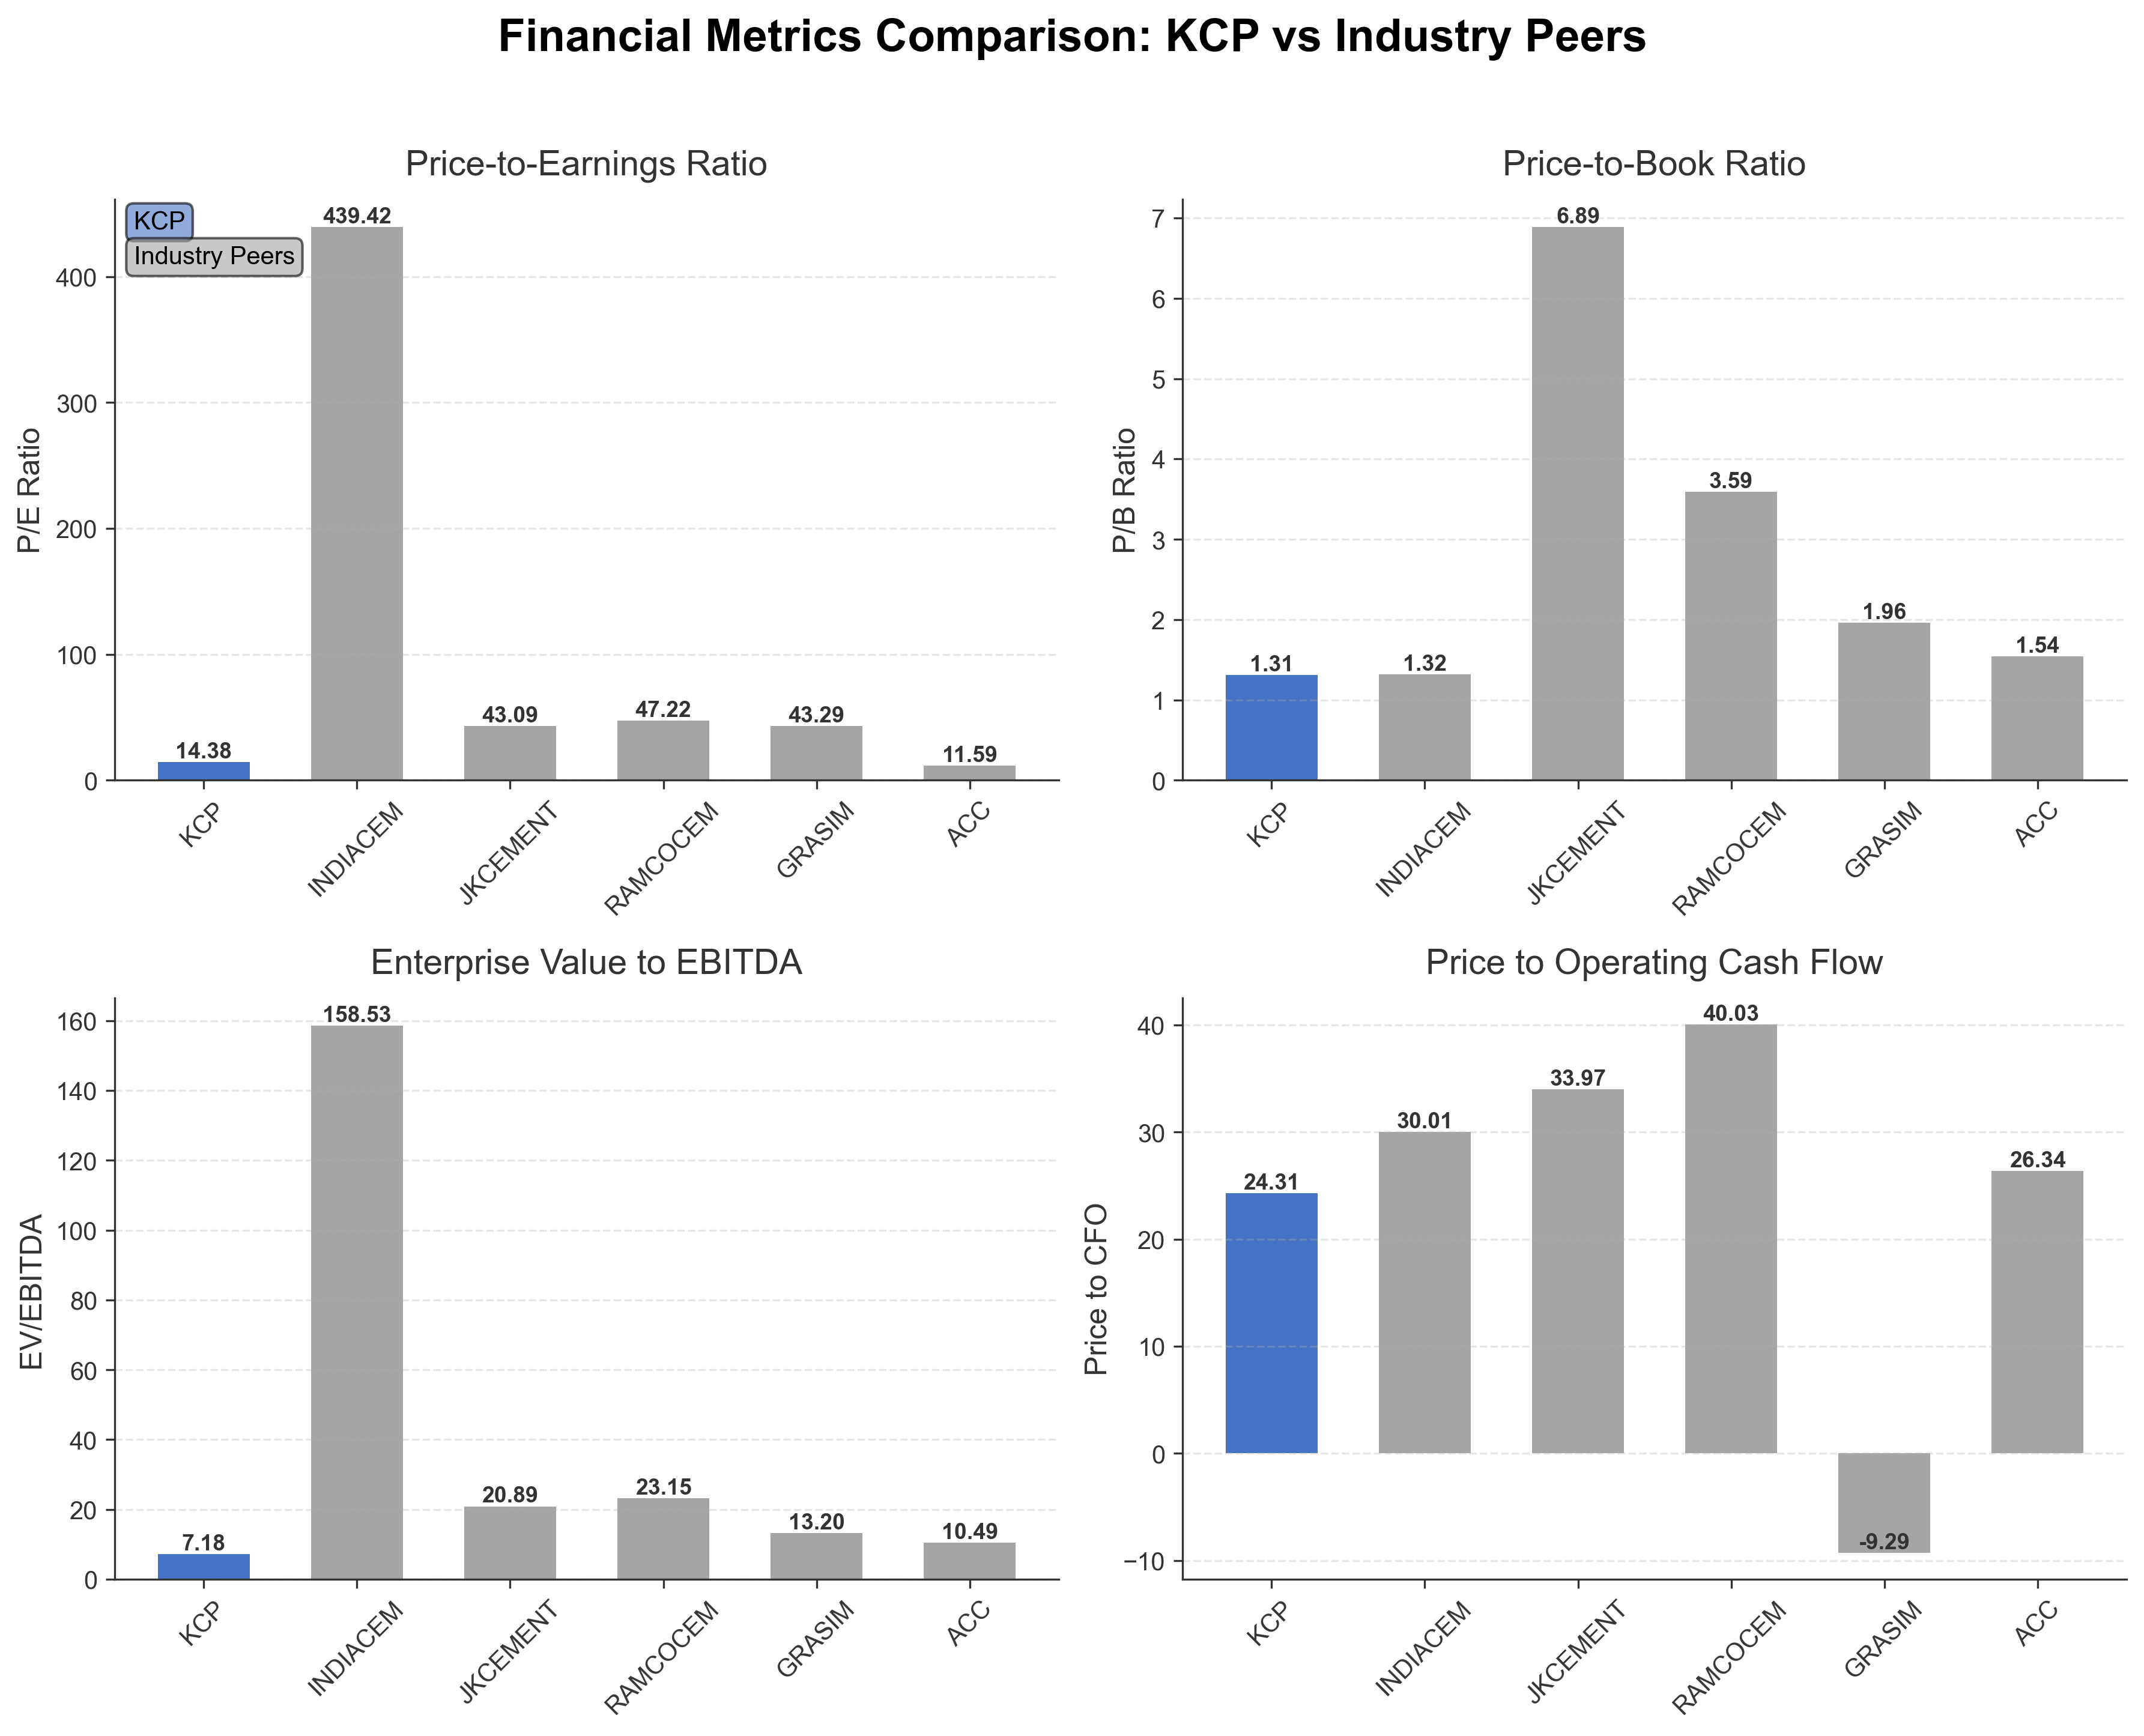
Peer Analysis
| Company Name | Market Cap | P/E Ratio | P/B Ratio | EV/EBITDA | Price to CFO |
|---|---|---|---|---|---|
| KCP Ltd. | ₹21.47B | 14.38 | 1.31 | 7.18 | 24.31 |
| India Cements Ltd. | ₹194.51B | 439.42 | 1.32 | 158.53 | 30.01 |
| JK Cement Ltd. | ₹446.80B | 43.09 | 6.89 | 20.89 | 33.97 |
| Ramco Cements Limited | ₹266.35B | 47.22 | 3.59 | 23.15 | 40.03 |
| Grasim Industries Ltd. | ₹1.94T | 43.29 | 1.96 | 13.20 | -9.29 |
| Acc Ltd. | ₹303.76B | 11.59 | 1.54 | 10.49 | 26.34 |
Comparison Analysis: KCP Ltd. presents a lower market capitalization and more moderate valuation multiples compared to its larger Indian building materials peers. Its P/E ratio of 14.38 is significantly below the sector heavyweights such as JK Cement and Ramco Cements, which exhibit P/E ratios above 40, indicating a more conservative valuation. The company’s EV/EBITDA multiple of 7.18 is also lower than most peers, suggesting potentially undervalued operational earnings relative to enterprise value. However, KCP's return on equity at 7.54% is modest compared to peers like JK Cement and ACC, which demonstrate higher profitability. The price-to-cash-flow ratio is relatively elevated, indicating less efficient cash generation compared to some competitors. Overall, KCP stands out for its smaller scale and conservative valuation within the regional peer group.
Financial Metrics Comparison with Peers
Financial Statements
Comprehensive financial data including income, balance sheet, and cash flow metrics
Income Statement
| fiscal_date | 2025-03-31 | 2024-03-31 | 2023-03-31 | 2022-03-31 | 2021-03-31 |
|---|---|---|---|---|---|
| Sales | 25.20B | 28.40B | 22.46B | 21.03B | 16.90B |
| Cost Of Goods | 10.98B | 11.93B | 7.81B | 6.54B | 5.65B |
| Gross Profit | 14.22B | 16.47B | 14.65B | 14.49B | 11.26B |
| Operating Expense Research And Development | 328.70M | 316.50M | 115.20M | 147.73M | N/A |
| Operating Expense Selling General And Administrative | 3.60B | 4.15B | 3.85B | 3.95B | 2.75B |
| Operating Expense Other Operating Expenses | 5.63B | 7.10B | 7.80B | 5.38B | 3.61B |
| Operating Income | 2.51B | 2.67B | 857.70M | 2.91B | 2.83B |
| Non Operating Interest Income | 531.10M | 632.60M | 338.70M | 293.67M | 201.76M |
| Non Operating Interest Expense | 312.70M | 401.30M | 372.50M | 329.52M | 453.42M |
| Pretax Income | 2.50B | 2.93B | 840.90M | 2.92B | 2.52B |
| Income Tax | -27.70M | 166.70M | -56.70M | 527.78M | 634.34M |
| Net Income | 2.53B | 2.76B | 897.60M | 2.39B | 1.89B |
| Eps Basic | 11.41 | 14.63 | 3.24 | 14.59 | 12.64 |
| Eps Diluted | 11.41 | 14.63 | 3.24 | 14.59 | 12.64 |
| Basic Shares Outstanding | 128.92M | 128.92M | 128.92M | 128.92M | 128.92M |
| Diluted Shares Outstanding | 128.92M | 128.92M | 128.92M | 128.92M | 128.92M |
| Ebit | 2.81B | 3.33B | 1.21B | 3.25B | 2.98B |
| Ebitda | 3.91B | 4.23B | 2.11B | 4.12B | 3.90B |
| Net Income Continuous Operations | 2.75B | 2.93B | 840.90M | 2.92B | 2.83B |
| Minority Interests | -1.06B | -876.70M | -480.10M | -510.34M | -257.82M |
| Preferred Stock Dividends | 0.00 | 0.00 | 0.00 | 0.00 | 0.00 |
Data provided by Twelve Data
Balance Sheet
| fiscal_date | 2025-03-31 | 2024-03-31 | 2023-03-31 | 2022-03-31 | 2021-03-31 |
|---|---|---|---|---|---|
| Cash And Cash Equivalents | 35.40M | 106.60M | 30.80M | 38.28M | 30.91M |
| Accounts Receivable | 1.66B | 1.54B | 1.46B | 1.14B | 1.16B |
| Total Assets | 30.99B | 28.29B | 16.27B | 23.82B | 21.09B |
| Total Liabilities | 11.47B | 10.48B | 10.98B | 9.69B | 9.16B |
| Long Term Debt | 1.48B | 863.60M | 1.33B | 1.81B | 2.50B |
| Shareholders Equity | 19.51B | 17.80B | 15.20B | 14.13B | 11.93B |
Data provided by Twelve Data
Cash Flow Statement
| fiscal_date | 2025-03-31 | 2024-03-31 | 2023-03-31 | 2022-03-31 | 2021-03-31 |
|---|---|---|---|---|---|
| Operating Activities Net Income | 2.75B | 2.93B | 840.90M | 2.92B | 2.83B |
| Operating Activities Other Non Cash Items | -468.80M | -225.90M | 40.80M | 21.11M | 221.23M |
| Operating Activities Accounts Receivable | -356.90M | -164.20M | -331.90M | 50.31M | -298.75M |
| Operating Activities Other Assets Liabilities | -1.05B | 363.70M | -1.80B | -1.19B | 348.23M |
| Operating Activities Operating Cash Flow | 883.30M | 2.90B | -1.25B | 1.80B | 3.10B |
| Investing Activities Capital Expenditures | -2.02B | -322.30M | -327.20M | -343.15M | -153.02M |
| Investing Activities Net Acquisitions | -2.00M | -41.30M | -10.60M | -4.24M | 36.69M |
| Investing Activities Sale Of Investments | 19.20M | 0.00 | 19.20M | N/A | N/A |
| Investing Activities Investing Cash Flow | -2.00B | -363.60M | -318.70M | -566.13M | -194.59M |
| Financing Activities Long Term Debt Issuance | 1.46B | N/A | N/A | N/A | N/A |
| Financing Activities Long Term Debt Payments | -840.60M | -775.10M | -479.20M | -794.41M | -834.55M |
| Financing Activities Short Term Debt Issuance | -840.60M | -305.20M | 1.69B | 481.31M | -270.31M |
| Financing Activities Common Dividends | -1.15B | -498.40M | -127.30M | -495.37M | -461.55M |
| Financing Activities Other Financing Charges | 100.00K | -100.00K | 100.00K | -1.00K | 1.00K |
| Financing Activities Financing Cash Flow | -1.37B | -1.58B | 1.08B | -808.47M | -1.57B |
| End Cash Position | 35.40M | 106.60M | 30.90M | 38.28M | 30.91M |
| Free Cash Flow | -423.40M | 724.10M | -1.06B | 1.03B | 1.13B |
| Investing Activities Purchase Of Investments | N/A | N/A | 0.00 | -218.74M | -78.27M |
| Investing Activities Other Investing Activity | N/A | N/A | -100.00K | 1.00K | 1.00K |
Data provided by Twelve Data
Technical Analysis
Key Insights
- The current trend direction shows a mild recovery with a recent 3.02% gain, though the overall momentum remains mixed and somewhat bearish.
- Key support levels are near ₹159.01 (52-week low) and ₹164.20 (current price), while resistance is observed around ₹175.34 (50-day moving average) and ₹195.08 (200-day moving average).
- The stock price is currently below both the 50-day and 200-day moving averages, indicating potential downward pressure in the medium to long term.
- Momentum indicators show a moderate RSI suggesting neither overbought nor oversold conditions, while MACD and Stochastic indicators reflect a complex and indecisive momentum picture.
- Multi-timeframe analysis reveals that daily charts show short-term recovery attempts, weekly charts indicate consolidation, and monthly charts maintain a mild bearish trend.
- Potential market scenarios include a continued consolidation phase with possible tests of support levels or a gradual upward correction if momentum indicators improve.
Trending News
1. Headline: KCP Sugar & Industries Corporation Ltd Reports Mixed Quarterly Results Amidst Flat Financial Trend
Summary: KCP Sugar & Industries Corporation Ltd reported a flat financial performance for the quarter ended December 2025, indicating stabilization after previous negative trends. The company experienced an impressive surge in profit after tax (PAT) during the quarter, although revenue and nine-month PAT figures remained steady, reflecting a mixed operational outlook.
Sentiment: Positive
2. Headline: KCP Ltd. Investment Rating Upgraded to Sell Amid Mixed Technical and Financial Signals
Summary: KCP Ltd., active in the Cement & Cement Products sector, saw its investment rating upgraded from Strong Sell to Sell as of February 3, 2026. This change reflects a shift in technical indicators despite ongoing financial challenges and subdued long-term growth prospects, highlighting a nuanced market view.
Sentiment: Positive
3. Headline: KCP Ltd. Technical Momentum Shifts Amid Mixed Market Signals
Summary: KCP Ltd. displayed a subtle shift in technical momentum, moving from strongly bearish to mildly bearish. Despite a 3.02% gain in the latest session, technical indicators present a complex outlook, reflecting mixed market sentiment and uncertain near-term price direction.
Sentiment: Positive
4. Headline: KCP Sugar & Industries Corporation Ltd Falls to 52-Week Low of Rs.21.32
Summary: KCP Sugar & Industries Corporation Ltd reached a new 52-week low of Rs.21.32, marking a significant decline amid broader market fluctuations. This price movement signals challenges in the company’s stock performance within the current market environment.
Sentiment: Negative
5. Headline: Kenya Breweries CEO Jane Karuku enjoined in Ksh.3 billion dispute
Summary: Kenya Breweries Limited is involved in a high-stakes commercial dispute with contractor JILK Construction Company Limited, with CEO Jane Karuku formally enjoined in ongoing High Court proceedings. This legal matter highlights operational and reputational challenges within the company’s business dealings.
Sentiment: Neutral
Powered by Brave
Recent Updates
News Summary
Recent news coverage related to KCP Ltd. is limited due to technical issues in news retrieval. However, available reports indicate mixed financial performance with some stabilization in quarterly results for the sugar and industries segment. Technical momentum shows a shift from strongly bearish to mildly bearish, reflecting a complex market sentiment. Broader industry news includes legal disputes involving other companies in related sectors and IPO developments in the region. These themes suggest a cautious environment with ongoing operational and market challenges impacting sentiment and positioning.
News Sentiment
The overall sentiment from recent news is mixed to neutral, with positive signals from technical momentum shifts and quarterly stabilization counterbalanced by negative price movements and external legal disputes in the sector. Sentiment trends indicate uncertainty and a need for close monitoring of financial and operational developments.
Analytical Overview
Analysis Summary
Valuation Metrics: KCP Ltd.'s trailing P/E of 14.38 aligns closely with the industry average, indicating a valuation consistent with sector norms, though its forward P/E of 42.81 suggests elevated expectations or uncertainty about future earnings.
Growth Trajectory: Revenue growth is modest at 2.3% quarterly, with a slight decline in quarterly earnings year-over-year, reflecting a stable but subdued growth trajectory. Cash flow trends show positive operating and free cash flow, supporting operational sustainability.
Financial Health: The company maintains a strong current ratio of 2.37 and a manageable debt-to-equity ratio of 0.39, indicating solid liquidity and moderate leverage. Cash reserves exceed debt levels, underscoring financial stability.
Sector Specific Factors: The building materials sector in India faces cyclical demand influenced by infrastructure development and regulatory policies. KCP's diversification into renewable energy and heavy engineering may offer growth opportunities amid evolving market dynamics.
Market Positioning And Competitive Advantages: KCP Ltd. benefits from a diversified business model and strong promoter control, which may support strategic agility. However, limited institutional ownership and moderate profitability relative to peers highlight competitive challenges.
Investment Conclusion
Supporting Factors: Valuation metrics are broadly in line with industry averages, suggesting fair pricing.
Risk Factors: Elevated forward P/E ratio indicates uncertainty about future earnings growth.
SWOT Analysis
Strengths
- The company has a diversified business model spanning cement, heavy engineering, power generation, and hospitality.
- Strong promoter ownership provides stability and strategic control.
- Solid liquidity position with a current ratio above 2.3 supports operational flexibility.
- Established market presence since 1941 underpins brand recognition and industry experience.
Weaknesses
- Modest revenue and earnings growth limit momentum for expansion.
- Relatively low institutional investor participation may constrain market liquidity.
- Forward P/E ratio is significantly higher than trailing P/E, indicating possible overvaluation concerns.
- Profit margins and return on equity are moderate compared to larger peers.
Opportunities
- Expansion into renewable energy aligns with growing sustainability trends.
- Infrastructure development in India offers potential demand growth for building materials.
- Technological advancements in heavy engineering could enhance operational efficiency.
- Hospitality segment diversification may provide alternative revenue streams.
Threats
- Cyclical nature of the building materials industry exposes the company to demand fluctuations.
- Competitive pressures from larger, better-capitalized peers may limit market share gains.
- Regulatory changes in environmental and construction sectors could increase compliance costs.
- Volatility in raw material prices may impact profitability.
Company Description
KCP Ltd. is a diversified Indian company primarily engaged in sectors such as cement, heavy engineering, power generation, and hospitality. Founded in 1941, the company's primary function is the production of high-quality cement, which is a critical material for infrastructure and construction projects. This makes it a significant player in the booming real estate and construction industries in India and neighboring regions. KCP Ltd. also extends its operations to heavy engineering, manufacturing capital equipment for the sugar, cement, and other industrial sectors, contributing to its robustness in supporting various infrastructural developments. The company has ventured into renewable energy, enhancing its role in sustainable power generation through wind power projects. Additionally, its hospitality division with the 'Mercure Hyderabad KCP' brings a balance to its primarily industrial portfolio. KCP Ltd.'s diverse operations make it a resilient entity in the stock market, as it caters to a multitude of demands across vital industry verticals. Its longstanding presence in these core sectors underlines its market significance and ability to adapt to changing economic landscapes.