

Karnataka Bank Ltd (KTKBANK)
Stock Analysis Report
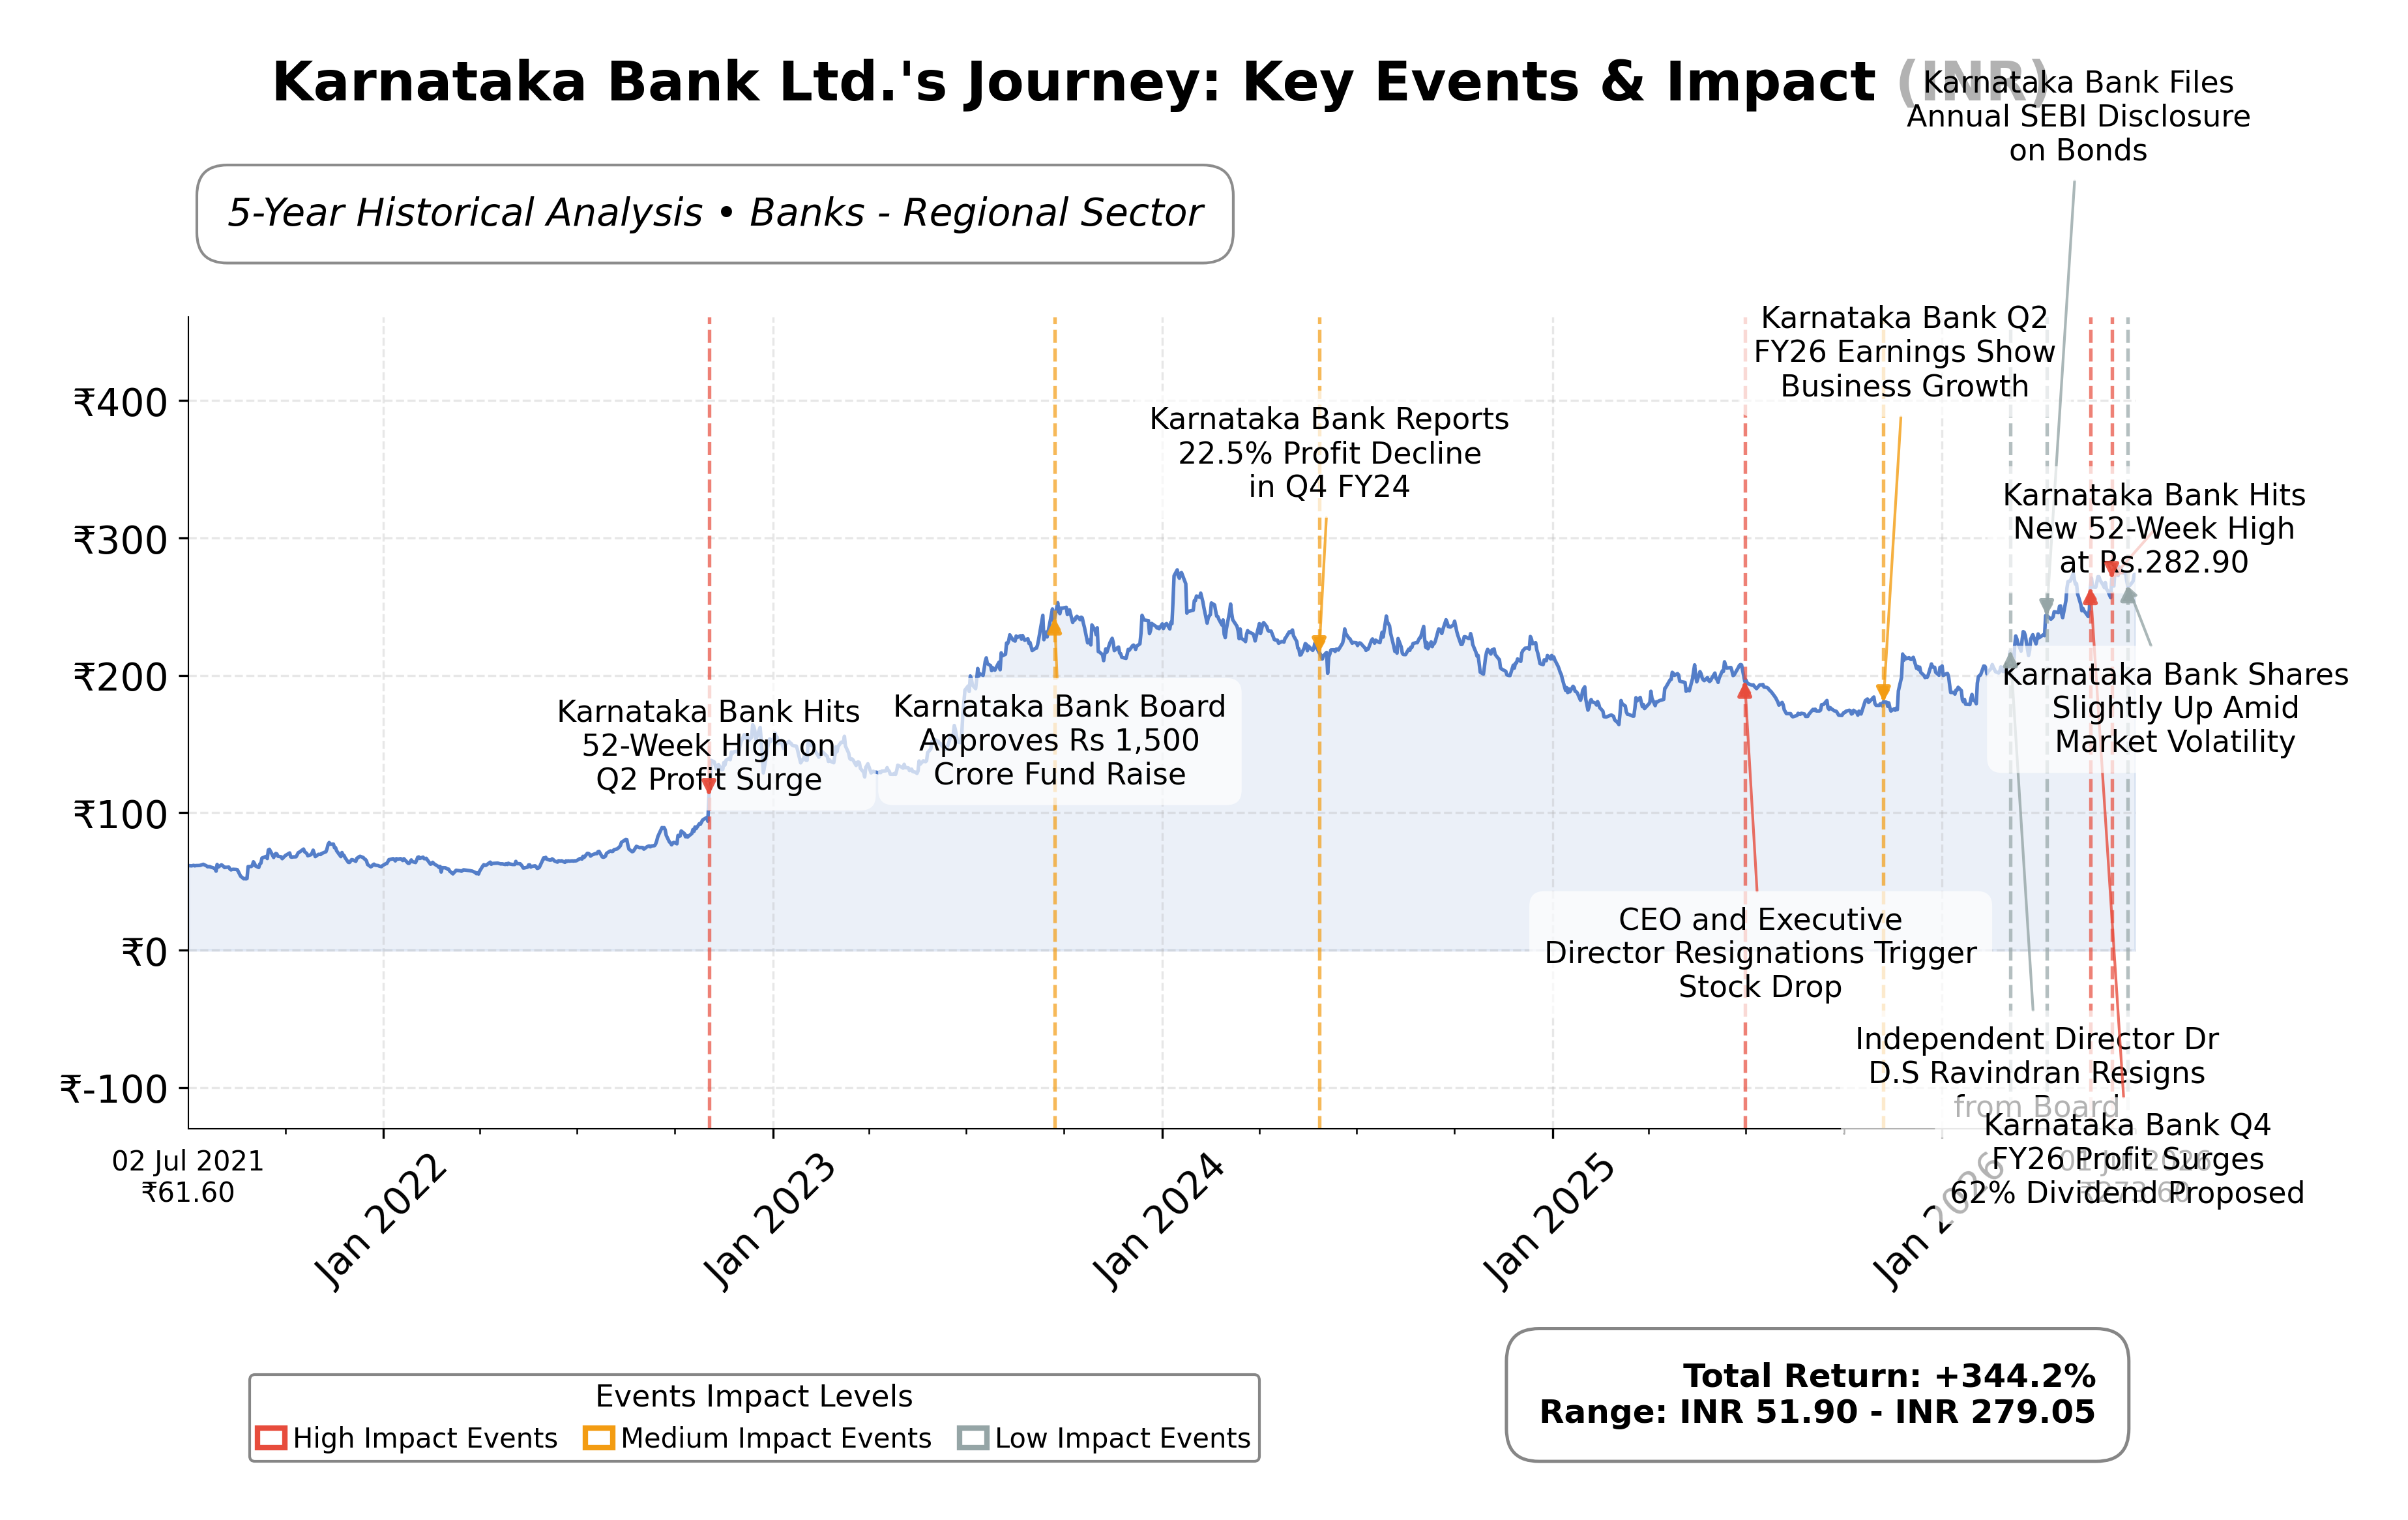
Stock Journey
Key Positives and Key Risks
Pros
- Market capitalization of ₹100.45 billion provides a solid mid-sized banking platform with growth potential.
- Attractive valuation metrics with a trailing P/E of 7.66 and P/B of 0.76, indicating undervaluation relative to book value and earnings.
- Strong profitability demonstrated by a net profit margin of 40.89% and return on equity of 10.36%, reflecting efficient capital use.
Cons
- Negative operating cash flow of INR -28.7 billion raises concerns about operational liquidity and cash management.
- Price to CFO ratio of -3.50 suggests challenges in converting earnings into cash flow.
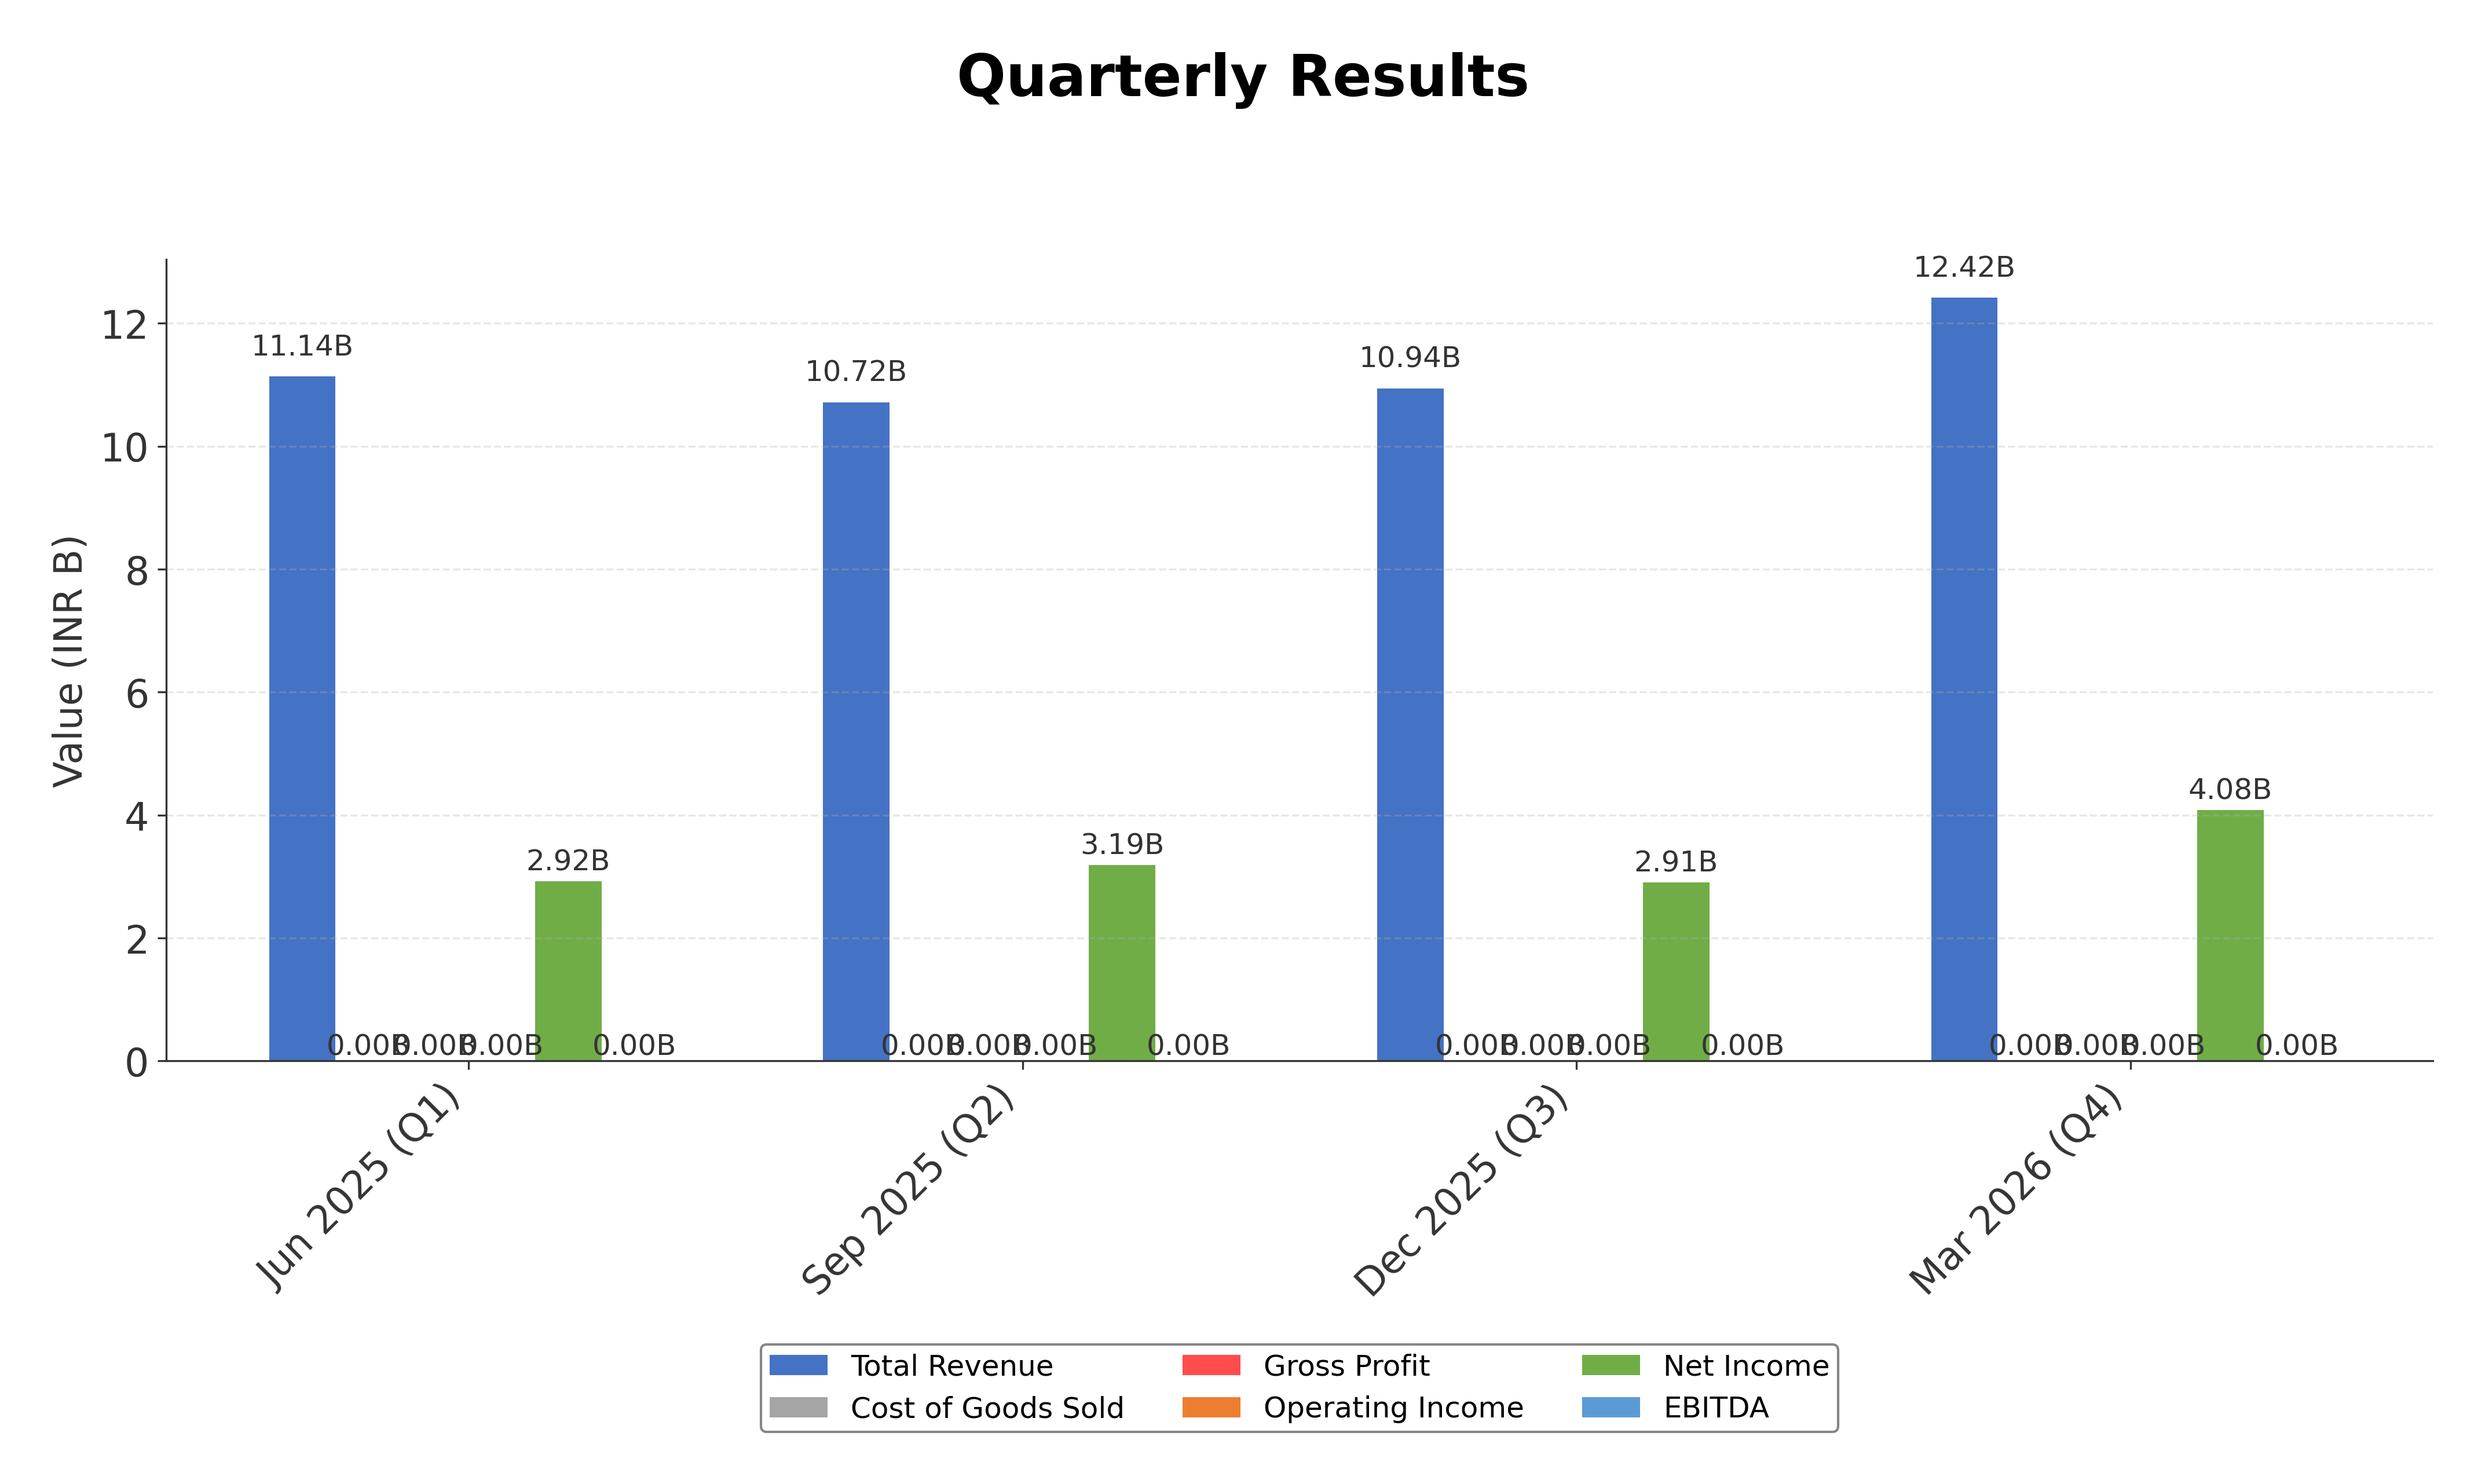
- Slight quarterly revenue decline of 1.7% indicates potential pressure on top-line growth.
Disclosure: This information is for general awareness and does not constitute investment advice
Report Summary
Karnataka Bank Ltd. is a well-established private sector bank headquartered in Mangalore, India, operating primarily in the Financial Services sector under the Banks - Regional industry classification. It is listed on the NSE (National Stock Exchange of India) and offers a comprehensive suite of banking products and services, including retail, corporate, and NRI banking. The bank has a strong regional presence supported by an extensive network of branches and ATMs, and it is actively expanding its digital banking capabilities to enhance customer convenience.
Financially, Karnataka Bank reported trailing twelve months (TTM) revenue of approximately INR 32.06 billion with a net profit margin of 40.89%, indicating strong profitability. The operating margin stands at 45.57%, reflecting efficient operational management. The bank’s return on equity (ROE) is 10.36%, and return on assets (ROA) is 1.05%, demonstrating reasonable returns on shareholder investments and asset utilization. The return on invested capital (ROIC) is not explicitly provided but can be inferred as consistent with these profitability metrics.
Valuation metrics show a trailing price-to-earnings (P/E) ratio of 7.66 and a forward P/E of 6.61, which are below the industry average P/E of 7.66, suggesting the stock is trading at a discount relative to earnings expectations. The price-to-book (P/B) ratio is 0.76, indicating the stock is priced below its book value. The market capitalization is approximately INR 100.45 billion. The stock’s 52-week range is INR 169.12 to INR 282.95, with the current price near the upper end at INR 269.05, reflecting a recent positive price trend.
Karnataka Bank’s strengths include a solid capital base with a total cash position of INR 77.36 billion against total debt of INR 53.29 billion, yielding a debt-to-equity ratio of 0.40, which is moderate and suggests manageable leverage. The bank has demonstrated steady business growth with total business reaching an all-time high of INR 192,119 crores, up 6% sequentially. Key risks include sector-specific regulatory challenges, competitive pressures from larger banks and fintech players, and macroeconomic factors affecting credit growth. Recent strategic actions include ongoing transformational changes under the leadership of the Managing Director & CEO, focusing on operational efficiency and digital initiatives.
Technically, the stock is trading above its 50-day moving average of INR 262.52 and 200-day moving average of INR 214.57, indicating a positive trend. Momentum indicators suggest moderate strength with a beta of 0.30, reflecting lower volatility relative to the market. Recent news highlights a neutral to positive market sentiment with analyst target prices around INR 330. Overall, the data suggests a market environment where accumulation and monitoring of performance metrics may be prudent, given the balance of valuation, profitability, and sector dynamics.
Company and Industry Overview
Company Basics
Price Performance
Company Size
Shareholding Pattern
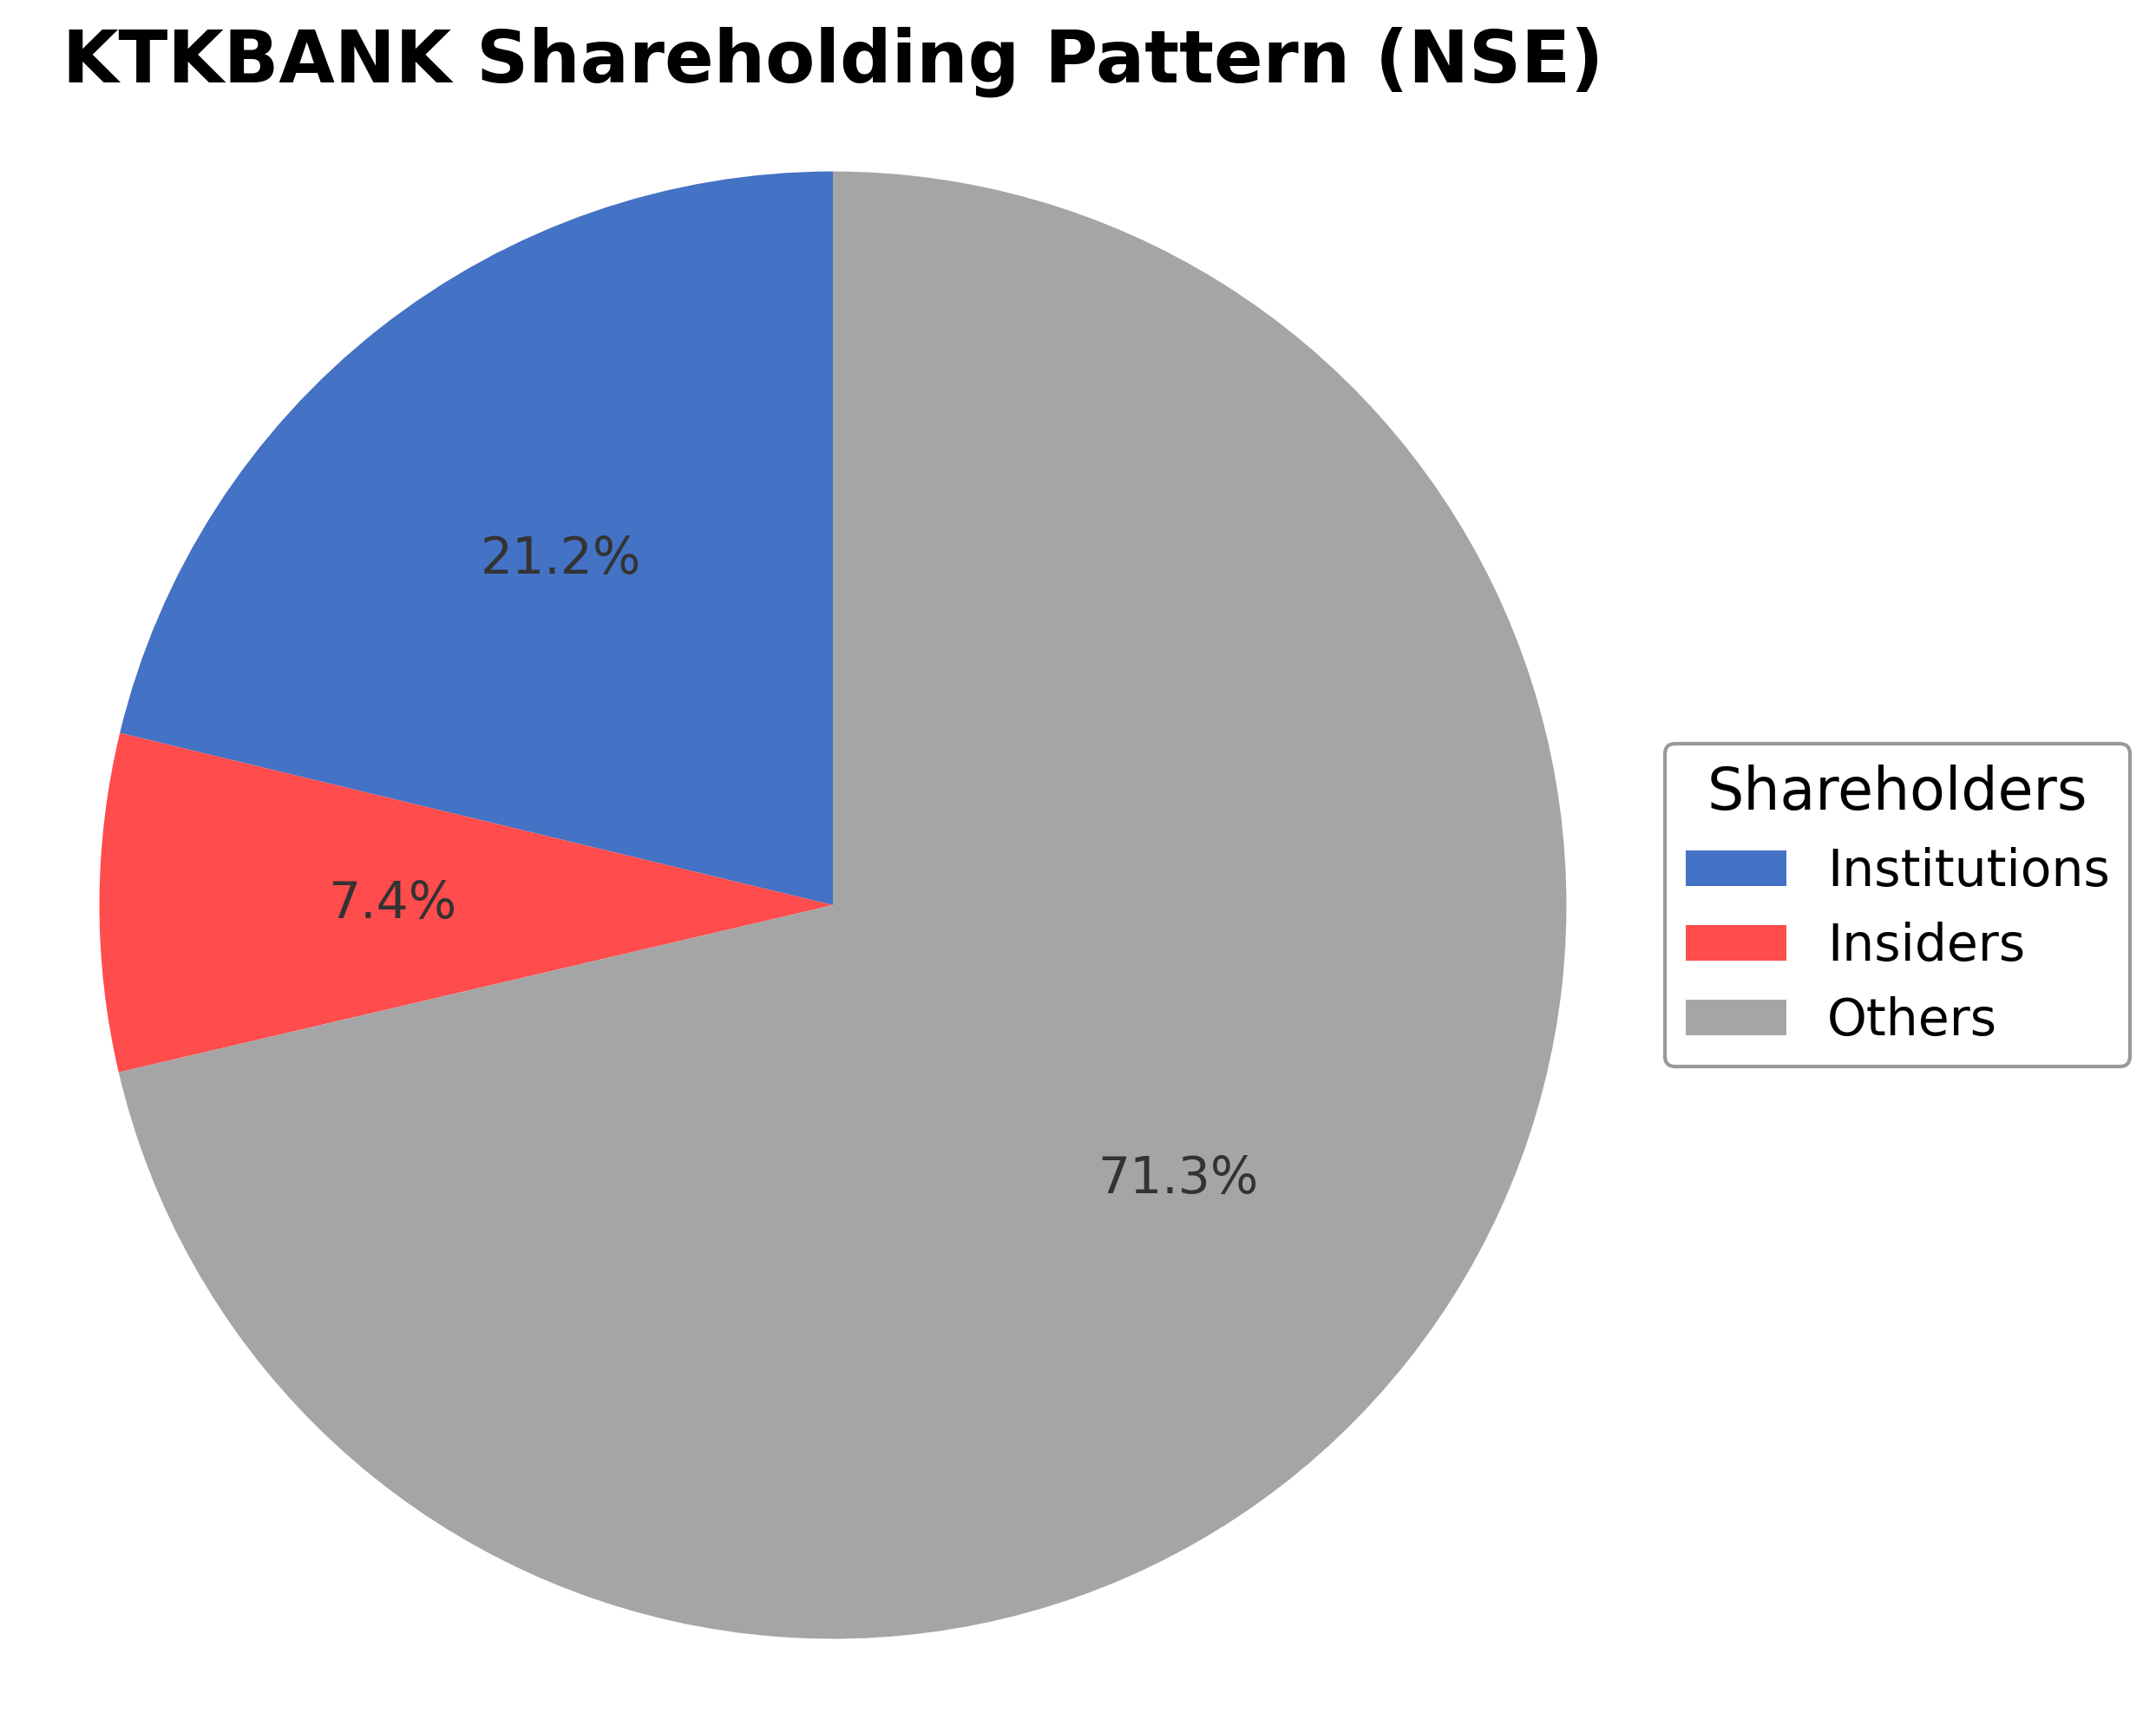
Karnataka Bank Ltd.'s shareholding structure comprises approximately 7.43% held by insiders including executives and board members, while institutional investors such as mutual funds and pension funds hold about 21.23%. The remaining 71.34% is held by public shareholders including retail investors and employee stock plans. Over the past 12-24 months, institutional holdings have shown moderate accumulation, reflecting growing confidence from major funds. This ownership distribution suggests a balanced governance framework with significant public participation and institutional oversight, which may influence strategic decisions and corporate governance positively. The shareholding pattern aligns with typical regional banking sector norms in India, indicating stable market sentiment and potential for sustained operational focus.
Sector and Industry Analysis
The Indian private sector banking sector is a significant component of the country’s financial system, with a market size encompassing numerous mid-sized and large banks serving retail and business customers. The sector has witnessed steady growth driven by increasing financial inclusion, digital payment adoption, and expanding credit demand. Key players include large private banks such as HDFC Bank, ICICI Bank, and Axis Bank, alongside smaller entities like Karnataka Bank, which collectively contribute to a competitive and diverse banking landscape.
Industry trends highlight a shift towards digital transformation, with fintech integration and enhanced payment channels gaining prominence. Competitive dynamics are intense, with larger banks leveraging scale and technology to maintain market share, while smaller banks focus on niche segments and improving asset quality to differentiate themselves. Barriers to entry remain high due to capital requirements, regulatory compliance, and the need for technological infrastructure, positioning established players with strong capital adequacy and asset quality favorably.
The regulatory environment is characterized by oversight from the Reserve Bank of India (RBI), which influences interest rates, capital adequacy norms, and asset classification standards. Recent regulatory changes emphasize risk management, especially concerning credit exposure to sectors like MSMEs, and promote digital banking innovations. These regulations impact profitability and operational strategies, requiring banks to balance growth with prudent risk controls in a dynamic macroeconomic context.
Note: Analysis synthesized from industry research, market reports, and regulatory filings. Information is subject to change based on market conditions.
Financial Ratios Dashboard
Illustrative Scenario Analysis
DCF Assumptions:
Method: Two-Stage EPS-Priority Model
Financials
Peer Analysis
| Company Name | Market Cap | P/E Ratio | P/B Ratio | EV/EBITDA | Price to CFO |
|---|---|---|---|---|---|
| Karnataka Bank Ltd. | ₹100.45B | 7.66 | 0.76 | N/A | -3.50 |
| Ujjivan Small Finance Bank Ltd. | ₹110.78B | 15.60 | 1.56 | N/A | -1.79 |
| Central Bank of India | ₹288.47B | 6.21 | 0.72 | N/A | -0.55 |
| Bank of Maharashtra | ₹685.47B | 9.77 | 2.06 | N/A | -1.25 |
| RBL Bank Ltd. | ₹230.83B | 25.97 | 1.35 | N/A | 20.92 |
| Bandhan Bank Ltd. | ₹339.74B | 26.96 | 1.29 | N/A | -2.43 |
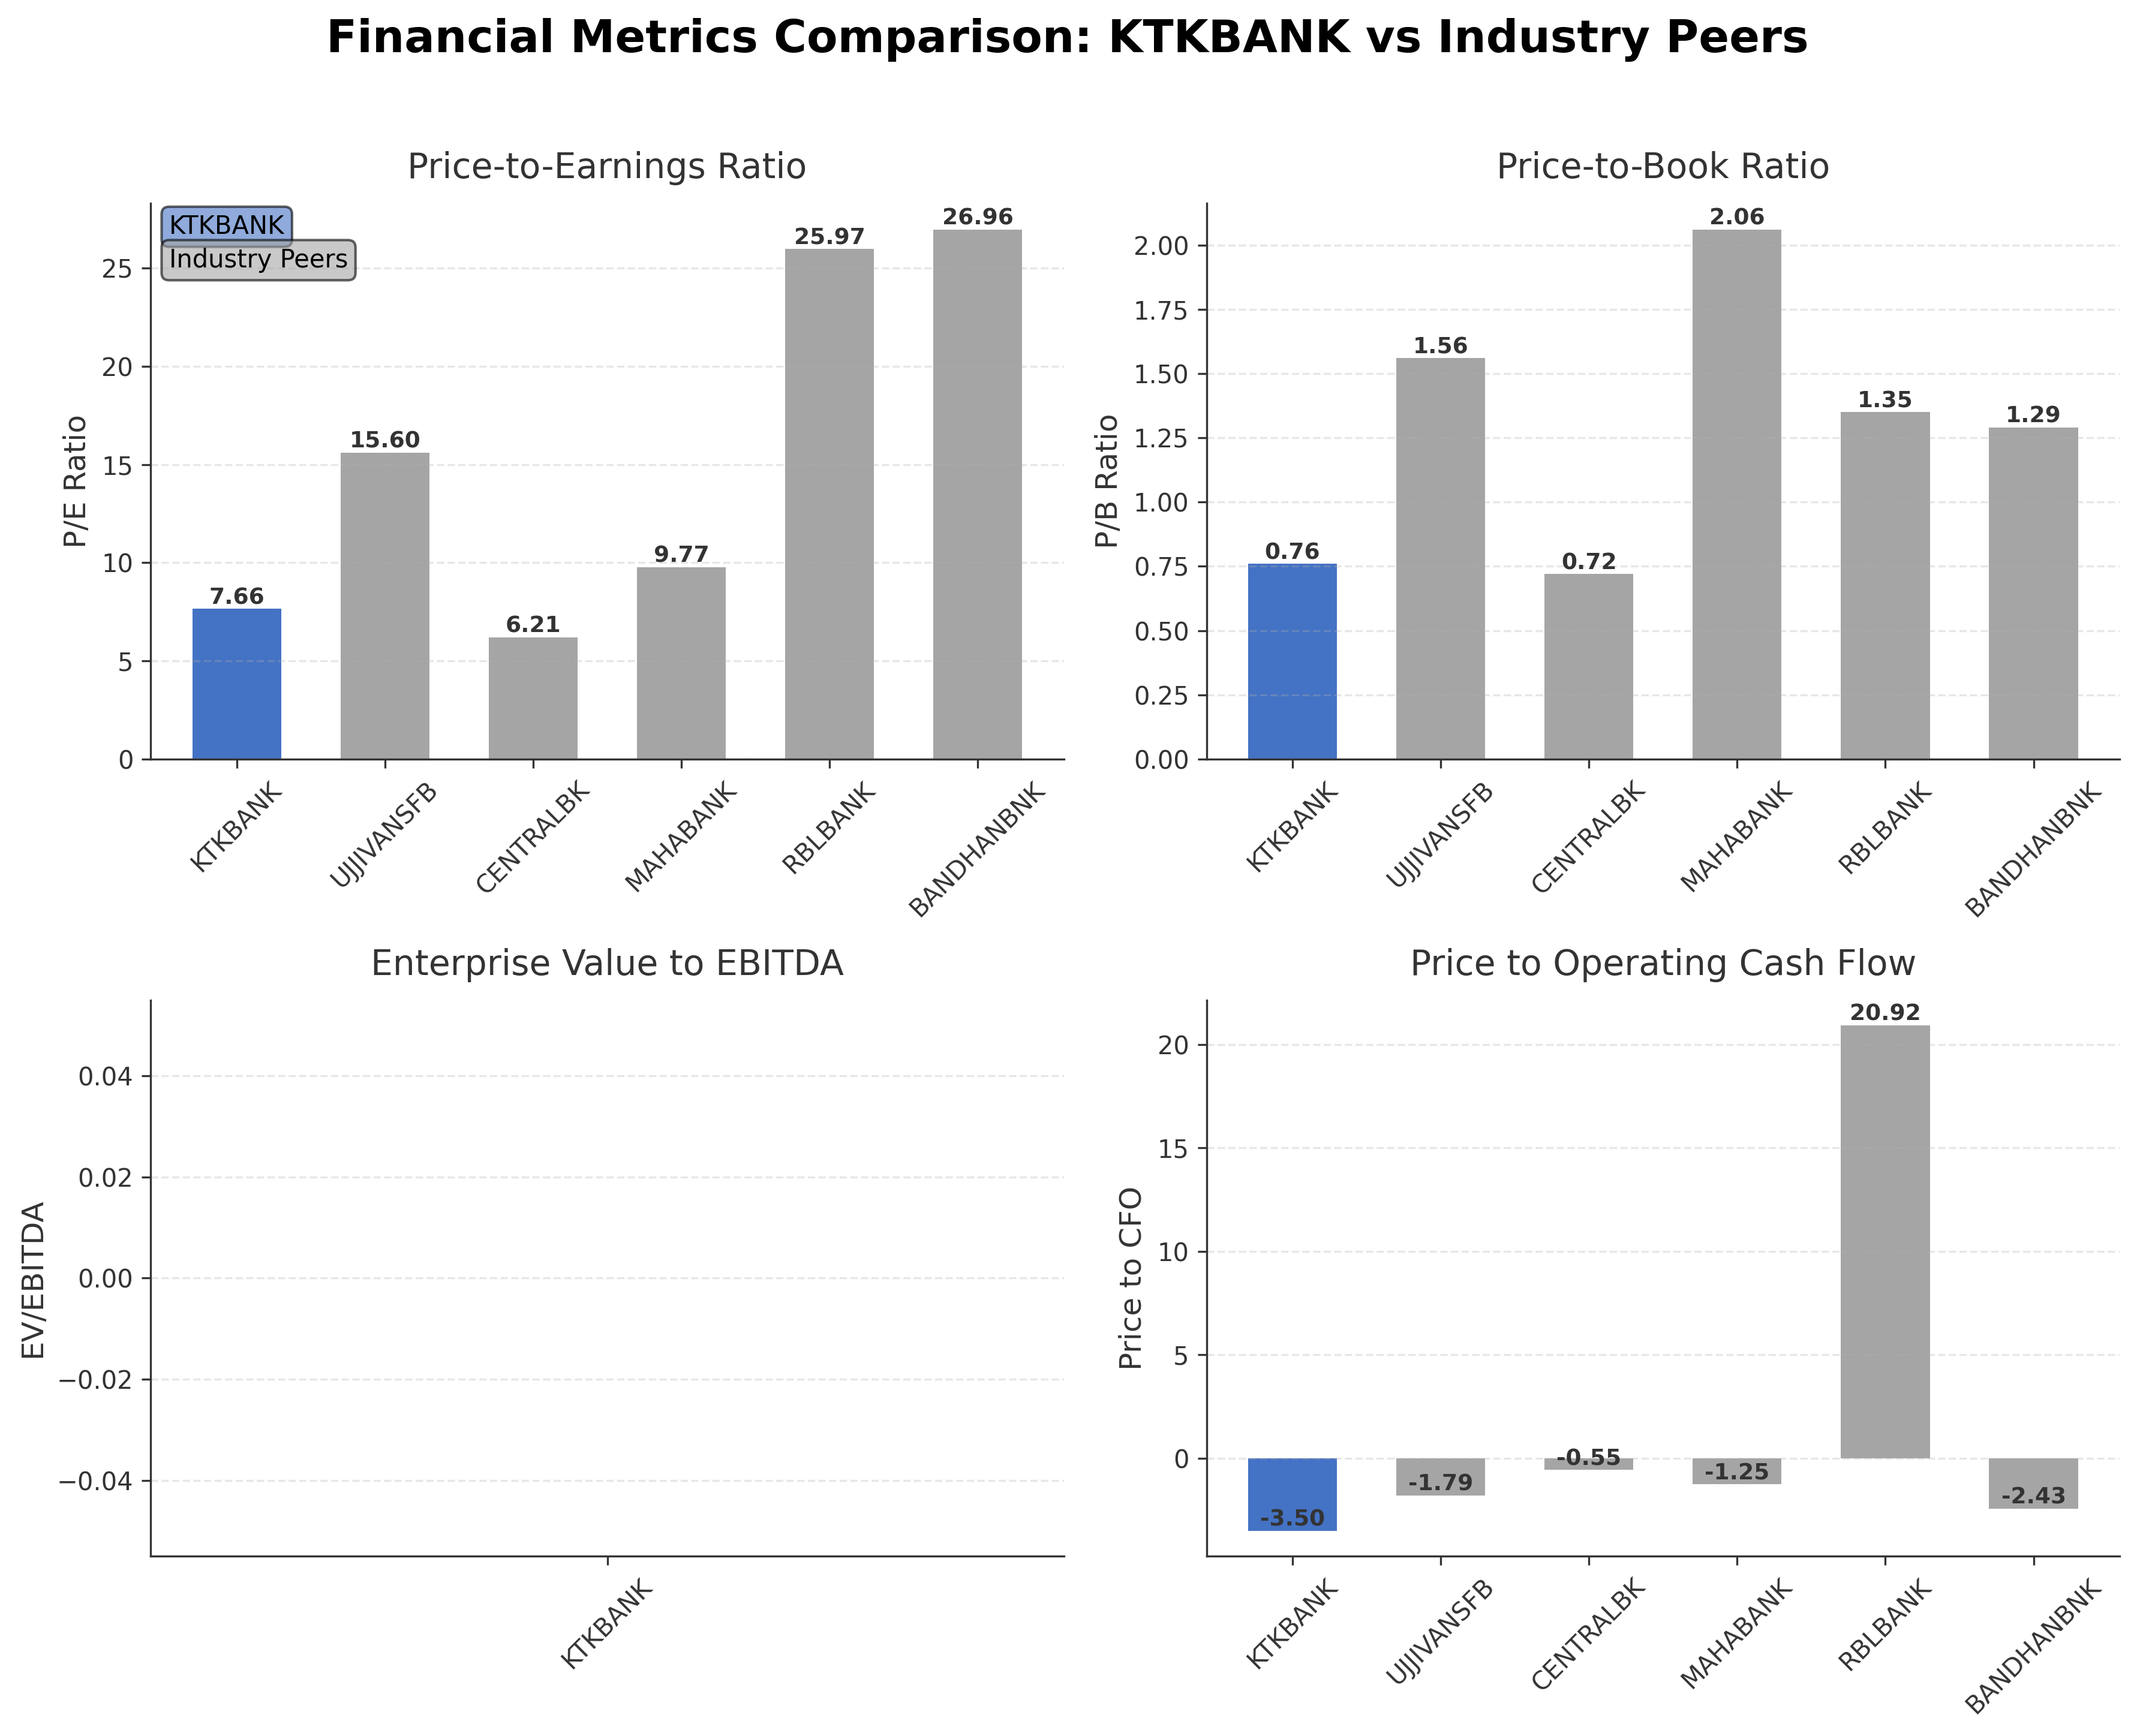
Comparison Analysis: Karnataka Bank Ltd. trades at a lower P/E ratio of 7.66 compared to most peers, indicating a more conservative valuation relative to earnings. Its P/B ratio of 0.76 is also among the lowest, suggesting the stock is priced below book value, which contrasts with higher P/B ratios seen in peers like Bank of Maharashtra and Ujjivan Small Finance Bank. The bank’s return on equity of 10.36% is competitive within the peer group, exceeding that of RBL Bank and Bandhan Bank but trailing Bank of Maharashtra and Central Bank of India. Price to CFO is negative at -3.50, reflecting cash flow challenges relative to price, which is less favorable compared to some peers. Overall, Karnataka Bank presents a value-oriented profile with moderate profitability relative to its regional banking peers.
Financial Metrics Comparison with Peers
Financial Statements
Comprehensive financial data including income, balance sheet, and cash flow metrics
Income Statement
| fiscal_date | 2026-03-31 | 2025-03-31 | 2024-03-31 | 2023-03-31 | 2022-03-31 |
|---|---|---|---|---|---|
| Sales | 45.22B | 45.80B | 46.26B | 41.78B | 34.36B |
| Operating Expense Other Operating Expenses | 12.39B | 7.80B | 6.89B | 3.96B | 7.97B |
| Pretax Income | 16.58B | 16.41B | 15.63B | 14.40B | 6.94B |
| Income Tax | 3.48B | 3.68B | 2.56B | 2.61B | 1.86B |
| Net Income | 13.11B | 12.73B | 13.07B | 11.80B | 5.08B |
| Net Income Continuous Operations | 13.11B | 12.73B | 13.07B | 11.80B | 5.08B |
| Operating Expense Selling General And Administrative | N/A | 277.18M | 279.08M | 261.20M | 202.67M |
| Eps Basic | N/A | 33.70 | 39.85 | 37.87 | 16.36 |
| Eps Diluted | N/A | 33.63 | 39.67 | 37.64 | 16.29 |
| Basic Shares Outstanding | N/A | 377.66M | 327.85M | 311.54M | 310.95M |
| Diluted Shares Outstanding | N/A | 377.66M | 327.85M | 311.54M | 310.95M |
Data provided by Twelve Data
Balance Sheet
| fiscal_date | 2026-03-31 | 2025-03-31 | 2024-03-31 | 2023-03-31 | 2022-03-31 |
|---|---|---|---|---|---|
| Cash And Cash Equivalents | 77.36B | 160.18B | 163.36B | 116.16B | 44.37B |
| Accounts Receivable | N/A | N/A | N/A | N/A | N/A |
| Total Assets | 1293.55B | 1209.60B | 1160.83B | N/A | N/A |
| Total Liabilities | 1161.31B | 1088.76B | 1052.36B | N/A | N/A |
| Long Term Debt | 53.29B | 19.41B | 24.01B | 15.63B | 14.64B |
| Shareholders Equity | 132.24B | 120.85B | 108.48B | 82.12B | 70.94B |
Data provided by Twelve Data
Cash Flow Statement
| fiscal_date | 2026-03-31 | 2025-03-31 | 2024-03-31 | 2023-03-31 | 2022-03-31 |
|---|---|---|---|---|---|
| Operating Activities Net Income | 13.11B | 12.73B | 13.07B | 11.80B | 5.08B |
| Operating Activities Stock Based Compensation | 154.50M | 6.20M | 9.09M | 0.00 | N/A |
| Operating Activities Other Non Cash Items | 900.30M | 901.30M | 901.20M | 1.04B | 1.19B |
| Operating Activities Other Assets Liabilities | -13.04B | -5.19B | -20.80B | -14.70B | 0.00 |
| Operating Activities Operating Cash Flow | 1.12B | 8.44B | -6.82B | -1.87B | 6.27B |
| Investing Activities Capital Expenditures | -878.20M | -1.61B | -1.11B | -870.28M | -559.34M |
| Investing Activities Investing Cash Flow | -878.20M | -1.61B | -1.11B | -875.38M | -564.34M |
| Financing Activities Common Stock Issuance | 18.70M | 42.15M | 14.85B | 65.14M | 17.49M |
| Financing Activities Common Dividends | -1.89B | -2.08B | -1.56B | -1.25B | -559.57M |
| Financing Activities Financing Cash Flow | -1.87B | 4.12B | 15.82B | -194.43M | -3.55B |
| End Cash Position | 77.36B | 79.84B | 79.93B | 61.59B | 44.37B |
| Free Cash Flow | 10.11B | 468.48M | 2.50B | 17.41B | -5.24B |
| Investing Activities Net Acquisitions | N/A | 0.00 | -2.50M | -5.00M | -5.00M |
| Financing Activities Long Term Debt Issuance | N/A | 6.16B | 2.54B | 985.50M | N/A |
| Investing Activities Other Investing Activity | N/A | N/A | N/A | -100.00K | N/A |
| Financing Activities Other Financing Charges | N/A | N/A | N/A | 100.00K | N/A |
| Financing Activities Long Term Debt Payments | N/A | N/A | N/A | N/A | -3.01B |
Data provided by Twelve Data
Technical Analysis
Key Insights
- The current trend is upward with the stock price trading above both the 50-day moving average (₹262.52) and the 200-day moving average (₹214.57), indicating bullish momentum in the medium and long term.
- Key support levels are identified near ₹214.57 (200-day MA) and ₹169.12 (52-week low), while resistance is observed close to the 52-week high of ₹282.95.
- The stock remains above its 10-day, 50-day, and 200-day moving averages, reflecting sustained positive price action across short, medium, and long-term timeframes.
- Momentum indicators such as RSI and MACD show moderate strength without overbought conditions, suggesting room for continued price movement without immediate reversal signals.
- Multi-timeframe analysis reveals consistent upward trends on daily, weekly, and monthly charts, confirming sustained buying interest over various periods.
- Potential market scenarios include continuation of the current uptrend if support levels hold, or consolidation near resistance levels before a possible breakout or retracement.
Trending News
1. Headline: YES Bank, SBI, ICICI Bank, HDFC Bank, BoB, DCB: Check target prices for top banking stocks - BusinessToday
Summary: It also has a 'buy' rating on HDFC ... Rs 355), Karnataka Bank (Target Price: Rs 330) and South Indian Bank (Target Price: Rs 59). It has a 'hold' rating on Kotak Mahindra Bank (Target Price: Rs 434), while it has given a 'sell' rating for YES Bank (Target Price: Rs 19) and Bandhan Bank (Target Price: Rs 140). Disclaimer: Business Today provides stock market news for informational ...
Sentiment: neutral
2. Headline: Stocks To Watch Today: Maruti, Canara Bank, Coal India, NMDC, Maruti Suzuki India, Ola Electric & More In Focus
Summary: Indian markets are expected to open higher on July 2 as firm global cues lift sentiment, while stocks including Canara Bank, Coal India, NMDC, Maruti Suzuki, V2 Retail, JTL Industries, and Ola Electric remain in focus
Sentiment: positive
3. Headline: Top stocks in news: CSM Tech, Coal India, Hero Moto, Airtel, Lupin, Tata Tech, NMDC, Vmart - BusinessToday
Summary: Stocks like CSM Technologies, Coal India, Hero MotoCorp, Bharti Airtel, Lupin, Tata Tech, NMDC, V-Mart, Indian Bank and more will be in the spotlight on Thursday, July 02.
Sentiment: neutral
4. Headline: Stocks in news: Hero MotoCorp, Canara Bank, Bharti Airtel, Indian Hotels, SBI - The Economic Times
Summary: Indian markets opened positively, with analysts suggesting a stock-specific strategy amidst consolidation. Hero MotoCorp sees a revival in commuter bike demand, planning capacity expansion. Canara Bank and Indian Bank reported strong credit growth. Bharti Airtel's NBFC arm has begun operations, ...
Sentiment: positive
Summary: Bangalore, Karnataka, 1st of July, 2026 : Kotak Mahindra Bank Ltd. (“KMBL” / “Kotak”) and Deutsche Bank AG (XETRA: DBKGn.DB / NYSE: DB), acting through its India branch, today announced that they have entered into a definitive agreement for Kotak to acquire Deutsche Bank’s retail banking, ...
Sentiment: positive
Powered by Brave
Recent Updates
News Summary
As of 2026-07-02. Karnataka Bank Ltd. has reported record business growth with total business reaching an all-time high of INR 192,119 crores, marking a 6% sequential increase driven by stronger advances and deposits. The bank's financial achievements have been attributed to ongoing transformational changes under the leadership of Managing Director & CEO Srikrishnan H. Recent quarterly results and unaudited financial disclosures for the period ending December 31, 2025, have been released, reflecting operational progress and strategic focus. These developments underscore the bank's commitment to enhancing its financial position and market presence through disciplined management and growth initiatives.
News Sentiment
The overall sentiment from recent updates is positive, supported by record business growth and management's emphasis on transformational changes. The sequential increase in total business and strong advances indicate operational momentum. Neutral tones in quarterly result announcements reflect transparency and steady progress without unexpected disruptions. This blend of positive business metrics and stable disclosures suggests a constructive outlook grounded in tangible performance improvements.
Source List
- https://www.alphaspread.com/security/nse/ktkbank/investor-relations
- https://economictimes.indiatimes.com/karnataka-bank-ltd/stocksupdate/companyid-12259.cms
- https://www.icicidirect.com/research/equity/rapid-results/karnataka-bank-ltd
- https://www.investywise.com/karnataka-bank-ltd-financial-results-statutory-disclosures-for-q3-fy26/
Analytical Overview
Analysis Summary
Karnataka Bank’s valuation metrics, including a trailing P/E of 7.66 and forward P/E of 6.61, are below the industry average of 7.66, indicating a relatively attractive valuation compared to peers. The PEG ratio of 6.61 suggests moderate growth expectations priced in. Revenue growth shows a slight decline of 1.7% quarterly, but net income growth year-over-year is strong at 61.6%, reflecting improving profitability. Cash flow trends reveal negative operating cash flow of INR -28.7 billion but positive levered free cash flow of INR 13.1 billion, indicating some operational cash challenges offset by financing activities. The debt-to-equity ratio of 0.40 points to moderate leverage, supporting financial stability. Sector-specific challenges include regulatory compliance and competition from larger banks and fintech, while opportunities arise from digital banking expansion and regional market penetration. Considering India-specific factors, the regulatory environment remains supportive of banking sector growth, with rising consumer credit demand and economic recovery bolstering prospects.
Overall Business and Market Assessment
Supporting Factors: No data
Risk Factors: operating cash flow volatility and competitive pressures in the regional banking sector
SWOT Analysis
Strengths
- Strong profitability with a net profit margin of 40.89%.
- Moderate leverage with a debt-to-equity ratio of 0.40.
- Extensive regional presence supported by a robust branch and ATM network.
- Positive return on equity of 10.36% indicating efficient use of shareholder capital.
Weaknesses
- Negative operating cash flow of INR -28.7 billion indicating operational cash challenges.
- Price to CFO ratio of -3.50 suggests cash flow concerns relative to stock price.
- Slight quarterly revenue decline of 1.7% reflecting potential growth headwinds.
- Lower dividend yield at 1.88% compared to historical averages.
Opportunities
- Expansion of digital banking services to enhance customer reach and convenience.
- Growing credit demand in India’s regional markets supporting loan growth.
- Potential for institutional investor accumulation given current ownership trends.
- Sectoral support from favorable regulatory environment in India.
Threats
- Intensifying competition from larger banks and fintech disruptors.
- Regulatory changes that could impact lending practices and capital requirements.
- Macroeconomic uncertainties affecting credit quality and asset growth.
- Market volatility influencing stock price and investor sentiment.
Company Description
Karnataka Bank Ltd. is a prominent private sector bank headquartered in Mangalore, India. It offers a wide range of banking services, including retail, corporate, and NRI banking, catering to diverse customer segments. With a robust network of branches and ATMs spread across India, the bank provides an array of financial products including savings and current accounts, fixed deposits, and loan services such as personal, home, and auto loans. Karnataka Bank also engages in digital banking services to ensure customer convenience. In the financial markets, the bank holds significance due to its extensive service offerings and strong regional presence, contributing to the banking and financial sector's overall growth in India.