


Kalyani Steels Ltd (KSL)
Stock Analysis Report
Stock Journey
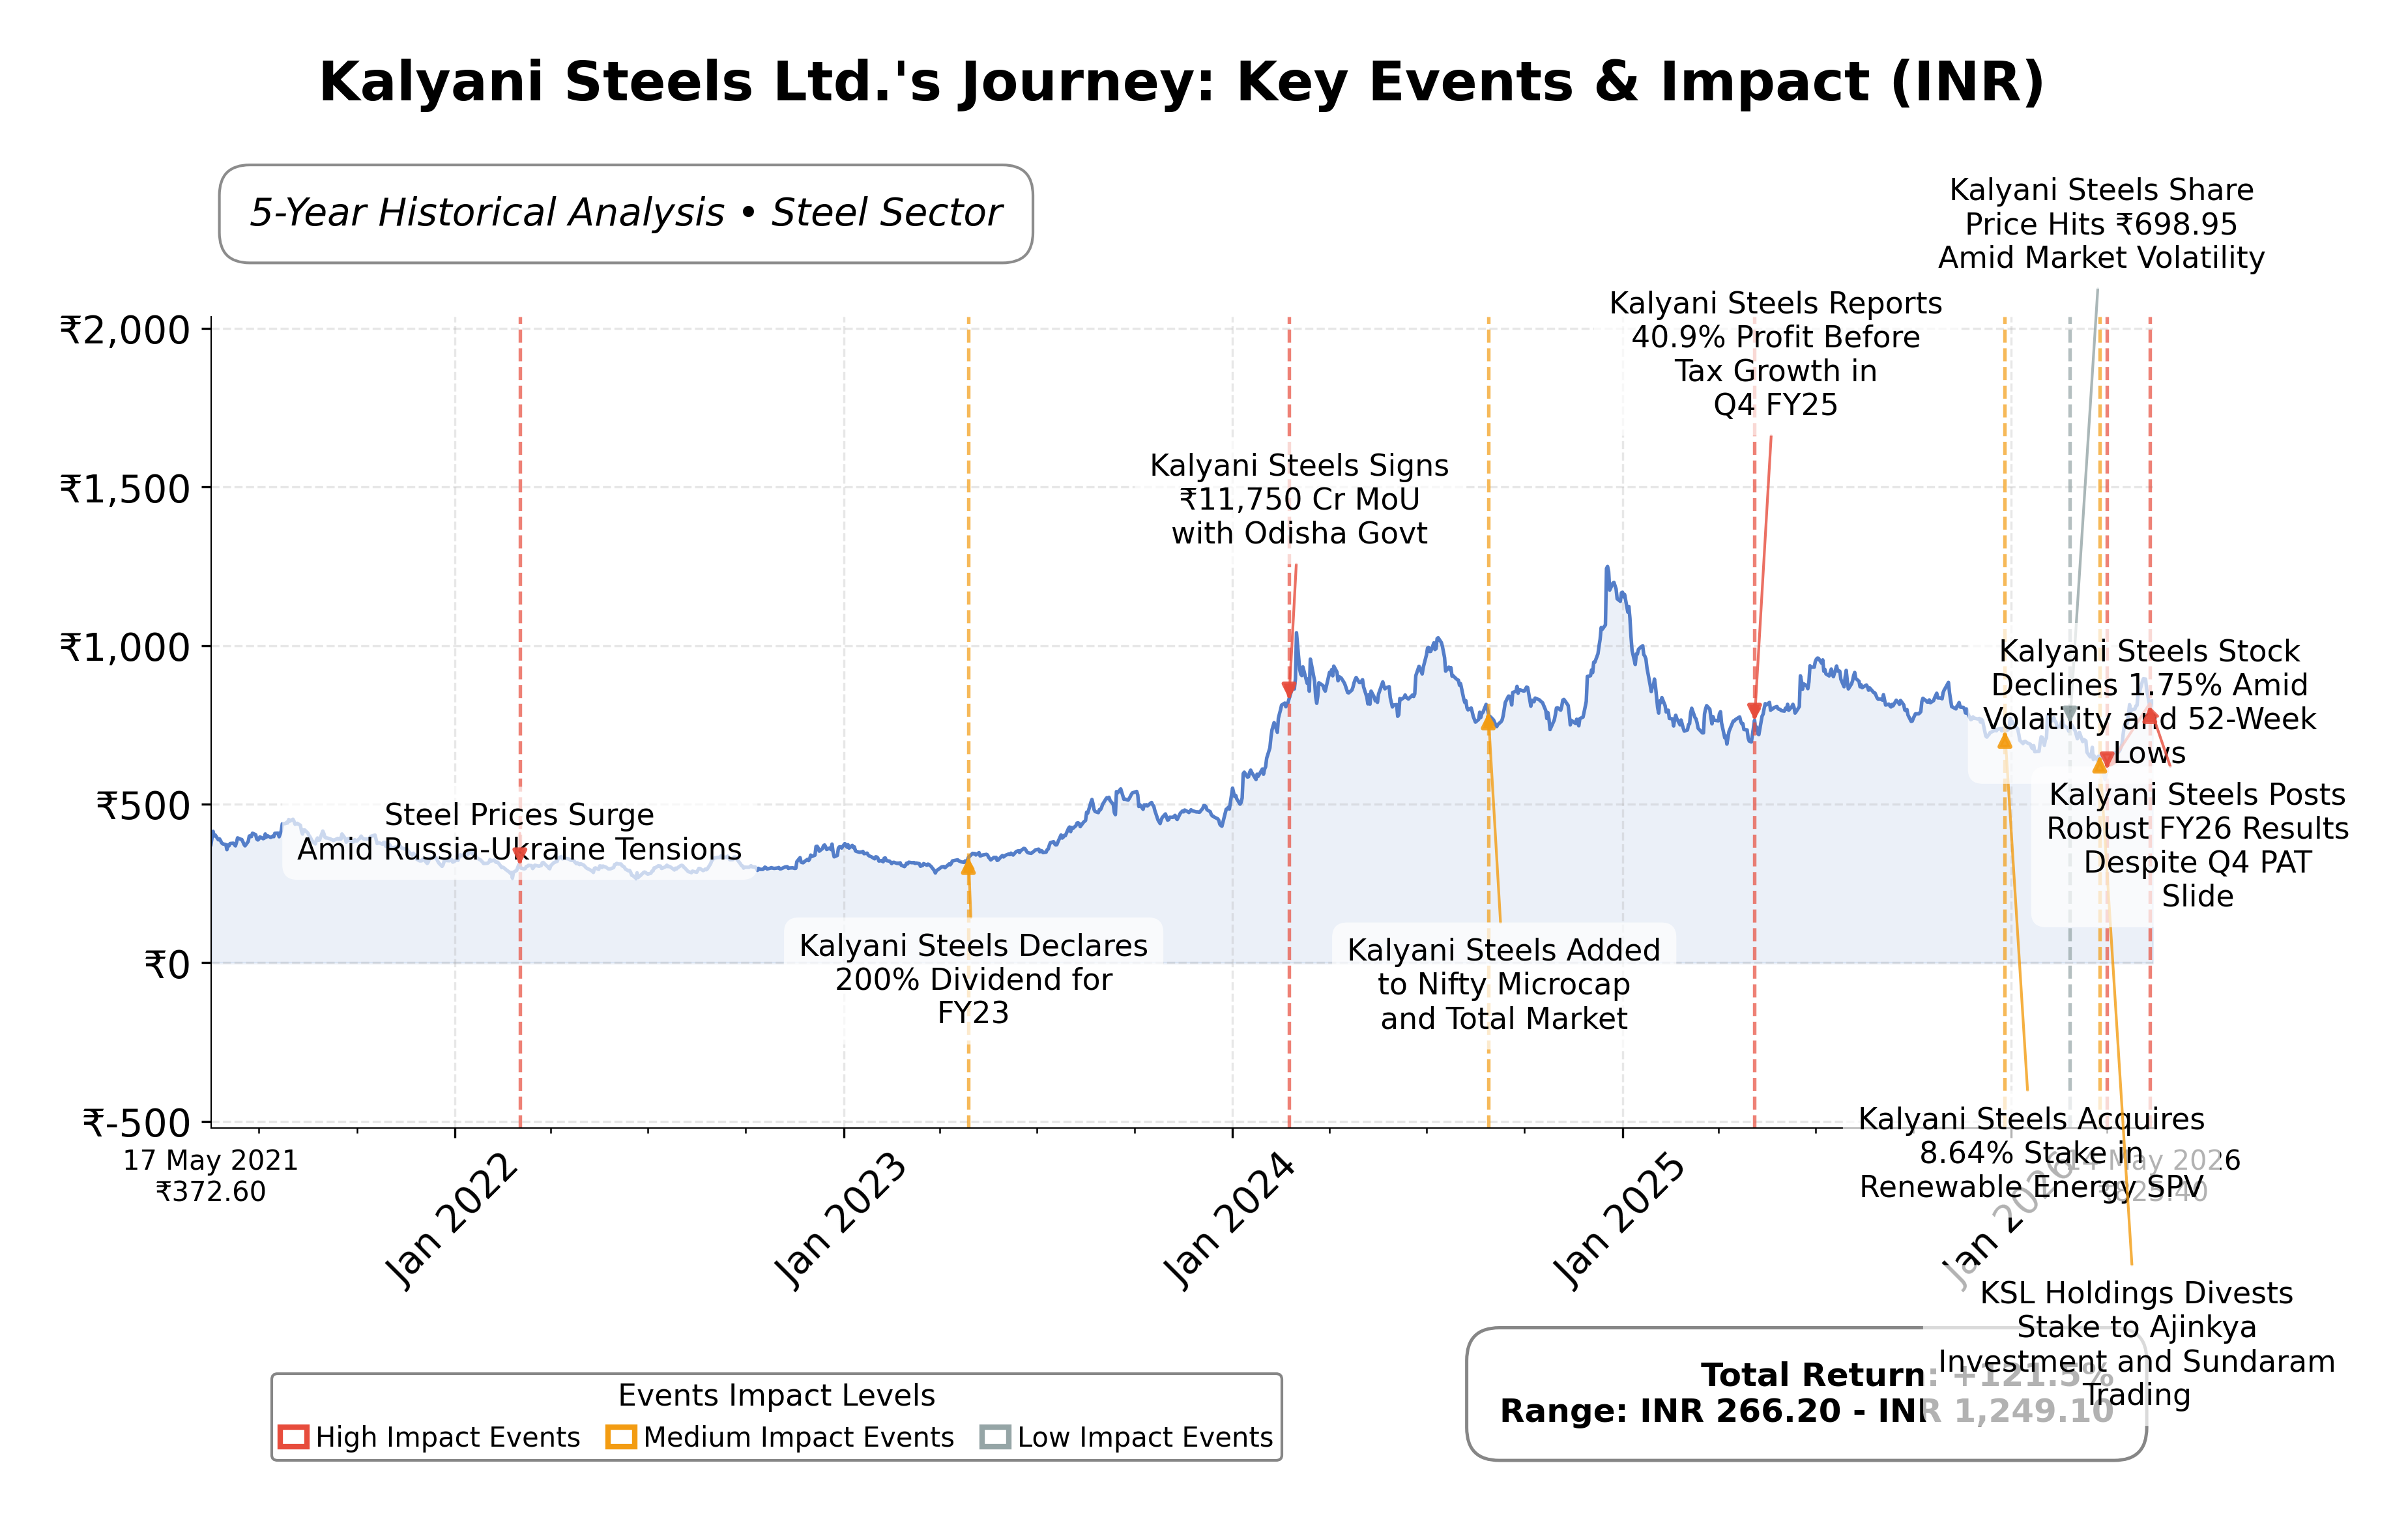
Key Positives and Key Risks
Pros
- Reasonable valuation with a trailing P/E of 13.52 and forward P/E of 9.76, below industry average, indicating potential earnings value.
- Strong return on equity at 13.55% reflecting effective use of shareholder capital.
- Healthy operating cash flow of ₹3.06 billion and free cash flow of ₹2.56 billion supporting financial flexibility.
Cons
- Quarterly revenue declined by 10.2%, indicating recent sales weakness.
- Consolidated net profit fell by 10.62% in the March 2026 quarter, signaling margin pressures.
- Total cash reported as zero in the most recent quarter, which may constrain liquidity.
Disclosure: This information is for general awareness and does not constitute investment advice
Report Summary
Kalyani Steels Ltd. (KSL) operates as a key player in the Indian steel industry, specializing in manufacturing steel products that serve critical sectors such as automotive, engineering, and energy. Listed on the NSE under the Basic Materials sector, the company leverages advanced manufacturing facilities and is part of the larger Kalyani Group, which enhances its market positioning through synergies within its subsidiaries. Its product portfolio includes alloy and carbon steels, supporting infrastructure and industrial development both domestically and internationally.
Financially, Kalyani Steels reported trailing twelve months (TTM) revenue of approximately ₹14.14 billion with a gross margin of 29.87%, operating margin of 13.82%, and net profit margin of 8.6%. The company’s return on equity (ROE) stands at 13.55%, and return on assets (ROA) at 9.38%, indicating efficient utilization of equity and assets to generate profits. The operating cash flow of ₹3.06 billion and levered free cash flow of ₹2.56 billion underscore solid cash generation capabilities despite a 10.2% quarterly revenue decline.
Valuation metrics show a trailing price-to-earnings (P/E) ratio of 13.52 and a forward P/E of 9.76, suggesting a discount relative to future earnings expectations. The price-to-book (P/B) ratio is 1.90, and enterprise value to EBITDA (EV/EBITDA) is 9.35, reflecting moderate valuation levels compared to industry peers. The stock trades at ₹810 within a 52-week range of ₹574 to ₹988.8, positioning it closer to the mid-to-upper range of its recent trading band.
Kalyani Steels’ strengths include a manageable debt-to-equity ratio of 0.22, strong dividend yield of approximately 4.94% forward, and consistent profitability with stable ROE and ROA. Risks involve recent quarterly revenue contraction, regulatory impacts such as new labor codes affecting wage definitions, and competitive pressures in the steel sector. Recent strategic developments include leadership appointments of a new CFO and an additional independent director, alongside a declared dividend of ₹10 per share, signaling confidence in financial health.
Technically, the stock is trading near its 50-day moving average of ₹722 and below the 200-day average of ₹769, with momentum indicators suggesting mixed signals. Recent news reflects both positive earnings results and some downgrades due to quality concerns. Overall, the data suggests a cautious stance with potential for accumulation if fundamentals stabilize, balanced by the need to monitor operational and market developments closely.
Company and Industry Overview
Company Basics
Price Performance
Company Size
Shareholding Pattern
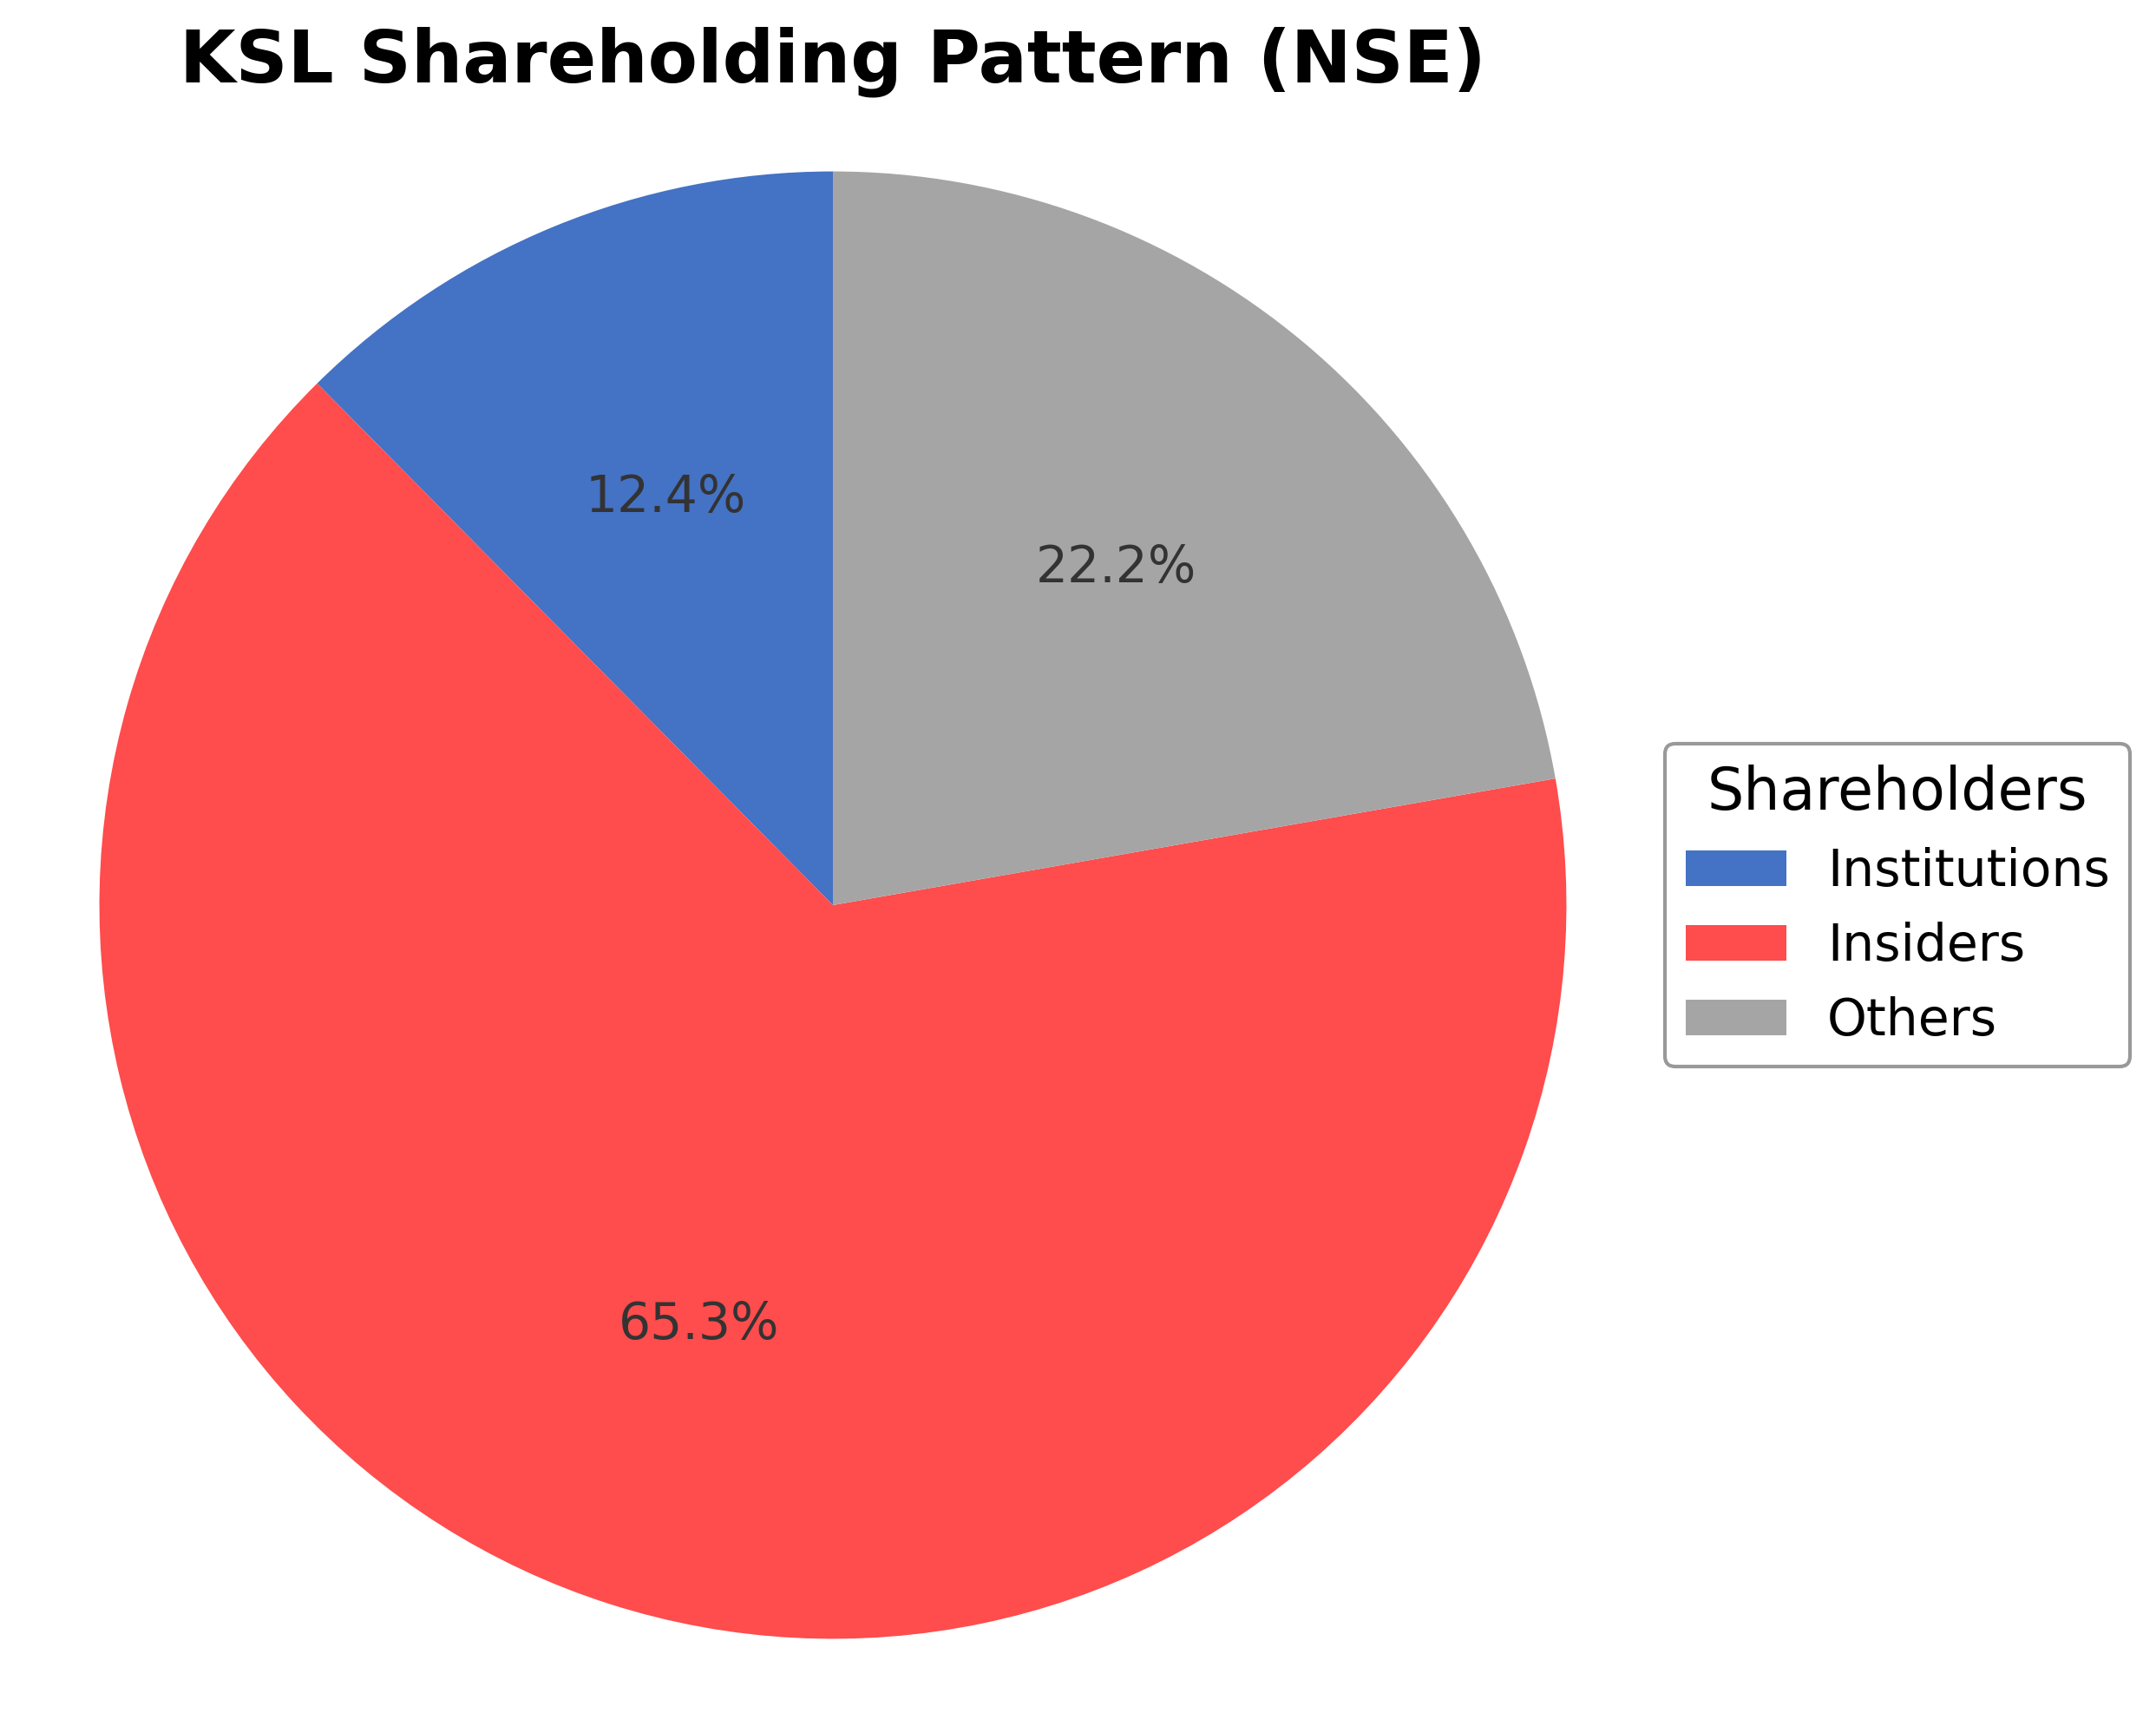
Kalyani Steels Ltd. has a shareholding structure dominated by insiders, including executives and board members, holding approximately 65.36% of shares, reflecting strong promoter control. Institutional investors hold about 12.41%, indicating moderate institutional interest, while public and other shareholders account for the remaining 22.23%. Over the past 12 to 24 months, insider ownership has remained stable, with no significant dilution, while institutional holdings have shown slight accumulation, suggesting cautious confidence from mutual funds and asset managers. This ownership pattern implies a governance structure with strong promoter influence, balanced by institutional oversight, which may support strategic continuity and operational stability. The steel industry context remains competitive with regulatory challenges and cyclical demand, but Kalyani Steels’ positioning within the sector benefits from its diversified product base and integration within the Kalyani Group.
Sector and Industry Analysis
The Indian steel sector is a significant contributor to the country’s industrial output, with a market size exceeding 100 million tonnes annually. It has experienced moderate growth driven by infrastructure development, automotive demand, and urbanization, with key players including Tata Steel, JSW Steel, and Steel Authority of India Limited (SAIL). The sector’s growth trajectory is influenced by domestic consumption and export opportunities, supported by government initiatives to boost manufacturing.
Within the steel industry, the manufacturing of specialized steel products such as automotive components and engineering bars is gaining prominence. Competitive dynamics are shaped by technological advancements, cost efficiencies, and product quality, with established firms leveraging scale and integrated operations. Barriers to entry include high capital expenditure, access to raw materials, and stringent quality standards, positioning companies like Kalyani Steels Ltd in niche segments such as camshafts and transmission shafts for automotive applications.
The regulatory environment for the steel sector in India involves compliance with environmental norms, import-export duties, and quality certifications. Policies promoting domestic manufacturing under schemes like Make in India and infrastructure spending positively impact demand. However, fluctuations in raw material tariffs and environmental regulations require companies to maintain operational flexibility and invest in sustainable practices to align with evolving standards.
Note: Analysis synthesized from industry research, market reports, and regulatory filings. Information is subject to change based on market conditions.
Financial Ratios Dashboard
Illustrative Scenario Analysis
DCF Assumptions:
Method: Two-Stage EPS-Priority Model
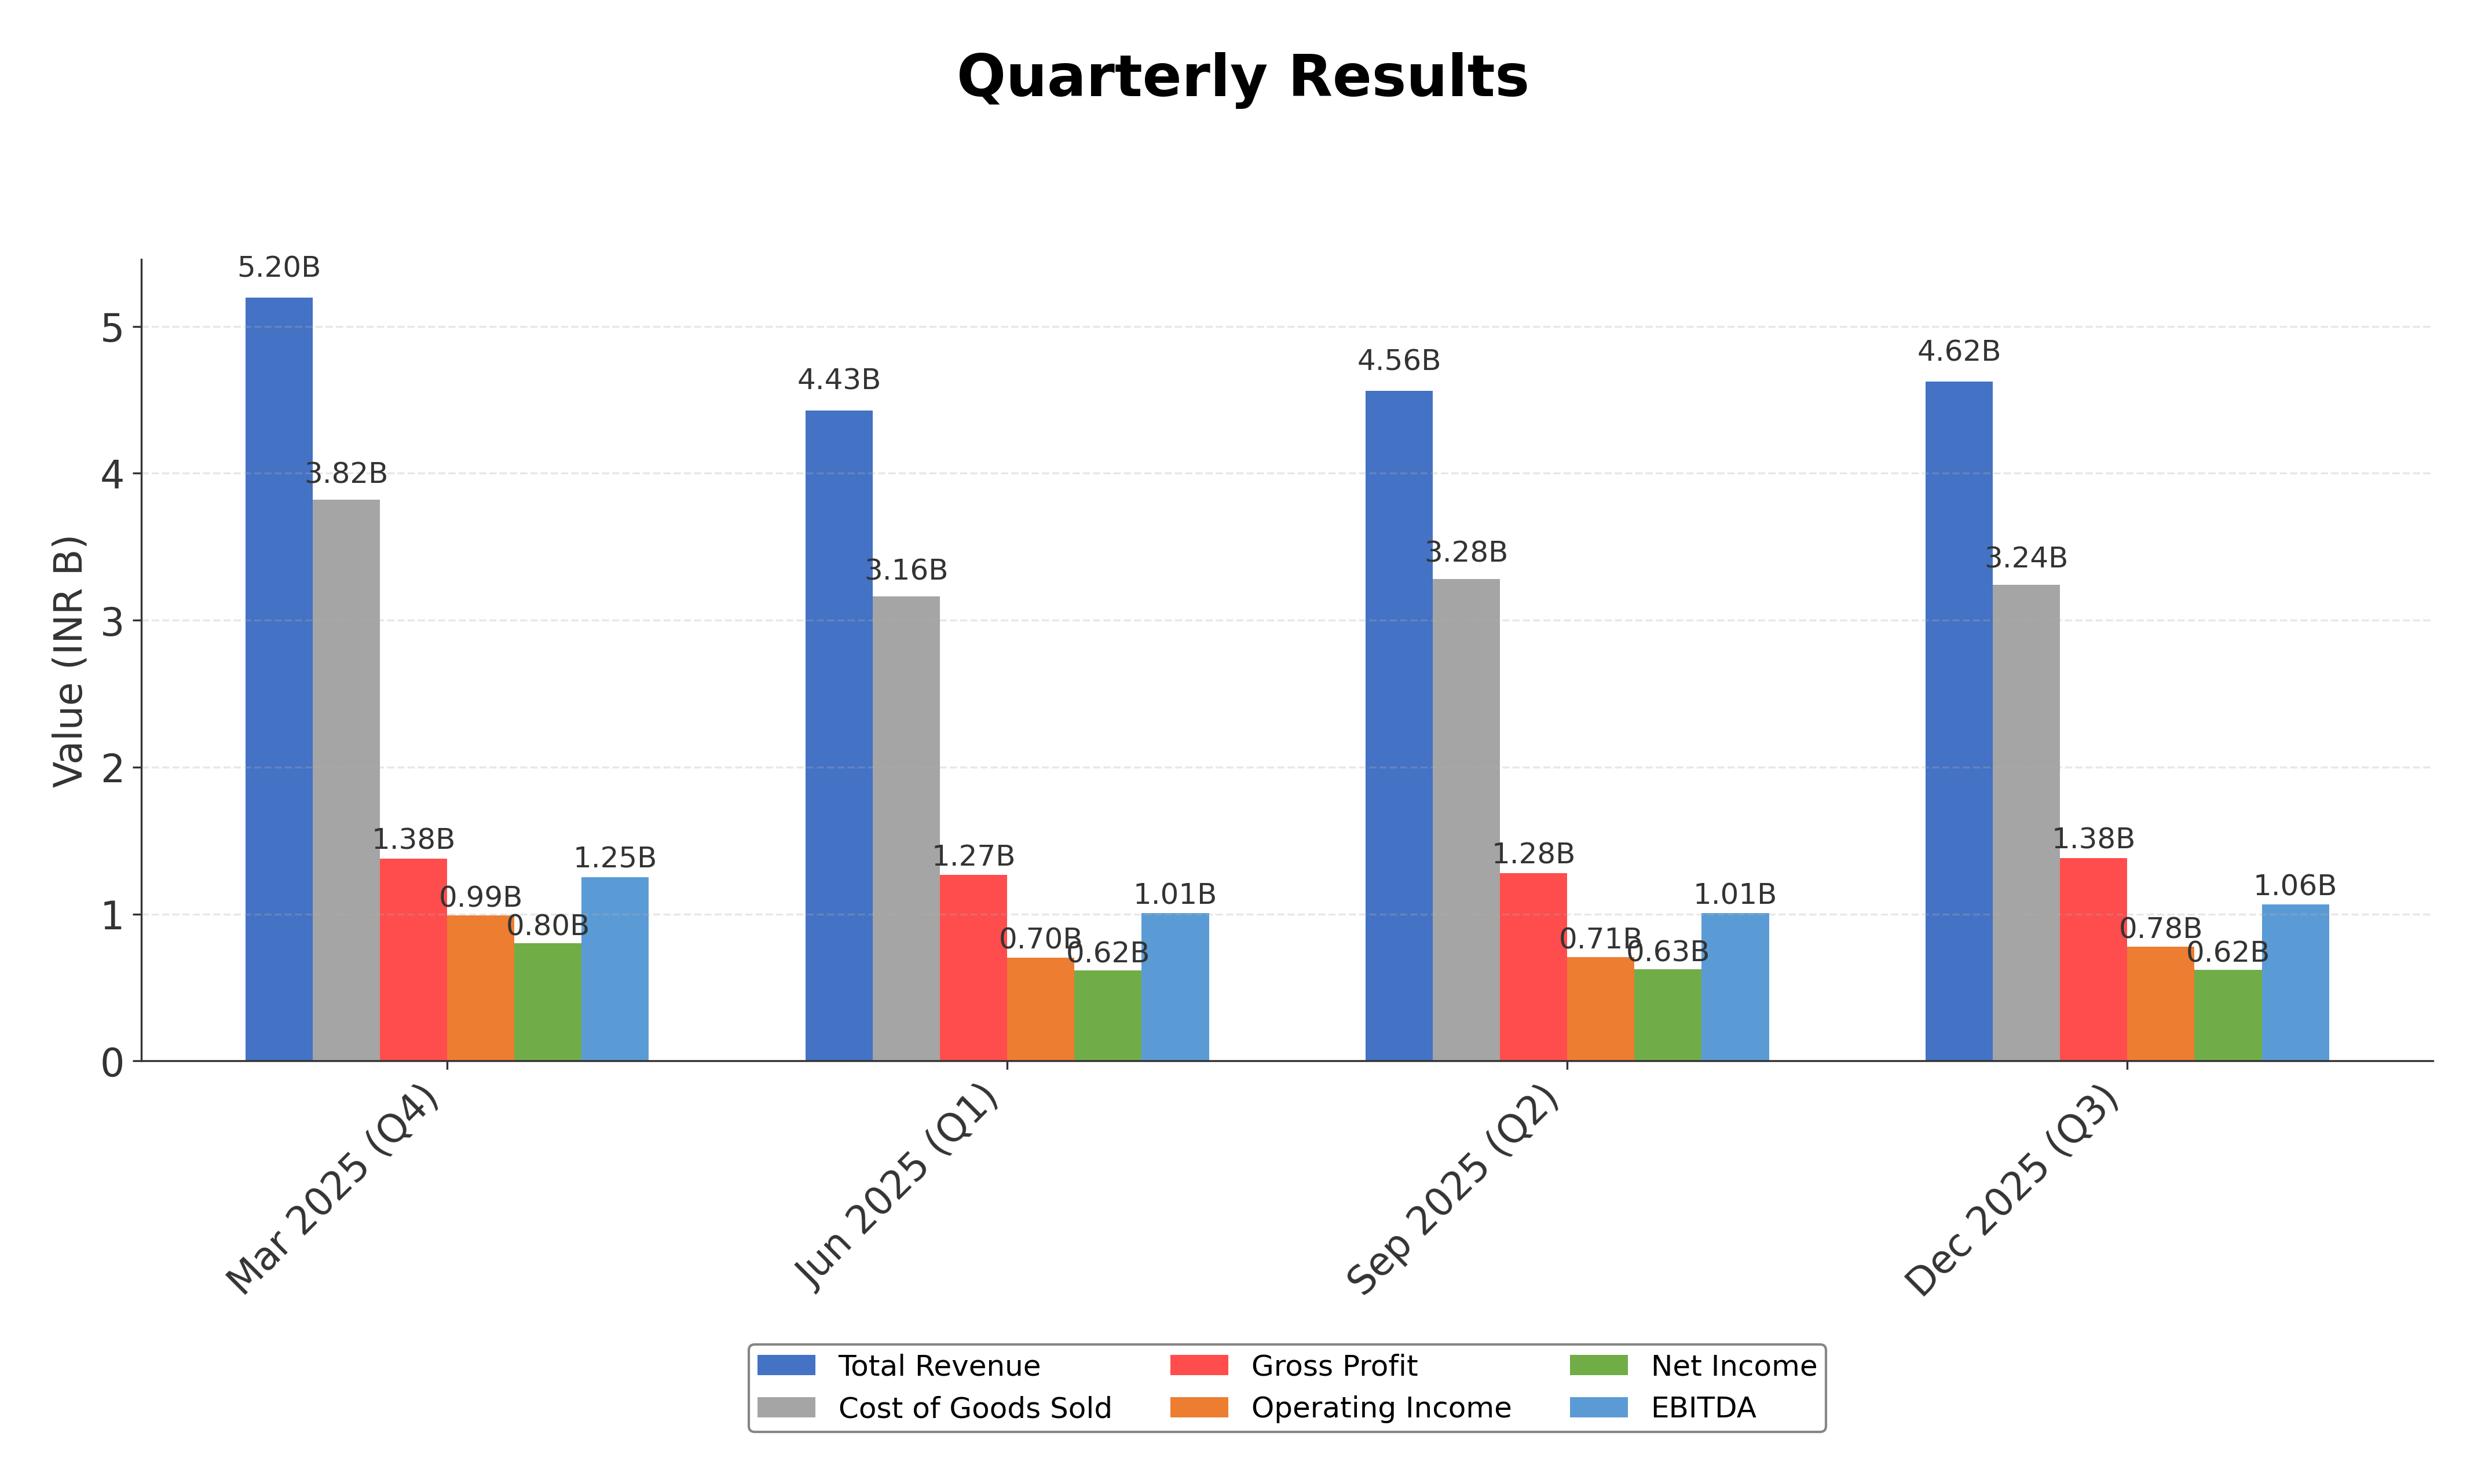
Financials
Peer Analysis
| Company Name | Market Cap | P/E Ratio | P/B Ratio | EV/EBITDA | Price to CFO |
|---|---|---|---|---|---|
| Kalyani Steels Ltd. | ₹35.54B | 13.52 | 1.90 | 9.35 | 11.63 |
| Nmdc Steel Ltd. | ₹127.95B | -5.39 | 0.99 | 24.90 | -9.71 |
| Jindal Steel & Power Ltd. | ₹1.27T | 37.73 | 2.56 | 14.94 | 17.63 |
| Apl Apollo Tubes Ltd. | ₹541.05B | 44.96 | 10.23 | 30.20 | 25.72 |
| Steel Authority of India Limited | ₹763.65B | 27.43 | 1.32 | 10.10 | 7.78 |
| Jindal Saw Ltd. | ₹155.55B | 16.03 | 1.29 | 8.75 | 8.78 |
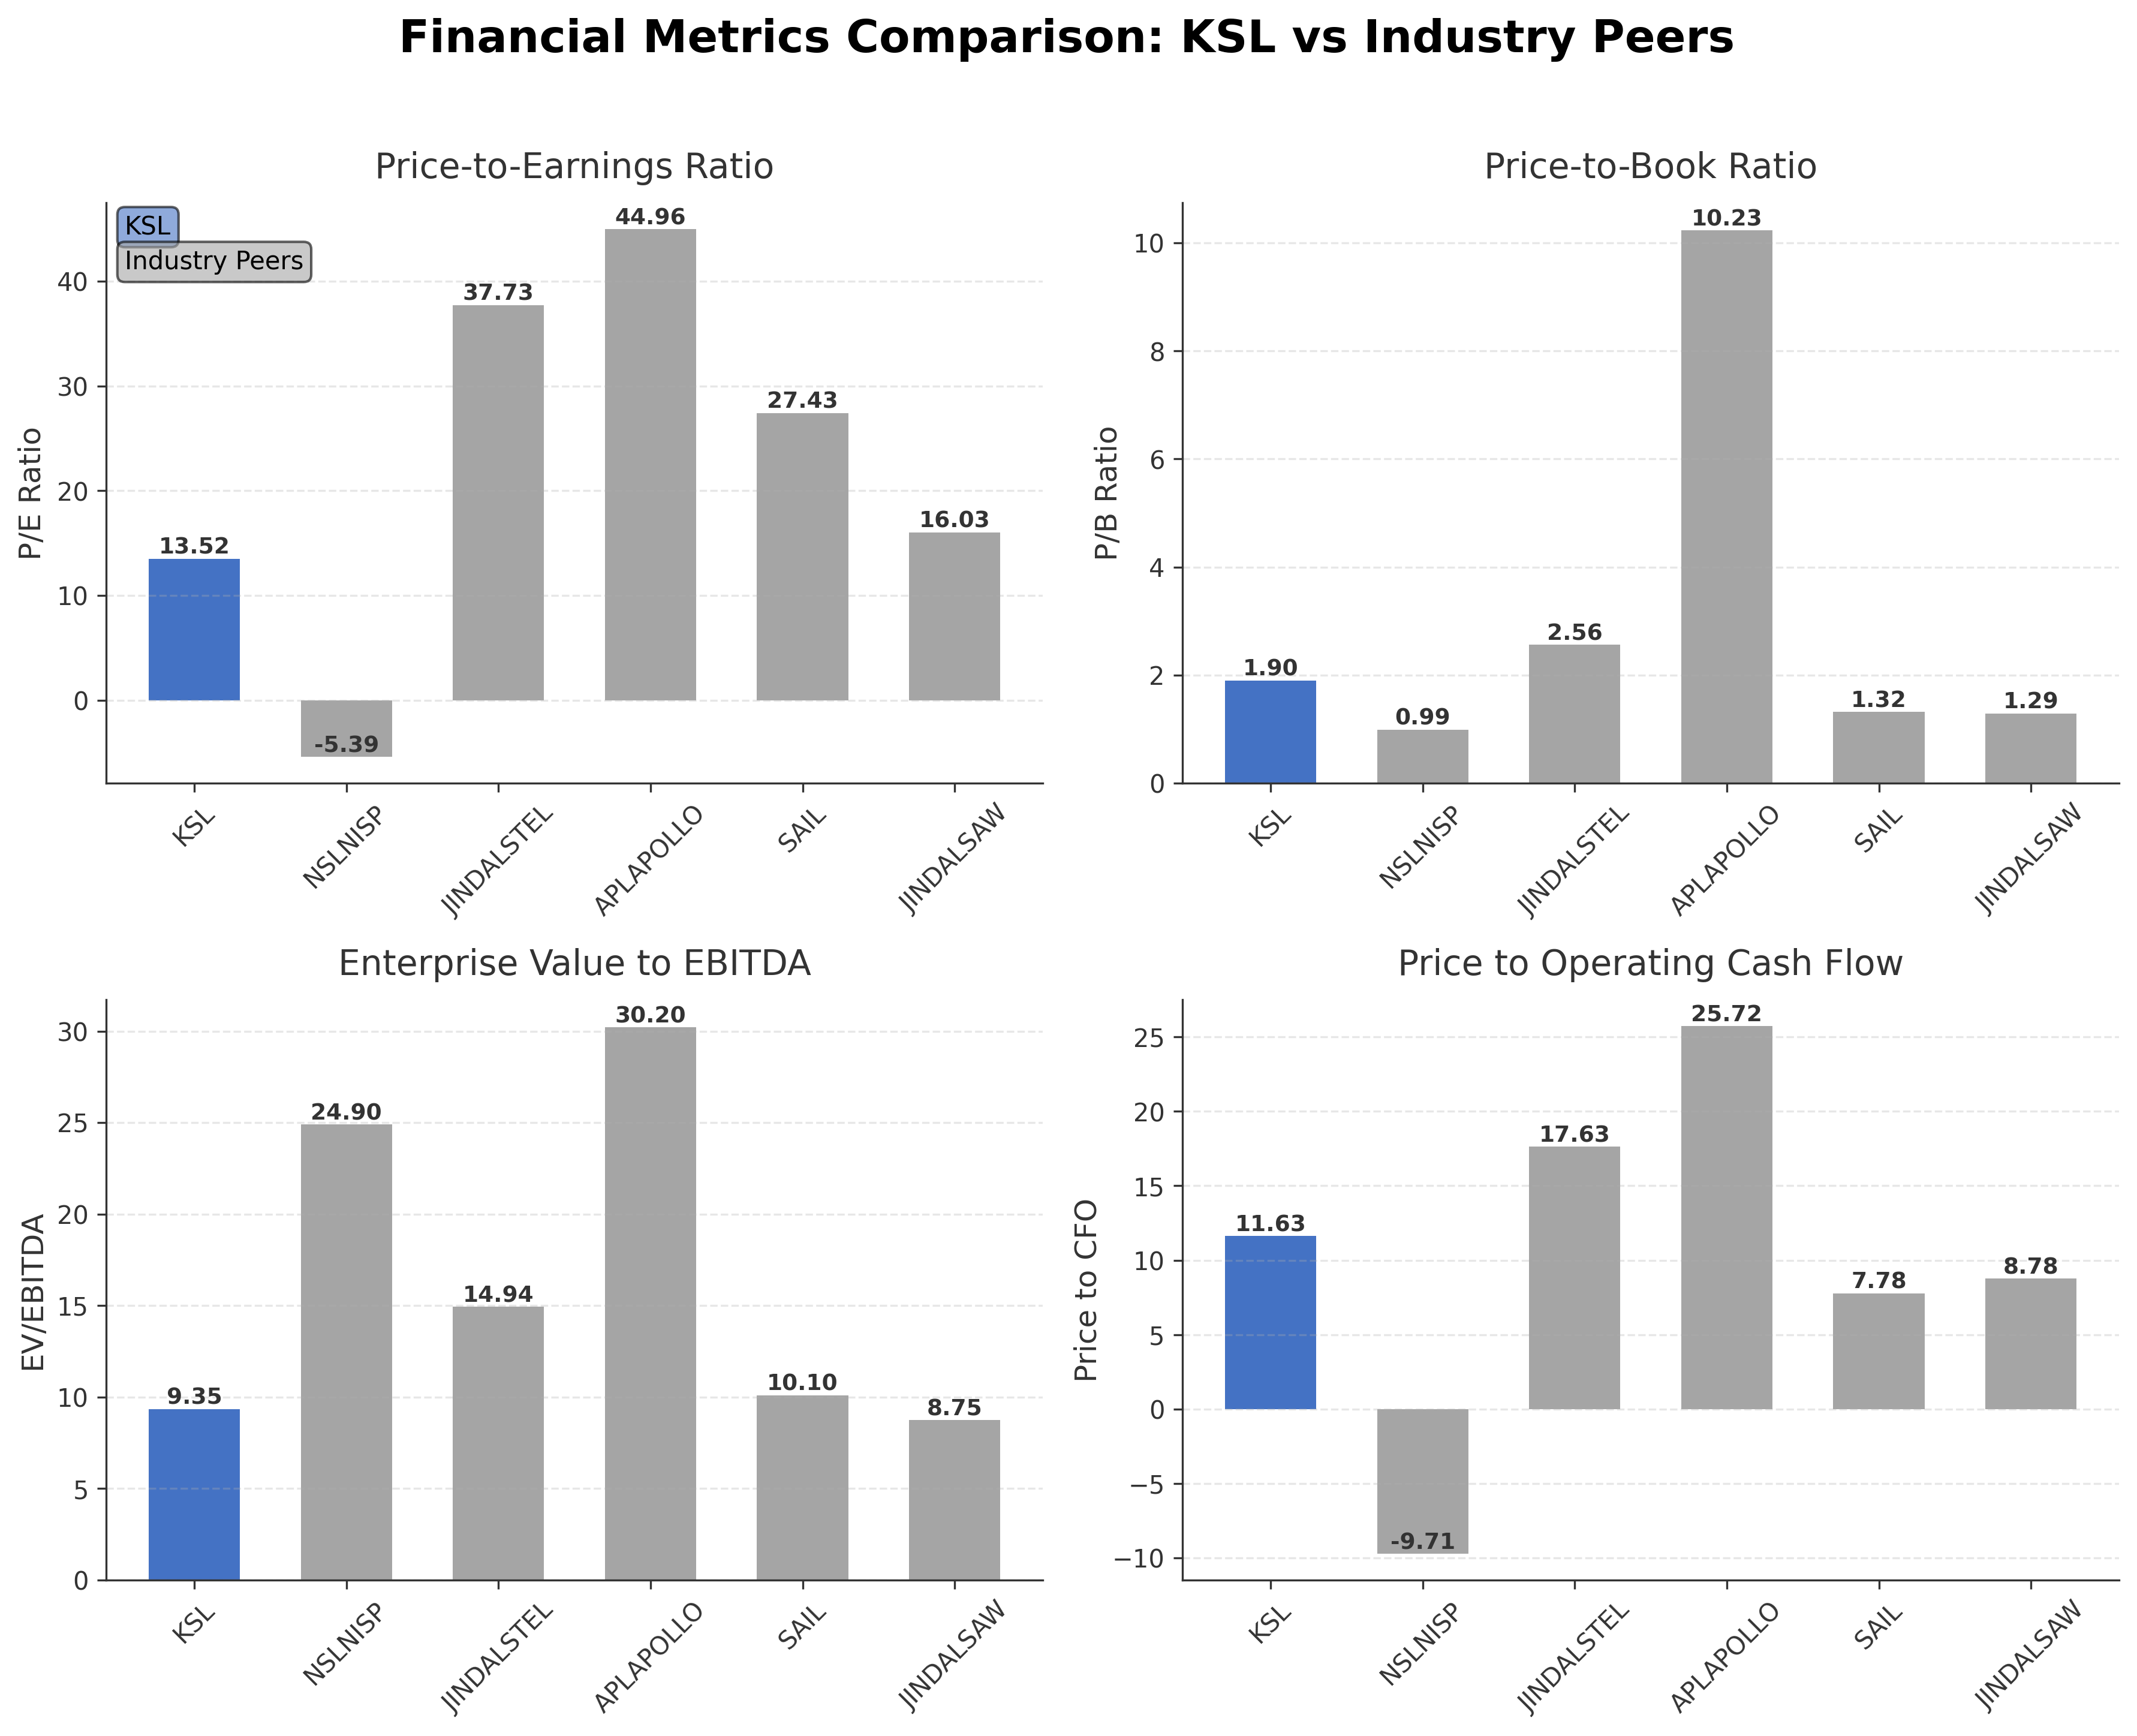
Comparison Analysis: Kalyani Steels Ltd. trades at a moderate valuation with a P/E of 13.52 and P/B of 1.90, which is lower than several peers such as Apl Apollo Tubes Ltd. and Jindal Steel & Power Ltd., indicating relatively more conservative pricing. Its EV/EBITDA of 9.35 is competitive within the peer group, reflecting efficient earnings generation relative to enterprise value. The company’s return on equity of 13.55% surpasses several peers including Steel Authority of India and Jindal Steel, highlighting better profitability. However, it lags behind high-performing peers like Apl Apollo Tubes Ltd. in ROE and growth metrics. Overall, Kalyani Steels presents a balanced profile with moderate valuation and solid profitability compared to regional industry players.
Financial Metrics Comparison with Peers
Financial Statements
Comprehensive financial data including income, balance sheet, and cash flow metrics
Income Statement
| fiscal_date | 2025-03-31 | 2024-03-31 | 2023-03-31 | 2022-03-31 | 2021-03-31 |
|---|---|---|---|---|---|
| Sales | 19.57B | 19.30B | 18.74B | 16.76B | 11.66B |
| Cost Of Goods | 14.25B | 14.22B | 14.71B | 12.35B | 8.15B |
| Gross Profit | 5.33B | 5.08B | 4.03B | 4.41B | 3.51B |
| Operating Expense Selling General And Administrative | 611.92M | 635.90M | 642.12M | 540.16M | 403.88M |
| Operating Expense Other Operating Expenses | 347.39M | 171.50M | 152.97M | 63.99M | 10.15M |
| Operating Income | 3.10B | 3.10B | 2.31B | 2.93B | 2.19B |
| Non Operating Interest Income | 531.11M | 449.22M | 551.37M | 458.55M | 308.36M |
| Non Operating Interest Expense | 177.27M | 253.60M | 272.69M | 109.87M | 37.94M |
| Pretax Income | 3.46B | 3.33B | 2.25B | 3.26B | 2.55B |
| Income Tax | 900.61M | 843.18M | 580.33M | 829.21M | 647.35M |
| Net Income | 2.56B | 2.49B | 1.67B | 2.43B | 1.90B |
| Eps Basic | 58.70 | 56.99 | 38.26 | 55.65 | 43.59 |
| Eps Diluted | 58.70 | 56.99 | 38.26 | 55.65 | 43.59 |
| Basic Shares Outstanding | 43.65M | 43.65M | 43.65M | 43.65M | 43.65M |
| Diluted Shares Outstanding | 43.65M | 43.65M | 43.65M | 43.65M | 43.65M |
| Ebit | 3.64B | 3.58B | 2.52B | 3.37B | 2.59B |
| Ebitda | 4.25B | 4.17B | 3.01B | 3.82B | 3.00B |
| Net Income Continuous Operations | 3.46B | 3.33B | 2.25B | 3.26B | 2.55B |
| Minority Interests | 110.00K | 10.00K | N/A | -35.72M | 2.98M |
| Preferred Stock Dividends | 0.00 | 0.00 | 0.00 | 0.00 | 0.00 |
Source: Financial statements and regulatory filings
Balance Sheet
| fiscal_date | 2025-03-31 | 2024-03-31 | 2023-03-31 | 2022-03-31 | 2021-03-31 |
|---|---|---|---|---|---|
| Cash And Cash Equivalents | 143.06M | 193.68M | 105.07M | 221.48M | 113.38M |
| Accounts Receivable | 4.31B | 4.21B | 4.05B | 4.16B | 2.49B |
| Total Assets | 27.32B | 25.73B | 23.51B | 23.56B | 16.50B |
| Total Liabilities | 8.41B | 8.93B | 8.61B | 9.89B | 5.01B |
| Long Term Debt | 0.00 | 833.74M | 1.85B | 1.90B | 232.71M |
| Shareholders Equity | 18.92B | 16.80B | 14.89B | 13.67B | 11.49B |
Source: Financial statements and regulatory filings
Cash Flow Statement
| fiscal_date | 2025-03-31 | 2024-03-31 | 2023-03-31 | 2022-03-31 | 2021-03-31 |
|---|---|---|---|---|---|
| Operating Activities Net Income | 3.46B | 3.33B | 2.25B | 3.26B | 2.55B |
| Operating Activities Other Non Cash Items | -345.45M | -191.09M | -270.41M | -326.46M | -237.45M |
| Operating Activities Accounts Receivable | -105.22M | -162.61M | 117.39M | -973.47M | -764.08M |
| Operating Activities Other Assets Liabilities | 43.48M | 768.06M | -1.43B | -1.13B | 100.08M |
| Operating Activities Operating Cash Flow | 3.06B | 3.75B | 671.12M | 823.50M | 1.65B |
| Investing Activities Capital Expenditures | -249.59M | -5.60B | -1.11B | -1.71B | -160.04M |
| Investing Activities Purchase Of Investments | -5.01B | -12.55B | -8.26B | -4.91B | N/A |
| Investing Activities Sale Of Investments | 3.48B | 14.45B | 8.27B | 4.92B | N/A |
| Investing Activities Other Investing Activity | -11.00K | N/A | 2.13B | -3.37B | N/A |
| Investing Activities Investing Cash Flow | -1.79B | -3.71B | 1.02B | -5.08B | -160.04M |
| Financing Activities Long Term Debt Payments | -36.84B | -9.25B | -10.91B | -7.47B | N/A |
| Financing Activities Short Term Debt Issuance | 81.09M | 1.29B | N/A | N/A | N/A |
| Financing Activities Common Dividends | -436.53M | -436.53M | -436.53M | -327.41M | N/A |
| Financing Activities Financing Cash Flow | -37.19B | -8.40B | 84.31M | 2.35B | 1.69B |
| End Cash Position | 143.06M | 193.68M | 105.07M | 221.48M | 113.38M |
| Free Cash Flow | 3.57B | -2.58B | -2.37B | 922.80M | 461.69M |
| Financing Activities Long Term Debt Issuance | N/A | N/A | 11.43B | 10.15B | 1.69B |
Source: Financial statements and regulatory filings
Technical Analysis
Key Insights
- The stock is currently trading in a sideways to mildly bullish trend, with price action consolidating between support near ₹720 and resistance around ₹835.
- Key support levels are identified at ₹720 (near 50-day moving average) and ₹700, while resistance is observed near ₹835 and the recent 52-week high of ₹988.8.
- The price is above the 10-day moving average but below the 50-day and 200-day moving averages, indicating mixed momentum with potential near-term resistance.
- Momentum indicators show RSI near neutral levels around 50, MACD slightly bearish with signal line crossover, and stochastic oscillators indicating a potential oversold condition.
- On daily and weekly timeframes, the stock shows consolidation with no strong breakout, while monthly charts suggest a longer-term uptrend intact but requiring confirmation.
- Potential scenarios include a breakout above ₹835 leading to renewed upward momentum or a breakdown below ₹720 risking further correction towards the 52-week low.
Trending News
1. Headline: Stocks to Watch today: OMCs, Adani stocks, Tata Steel, JSW Steel, TMPV, HCC | Markets News - Business Standard
Summary: Stocks to watch today: Stocks of OMCs, Adani Group, Tata Steel, JSW Steel, United Spirits, Voltas, HFCL, HCC, Apollo Tyres, are among the key stocks in focus today.
Sentiment: neutral
Summary: Rathi Steel Share Price: Find the latest news on Rathi Steel Stock Price. Get all the information on Rathi Steel with historic price charts for NSE / BSE. Experts & Broker view also get the Rathi Steel Ltd. buy/sell tips detailed news, announcements, Forecasts, Analysts, Valuation, Earning ...
Sentiment: neutral
3. Headline: Rs 350 Calls on Kalyan Jewellers India Ltd See Heavy Activity — What the Strike Price Tells You
Summary: 4,460 call contracts at the Rs 350 strike traded on Kalyan Jewellers India Ltd on 13 May 2026, while the stock closed at Rs 344.80 after a sharp 4.99% decline. This juxtaposition of heavy call activity near the current price level and a falling stock price presents a nuanced picture of market ...
Sentiment: negative
4. Headline: Kalyani Steels Ltd Downgraded to Sell Amid Deteriorating Quality and Technicals
Summary: The stock’s recent trading range between ₹805.45 and ₹850.55 further underscores the uncertainty in near-term price direction. ... MarketsMOJO’s downgrade of Kalyani Steels Ltd to a Sell rating with a Mojo Score of 40.0 reflects a comprehensive reassessment of the company’s fundamentals ...
Sentiment: negative
5. Headline: Kalyani Steels Ltd Downgraded to Sell as Quality Metrics Deteriorate
Summary: Given the stock’s recent volatility and downgrade, a more conservative approach may be warranted until clearer evidence of fundamental recovery emerges. ... Kalyani Steels Ltd’s recent quality grade downgrade reflects a nuanced picture of its business fundamentals.
Sentiment: negative
Recent Updates
News Summary
As of May 15, 2026. Kalyani Steels Ltd. reported its FY26 financial results with a standalone profit after tax (PAT) of ₹2,551.37 million and consolidated PAT of ₹2,578.67 million, showing stable earnings compared to the prior year. Revenue from operations stood at ₹18,456.07 million, slightly down from the previous fiscal year, impacted partly by new labor codes affecting wage definitions. The Board declared a final dividend of ₹10 per share and appointed Mr. Shishir Joshipura as an Additional Independent Director and Mr. Bantu Upendra Kumar Patro as Chief Financial Officer, indicating strategic leadership strengthening. Despite a 10.62% decline in consolidated net profit in the March 2026 quarter, the company continues to pursue price hikes to mitigate rising input costs and maintain margins. Overall, the financial performance reflects resilience amid regulatory and market challenges, supported by prudent management actions and dividend distribution.
News Sentiment
The overall sentiment from recent updates is mixed to cautiously positive. Positive aspects include stable annual PAT, dividend declaration, and strategic leadership appointments, which signal confidence in the company’s governance and financial health. However, the quarterly profit decline and downgrade by some analysts due to deteriorating quality metrics introduce caution. Efforts to counter rising costs through price hikes are viewed favorably but underscore ongoing margin pressures. This blend of steady annual results tempered by short-term challenges suggests a balanced outlook with attention to operational execution and market conditions.
Source List
- https://scanx.trade/stock-market-news/companies/kalyani-steels-reports-fy26-standalone-pat-of-2-551-37-million-board-declares-10-per-share-dividend-appoints-new-cfo-and-independent-director/39787172
- https://www.tipranks.com/news/company-announcements/kalyani-steels-posts-robust-fy26-results-publishes-audited-financials
- https://whalesbook.com/news/English/industrial-goodsservices/Kalyani-Steels-Pursues-Price-Hikes-to-Counter-Rising-Costs-Shield-Margins/6a01b6ab707d23e8444088e0
Analytical Overview
Analysis Summary
Kalyani Steels’ valuation metrics, including a trailing P/E of 13.52 and forward P/E of 9.76, are below the industry average P/E of 13.52, indicating relatively attractive earnings valuation. The PEG ratio of 1.39 suggests moderate growth expectations priced in. Revenue growth has declined by 10.2% quarterly, but operating and free cash flows remain healthy at ₹3.06 billion and ₹2.56 billion respectively, supporting a stable growth trajectory. The company maintains a low debt-to-equity ratio of 0.22, reflecting solid financial health and manageable leverage. Sector-specific challenges include regulatory changes such as new labor codes impacting costs, while opportunities arise from price hikes to protect margins amid inflation. Considering India-specific factors, the company benefits from growing infrastructure demand but faces risks from commodity price volatility and evolving labor regulations.
Overall Business and Market Assessment
Supporting Factors: No data
Risk Factors: recent revenue contraction and regulatory impacts that may pressure margins and earnings in the near term
SWOT Analysis
Strengths
- Strong return on equity of 13.55% indicating efficient capital utilization.
- Low debt-to-equity ratio of 0.22 supporting financial stability.
- Consistent dividend payout with a forward yield near 4.94%.
- Diverse product portfolio serving multiple industrial sectors.
Weaknesses
- Quarterly revenue declined by 10.2%, signaling near-term sales pressure.
- Profit margins under pressure due to rising input costs and regulatory changes.
- Stock trading below 200-day moving average indicating technical weakness.
- Limited cash reserves with zero total cash reported in recent quarter.
Opportunities
- Price hikes underway to offset rising raw material costs and protect margins.
- Growing infrastructure and automotive demand in India supports long-term growth.
- Leadership appointments may enhance strategic and financial management.
- Potential to leverage Kalyani Group synergies for operational efficiencies.
Threats
- Regulatory changes including new labor codes impacting wage definitions and costs.
- Competitive pressures in the steel industry from larger domestic and international players.
- Volatility in raw material prices could adversely affect profitability.
- Market sentiment affected by recent downgrades and quarterly profit declines.
Company Description
Kalyani Steels Ltd. is a prominent player in the steel industry, specializing in the manufacturing of steel products that are essential to various sectors, including automotive, engineering, and energy. Established in 1973, the company is headquartered in Pune, India, and operates with a focus on high-quality ferrous material production. Its facilities are equipped with modern machinery and technology, ensuring efficient and environmentally responsible manufacturing processes. The primary function of Kalyani Steels Ltd. is to provide materials that are foundational to infrastructure and development projects. Its product lineup includes alloy and carbon steels, with applications spanning from making vital automotive components to supporting engineering innovations. This diversity in applications highlights its significance in driving advancements in various industrial applications. As part of the larger Kalyani Group, Kalyani Steels Ltd. plays a crucial role in the steel sector’s supply chain, leveraging synergies within subsidiary companies to enhance productivity and innovation. Its position in the market is strategically important, contributing to both local and international industrial demands, thus supporting economic growth and industrial development.