


Jyoti CNC Automation Ltd (JYOTICNC)
Stock Analysis Report
Stock Journey
Key Positives and Key Risks
Pros
- Strong revenue growth of 28.1% quarterly indicates robust demand for CNC products.
- High return on equity at 18.7% reflects efficient capital utilization and profitability.
- Healthy current ratio of 2.34 demonstrates solid short-term liquidity.
Cons
- Negative operating cash flow of INR -705 million suggests cash generation challenges.
- Elevated valuation multiples with a trailing P/E of 49.25 and P/B of 9.52 may limit upside.
- Regulatory investigation into a subsidiary introduces operational and reputational risks.
Disclosure: This information is for general awareness and does not constitute investment advice
Report Summary
Jyoti CNC Automation Ltd. is a leading Indian manufacturer specializing in high-tech CNC machines, serving diverse sectors such as automotive, aerospace, defense, and medical industries. Listed on the NSE under the Industrials sector, the company is recognized for its innovation and market leadership in precision engineering and CNC technology. Jyoti CNC holds a significant domestic market share of approximately 10-12% in metal-cutting CNC machines, positioning it as a critical player in the specialty industrial machinery industry.
Financially, Jyoti CNC reported trailing twelve months (TTM) revenue of INR 20.7 billion with a gross margin of 57.6%, operating margin of 24.5%, and net profit margin of 17.1%. The company’s return on equity (ROE) stands at 18.7%, return on assets (ROA) at 11.3%, and return on invested capital (ROIC) is robust at 24.4%, indicating efficient capital utilization and profitability. Quarterly revenue growth was strong at 28.1%, with net income reaching INR 3.54 billion TTM, reflecting solid operational performance despite some cash flow challenges.
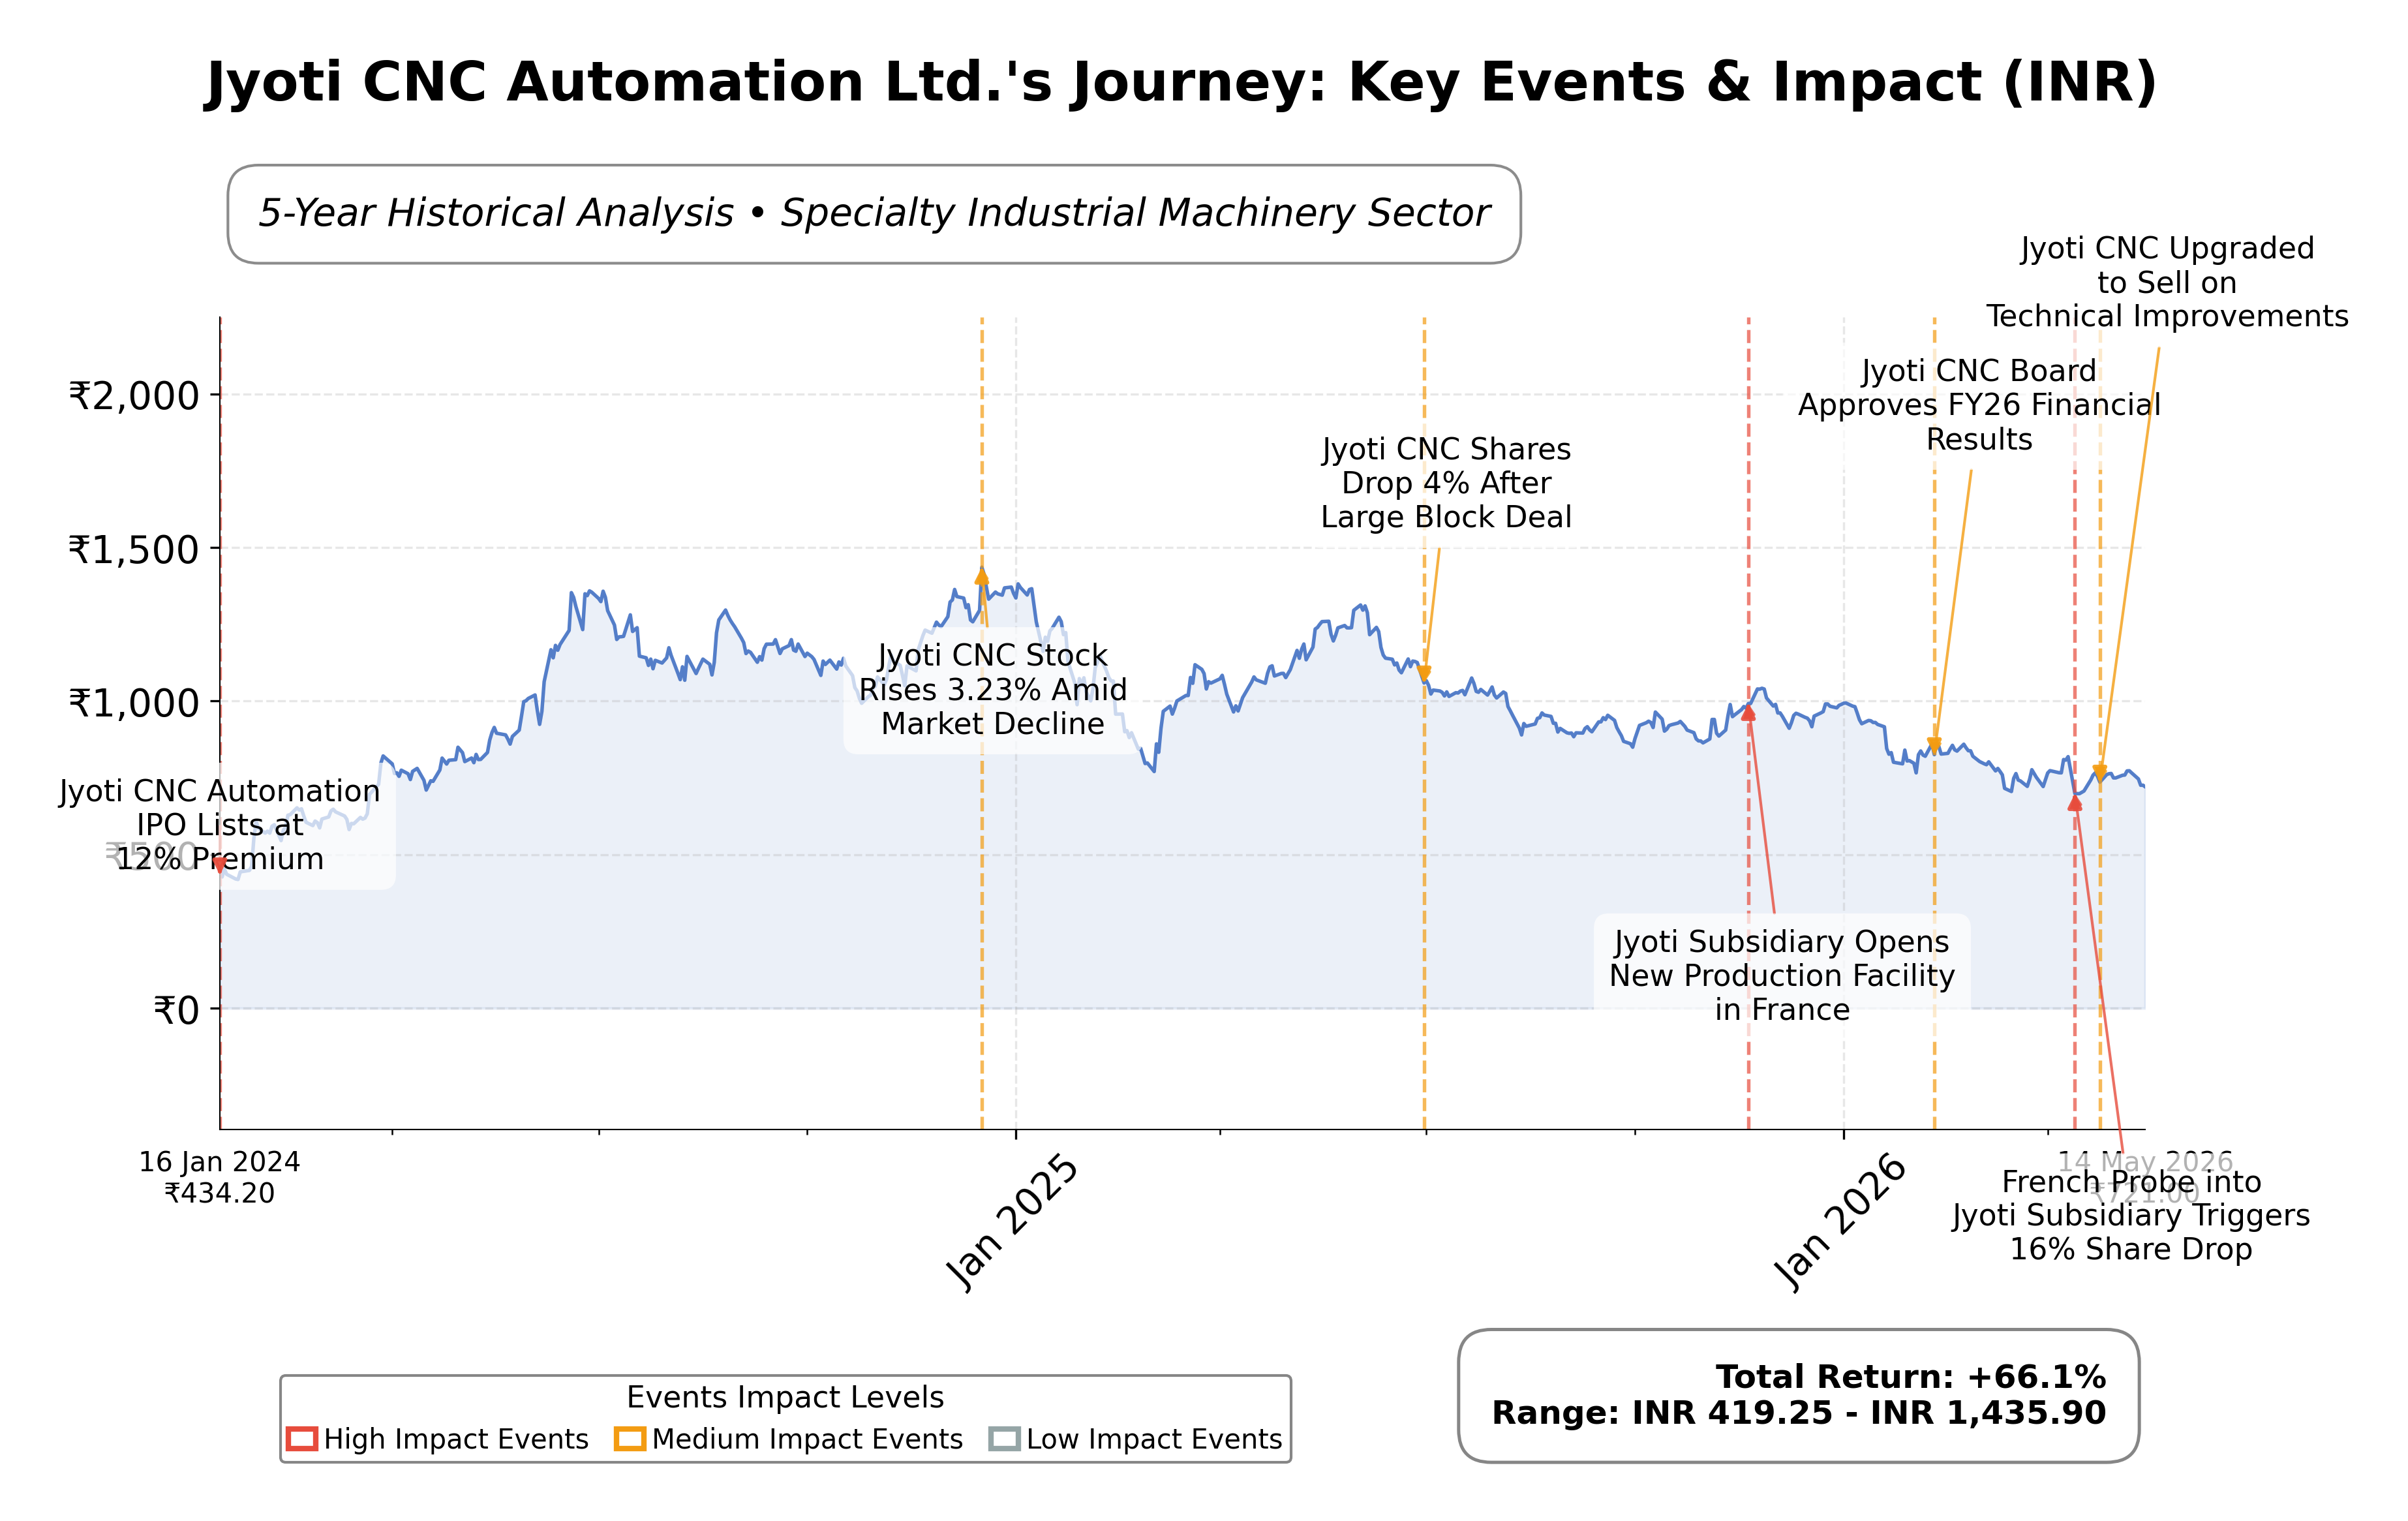
Valuation metrics show Jyoti CNC trading at a trailing price-to-earnings (P/E) ratio of 49.3 and a forward P/E of 39.5, with a price-to-book (P/B) ratio of 9.5 and an enterprise value to EBITDA (EV/EBITDA) of 32.9. The market capitalization is approximately INR 174.3 billion. The stock price currently trades near INR 712, closer to its 52-week low of INR 686.75, compared to a high of INR 1,330, indicating significant recent price depreciation relative to historical highs.
Key strengths include strong market positioning, a healthy current ratio of 2.34, and a solid ROE. However, risks include elevated debt levels with a debt-to-equity ratio of 39.6%, negative operating cash flow of INR -705 million TTM, and ongoing regulatory scrutiny of a subsidiary in France. Recent strategic developments include leadership changes with the appointment of an independent director and participation in industry expos showcasing new CNC technologies.
Technically, the stock exhibits mixed signals with recent price consolidation near support levels around INR 686-690, trading below its 50-day and 200-day moving averages, and momentum indicators reflecting cautious market sentiment. The overall data suggests a watchful stance as the company navigates operational and regulatory challenges amid evolving market dynamics.
Company and Industry Overview
Company Basics
Price Performance
Company Size
Shareholding Pattern
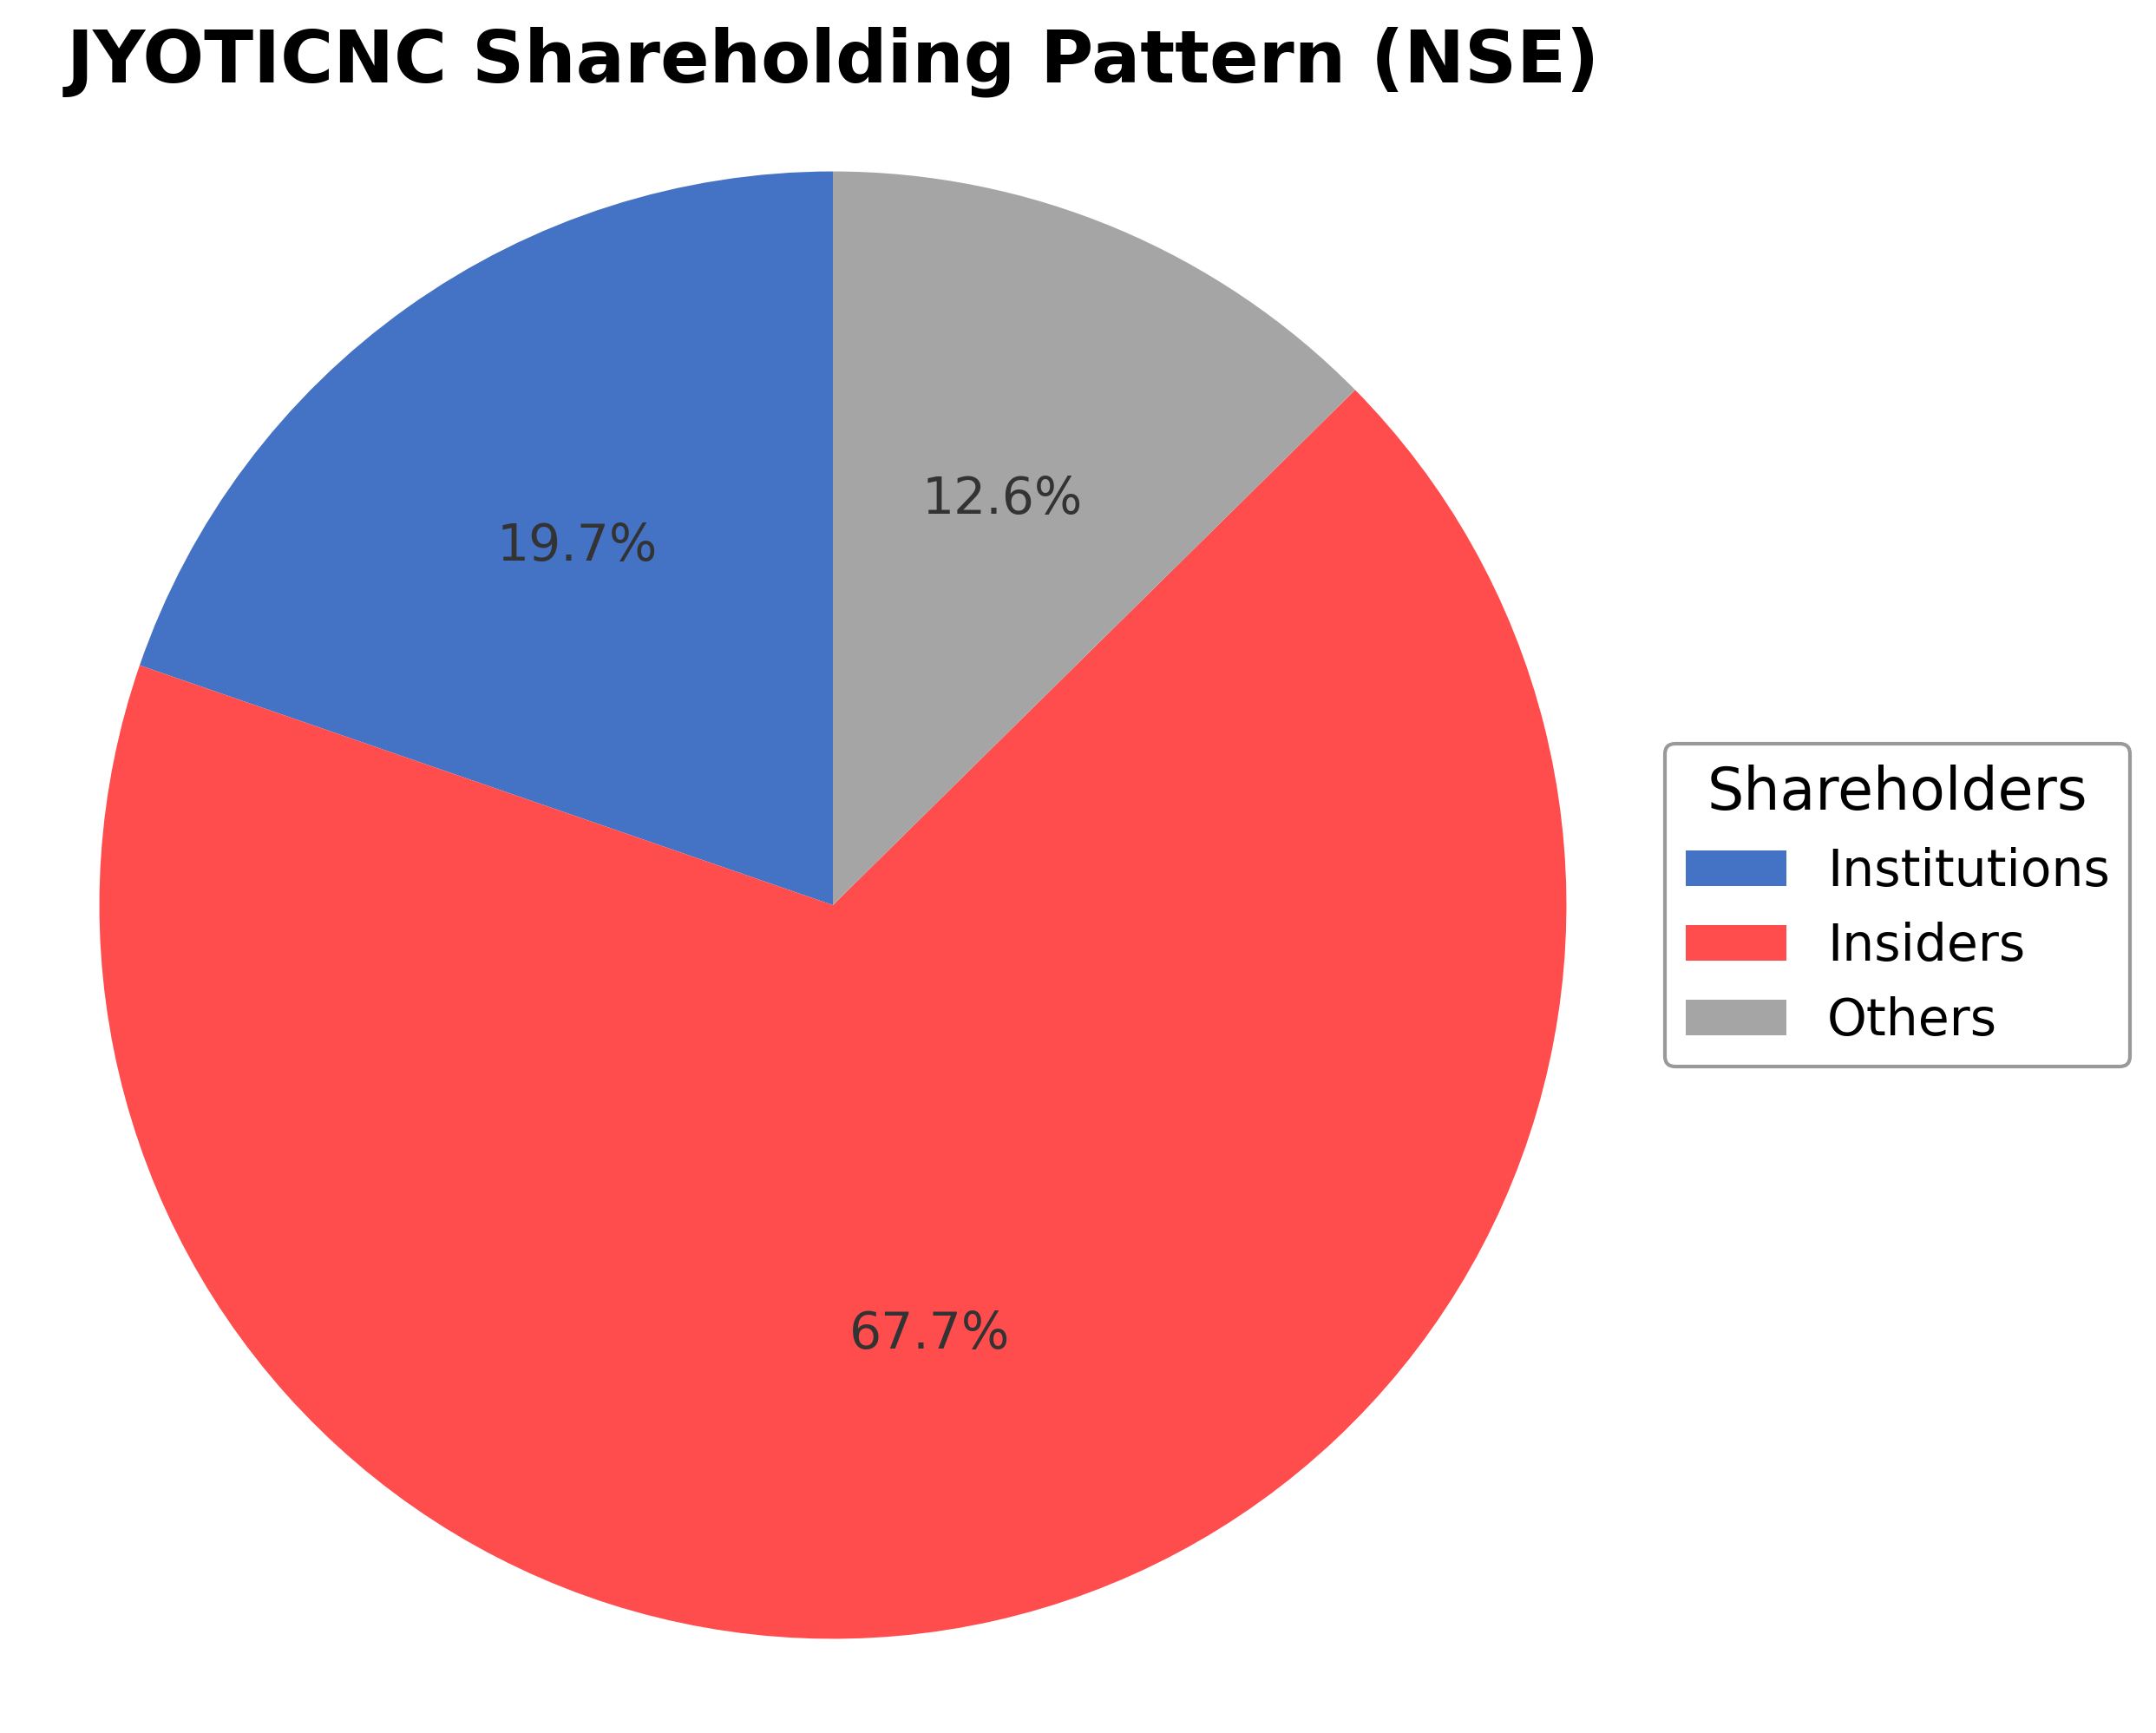
Jyoti CNC Automation Ltd.'s ownership structure is dominated by insiders holding approximately 67.69%, including executives and board members, reflecting strong promoter control. Institutional investors hold a significant 19.70%, comprising mutual funds and asset managers, indicating moderate institutional interest. The remaining 12.61% is held by public shareholders, including retail investors. Over the past 12-24 months, institutional holdings have shown relative stability without major accumulation or distribution trends. This ownership pattern suggests a concentrated governance model with potential influence on strategic decisions, while institutional participation provides some market validation. The current structure supports continuity in corporate direction amid industry competition and regulatory scrutiny.
Sector and Industry Analysis
The industrial products sector in India, encompassing machine tools and automation equipment, has been witnessing steady growth driven by increasing manufacturing activities and adoption of advanced technologies. The market size is expanding as industries seek automation to enhance productivity and precision. Key players include Jyoti CNC Automation Ltd, along with other established machine tool manufacturers and automation solution providers, competing to capture rising demand from automotive, aerospace, and heavy engineering sectors.
Industry trends highlight a shift towards CNC (computer numerical control) machines and automation solutions that improve operational efficiency and reduce human error. Competitive dynamics are shaped by technological innovation, product customization, and after-sales service quality. Barriers to entry remain significant due to high capital investment, technical expertise requirements, and established relationships with industrial clients, positioning incumbents like Jyoti CNC favorably within the market.
The regulatory environment for the industrial products sector involves adherence to quality standards, safety norms, and environmental regulations that govern manufacturing processes. Government initiatives promoting Make in India and industrial automation support sector growth by incentivizing domestic production and technology adoption. Compliance with export-import regulations and intellectual property rights protection also influences competitive positioning and market expansion opportunities.
Note: Analysis synthesized from industry research, market reports, and regulatory filings. Information is subject to change based on market conditions.
Financial Ratios Dashboard
Illustrative Scenario Analysis
DCF Assumptions:
Method: Two-Stage EPS-Priority Model
Financials
Peer Analysis
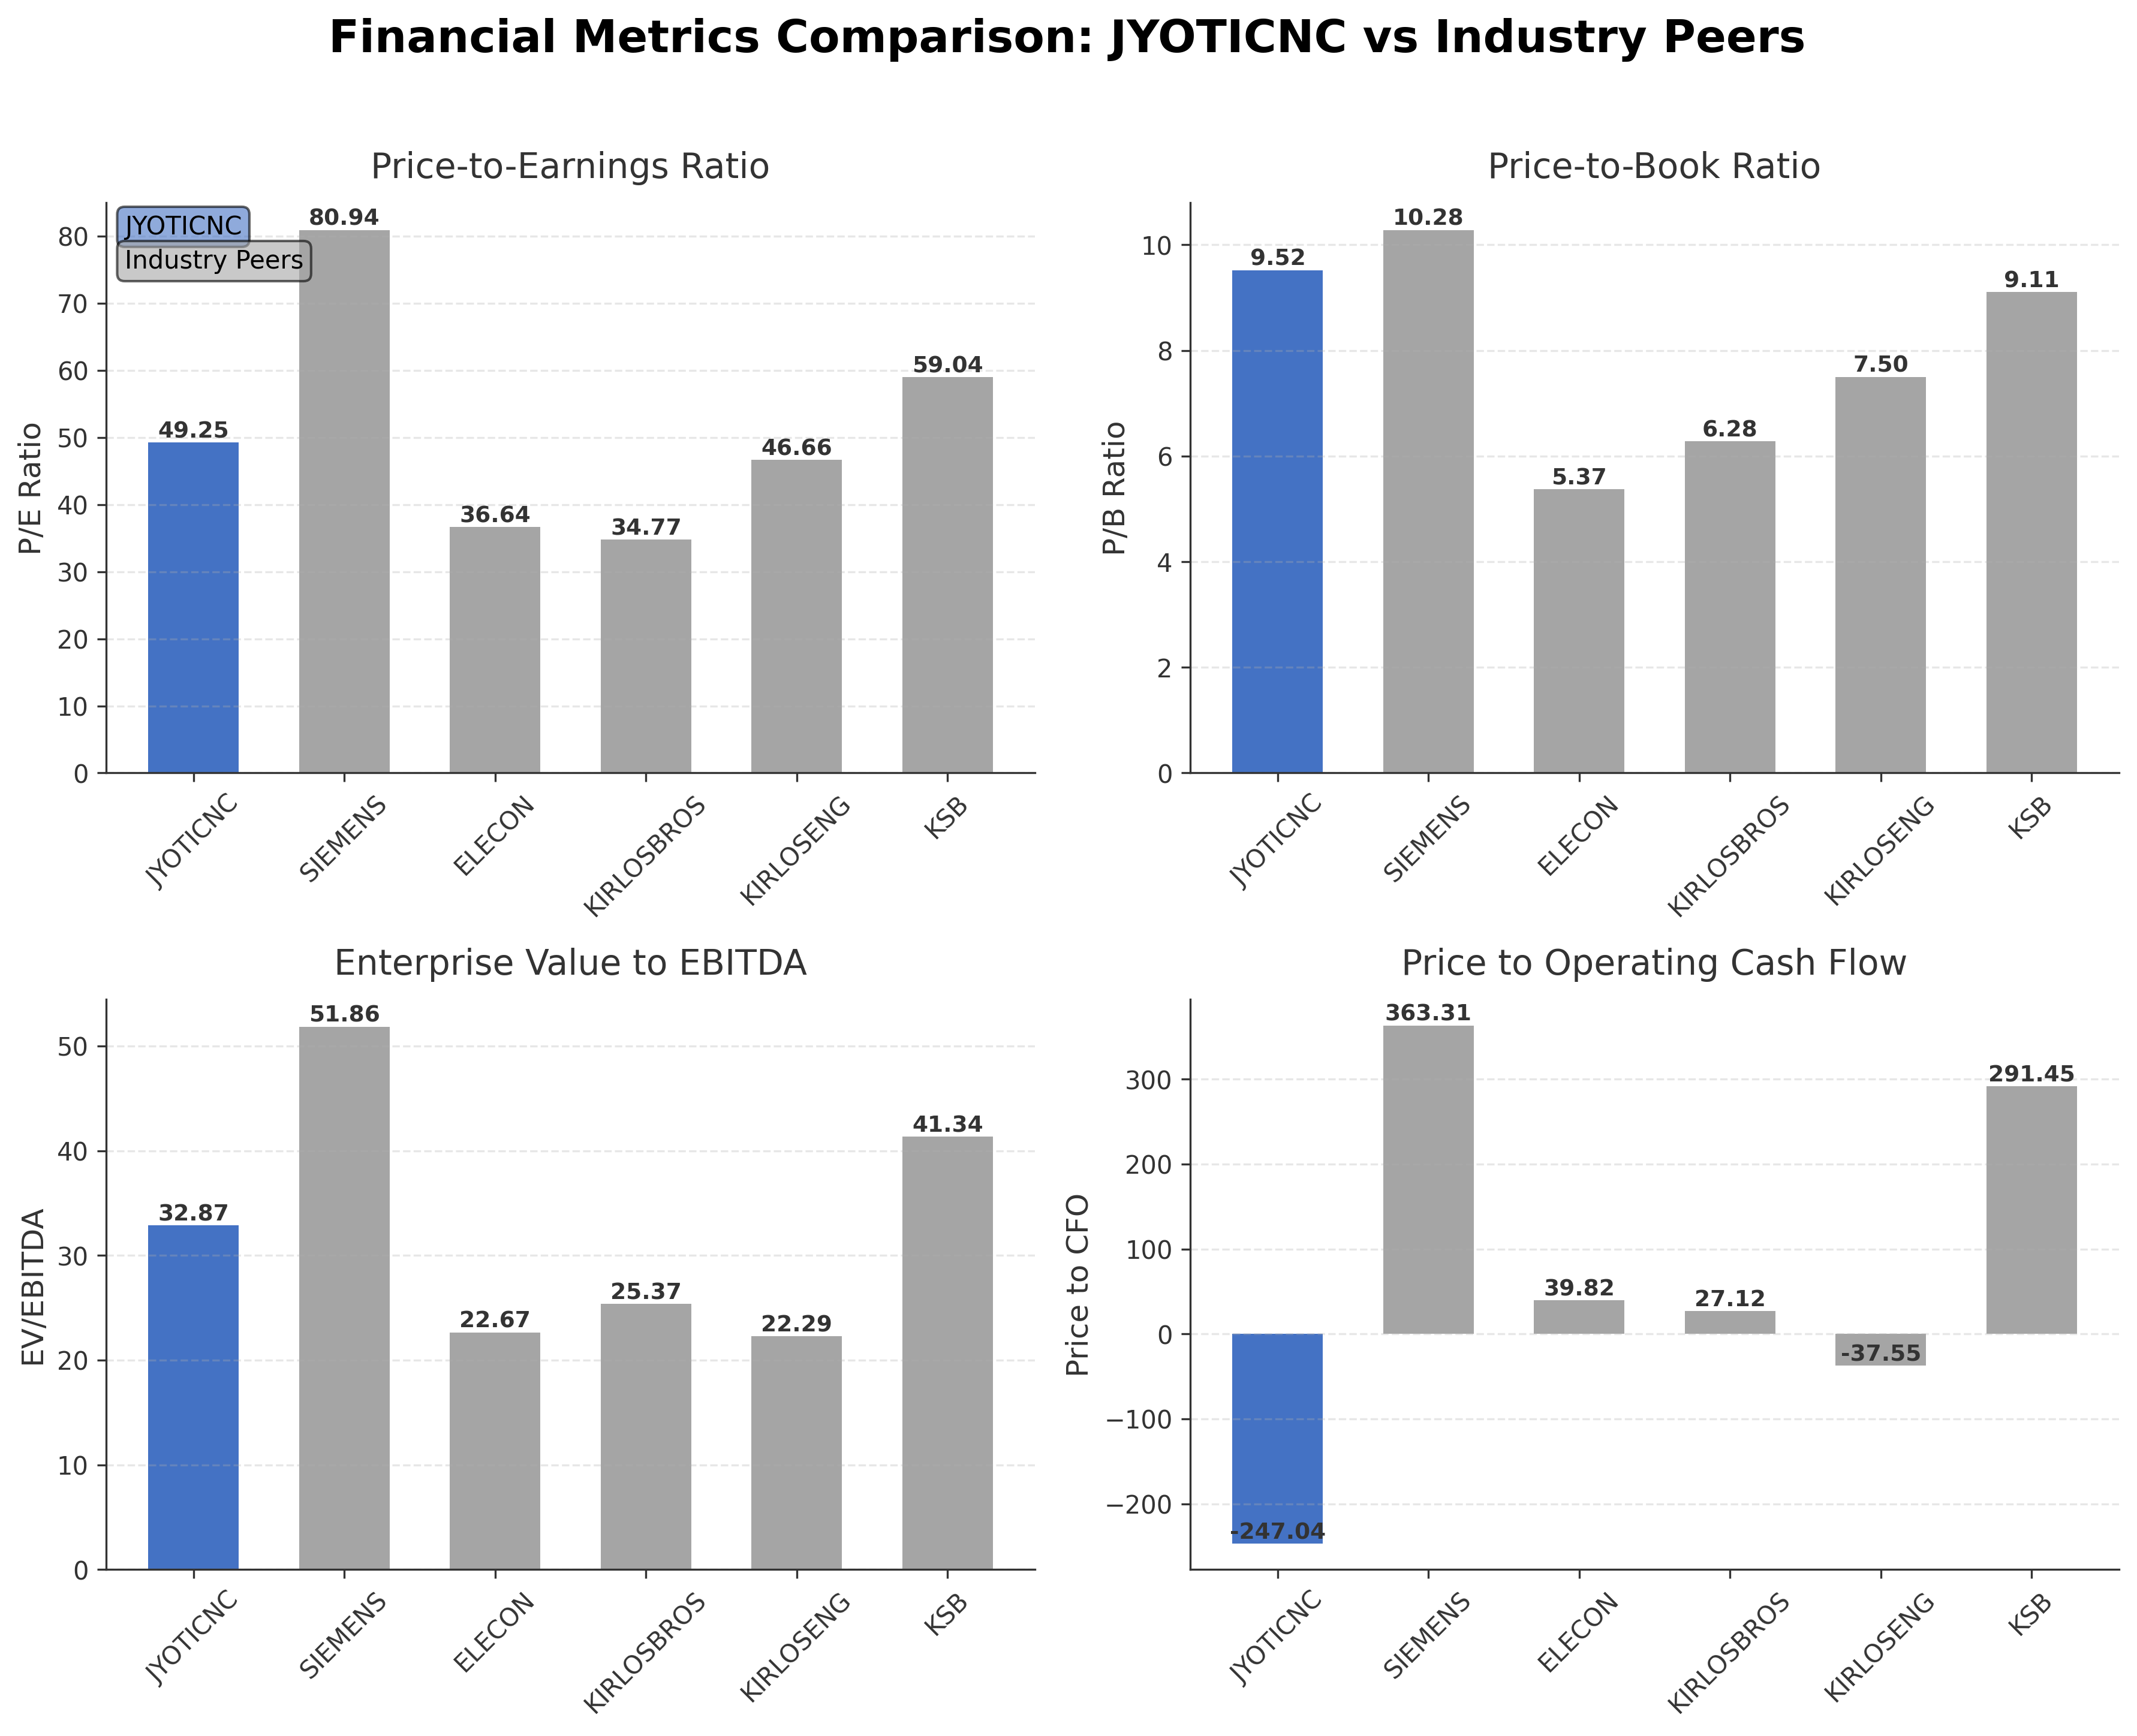
| Company Name | Market Cap | P/E Ratio | P/B Ratio | EV/EBITDA | Price to CFO |
|---|---|---|---|---|---|
| Jyoti CNC Automation Ltd. | ₹174.29B | 49.25 | 9.52 | 32.87 | -247.04 |
| Siemens Ltd. | ₹1.36T | 80.94 | 10.28 | 51.86 | 363.31 |
| Elecon Engineering Co. Ltd. | ₹125.14B | 36.64 | 5.37 | 22.67 | 39.82 |
| Kirloskar Brothers Limited | ₹137.62B | 34.77 | 6.28 | 25.37 | 27.12 |
| Kirloskar Oil Engines Ltd. | ₹251.33B | 46.66 | 7.50 | 22.29 | -37.55 |
| KSB Ltd. | ₹152.69B | 59.04 | 9.11 | 41.34 | 291.45 |
Comparison Analysis: Jyoti CNC Automation Ltd. trades at a higher P/E ratio of 49.25 compared to most peers, reflecting a premium valuation relative to Elecon Engineering (36.64) and Kirloskar Brothers (34.77). Its P/B ratio of 9.52 is among the highest, indicating a rich valuation relative to book value. The EV/EBITDA multiple of 32.87 is also elevated compared to peers like Kirloskar Oil Engines (22.29) and Elecon (22.67), suggesting higher earnings multiples. Jyoti CNC's return on equity of 18.74% is competitive, exceeding Siemens Ltd. (12%) and aligning closely with Kirloskar Brothers (20%). The company’s negative price to CFO ratio contrasts with positive ratios among peers, indicating cash flow challenges. Overall, Jyoti CNC shows strong profitability but at a relatively high valuation and with some cash flow concerns compared to regional industry peers.
Financial Metrics Comparison with Peers
Financial Statements
Comprehensive financial data including income, balance sheet, and cash flow metrics
Income Statement
| fiscal_date | 2025-03-31 | 2024-03-31 | 2023-03-31 | 2022-03-31 | 2021-03-31 |
|---|---|---|---|---|---|
| Sales | 18.15B | 13.34B | 9.26B | 7.45B | 5.79B |
| Cost Of Goods | 9.64B | 7.58B | 6.13B | 4.79B | 3.63B |
| Gross Profit | 8.51B | 5.76B | 3.13B | 2.66B | 2.16B |
| Operating Expense Selling General And Administrative | 1.01B | 740.95M | 717.83M | 482.89M | 525.75M |
| Operating Expense Other Operating Expenses | 35.50M | 12.57M | 10.70M | 12.50M | 12.50M |
| Operating Income | 4.55B | 2.68B | 432.17M | 400.06M | -60.95M |
| Non Operating Interest Income | 85.10M | 51.14M | 8.99M | 14.87M | 13.43M |
| Non Operating Interest Expense | 356.80M | 798.45M | 801.53M | 730.26M | 651.25M |
| Pretax Income | 4.18B | 1.85B | 73.26M | -417.50M | -715.73M |
| Income Tax | 1.02B | 340.87M | 127.90M | 65.50M | -15.44M |
| Net Income | 3.16B | 1.51B | -54.64M | -483.00M | -700.29M |
| Eps Basic | 13.90 | 7.89 | -0.24 | -2.12 | -3.08 |
| Eps Diluted | 13.90 | 7.89 | -0.24 | -2.12 | -3.08 |
| Basic Shares Outstanding | 227.42M | 191.12M | 227.42M | 227.42M | 227.42M |
| Diluted Shares Outstanding | 227.42M | 191.12M | 227.42M | 227.42M | 227.42M |
| Ebit | 4.53B | 2.65B | 874.79M | 312.76M | -64.48M |
| Ebitda | 4.99B | 2.97B | 905.04M | 664.96M | 313.36M |
| Net Income Continuous Operations | 4.18B | 1.85B | 73.26M | -417.50M | -715.73M |
| Preferred Stock Dividends | 0.00 | 0.00 | 0.00 | 0.00 | 0.00 |
Source: Financial statements and regulatory filings
Balance Sheet
| fiscal_date | 2025-03-31 | 2024-03-31 | 2023-03-31 | 2022-03-31 | 2021-03-31 |
|---|---|---|---|---|---|
| Cash And Cash Equivalents | 133.80M | 3.02B | 160.92M | 24.44M | 101.15M |
| Accounts Receivable | 4.87B | 2.49B | 1.46B | 2.00B | 2.17B |
| Total Assets | 27.92B | 21.78B | 15.15B | 12.86B | 13.88B |
| Total Liabilities | 11.06B | 8.14B | 14.33B | 12.45B | 12.76B |
| Long Term Debt | 1.03B | 845.13M | 1.27B | 1.40B | 1.19B |
| Shareholders Equity | 16.86B | 13.65B | 820.44M | 411.54M | 1.13B |
Source: Financial statements and regulatory filings
Cash Flow Statement
| fiscal_date | 2025-03-31 | 2024-03-31 | 2023-03-31 | 2022-03-31 | 2021-03-31 |
|---|---|---|---|---|---|
| Operating Activities Net Income | 4.18B | 1.85B | 73.26M | -417.50M | -715.73M |
| Operating Activities Other Non Cash Items | 342.50M | 856.00M | 921.63M | 917.14M | 741.69M |
| Operating Activities Other Assets Liabilities | -5.23B | -3.00B | -752.39M | -665.23M | -337.23M |
| Operating Activities Operating Cash Flow | -705.50M | -292.85M | 785.62M | -1.09M | -514.29M |
| Investing Activities Capital Expenditures | -3.10B | -1.14B | -340.88M | -405.55M | -142.66M |
| Investing Activities Other Investing Activity | 300.00K | N/A | -10.00K | N/A | N/A |
| Investing Activities Investing Cash Flow | -3.10B | -1.14B | -340.89M | -405.55M | -142.66M |
| Financing Activities Long Term Debt Issuance | 180.50M | N/A | N/A | N/A | N/A |
| Financing Activities Long Term Debt Payments | -58.20M | N/A | N/A | N/A | N/A |
| Financing Activities Short Term Debt Issuance | 1.75B | -4.88B | 556.15M | 462.06M | 75.24M |
| Financing Activities Common Stock Issuance | 0.00 | 11.26B | 500.30M | 0.00 | 0.00 |
| Financing Activities Other Financing Charges | -100.00K | N/A | -20.00K | -10.00K | N/A |
| Financing Activities Financing Cash Flow | 1.87B | 6.38B | 1.06B | 462.05M | 75.24M |
| End Cash Position | 133.80M | 3.02B | 160.92M | 24.44M | 101.15M |
| Free Cash Flow | -4.15B | -1.63B | 80.61M | -20.11M | 121.52M |
| Operating Activities Accounts Receivable | N/A | N/A | 543.12M | 164.50M | -203.02M |
Source: Financial statements and regulatory filings
Technical Analysis
Key Insights
- The current trend shows a downward price movement with recent consolidation near the 52-week low around ₹686-690, indicating potential support in this range.
- Key support levels are identified near ₹686 and ₹700, while resistance is observed around ₹757 (50-day MA) and ₹877 (200-day MA).
- The stock is trading below its 10-day, 50-day (₹757.67), and 200-day (₹877.22) moving averages, reflecting bearish momentum.
- Momentum indicators show RSI near oversold levels, MACD remains below the signal line, and Stochastic oscillators indicate weak upward momentum but no clear reversal.
- Across daily, weekly, and monthly timeframes, the stock exhibits a bearish trend with intermittent short-term rallies but no sustained upward breakout.
- Market scenarios suggest cautious price action with potential for further downside if support levels fail, or sideways consolidation if support holds, pending confirmation from momentum indicators.
Trending News
1. Headline: Kaynes Technology Q4 FY26: Sharp Profit Decline Sparks 18% Stock Plunge Despite Revenue Surge
Summary: Kaynes Technology India Ltd., a mid-cap industrial manufacturing company with a market capitalisation of ₹22,925.85 crores, witnessed a brutal 18.14% stock price collapse following its Q4 FY26 results announcement, with shares plummeting to ₹3,420.00 from a previous close of ₹4,177.85.
Sentiment: negative
2. Headline: JYOTICNC: Upcoming Shareholder Meeting Will Support Future Upside Potential
Summary: Analysts have kept Jyoti CNC Automation's fair value estimate broadly steady at ₹987, with only minor tweaks to the discount rate, revenue growth, profit margin and future P/E assumptions contributing to this updated price target narrative. What's in the News Jyoti CNC Automation has scheduled ...
Sentiment: positive
3. Headline: Jyoti CNC Automation Ltd is Rated Sell
Summary: Jyoti CNC Automation Ltd is rated 'Sell' by MarketsMOJO, with this rating last updated on 27 Apr 2026. However, the analysis and financial metrics discussed here reflect the stock's current position as of 09 May 2026, providing investors with an up-to-date view of the company's performance ...
Sentiment: neutral
Summary: Jyoti CNC Automation is set to make its debut at INDUS-tech Expo Kolkata 2026, where the company will showcase its latest CNC machining technologies through live demonstrations at Hall A, Stall 36, at the Biswa Bangla Exhibition Centre from May 15 to 18, 2026.
Sentiment: neutral
5. Headline: Jyoti CNC Automation Ltd (JYOTICNC) Stock Analysis | Price, Returns, Financials & Key Metrics
Summary: Comprehensive Jyoti CNC Automation Ltd (JYOTICNC) stock analysis with Score, Quality, Valuation, price movements, total returns, financials, shareholding, technicals, company performance, corporate actions, and expert recommendations.
Sentiment: neutral
Recent Updates
News Summary
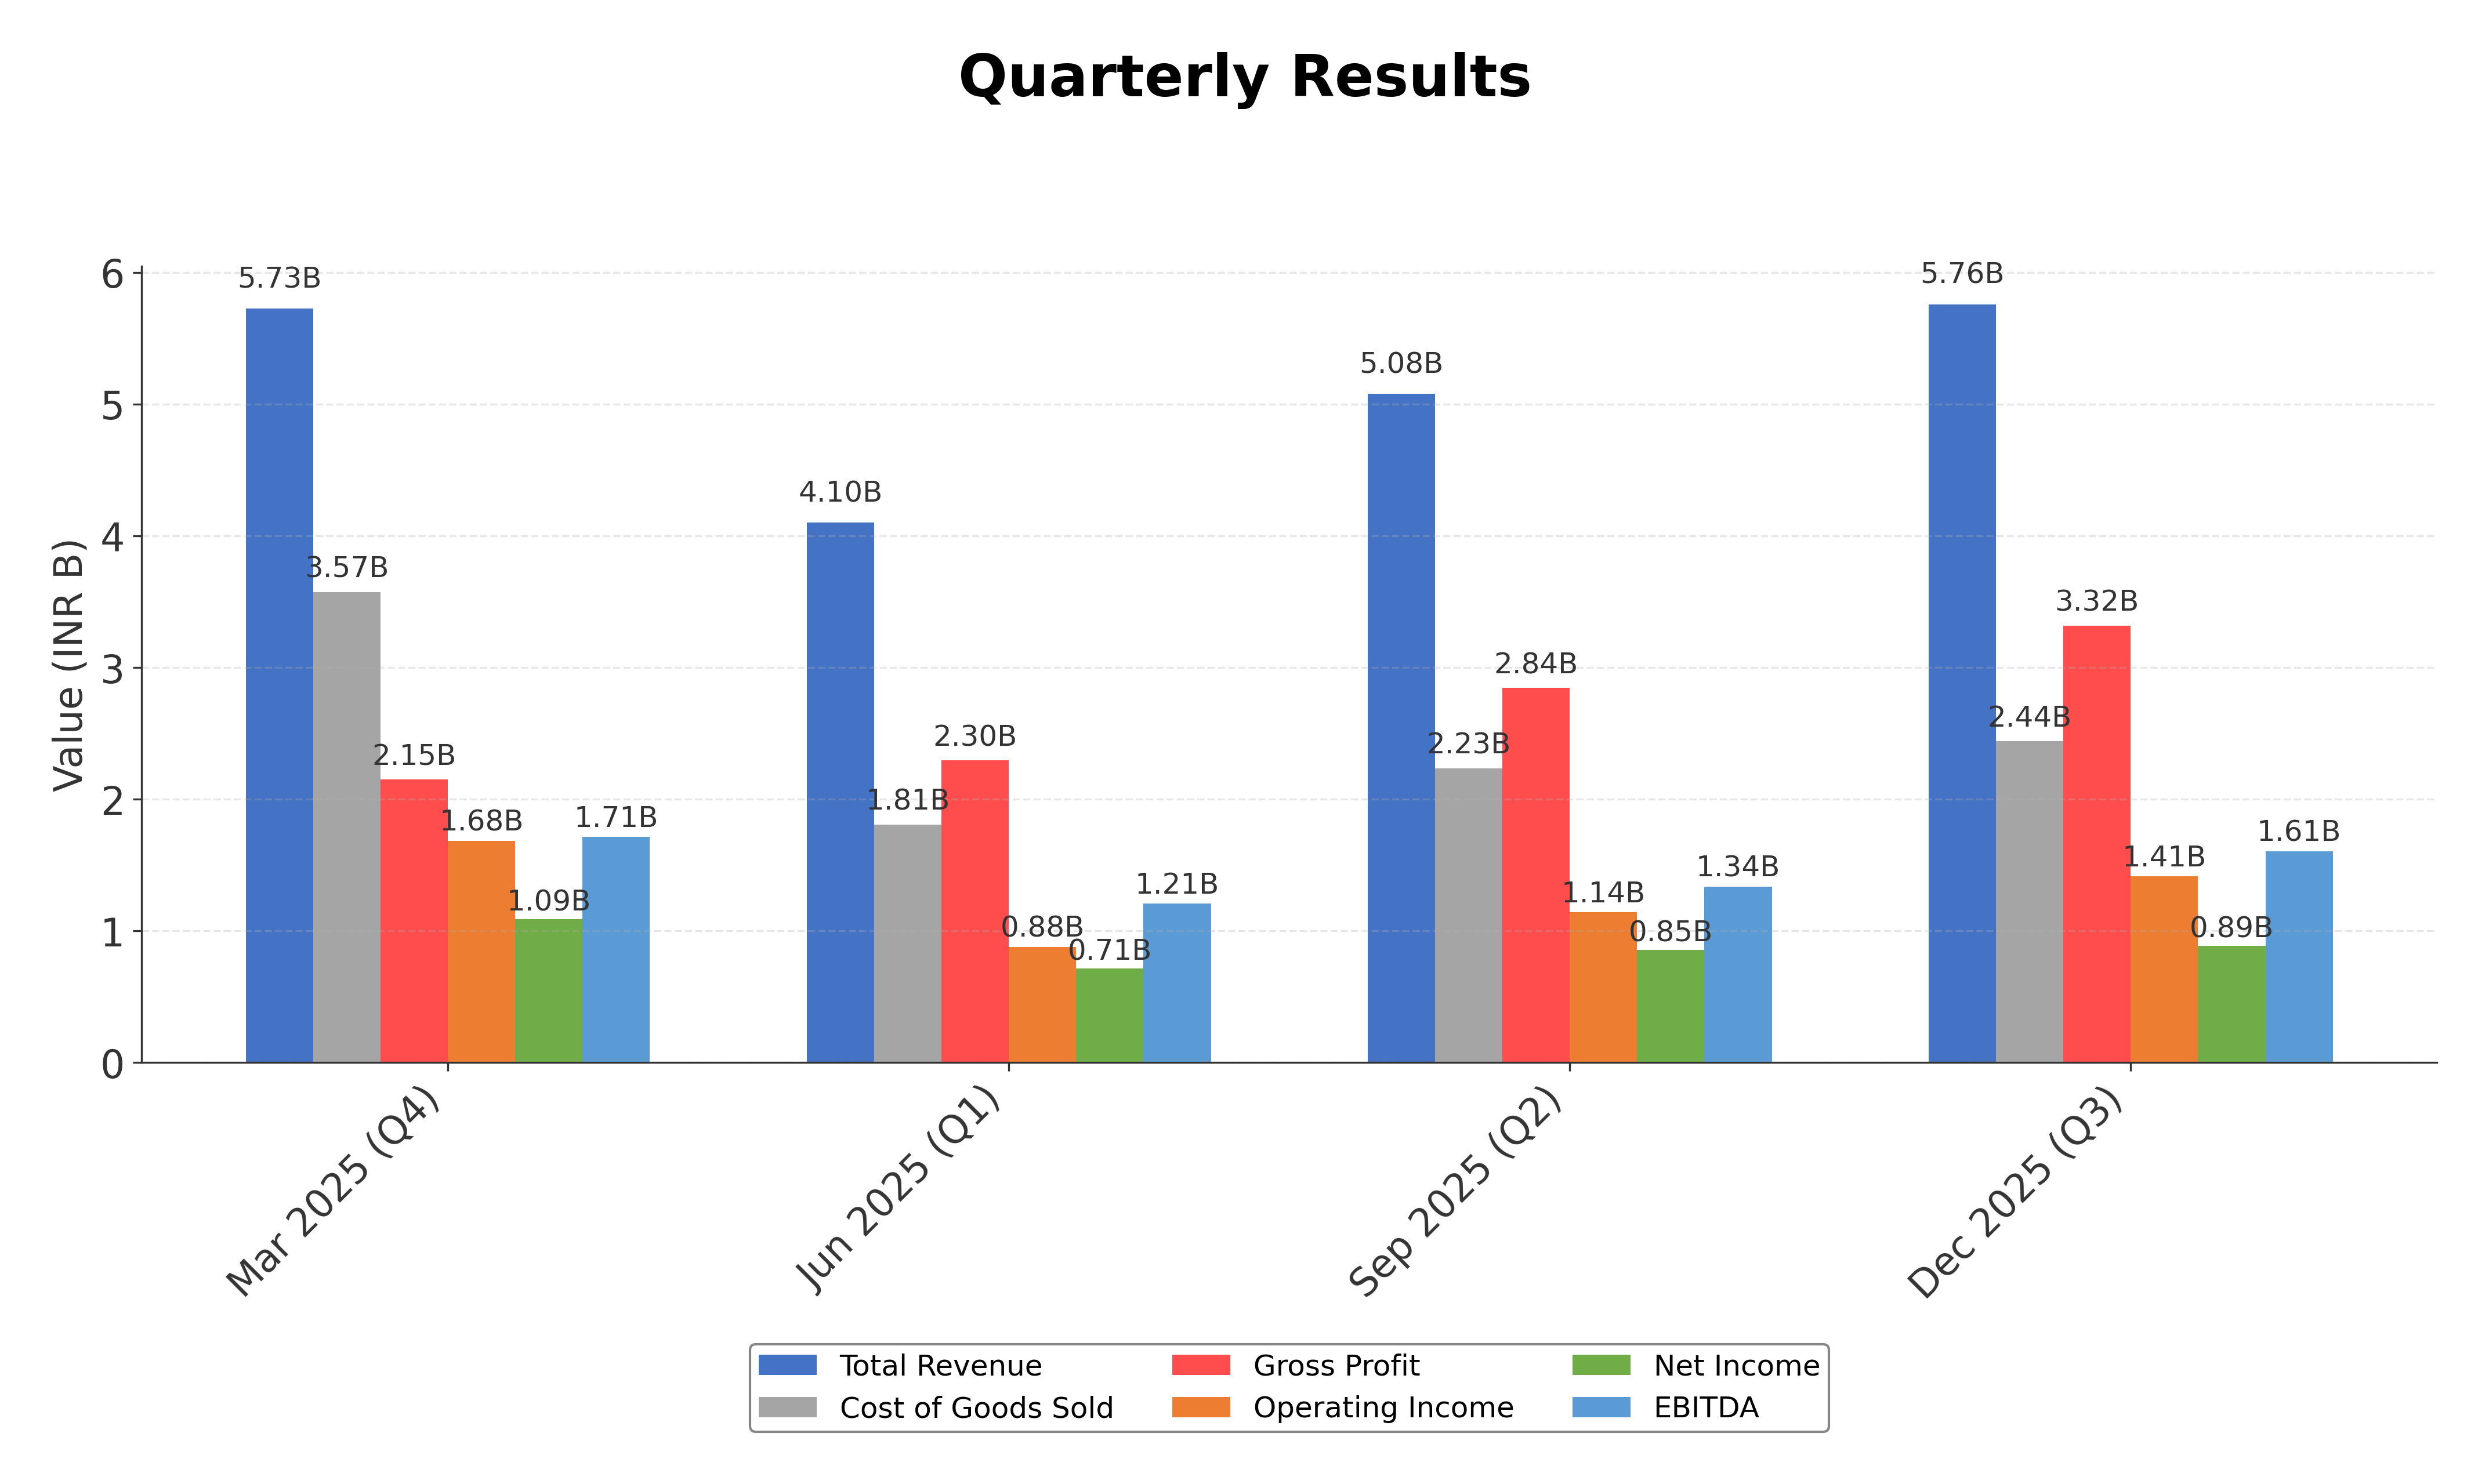
As of 15 May 2026. Jyoti CNC Automation Ltd recently approved its standalone and consolidated unaudited financial results for the quarter ended June 30, 2024, reflecting ongoing operational activities. The company has undergone leadership changes with the appointment of an independent director in April 2026, indicating governance enhancements. Additionally, the company is actively participating in industry events such as the INDUS-tech Expo Kolkata 2026, showcasing its latest CNC technologies. Regulatory challenges surfaced with a judicial investigation into its French subsidiary for suspected export violations, leading to asset seizures and restrictions on management. Despite these challenges, quarterly financials for Q3 FY2025-2026 show revenue growth of 12.56% quarter-over-quarter to ₹581.95 crore and net profit growth of 3.52% to ₹88.51 crore, though net profit margins declined to 15.21%. The company maintains a strong market presence with a 10-12% domestic share in CNC machines.
News Sentiment
The overall sentiment from recent updates is mixed. Positive aspects include steady revenue and profit growth in the latest quarter and proactive governance changes with new director appointments. However, the judicial probe into the French subsidiary and related regulatory actions introduce a negative tone and potential operational risks. Participation in industry expos and analyst support for fair value estimates provide some optimism. The financial results indicate solid top-line growth but margin pressures, while technical downgrades and stock price volatility contribute to cautious market sentiment. The balance of these factors suggests a nuanced outlook with both opportunities and challenges.
Source List
- https://jyoti.co.in/investors/announcements/
- https://economictimes.indiatimes.com/jyoti-cnc-automation-ltd/stocksupdate/companyid-2162893.cms
- https://jyoti.co.in/investors/financials-reports-and-returns/
- https://jyoti.co.in/investors/announcements/investor-presentation/
Analytical Overview
Analysis Summary
Jyoti CNC Automation Ltd’s valuation metrics, including a trailing P/E of 49.25 and forward P/E of 39.50, are above the industry average of approximately 49.25, indicating a premium valuation relative to peers. The PEG ratio of 4.83 suggests that earnings growth expectations are moderate relative to price. The company’s revenue growth of 28.1% quarterly and positive net income growth demonstrate a strong growth trajectory, although operating cash flow remains negative, highlighting some cash flow management challenges. The debt-to-equity ratio of 39.56% is moderate but warrants monitoring given the company’s capital-intensive operations. Sector-specific challenges include regulatory scrutiny of subsidiaries and competitive pressures in the specialty machinery market. India-specific factors such as evolving manufacturing policies and demand in automotive and aerospace sectors provide growth opportunities, balanced by macroeconomic uncertainties.
Overall Business and Market Assessment
Supporting Factors: Key supporting factors include Jyoti CNC’s solid revenue and profit growth, strong market share in CNC machines, and robust return on equity of 18.7%. Risks to monitor include regulatory investigations impacting subsidiaries, negative operating cash flow, and a high valuation relative to peers that may limit upside. The company’s moderate debt levels and recent governance improvements provide some stability. A medium-term investment horizon is appropriate to assess the impact of regulatory developments and operational execution. Overall, the investment profile reflects a balanced risk-reward scenario amid evolving market and regulatory conditions.
Risk Factors: No data
SWOT Analysis
Strengths
- Strong market leadership with a 10-12% domestic share in CNC machines.
- Robust profitability with a net profit margin of 17.1% and ROE of 18.7%.
- Healthy current ratio of 2.34 indicating good short-term liquidity.
- Innovative product portfolio serving diverse industrial sectors.
Weaknesses
- Negative operating cash flow of INR -705 million TTM.
- High valuation multiples with P/E of 49.25 and P/B of 9.52.
- Elevated debt-to-equity ratio at 39.56%.
- No dividend payouts despite consistent profitability.
Opportunities
- Growing demand for CNC machines in automotive and aerospace sectors.
- Expansion potential through strategic partnerships and technology showcases.
- Favorable government policies supporting manufacturing sector growth.
- Increasing adoption of advanced manufacturing technologies globally.
Threats
- Regulatory investigations impacting subsidiary operations and reputation.
- Competitive pressures from domestic and international machinery manufacturers.
- Macroeconomic uncertainties affecting capital expenditure in key industries.
- Volatility in raw material prices impacting production costs.
Company Description
Jyoti CNC Automation Ltd. is a prominent player in the machine tool manufacturing sector, focusing on the development and production of high-tech CNC machines. The company's primary function lies in designing and supplying advanced CNC solutions that cater to diverse industrial machining applications. It serves a wide array of sectors including automotive, aerospace, defense, and medical, contributing to the precision engineering capabilities of these industries. Jyoti CNC is known for its commitment to innovation, leveraging cutting-edge technology to enhance product quality and manufacturing efficiency. Positioned in the global market as a leader in CNC technologies, the company plays a critical role in driving technological advancement and productivity in manufacturing. Jyoti CNC Automation Ltd.'s products are integral to modern manufacturing processes, supporting both large-scale industrial applications and specialized machining needs.