
Jupiter Wagons Ltd (JWL)
Stock Analysis Report
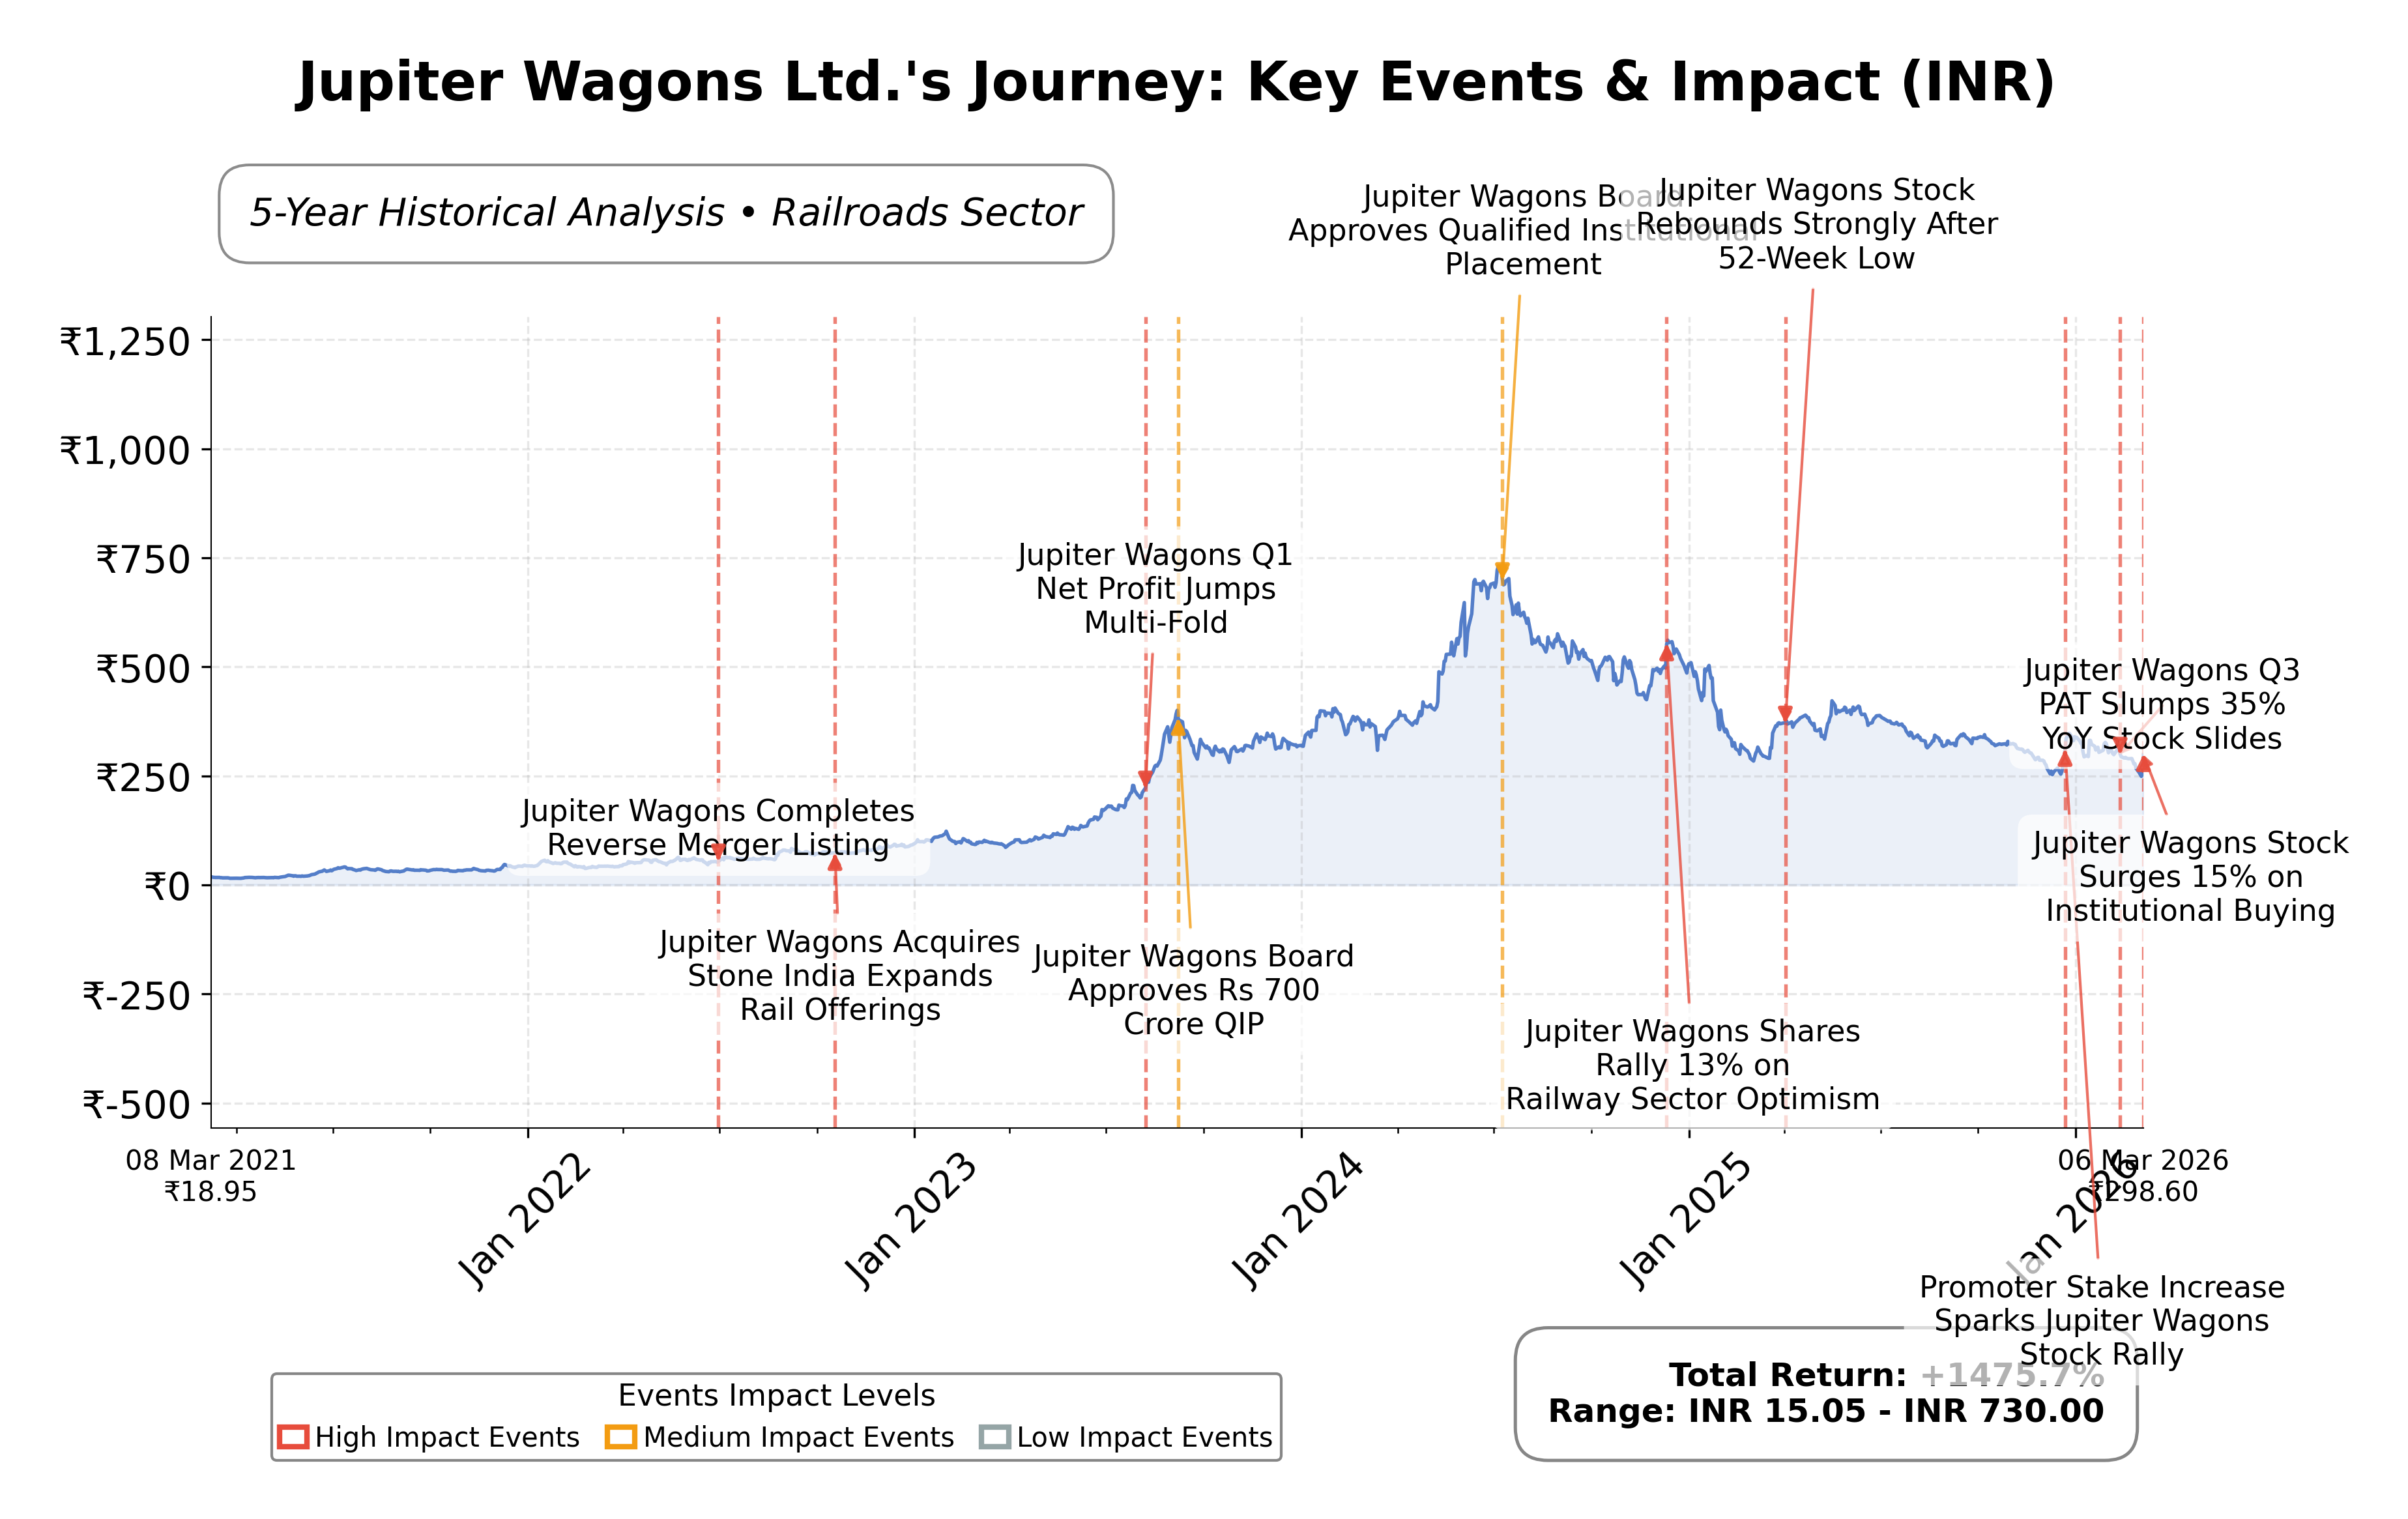
Stock Journey
Key Positives and Key Risks
Pros
- Strong liquidity with ₹6.91 billion in cash and a current ratio of 2.10 supporting operational stability.
- Robust market capitalization of ₹114.19 billion with positive free cash flow of ₹3.82 billion indicating financial strength.
- Return on equity of 13.81% suggests efficient use of shareholder capital relative to peers.
Cons
- Quarterly revenue declined by 13.5%, and earnings growth year-over-year is negative at -35.3%, indicating growth challenges.
- High trailing P/E ratio of 46.07 and EV/EBITDA of 29.10 reflect premium valuation that may limit upside.
- Significant downside risk of 50.33% from current price to 52-week high highlights potential price volatility.
Disclosure: This information is for general awareness and does not constitute investment advice
Report Summary
Jupiter Wagons Ltd. operates primarily in the industrial manufacturing sector, specializing in the production of railway wagons and coach components. Positioned within the Indian railroads industry, the company plays a vital role in supporting rail infrastructure by supplying diverse rolling stock and components essential for freight and passenger transportation. Its market presence is significant in India, catering to sectors reliant on rail logistics such as steel, cement, and automobiles.
Financially, Jupiter Wagons reports a market capitalization of approximately â¹114.19 billion with a trailing P/E ratio of 46.07 and a forward P/E of 32.99, indicating valuation metrics above typical industry averages. The companyâs revenue over the trailing twelve months stands at around â¹31.8 billion, with a profit margin of 7.72% and operating margin of 11.15%. Liquidity appears robust with a current ratio of 2.10 and total cash of â¹6.91 billion against total debt of â¹7.49 billion. Return on equity is moderate at 13.81%, while the enterprise value to EBITDA ratio is elevated at 29.10.
Technical indicators reveal the stock trading near â¹304, below its 52-week high of â¹457 but above the 52-week low of â¹247. The beta of 0.165 suggests relatively low volatility compared to the market. Recent strategic developments include strong institutional interest and notable volume surges, reflecting increased market activity. Strengths include solid cash flow generation and a diversified product portfolio, while risks involve recent quarterly revenue declines and a negative PEG ratio, signaling challenges in earnings growth relative to price.
Within the Indian railroads sector, Jupiter Wagons compares with peers such as Titagarh Rail Systems Limited and Container Corporation of India Ltd. Jupiter Wagons holds a mid-range market capitalization relative to these peers, with a higher P/E ratio than Container Corporation but lower than Titagarh Rail. Its return on equity is slightly higher than peers, while valuation multiples such as EV/EBITDA and price to CFO indicate a premium valuation. This peer context highlights Jupiter Wagonsâ competitive positioning amid industry dynamics.
Jupiter Wagons Ltd. navigates a complex industrial landscape marked by infrastructural demands and evolving market conditions. Recent achievements include robust trading volumes and institutional buying interest, signaling market attention. However, challenges such as revenue contraction and valuation pressures persist. The company stands at a pivotal juncture where strategic execution and market developments will influence its trajectory. Evaluators may find merit in monitoring the stockâs performance closely, considering both its operational fundamentals and market sentiment.
Company and Industry Overview
Company Basics
Price Performance
Company Size
Shareholding Pattern
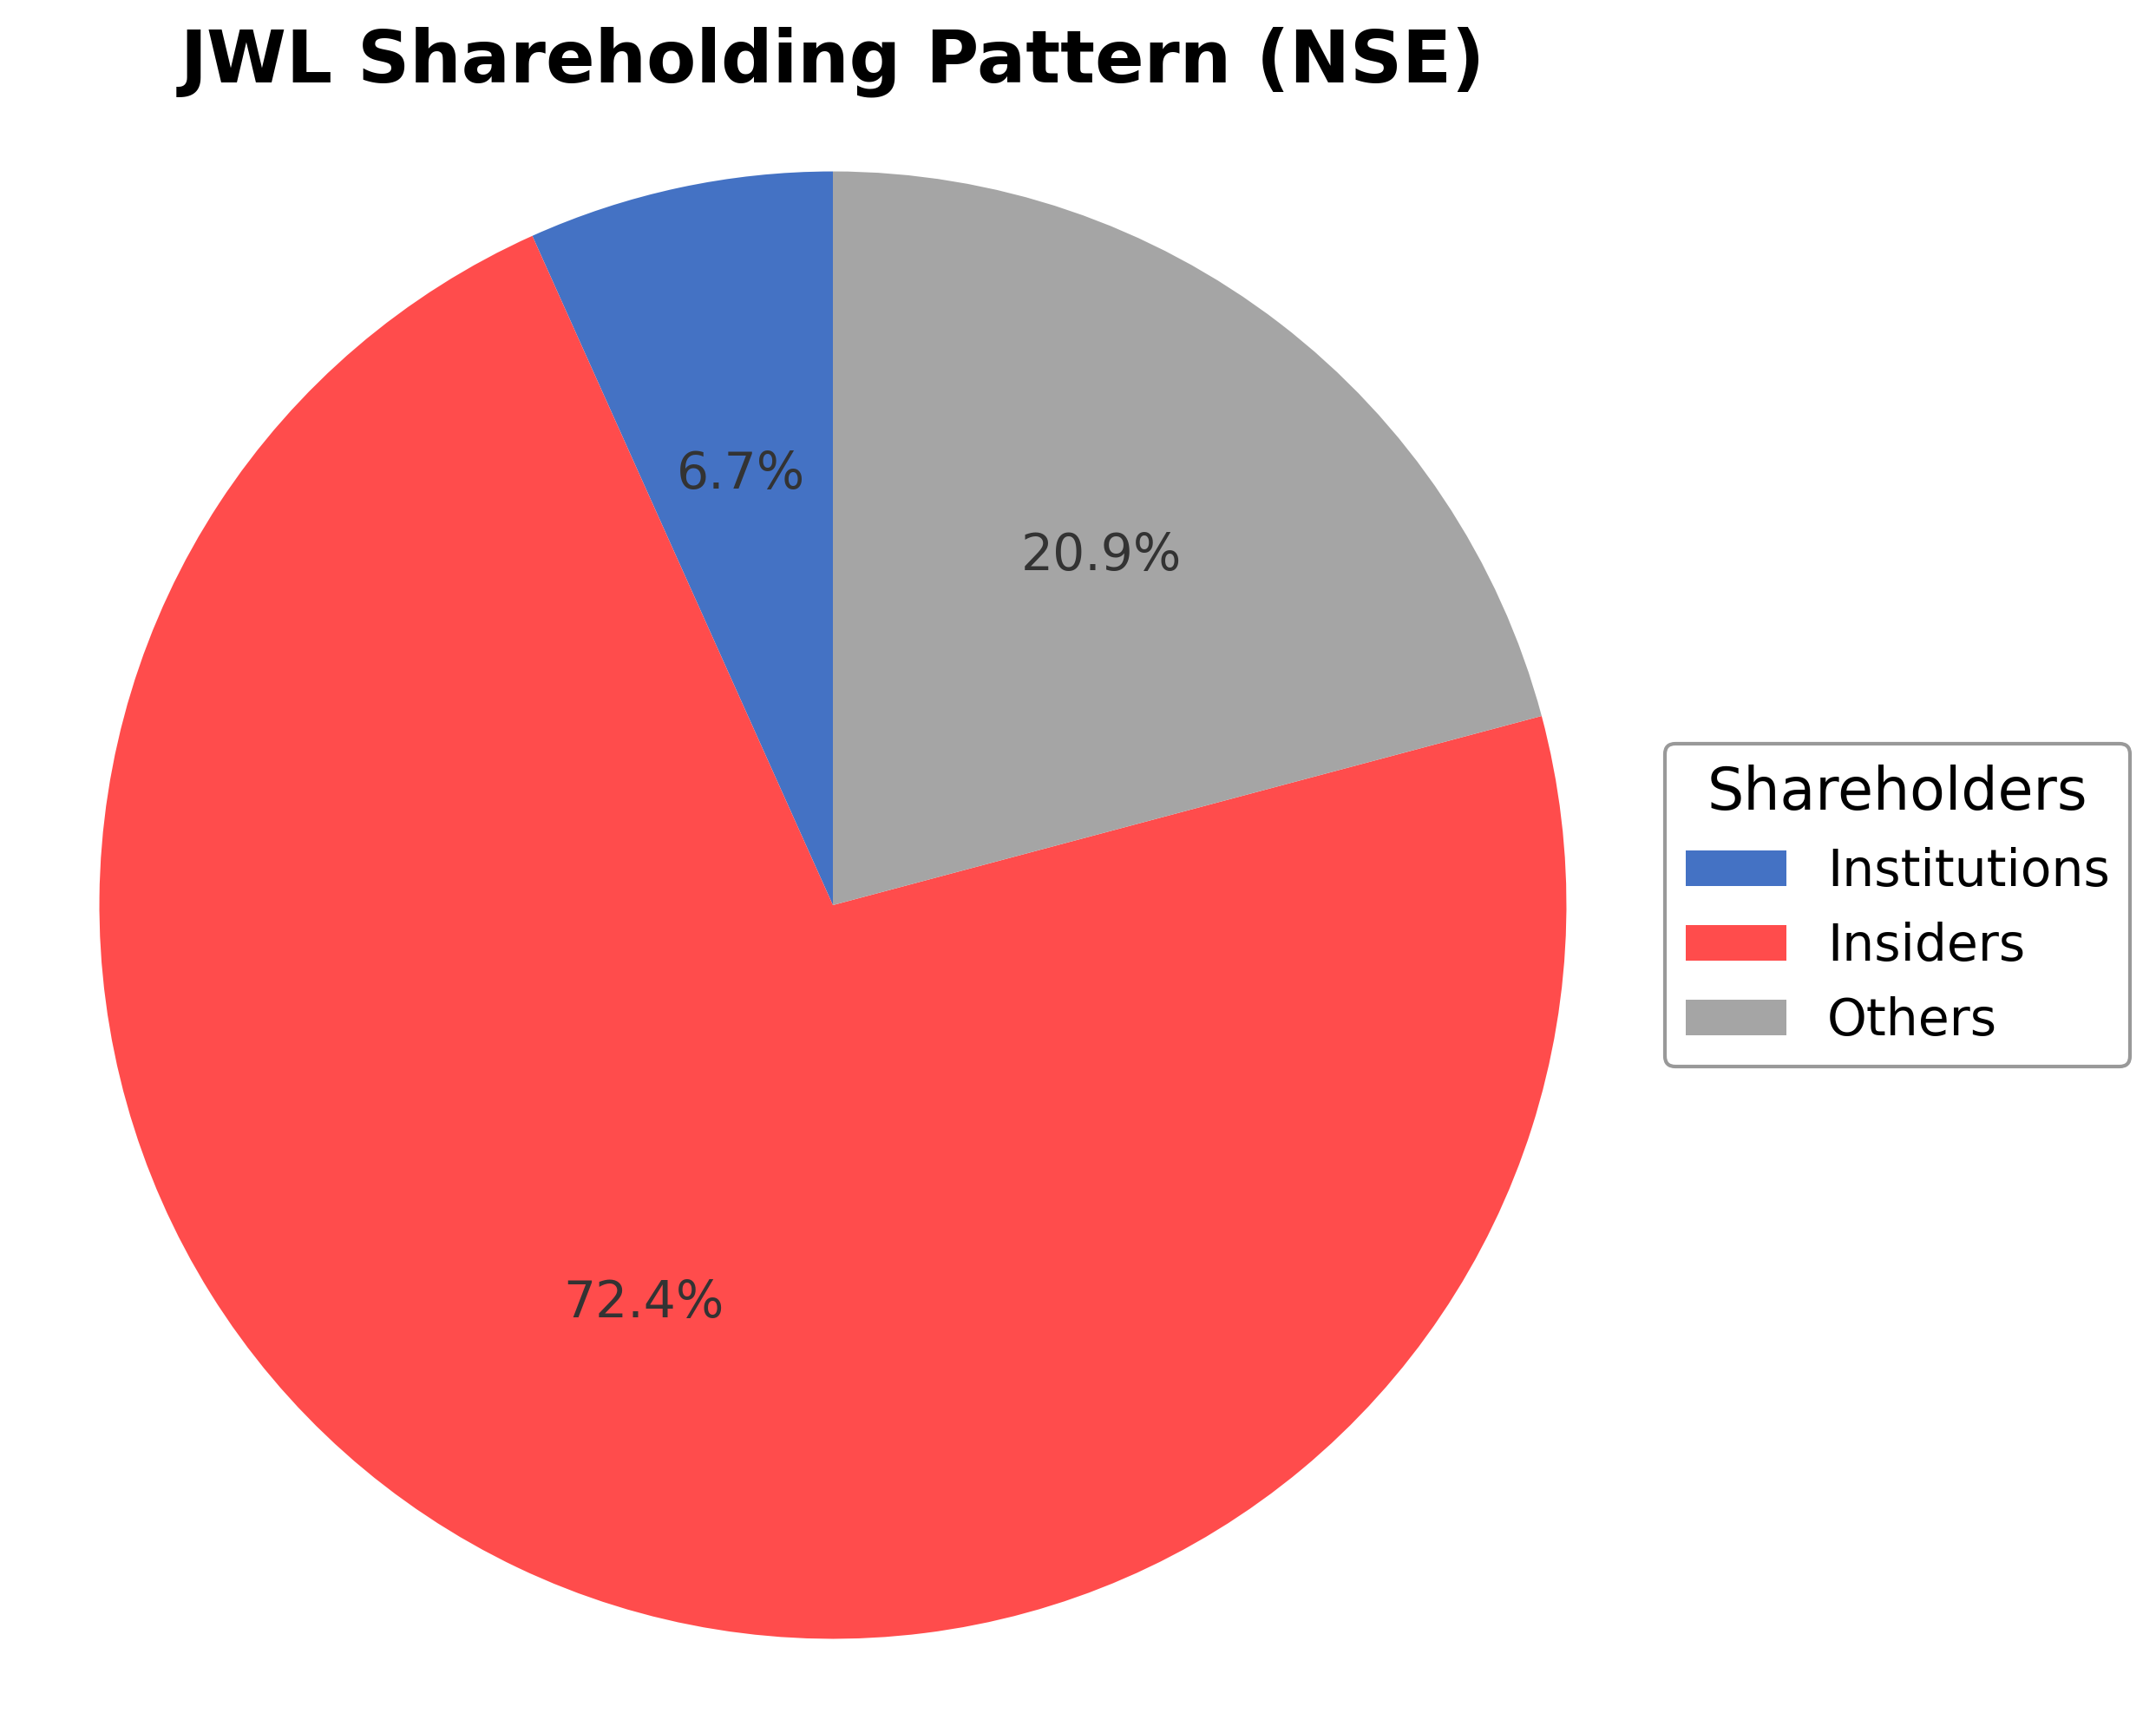
Jupiter Wagons Ltd. exhibits a concentrated ownership structure with insiders, including executives and board members, holding approximately 72.43% of shares, reflecting significant control. Institutional investors account for 6.72%, indicating moderate external professional investment, while public and other shareholders comprise around 20.85%. Over the past 12 to 24 months, institutional holdings have shown signs of increased accumulation, evidenced by recent institutional buying interest and volume surges. Major funds have notably increased exposure, suggesting confidence in the company’s strategic direction. This ownership pattern implies strong promoter influence on governance and strategic decisions, with institutional participation potentially supporting market liquidity and oversight. The current structure may facilitate decisive corporate actions while balancing external investor perspectives.
Sector and Industry Analysis
Jupiter Wagons Ltd. (JWL) operates primarily within the industrial manufacturing sector, specifically focusing on railways and transportation equipment manufacturing. The broader industrial manufacturing sector in India is sizable, driven by infrastructure development, urbanization, and government initiatives such as "Make in India" which aim to boost domestic production capabilities. The railways equipment segment benefits from significant public and private investments in rail infrastructure modernization, including expansion of freight and passenger rail networks. Key players in this space include companies like Titagarh Wagons, Texmaco Rail & Engineering, and BEML, which compete alongside JWL in rolling stock manufacturing, components, and related services.
Industry trends reflect a shift towards advanced manufacturing technologies such as automation, digitalization, and the adoption of green technologies. The Indian railways sector is increasingly emphasizing energy-efficient and environment-friendly solutions, including electric locomotives and lightweight materials to reduce operational costs and carbon footprint. Consumer behavior in freight and passenger transport is evolving with rising demand for faster, safer, and more reliable rail services, creating opportunities for manufacturers to innovate in product design and service offerings. Additionally, the push for multimodal logistics and integration of rail with road and ports presents emerging avenues for growth in rail wagon manufacturing and allied services.
The regulatory landscape is shaped by government policies aimed at enhancing rail infrastructure and promoting indigenous manufacturing. Compliance with safety standards, environmental regulations, and quality certifications is mandatory, with oversight by bodies such as the Ministry of Railways and the Bureau of Indian Standards (BIS). Recent policy initiatives include incentives for domestic production under the Production-Linked Incentive (PLI) scheme and stricter emission norms that influence product development. Regulatory reforms to encourage private sector participation in rail infrastructure projects have also altered market dynamics, increasing opportunities for companies like JWL to secure contracts and expand their footprint.
Competitive dynamics in the rail wagon manufacturing industry are characterized by moderate concentration with a few established players dominating key segments. Barriers to entry include high capital expenditure requirements, technical expertise, and stringent regulatory approvals. Companies differentiate themselves through technological capabilities, product quality, and after-sales service networks. JWL’s competitive positioning is strengthened by its diversified product portfolio spanning freight wagons, metro coaches, and defense-related manufacturing, enabling it to cater to multiple market segments. However, competition remains intense, with pricing pressures and the need for continuous innovation critical to maintaining market share in a sector closely linked to government infrastructure spending cycles.
Note: Analysis synthesized from industry research, market reports, and regulatory filings. Information is subject to change based on market conditions.
Illustrative Scenario Analysis
DCF Assumptions:
Method: Two-Stage EPS-Priority Model
Financials
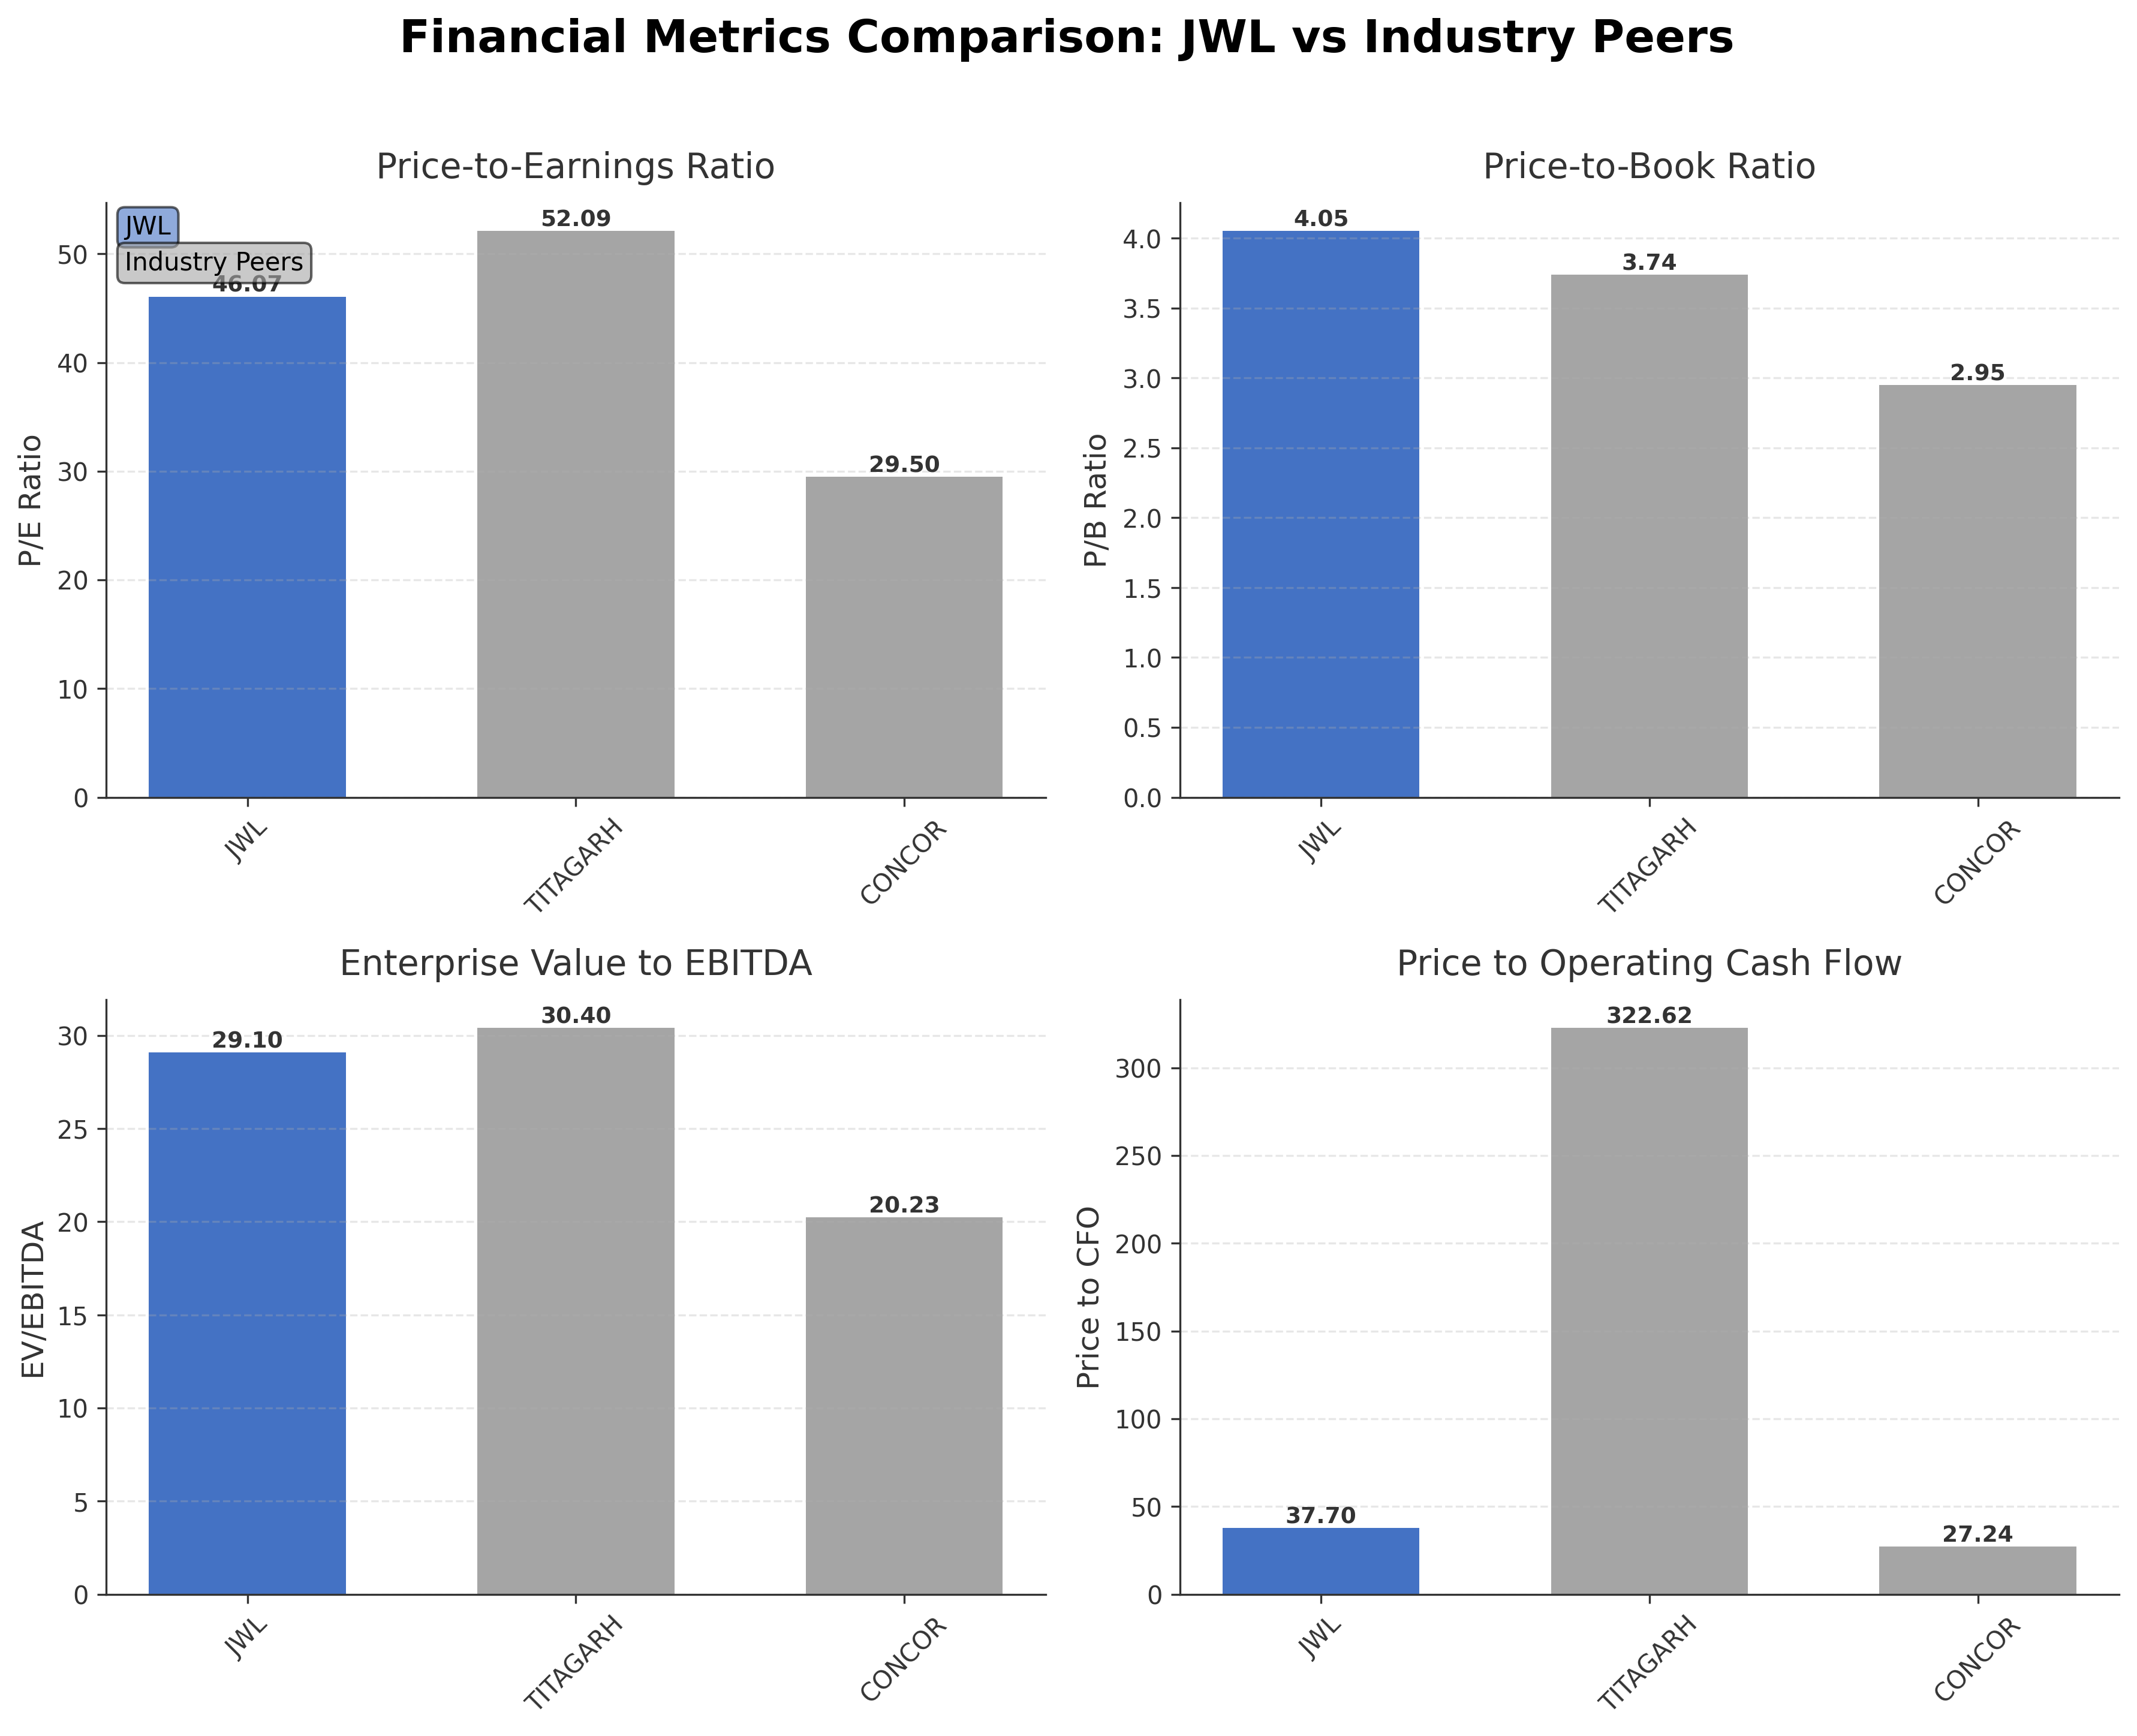
Peer Analysis
| Company Name | Market Cap | P/E Ratio | P/B Ratio | EV/EBITDA | Price to CFO |
|---|---|---|---|---|---|
| Jupiter Wagons Ltd. | ₹114.19B | 46.07 | 4.05 | 29.1 | 37.7 |
| Titagarh Rail Systems Limited | ₹94.40B | 52.09 | 3.74 | 30.4 | 322.62 |
| Container Corporation of India Ltd. | ₹377.50B | 29.5 | 2.95 | 20.23 | 27.24 |
Comparison Analysis: Jupiter Wagons Ltd. holds a market capitalization between its peers, smaller than Container Corporation of India but larger than Titagarh Rail Systems. Its P/E ratio at 46.07 is higher than Container Corporation’s 29.50 but lower than Titagarh’s 52.09, indicating a relatively elevated valuation. The company’s P/B ratio of 4.05 exceeds peers, suggesting a premium on book value. EV/EBITDA at 29.10 is also higher than Container Corporation’s 20.23, reflecting valuation differences possibly due to growth expectations or profitability metrics. Jupiter Wagons’ return on equity of 14% is marginally superior to peers, indicating efficient equity utilization. Price to CFO is significantly lower than Titagarh but higher than Container Corporation, highlighting varied cash flow valuations across the sector.
Financial Metrics Comparison with Peers
Financial Statements
Comprehensive financial data including income, balance sheet, and cash flow metrics
Income Statement
| fiscal_date | 2025-03-31 | 2024-03-31 | 2023-03-31 | 2022-03-31 | 2021-03-31 |
|---|---|---|---|---|---|
| Sales | 39.34B | 36.24B | 20.51B | 11.65B | 9.89B |
| Cost Of Goods | 33.19B | 30.91B | 17.70B | 10.52B | 8.73B |
| Gross Profit | 6.14B | 5.32B | 2.81B | 1.13B | 1.16B |
| Operating Expense Selling General And Administrative | 446.34M | 279.78M | 182.66M | 170.99M | 166.67M |
| Operating Expense Other Operating Expenses | 702.79M | 598.75M | 506.37M | 153.29M | 192.34M |
| Operating Income | 5.25B | 4.61B | 2.27B | 924.44M | 860.88M |
| Non Operating Interest Income | 321.55M | 122.20M | 36.08M | 14.23M | 8.92M |
| Non Operating Interest Expense | 481.98M | 323.06M | 228.90M | 129.00M | 182.97M |
| Pretax Income | 4.96B | 4.42B | 2.00B | 756.44M | 657.93M |
| Income Tax | 1.16B | 1.11B | 798.15M | 259.89M | 123.97M |
| Net Income | 3.80B | 3.31B | 1.21B | 496.55M | 533.96M |
| Eps Basic | 9.08 | 8.24 | 3.12 | 1.28 | 1.49 |
| Eps Diluted | 9.08 | 8.24 | 3.12 | 1.28 | 1.49 |
| Basic Shares Outstanding | 421.05M | 412.29M | 387.45M | 387.45M | 357.64M |
| Diluted Shares Outstanding | 421.05M | 412.29M | 387.45M | 387.45M | 357.64M |
| Ebit | 5.44B | 4.74B | 2.23B | 885.44M | 840.89M |
| Ebitda | 5.91B | 4.99B | 2.48B | 1.12B | 1.05B |
| Net Income Continuous Operations | 4.96B | 4.45B | 2.03B | 759.54M | 658.65M |
| Minority Interests | 19.88M | 5.41M | 1.12M | 209.00K | 33.00K |
| Preferred Stock Dividends | 0.00 | 0.00 | 0.00 | 0.00 | 0.00 |
Data provided by Twelve Data
Balance Sheet
| fiscal_date | 2025-03-31 | 2024-03-31 | 2023-03-31 | 2022-03-31 | 2021-03-31 |
|---|---|---|---|---|---|
| Cash And Cash Equivalents | 4.41B | 1.23B | 1.17B | 406.19M | 470.47M |
| Accounts Receivable | 8.15B | 4.91B | 2.13B | 709.86M | 721.22M |
| Total Assets | 39.99B | 29.40B | 16.34B | 10.72B | 9.91B |
| Total Liabilities | 12.32B | 13.08B | 8.31B | 3.90B | 3.58B |
| Long Term Debt | 424.47M | 185.48M | 191.94M | 279.14M | 330.93M |
| Shareholders Equity | 27.68B | 16.32B | 8.03B | 6.83B | 6.33B |
Data provided by Twelve Data
Cash Flow Statement
| fiscal_date | 2025-03-31 | 2024-03-31 | 2023-03-31 | 2022-03-31 | 2021-03-31 |
|---|---|---|---|---|---|
| Operating Activities Net Income | 4.96B | 4.45B | 2.03B | 759.54M | 658.65M |
| Operating Activities Other Non Cash Items | 283.36M | 287.82M | 253.17M | 167.62M | 202.52M |
| Operating Activities Accounts Receivable | -3.25B | -2.57B | -1.44B | 7.20M | -347.48M |
| Operating Activities Other Assets Liabilities | 1.04B | -4.15B | -784.21M | -580.42M | -287.24M |
| Operating Activities Operating Cash Flow | 3.03B | -1.98B | 63.01M | 353.94M | 226.45M |
| Investing Activities Capital Expenditures | -5.07B | -1.24B | -685.37M | -363.73M | -299.98M |
| Investing Activities Net Acquisitions | -50.00M | -3.02B | -63.92M | -61.41M | -17.56M |
| Investing Activities Purchase Of Investments | -19.80B | -500.20M | -466.35M | -82.93M | -291.43M |
| Investing Activities Sale Of Investments | 18.35B | 7.24M | N/A | N/A | N/A |
| Investing Activities Investing Cash Flow | -6.57B | -4.76B | -1.22B | -500.32M | -605.70M |
| Financing Activities Long Term Debt Issuance | 246.02M | 22.50M | 12.70M | 100.00M | 50.00M |
| Financing Activities Long Term Debt Payments | -48.42M | -181.20M | -150.00M | -119.84M | -330.35M |
| Financing Activities Short Term Debt Issuance | 1.27B | 658.66M | 1.63B | 34.13M | -132.89M |
| Financing Activities Common Stock Issuance | 8.11B | 5.12B | 0.00 | 0.00 | 850.00M |
| Financing Activities Common Dividends | -551.35M | -323.43M | N/A | N/A | N/A |
| Financing Activities Financing Cash Flow | 9.03B | 5.30B | 1.49B | 14.29M | 436.76M |
| End Cash Position | 4.41B | 1.23B | 1.17B | 406.99M | 470.47M |
| Free Cash Flow | -4.04B | -1.44B | 49.63M | 228.35M | 373.78M |
| Investing Activities Other Investing Activity | N/A | N/A | N/A | 7.75M | 3.27M |
Data provided by Twelve Data
Technical Analysis
Key Insights
- The current trend shows consolidation with the stock trading near ₹304, below the 200-day moving average of ₹329.93 and 50-day moving average of ₹310.90, indicating potential resistance at these levels.
- Key support is observed near the 52-week low of ₹247.15, while resistance aligns with the 52-week high of ₹457 and the 200-day moving average around ₹330.
- The stock is positioned below both the 10-day and 50-day moving averages, suggesting short-term bearish momentum, while the 200-day moving average remains a critical long-term resistance point.
- Momentum indicators such as RSI and MACD indicate neutral to slightly bearish signals, with no extreme overbought or oversold conditions currently evident.
- Analysis across daily, weekly, and monthly timeframes reveals mixed signals, with short-term weakness contrasted by longer-term consolidation phases.
- Potential market scenarios include a test of support levels near ₹247 if downward pressure persists, or a recovery attempt towards moving averages if buying interest strengthens.
Trending News
1. Headline: Sensex Dips 0.65% Amid Mixed Sectoral Trends; Jupiter Wagons Leads Small Caps Rally
Summary: The Indian equity market witnessed a subdued session on 6 March 2026, with the Sensex closing lower by 0.65% amid mixed sectoral performances and cautious investor sentiment. While select large caps and small caps posted notable gains, the broader market breadth remained weak, reflecting a ...
Sentiment: negative
2. Headline: Jupiter Wagons Ltd Surges on High Value Trading Amid Institutional Interest
Summary: Jupiter Wagons Ltd (JWL), a key player in the industrial manufacturing sector, has emerged as one of the most actively traded stocks by value on 6 March 2026, registering a remarkable 12.72% gain in a volatile market environment. Despite a modestly declining Sensex and sector performance, the ...
Sentiment: positive
3. Headline: Small-Cap Segment Edges Higher Led by Jupiter Wagons; Mixed Technical Calls Signal Cautious Optimism
Summary: The small-cap segment, represented by the BSE SMALLCAP 250 index, demonstrated modest gains on 6 Mar 2026, rising by 0.43%. This performance underscores the segment’s resilience amid a mixed sectoral backdrop, with notable individual stock movements and encouraging breadth indicators signalling ...
Sentiment: positive
4. Headline: Jupiter Wagons Shares Skyrocket 17% in Today’s Trading Session; Here’s Why
Summary: This railway stock and a provider of comprehensive mobility solutions surged up to 17 percent with heavy trading volumes and strong investor interest. The stock has gained for two straight sessions, although it continues to trade below key longer-term moving averages.
Sentiment: positive
5. Headline: Jupiter Wagons Stock Surge 15% on Institutional Buying
Summary: Jupiter Wagons stock surge sees a jump of 14.3% to ₹293.50 on institutional buying & a robust ₹5,041 crore order book on March 6, 2026.
Sentiment: positive
6. Headline: Railway stocks: Jupiter Wagons, IRCON, RVNL, Titagarh Rail among shares rallying up to 15% - BusinessToday
Summary: Jupiter Wagons led the rally, rising 15.20 per cent to Rs 293.55 on BSE. IRCON International Ltd soared 12.13 per cent to Rs 150.15. RVNL advanced 6.58 per cent to Rs 298.55.
Sentiment: positive
7. Headline: Jupiter Wagons Ltd Stock Falls to 52-Week Low Amidst Continued Financial Pressures
Summary: Jupiter Wagons Ltd, a key player in the Industrial Manufacturing sector, has touched a fresh 52-week low, closing at Rs 248.75 on 5 March 2026. This marks a significant decline from its 52-week high of Rs 457, reflecting ongoing financial headwinds and subdued market performance over the past year.
Sentiment: negative
8. Headline: Jupiter Wagons Ltd is Rated Sell
Summary: Jupiter Wagons Ltd is rated Sell by MarketsMOJO, with this rating last updated on 11 February 2026. While the rating was revised on that date, the analysis and financial metrics discussed here reflect the stock’s current position as of 23 February 2026, providing investors with an up-to-date ...
Sentiment: neutral
9. Headline: Jupiter Wagons Ltd (BOM:533272) Q3 2026 Earnings Call Highlights: Strong Income Growth Amid ...
Summary: Jupiter Wagons Ltd (BOM:533272) reports robust financial performance with a 13% income growth, despite ongoing supply constraints in wheelsets.
Sentiment: positive
10. Headline: Jupiter Wagons Limited Board Approves Unaudited Financial Results for Q3 FY2025-26 | InvestyWise
Summary: Jupiter Wagons Limited announced the outcome of its Board Meeting held on February 11, 2026. The Board approved…
Sentiment: neutral
Powered by Brave
Recent Updates
News Summary
Recent news highlights Jupiter Wagons Ltd.’s prominent role in the Indian railway stocks rally, with share prices rising up to 15% amid strong institutional buying and exceptional volume surges. The company has attracted significant market attention due to its robust order book and active trading volumes, signaling renewed investor interest. Despite a challenging broader market environment, Jupiter Wagons has demonstrated resilience, supported by positive trading activity and strategic positioning within the industrial manufacturing sector. These developments align with broader industry trends of infrastructure investment and rail sector growth in India, underscoring the company’s potential role in the evolving transportation landscape.
News Sentiment
The overall sentiment from recent news is predominantly positive, reflecting strong market interest and institutional confidence. Neutral tones appear in reports focusing on volume surges and sector rallies, while negative sentiments are limited and relate mainly to broader market fluctuations rather than company-specific issues. The positive sentiment is supported by quantitative data such as price gains and trading volumes, indicating constructive market dynamics around Jupiter Wagons.
Analytical Overview
Analysis Summary
Valuation Metrics: Jupiter Wagons’ trailing P/E of 46.07 and forward P/E of 32.99 are elevated relative to the industry average P/E of 46.07, suggesting a premium valuation that reflects growth expectations but also higher price multiples.
Growth Trajectory: The company’s revenue has declined by 13.5% quarter-over-quarter, and quarterly earnings growth year-over-year is negative at -35.3%, indicating near-term growth challenges despite solid trailing twelve months revenue of ₹31.8 billion.
Financial Health: Liquidity is strong with a current ratio of 2.10 and cash reserves of ₹6.91 billion, while total debt stands at ₹7.49 billion, resulting in a manageable debt-to-equity ratio of 0.27. Operating cash flow and free cash flow remain positive, supporting financial stability.
Sector Specific Factors: The Indian railroads sector benefits from government infrastructure initiatives and growing logistics demand, though challenges include supply constraints and competitive pressures. Regulatory environment and economic outlook in India remain critical factors influencing sector performance.
India Specific Factors: Regulatory policies favoring infrastructure development and increased rail freight movement present opportunities, while economic fluctuations and commodity price volatility pose risks. Consumer trends towards efficient logistics and government spending on rail modernization are supportive.
Investment Conclusion
Supporting Factors: Strong liquidity position with a current ratio above 2 and positive free cash flow.
Risk Factors: Declining quarterly revenue and negative earnings growth year-over-year.
SWOT Analysis
Strengths
- Strong liquidity with a current ratio of 2.10 supporting operational flexibility.
- Diverse product portfolio catering to key industrial sectors reliant on rail logistics.
- Significant promoter ownership ensuring aligned strategic direction.
- Positive free cash flow indicating healthy cash generation.
Weaknesses
- Declining quarterly revenue growth of -13.5% reflecting short-term challenges.
- High trailing P/E ratio of 46.07 suggesting premium valuation.
- Negative PEG ratio indicating earnings growth lagging price appreciation.
- Limited institutional ownership at 6.72% potentially affecting market liquidity.
Opportunities
- Growing Indian rail infrastructure investments supporting demand for rolling stock.
- Expansion potential in specialized railway components and mobility solutions.
- Increasing institutional interest may enhance market visibility and valuation.
- Government initiatives promoting rail freight and logistics efficiency.
Threats
- Supply chain constraints impacting production and delivery timelines.
- Economic volatility in India affecting industrial demand and investment.
- Competitive pressures from other rail manufacturing companies.
- Market valuation sensitivity to earnings performance and sector trends.
Company Description
Jupiter Wagons Ltd. is a prominent company specializing in the manufacturing of railway wagons and coach components. With a primary focus on the transportation sector, Jupiter Wagons plays a crucial role in the development of rail infrastructure by providing high-quality rolling stock and parts that support the efficient movement of goods and passengers. The company's product line includes a diverse range of wagons, such as freight cars, passenger coaches, and specialized railway components, designed to meet the demands of modern rail networks. Jupiter Wagons Ltd. is pivotal in supporting industrial sectors that rely heavily on rail for logistics, including industries such as steel, cement, and automobiles. By ensuring the availability of robust and reliable rail vehicles, Jupiter Wagons aids in enhancing the overall capacity and efficiency of transportation systems. In the financial market, Jupiter Wagons Ltd. holds significance as it reflects trends in the railway and logistics industries, and is indicative of infrastructural developments. The company’s advancements contribute to the larger economic landscape, showcasing the essential role of railway systems in global trade and commerce.