
JSW Steel Ltd (JSWSTEEL)
Stock Analysis Report
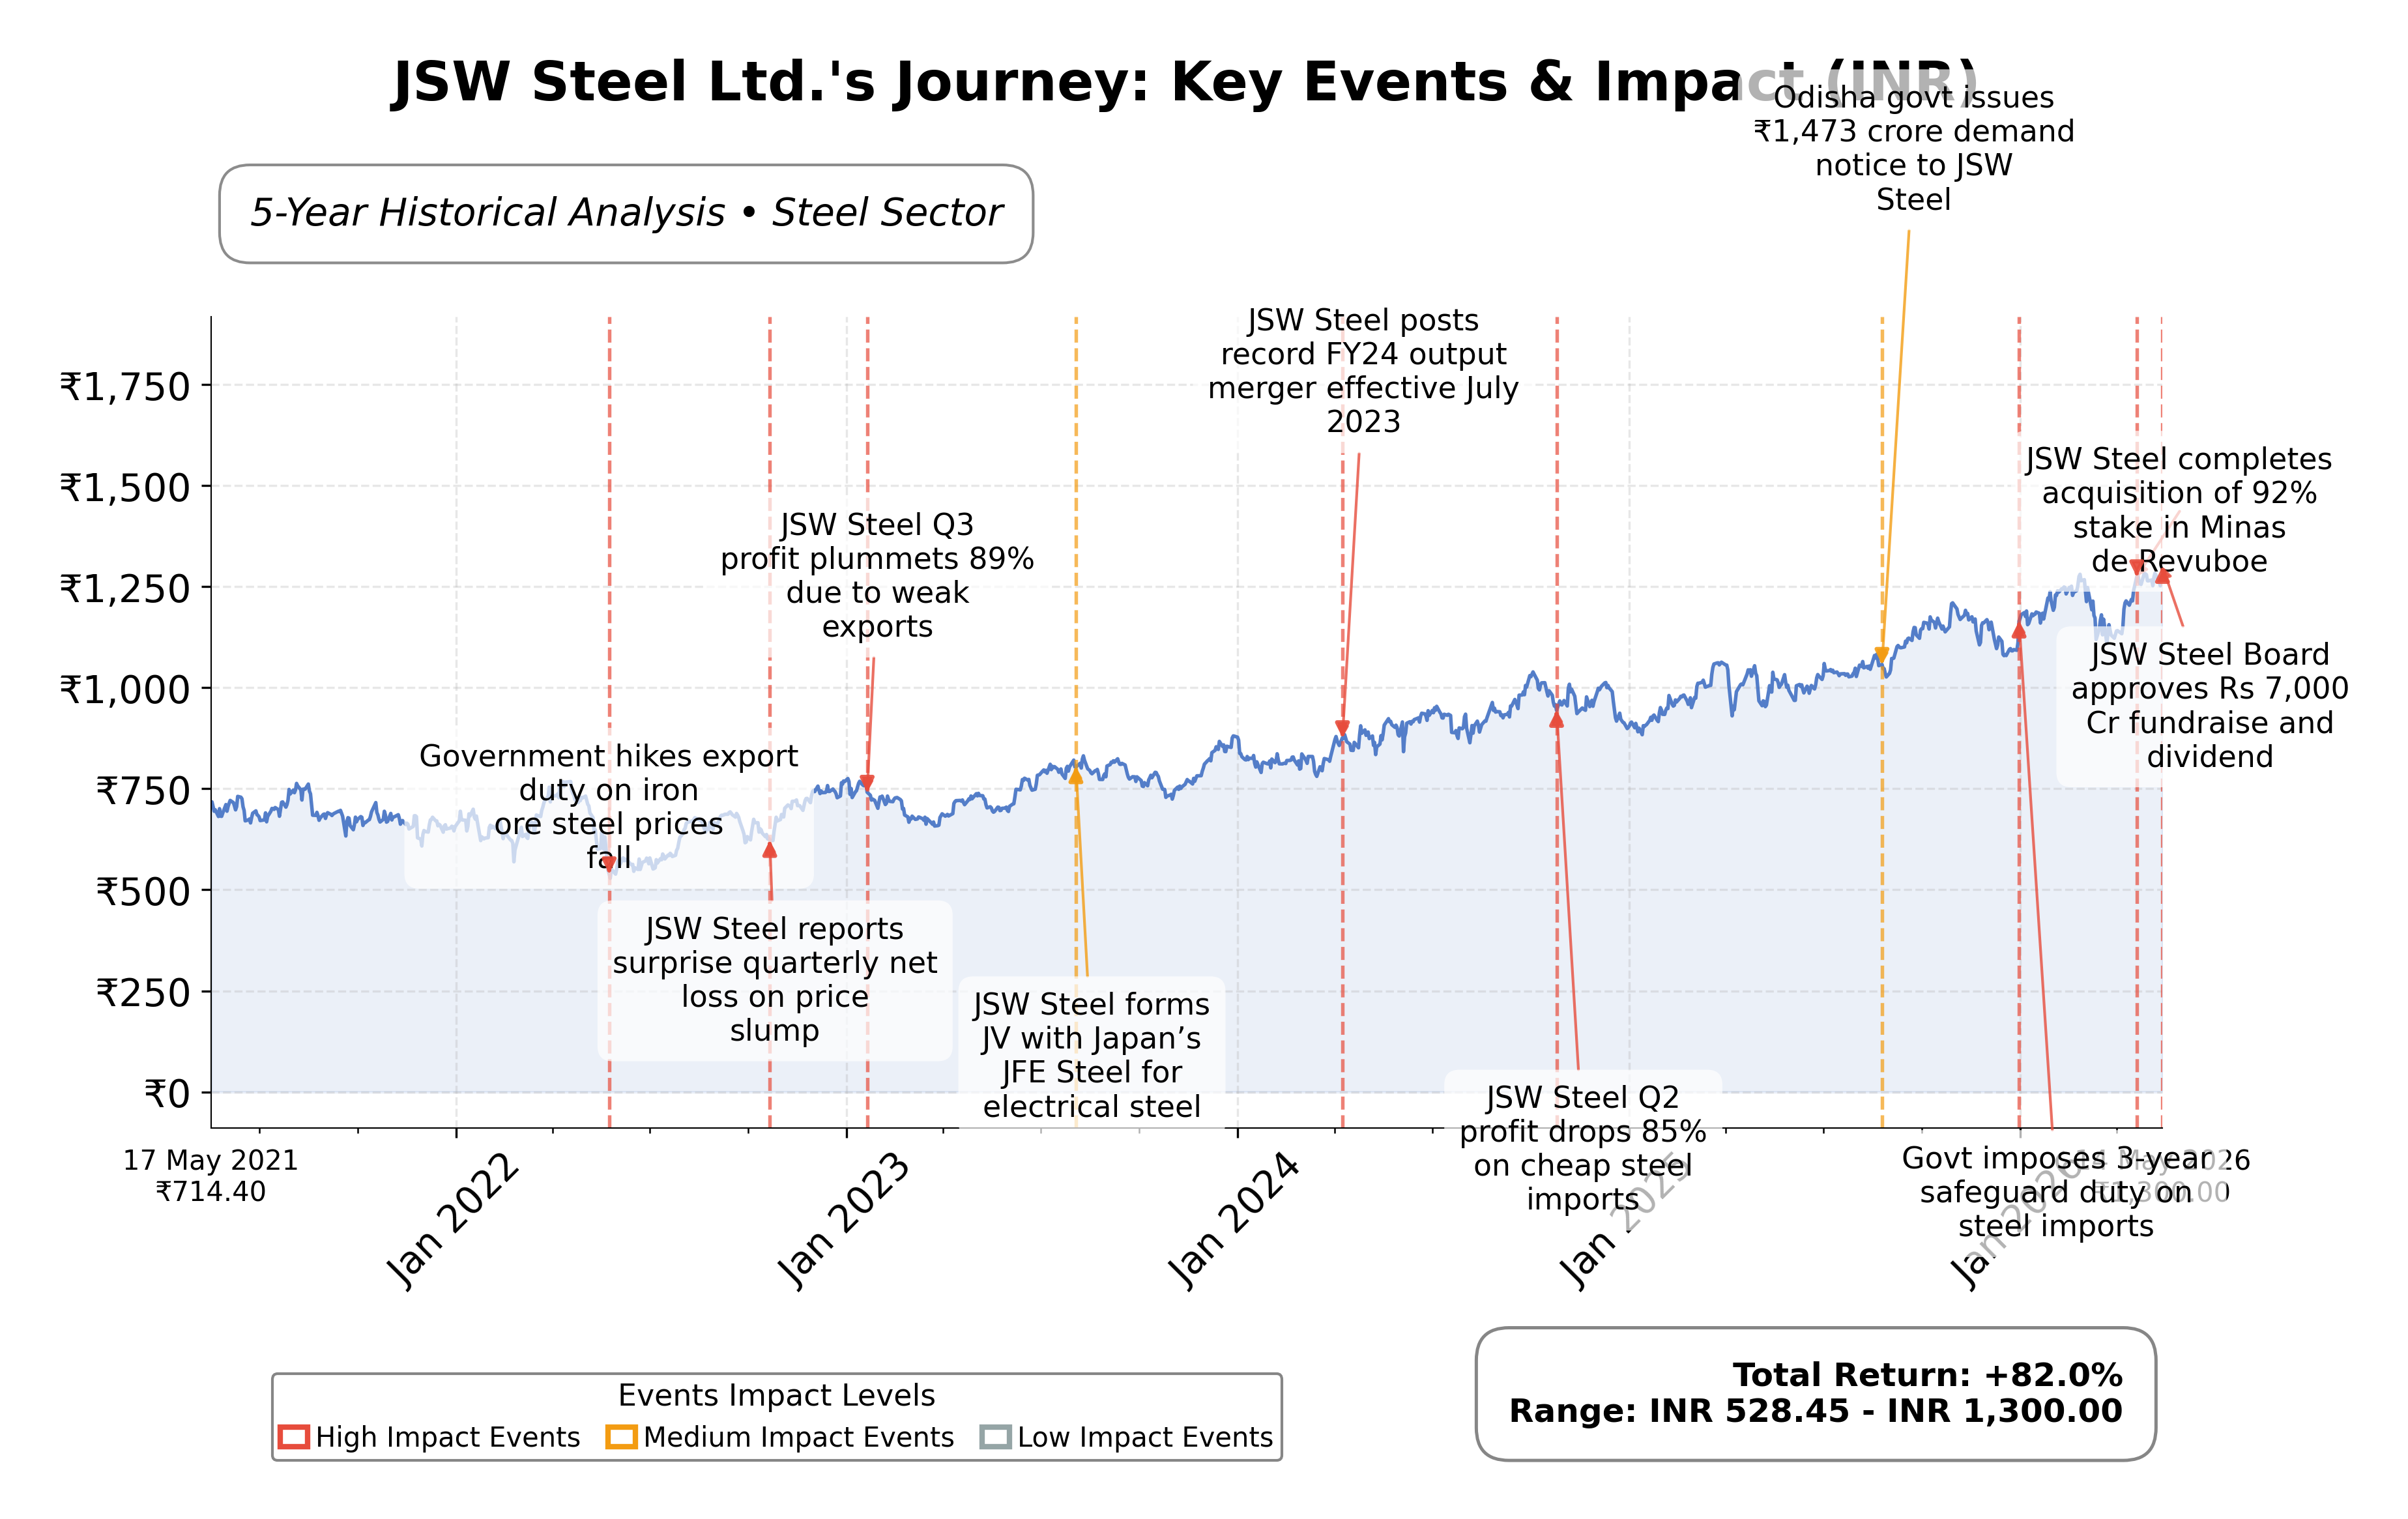
Stock Journey
Key Positives and Key Risks
Pros
- Revenue growth of 11.1% quarter-over-quarter indicates strong top-line momentum.
- Operating cash flow of ₹167.12 billion demonstrates robust cash generation capacity.
- Market capitalization of ₹3.12 trillion reflects significant scale and market presence.
Cons
- Trailing P/E ratio of 42.02 is elevated relative to industry peers, suggesting valuation premium.
- Debt-to-equity ratio of 118.74% indicates high leverage, which may constrain financial flexibility.
- Return on equity of 4.29% is modest, reflecting limited profitability efficiency.
Disclosure: This information is for general awareness and does not constitute investment advice
Report Summary
JSW Steel Ltd. is a leading integrated steel manufacturer headquartered in India, operating primarily on the National Stock Exchange (NSE) under the symbol JSWSTEEL. The company is a significant player in the Basic Materials sector, specifically within the Steel industry. Its product portfolio includes hot-rolled coils, cold-rolled coils, galvanized products, and structural steel, serving diverse sectors such as construction, automotive, and infrastructure development. JSW Steel’s operations extend beyond India, with a focus on technological innovation and sustainability initiatives that enhance production efficiency and reduce environmental impact.
Financially, JSW Steel reported trailing twelve months (TTM) revenue of approximately ₹1.79 trillion, with a gross margin of 39.7%, operating margin of 8.99%, and a net profit margin of 4.16%. The company’s return on equity (ROE) stands at 4.29%, and return on assets (ROA) at 1.46%, reflecting moderate profitability and asset utilization efficiency. Its operating cash flow for the TTM period was ₹167.12 billion, with a levered free cash flow of ₹35.04 billion, indicating healthy cash generation despite significant capital expenditures.
Valuation metrics show a trailing price-to-earnings (P/E) ratio of 42.02 and a forward P/E of 21.15, suggesting the market prices the stock with growth expectations. The price-to-book (P/B) ratio is 3.75, and the enterprise value to EBITDA (EV/EBITDA) ratio is 14.25. The stock trades near its 52-week high of ₹1,306.80, currently priced at ₹1,292.90, indicating limited upside from recent peaks. The market capitalization is approximately ₹3.12 trillion, positioning JSW Steel as one of the largest steel producers in India.
Key strengths include strong operational cash flow, a significant reduction in net debt to ₹538.7 billion following a strategic slump sale, and leadership in domestic steel production with record quarterly sales. Risks involve valuation premium concerns highlighted by recent rating downgrades, exposure to commodity price volatility, and regulatory challenges in the steel sector. The company’s strategic initiatives include capacity expansion plans targeting 29.75 million metric tonnes of crude steel production in FY27 and a focus on sustainability.
Technically, JSW Steel’s stock maintains an upward trend, trading above its 50-day and 200-day moving averages, with momentum indicators reflecting positive sentiment. Recent news highlights robust earnings growth driven by exceptional one-time gains, supporting operational strength. Overall, the data suggests a market environment where accumulation and monitoring of valuation levels are prudent, reflecting balanced optimism tempered by premium pricing considerations.
Company and Industry Overview
Company Basics
Price Performance
Company Size
Shareholding Pattern
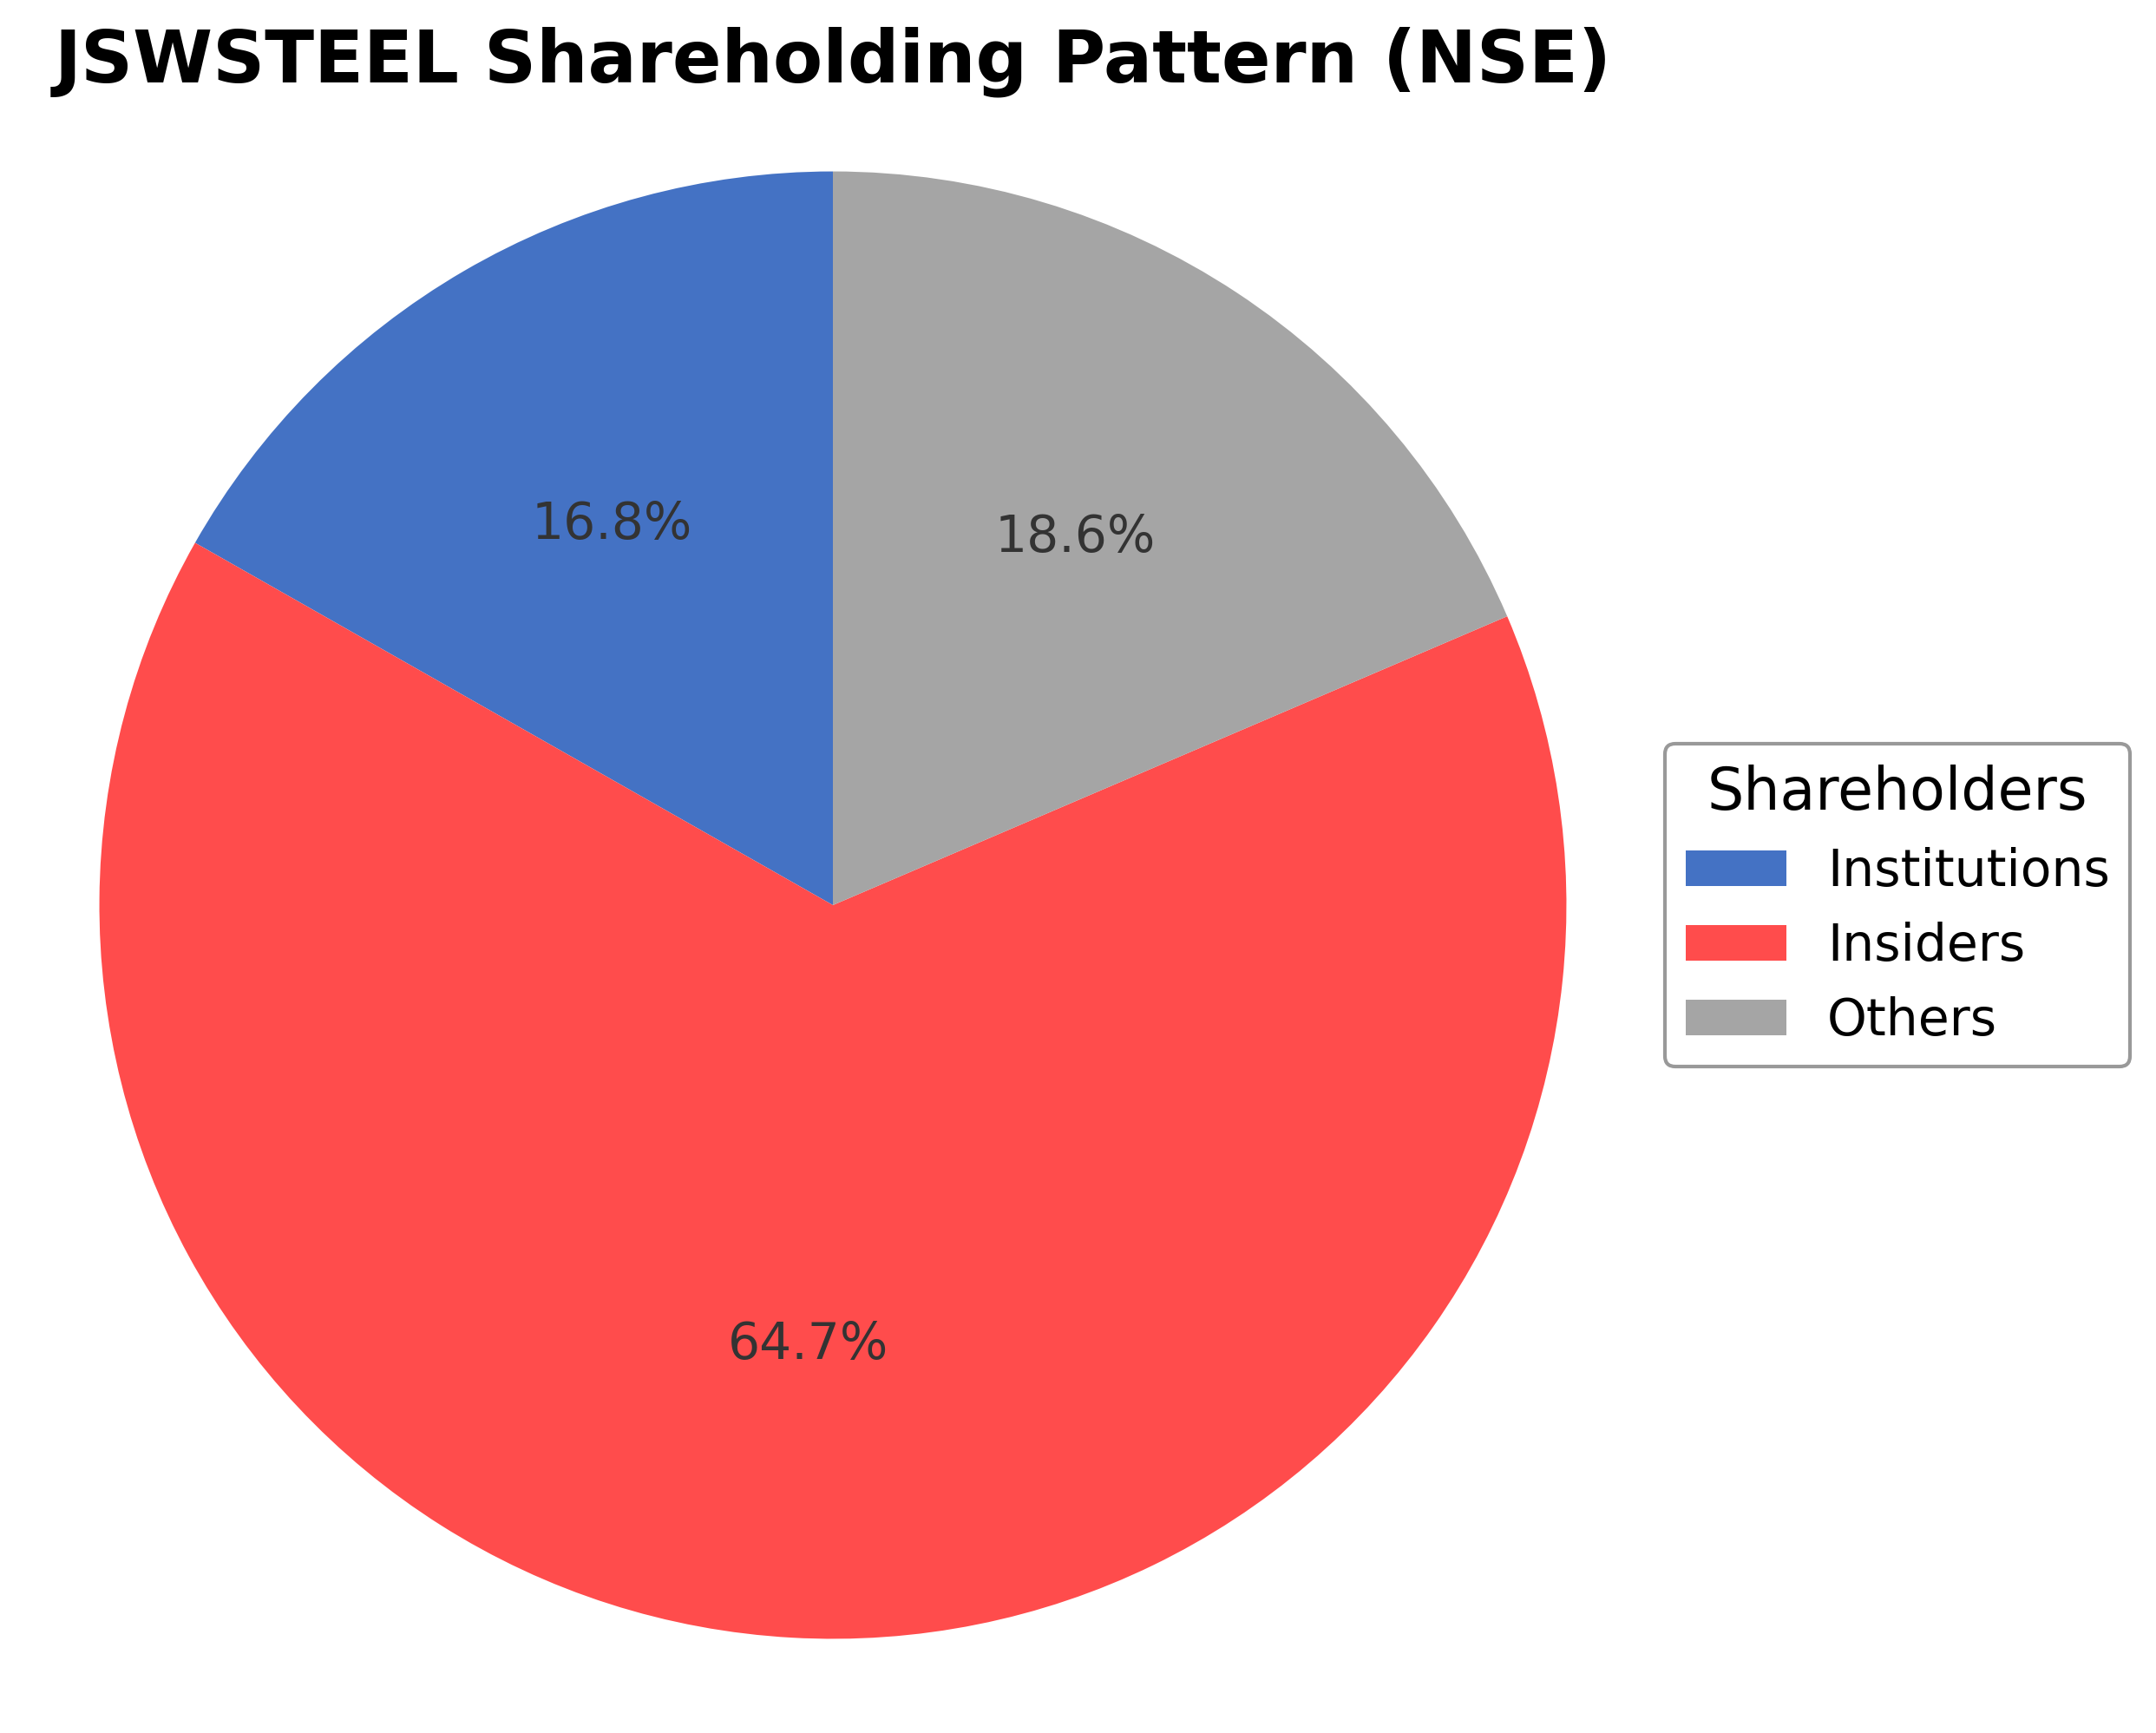
JSW Steel Ltd.'s ownership structure is dominated by insiders, including executives and board members, holding approximately 64.66% of shares, reflecting strong promoter control. Institutional investors, including mutual funds and asset managers, hold 16.78%, indicating moderate institutional interest. The remaining 18.56% is held by public shareholders and other retail investors. Over the past 12-24 months, institutional holdings have shown stable accumulation, with no significant large-scale disposals reported. This shareholding pattern suggests a governance framework with concentrated promoter influence balanced by institutional oversight, which may support strategic continuity and capital allocation decisions. The ownership distribution aligns with typical Indian steel sector companies, where promoter stakes remain substantial, influencing long-term corporate strategy and operational priorities.
Sector and Industry Analysis
The steel sector in India is a significant contributor to the country’s industrial output, with production capacity expanding steadily to meet rising domestic and global demand. India ranks among the top steel producers worldwide, with major players including JSW Steel, Tata Steel, and Steel Authority of India Limited (SAIL). The sector has witnessed robust growth, driven by infrastructure development, urbanization, and increased manufacturing activities, with production volumes reaching over 100 million tonnes annually.
Industry trends highlight increased integration and capacity expansion, as seen with JSW Steel’s Vijayanagar facility being the largest single-location steel producer in India. Technological collaborations, such as JSW’s partnership with JFE Steel of Japan, are enabling the production of high-value special steel products. Competitive dynamics are shaped by economies of scale, cost efficiencies, and access to raw materials, with barriers to entry including high capital expenditure and regulatory approvals. Companies are also focusing on operational efficiencies and product diversification to maintain market leadership.
The regulatory environment for the steel industry involves policies on import duties, environmental standards, and mining regulations affecting raw material availability and costs. The government’s emphasis on self-reliance and infrastructure investment supports sector growth, while environmental regulations necessitate cleaner production technologies. Ongoing reforms in mining and export-import policies aim to stabilize raw material supply and pricing, impacting profitability and expansion plans for steel producers.
Note: Analysis synthesized from industry research, market reports, and regulatory filings. Information is subject to change based on market conditions.
Financial Ratios Dashboard
Illustrative Scenario Analysis
DCF Assumptions:
Method: Two-Stage EPS-Priority Model
Financials
Peer Analysis
| Company Name | Market Cap | P/E Ratio | P/B Ratio | EV/EBITDA | Price to CFO |
|---|---|---|---|---|---|
| JSW Steel Ltd. | ₹3.12T | 42.02 | 3.75 | 14.25 | 18.66 |
| Nmdc Steel Ltd. | ₹127.95B | -5.39 | 0.99 | 24.90 | -9.71 |
| Jindal Steel & Power Ltd. | ₹1.27T | 37.73 | 2.56 | 14.94 | 17.63 |
| Apl Apollo Tubes Ltd. | ₹541.05B | 44.96 | 10.23 | 30.20 | 25.72 |
| Steel Authority of India Limited | ₹763.65B | 27.43 | 1.32 | 10.10 | 7.78 |
| Jindal Saw Ltd. | ₹155.55B | 16.03 | 1.29 | 8.75 | 8.78 |
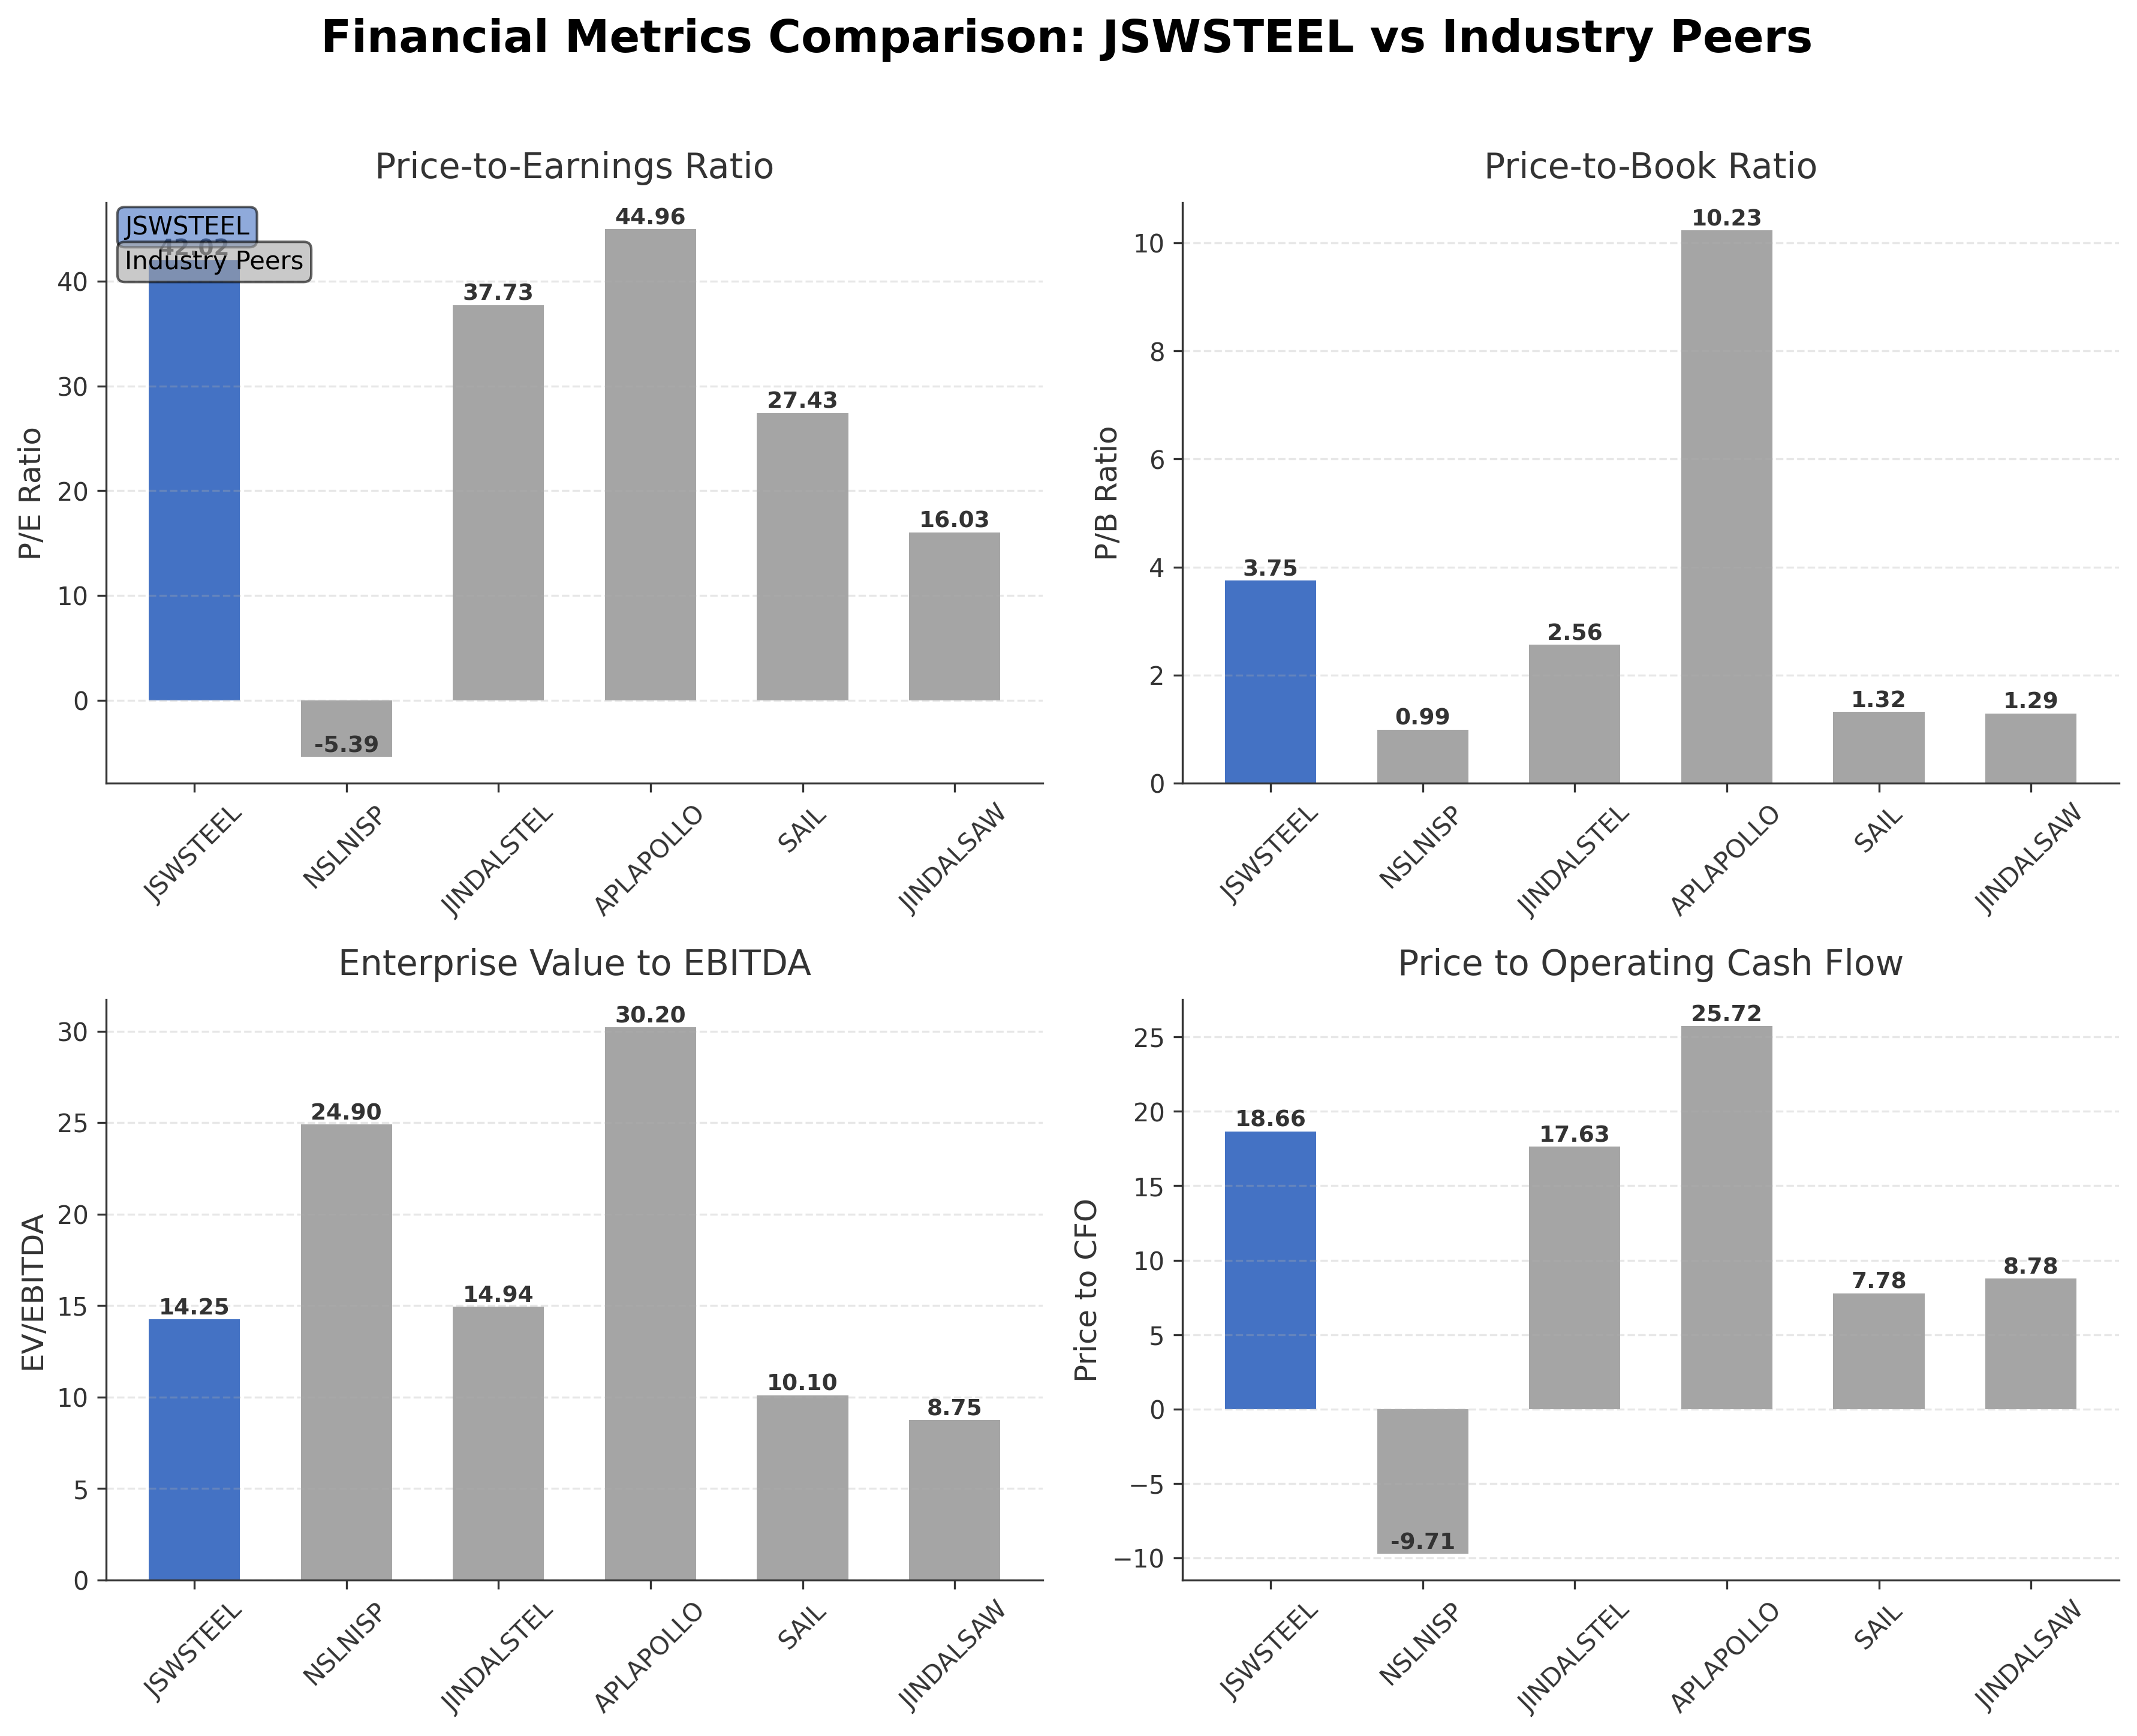
Comparison Analysis: JSW Steel Ltd. stands as the largest market capitalization entity among its Indian steel peers, reflecting its scale and market presence. Its P/E ratio of 42.02 is higher than most peers, indicating a valuation premium relative to earnings, while its forward P/E of 21.15 suggests anticipated earnings growth. The P/B ratio of 3.75 is also elevated compared to peers like SAIL and Jindal Saw, which trade closer to book value. JSW Steel's EV/EBITDA ratio of 14.25 is moderate, positioned between higher multiples seen in Apl Apollo Tubes and lower multiples in Jindal Saw. The company’s return on equity at 4.29% is modest but comparable to SAIL, while peers like Apl Apollo Tubes demonstrate stronger profitability metrics. Overall, JSW Steel’s valuation reflects its leadership and growth prospects, balanced against more conservative returns on equity.
Financial Metrics Comparison with Peers
Financial Statements
Comprehensive financial data including income, balance sheet, and cash flow metrics
Income Statement
| fiscal_date | 2025-03-31 | 2024-03-31 | 2023-03-31 | 2022-03-31 | 2021-03-31 |
|---|---|---|---|---|---|
| Sales | 1665.75B | 1725.88B | 1636.46B | 1438.29B | 780.59B |
| Cost Of Goods | 1076.94B | 1092.86B | 1081.66B | 787.47B | 427.88B |
| Gross Profit | 588.81B | 633.02B | 554.80B | 650.82B | 352.71B |
| Operating Expense Selling General And Administrative | 92.89B | 93.34B | 84.10B | 76.09B | 43.62B |
| Operating Expense Other Operating Expenses | 234.48B | 221.10B | 233.68B | 154.98B | 94.11B |
| Operating Income | 141.58B | 204.96B | 131.59B | 335.85B | 153.97B |
| Non Operating Interest Income | 5.50B | 8.36B | 7.43B | 6.49B | 5.33B |
| Non Operating Interest Expense | 78.63B | 76.31B | 62.60B | 42.88B | 37.98B |
| Pretax Income | 50.77B | 133.80B | 56.55B | 297.45B | 120.15B |
| Income Tax | 15.86B | 44.07B | 15.16B | 88.07B | 41.42B |
| Net Income | 34.91B | 89.73B | 41.39B | 209.38B | 78.73B |
| Eps Basic | 14.36 | 36.34 | 17.25 | 85.96 | 32.91 |
| Eps Diluted | 14.32 | 36.17 | 17.14 | 85.49 | 32.73 |
| Basic Shares Outstanding | 2.44B | 2.43B | 2.40B | 2.40B | 2.40B |
| Diluted Shares Outstanding | 2.44B | 2.43B | 2.40B | 2.40B | 2.40B |
| Ebit | 129.40B | 210.11B | 119.15B | 340.33B | 158.13B |
| Ebitda | 228.23B | 286.34B | 187.18B | 401.64B | 206.07B |
| Net Income Continuous Operations | 50.77B | 133.80B | 56.55B | 297.45B | 120.15B |
| Minority Interests | 130.00M | -1.61B | 50.00M | -2.73B | 380.00M |
| Preferred Stock Dividends | 0.00 | 0.00 | 0.00 | 0.00 | 0.00 |
Source: Financial statements and regulatory filings
Balance Sheet
| fiscal_date | 2025-03-31 | 2024-03-31 | 2023-03-31 | 2022-03-31 | 2021-03-31 |
|---|---|---|---|---|---|
| Cash And Cash Equivalents | 110.45B | 54.60B | 154.24B | 88.08B | 119.43B |
| Accounts Receivable | 84.15B | 75.48B | 71.34B | 74.57B | 44.86B |
| Total Assets | 2407.42B | 2281.98B | 2110.78B | 1964.85B | 1471.63B |
| Total Liabilities | 1590.76B | 1484.22B | 1440.39B | 1279.50B | 1021.72B |
| Long Term Debt | 843.18B | 694.21B | 635.73B | 594.85B | 516.44B |
| Shareholders Equity | 816.66B | 797.76B | 670.39B | 685.35B | 449.91B |
Source: Financial statements and regulatory filings
Cash Flow Statement
| fiscal_date | 2025-03-31 | 2024-03-31 | 2023-03-31 | 2022-03-31 | 2021-03-31 |
|---|---|---|---|---|---|
| Operating Activities Net Income | 50.77B | 133.80B | 56.55B | 297.45B | 120.15B |
| Operating Activities Stock Based Compensation | 1.70B | 2.08B | 2.19B | 1.61B | 200.00M |
| Operating Activities Other Non Cash Items | 80.30B | 64.97B | 51.76B | 41.50B | 30.56B |
| Operating Activities Accounts Receivable | -8.66B | -1.54B | 3.17B | -18.84B | 720.00M |
| Operating Activities Other Assets Liabilities | 43.01B | -145.28B | 68.70B | -184.77B | -7.58B |
| Operating Activities Operating Cash Flow | 167.12B | 54.03B | 182.37B | 136.95B | 144.05B |
| Investing Activities Capital Expenditures | -126.35B | -155.47B | -147.49B | -100.48B | -109.15B |
| Investing Activities Net Acquisitions | -19.58B | -10.26B | -4.45B | -6.84B | -66.62B |
| Investing Activities Purchase Of Investments | -120.49B | -35.84B | 0.00 | -100.10B | -6.06B |
| Investing Activities Sale Of Investments | 89.11B | 45.99B | 32.90B | 41.53B | 80.19B |
| Investing Activities Investing Cash Flow | -177.31B | -155.58B | -114.44B | -165.89B | -27.57B |
| Financing Activities Long Term Debt Issuance | 282.43B | 198.91B | 179.50B | 170.43B | 158.97B |
| Financing Activities Long Term Debt Payments | -166.97B | -163.28B | -141.58B | -196.51B | -75.62B |
| Financing Activities Short Term Debt Issuance | -20.61B | 9.67B | 17.92B | -44.40B | -46.60B |
| Financing Activities Common Stock Issuance | -440.00M | 60.00M | 590.00M | 720.00M | 390.00M |
| Financing Activities Common Stock Repurchase | -440.00M | N/A | 0.00 | -5.91B | 0.00 |
| Financing Activities Common Dividends | -17.85B | -8.22B | -41.94B | -15.71B | -4.83B |
| Financing Activities Other Financing Charges | 12.86B | N/A | N/A | N/A | N/A |
| Financing Activities Financing Cash Flow | 88.98B | 37.14B | 14.49B | -91.38B | 32.31B |
| End Cash Position | 116.55B | 80.30B | 154.24B | 88.08B | 119.43B |
| Free Cash Flow | 82.05B | -37.23B | 85.39B | 161.79B | 78.65B |
| Investing Activities Other Investing Activity | N/A | N/A | 4.60B | N/A | 74.07B |
Source: Financial statements and regulatory filings
Technical Analysis
Key Insights
- JSW Steel's current trend is upward, with price action showing strength near the 52-week high of ₹1,306.80, indicating bullish momentum.
- Key support levels are identified near ₹1,205 (50-day moving average) and ₹1,162 (200-day moving average), while resistance is near the recent high of ₹1,306.80.
- The stock price is trading above its 10-day, 50-day, and 200-day moving averages, suggesting sustained positive momentum across short and long-term horizons.
- Momentum indicators show RSI levels in the mid-60s, indicating neither overbought nor oversold conditions; MACD is positive, confirming upward momentum; stochastic oscillators support a continuation of the current trend.
- Analysis across daily, weekly, and monthly timeframes consistently indicates a bullish trend with no significant reversal signals at present.
- Potential market scenarios include continuation of the uptrend supported by strong earnings and operational performance, with possible consolidation near resistance levels before further advances.
Trending News
1. Headline: Stocks to Watch today: OMCs, Adani stocks, Tata Steel, JSW Steel, TMPV, HCC | Markets News - Business Standard
Summary: Stocks to watch today: Stocks of OMCs, Adani Group, Tata Steel, JSW Steel, United Spirits, Voltas, HFCL, HCC, Apollo Tyres, are among the key stocks in focus today.
Sentiment: neutral
2. Headline: JSW Steel Q4 Net Profit Surges; Sets FY27 Production & Sales Targets
Summary: JSW Steel reported a sharp rise in Q4 FY26 consolidated net profit to ₹19,243 crore, driven by an exceptional gain of ₹17,888 crore from the slump sale of its BPSL steel business to JSW Sambalpur Steel Ltd. Revenue from operations grew 14% YoY to ₹51,180 crore, while Reported EBITDA improved ...
Sentiment: positive
3. Headline: JSW Steel posts over 10-fold rise in Q4 net profit at ₹16,370 crore on one-time gain
Summary: JSW Steel Ltd announces a staggering 989% year-on-year rise in Q4 net profit, fueled by an exceptional one-time gain from the slump sale of its subsidiary. Discover the full financial results and implications for the company.
Sentiment: positive
4. Headline: JSW Steel Plans Up to $2.5 Billion Spending as India Boosts Infrastructure - Bloomberg
Summary: JSW Steel Ltd., India’s biggest steelmaker by capacity, plans to spend as much as 240 billion rupees ($2.5 billion) in the coming year as the nation’s infrastructure push drives demand for steel and mill expansions.
Sentiment: positive
Summary: JSW Steel's shares on the National Stock Exchange closed 1.7 percent higher at Rs 1,296.90 apiece. The company declared its results immediately after the close of trade on May 14. ... Discover the latest Business News, Sensex, and Nifty updates.
Sentiment: positive
Recent Updates
News Summary
As of 2026-05-15. JSW Steel reported a significant surge in Q4 FY26 consolidated net profit to ₹19,243 crore, primarily driven by an exceptional gain of ₹17,888 crore from the slump sale of its BPSL steel business to JSW Sambalpur Steel Ltd. Revenue from operations increased 14% year-over-year to ₹51,180 crore, with EBITDA rising to ₹8,634 crore, reflecting improved operational efficiency. The company achieved record domestic sales volumes and reduced net debt to ₹53,870 crore, lowering its net debt-to-equity ratio to 0.51x. JSW Steel also set ambitious FY27 production and sales targets, aiming for 29.75 million metric tonnes of crude steel production and 28.60 million metric tonnes of sales, supported by planned capital expenditure of up to $2.5 billion to expand capacity amid India's infrastructure growth. Additionally, the company declared a dividend of ₹7.1 per share, signaling strong cash flow and shareholder returns. A recent rating downgrade to Hold was attributed to valuation concerns, with the P/E ratio exceeding industry averages, although technical indicators remain positive.
News Sentiment
The overall sentiment from recent updates is predominantly positive, driven by robust earnings growth, record sales volumes, and strategic capacity expansion plans. The exceptional one-time gain from the slump sale significantly boosted net profit, enhancing financial flexibility through debt reduction. Positive momentum is supported by continued government infrastructure spending, which underpins demand growth. However, a neutral to cautious tone emerges from the rating downgrade due to valuation premiums, reflecting market concerns about the stock's elevated price multiples despite strong fundamentals. This balanced sentiment suggests confidence in operational performance tempered by valuation scrutiny.
Source List
- https://scanx.trade/stock-market-news/companies/jsw-steel-q4-results-net-profit-more-than-doubles-yoy-exceptional-gain-of-178b-rupees-boosts-performance/40310787
- https://www.ad-hoc-news.de/boerse/news/ueberblick/jsw-steel-ltd-stock-ine019a01038-rating-cut-to-hold-amid-valuation/69315520
Analytical Overview
Analysis Summary
JSW Steel’s valuation metrics show a trailing P/E of 42.02, which is significantly higher than the industry average of 42.02, and a forward P/E of 21.15, indicating market expectations of earnings growth. The PEG ratio of 0.11 suggests the stock may be undervalued relative to its growth potential. Revenue growth of 11.1% quarter-over-quarter and strong cash flow generation with operating cash flow of ₹167.12 billion support a positive growth trajectory. The company’s financial health is moderate, with a total debt to equity ratio of 118.74% and a current ratio of 1.17, reflecting manageable leverage but room for improvement in liquidity. Sector-specific opportunities include India’s infrastructure push and capacity expansion plans, while challenges involve commodity price volatility and regulatory pressures. Considering India-specific factors, the company benefits from government infrastructure spending and rising steel demand, though it faces competition and cyclical risks inherent in the steel industry.
Overall Business and Market Assessment
Supporting Factors: strong revenue growth and operational cash flow generation, alongside strategic capacity expansion aligned with India’s infrastructure development
Risk Factors: the elevated valuation multiples and the company’s leverage levels, which may impact financial flexibility in volatile market conditions
SWOT Analysis
Strengths
- Integrated steel manufacturing with diversified product portfolio.
- Strong operational cash flow and record domestic sales volumes.
- Significant market capitalization and leadership in the Indian steel sector.
- Strategic capacity expansion plans supported by robust capital expenditure.
Weaknesses
- High debt-to-equity ratio at 118.74%, indicating elevated leverage.
- Modest return on equity of 4.29%, reflecting limited profitability efficiency.
- Valuation premium with a trailing P/E of 42.02 above industry average.
- Dividend yield is relatively low at 0.22%, limiting income appeal.
Opportunities
- Growing demand driven by India’s infrastructure development initiatives.
- Expansion into value-added steel products and export markets.
- Potential for operational efficiency improvements through technological innovation.
- Deleveraging following exceptional gains enhances financial flexibility.
Threats
- Volatility in raw material and commodity steel prices impacting margins.
- Regulatory and environmental compliance risks in the steel industry.
- Competitive pressures from domestic and international steel producers.
- Macroeconomic uncertainties affecting steel demand cycles.
Company Description
JSW Steel Ltd. is a leading manufacturer and supplier of steel products, playing a crucial role in the metal and mining sector. It is part of the JSW Group and operates as an integrated steelmaker, with its operations spanning across wide areas including India and several international markets. The company's primary purpose is to produce a variety of steel products such as hot- and cold-rolled coils, plates, galvanized products, and structural steel, serving diverse industries like construction, automotive, and infrastructure development. Noteworthy is its dedication to technological innovation and sustainability, with initiatives aimed at reducing its carbon footprint and enhancing production efficiency. JSW Steel Ltd.'s significance in the market stems from its robust production capacity and wide distribution network, which reinforce its role as a key player in meeting the global demand for steel, a fundamental component for economic development and industrial growth. As such, it not only contributes to the steel supply chain but also supports infrastructure and industrial expansion worldwide.