
JSW Energy Ltd (JSWENERGY)
Stock Analysis Report
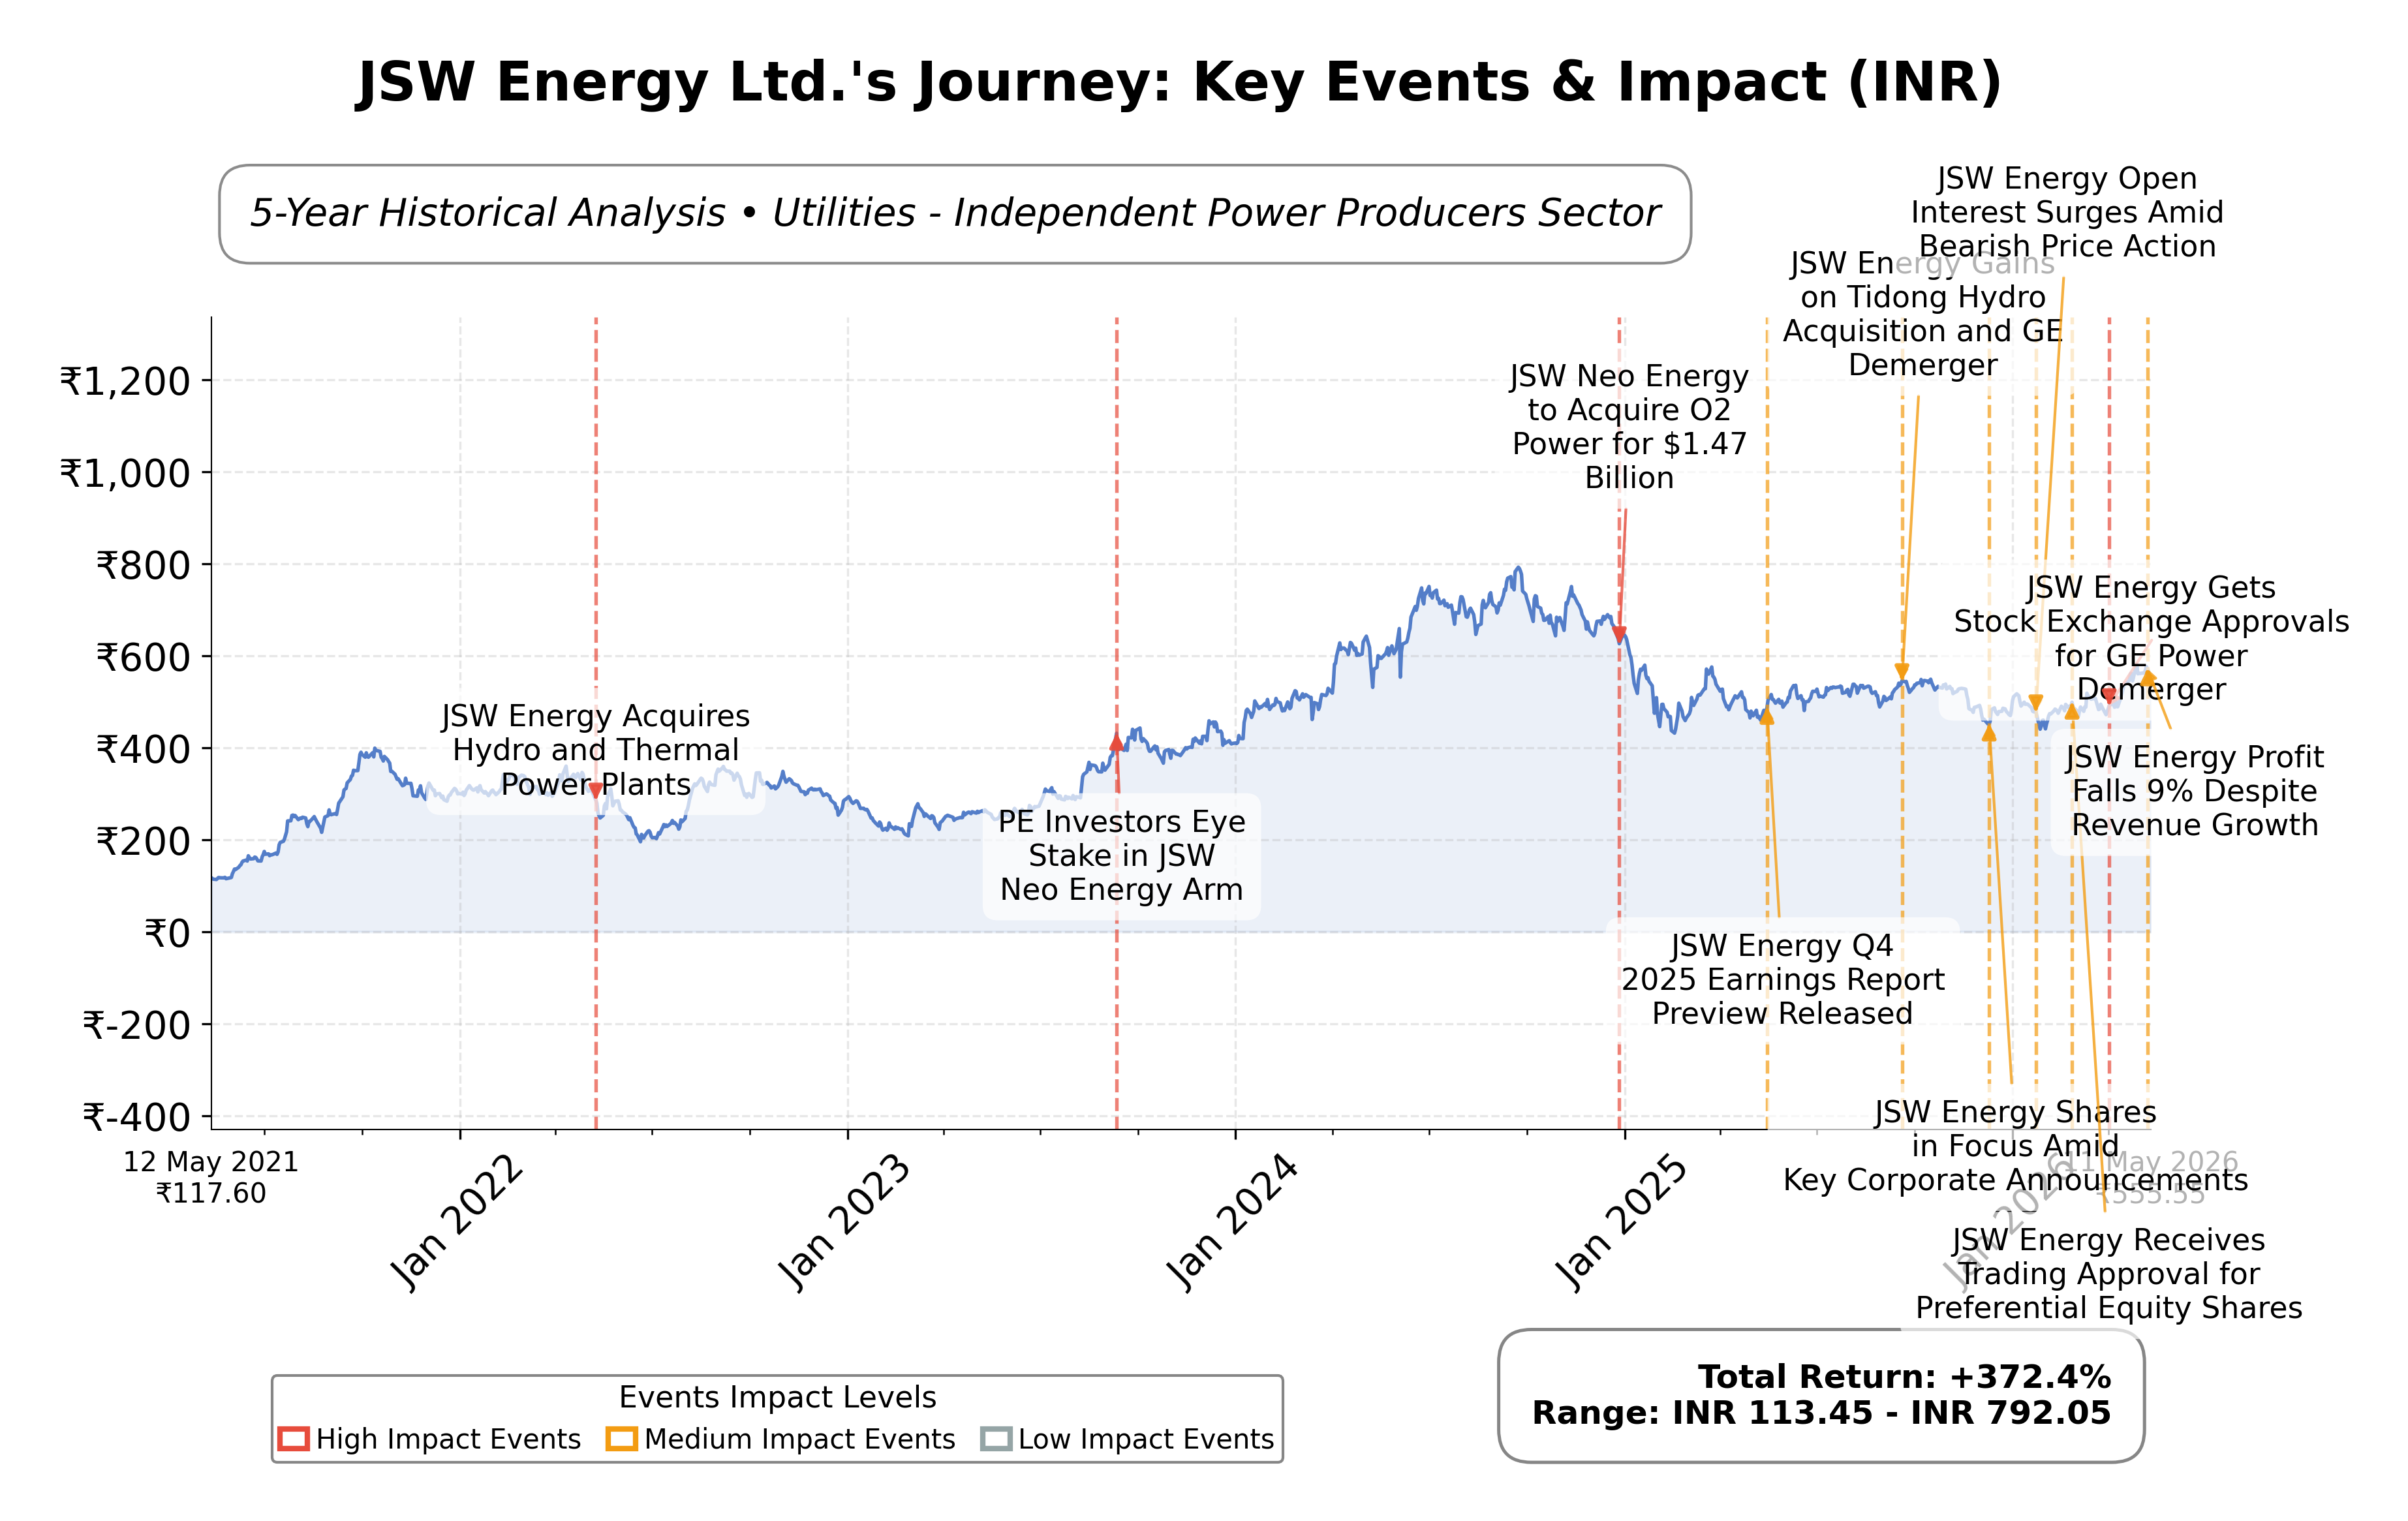
Stock Journey
Key Positives and Key Risks
Pros
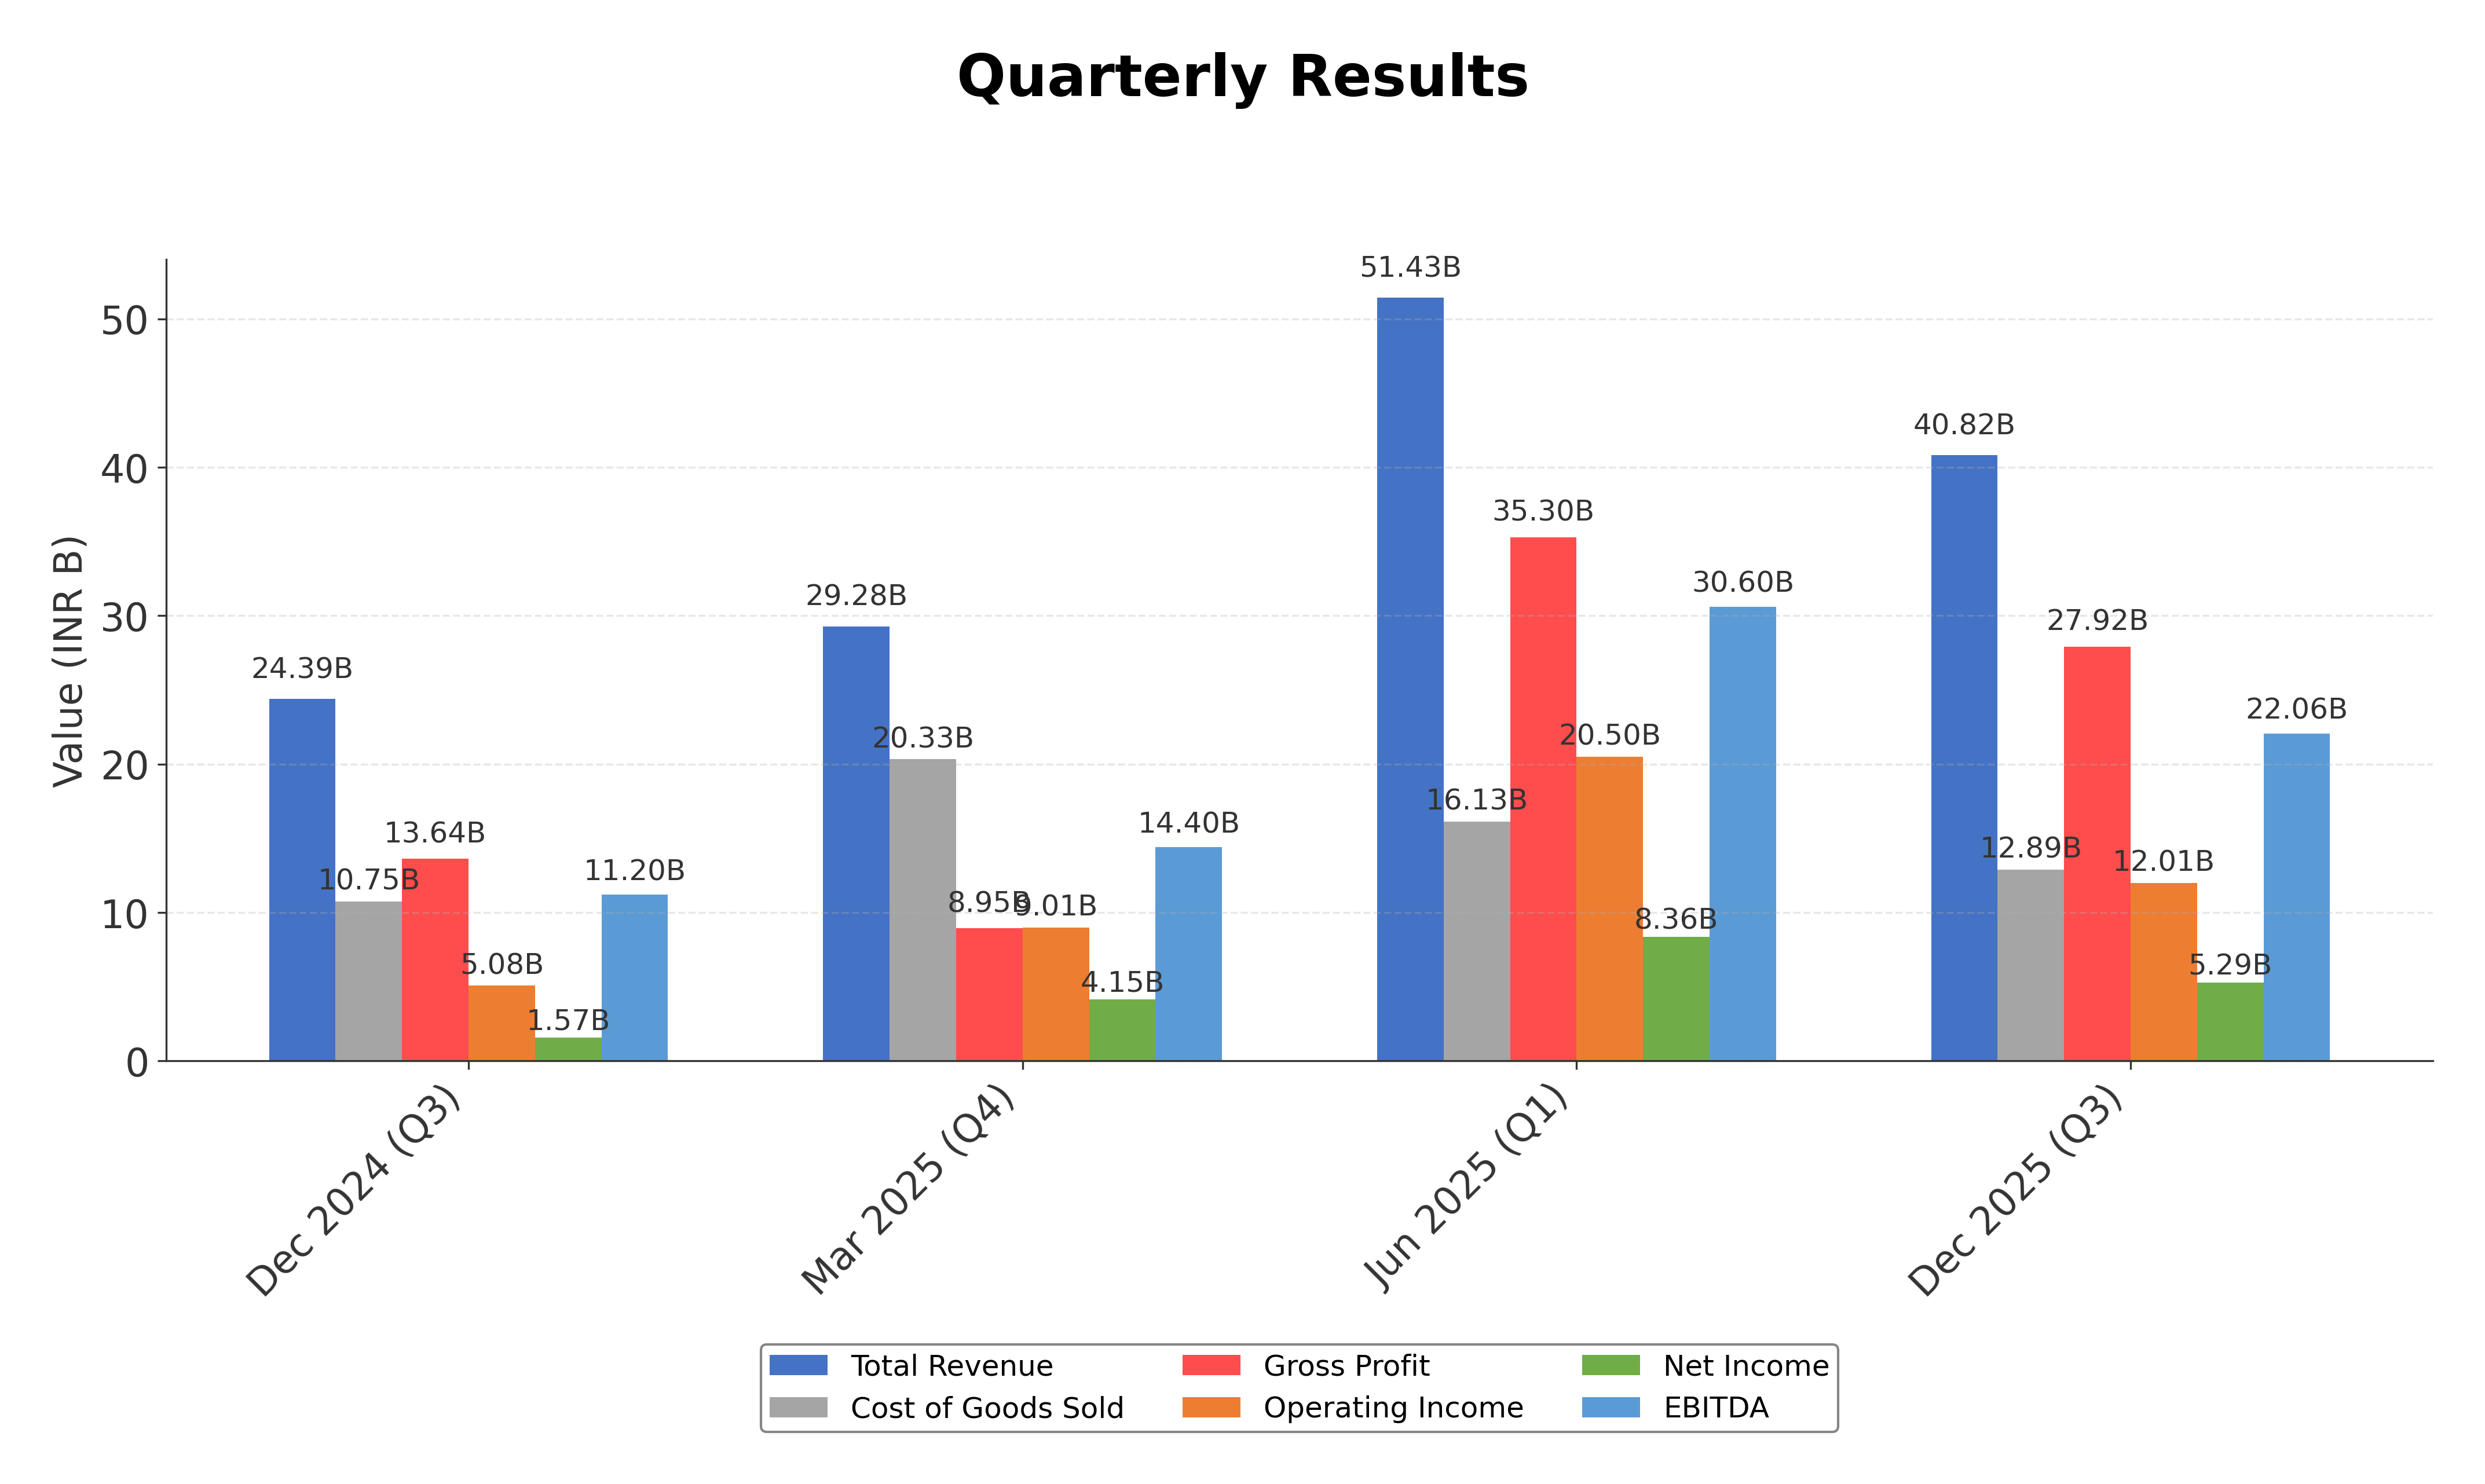
- Revenue growth of 67.4% quarterly indicates strong top-line momentum supporting expansion.
- Operating cash flow of INR 25.4 billion demonstrates solid liquidity and operational efficiency.
- Market capitalization of approximately INR 1.00 trillion reflects significant market presence and investor interest.
Cons
- High debt-to-equity ratio of 218.7 signals elevated financial risk and leverage concerns.
- Trailing P/E ratio of 43.87 is above industry average, suggesting premium valuation with limited margin.
- Return on equity at 6.7% is modest, indicating relatively low profitability compared to peers.
Disclosure: This information is for general awareness and does not constitute investment advice
Report Summary
JSW Energy Ltd. is a prominent player in the Indian utilities sector, specializing in the generation, transmission, and distribution of power. Listed on the NSE under the symbol JSWENERGY, it operates across multiple segments including thermal, hydroelectric, and solar power plants. As a subsidiary of the diversified JSW Group, the company leverages synergies with related sectors such as steel, cement, and infrastructure, positioning itself as a significant contributor to India's growing energy demands. Its focus on sustainability and renewable energy sources aligns with global trends and domestic policy priorities.
Financially, JSW Energy reported trailing twelve months (TTM) revenue of approximately INR 175.9 billion, with a gross margin of 68.4%, operating margin of 29.4%, and a net profit margin of 12.9%. The return on equity (ROE) stands at 6.7%, while return on assets (ROA) is 2.2%, reflecting moderate profitability and asset utilization efficiency. The company’s operating cash flow over the TTM period was INR 25.4 billion, supporting its operational liquidity. Despite a high debt-to-equity ratio of 218.7%, the current ratio of 1.03 indicates adequate short-term financial stability.
Valuation metrics show a trailing price-to-earnings (P/E) ratio of 43.87 and a forward P/E of 36.49, which are relatively high compared to industry peers, indicating premium pricing. The price-to-book (P/B) ratio is 3.42, and the enterprise value to EBITDA (EV/EBITDA) multiple is 20.93, suggesting the stock is valued richly relative to earnings and book value. The market capitalization is approximately INR 1.00 trillion, with the stock trading at INR 524.15 within a 52-week range of INR 427.75 to INR 585.65, placing it near the upper end of its recent price band.
JSW Energy’s strengths include a diversified energy portfolio, strong revenue growth of 67.4% quarterly, and robust cash flow generation. However, the company faces risks from its high leverage, regulatory changes in the energy sector, and competitive pressures from other power producers. Recent strategic developments include sustained investments in renewable energy and operational expansion, while leadership and governance remain stable under the JSW Group umbrella.
Technically, the stock is trading above its 50-day and 200-day moving averages, indicating an upward trend. Momentum indicators show mixed signals with moderate RSI levels and recent volatility in price action. Market activity has increased with open interest surging, reflecting heightened trader interest. Overall, the data suggests a balanced outlook where market participants may consider monitoring developments closely before making portfolio adjustments.
Company and Industry Overview
Company Basics
Price Performance
Company Size
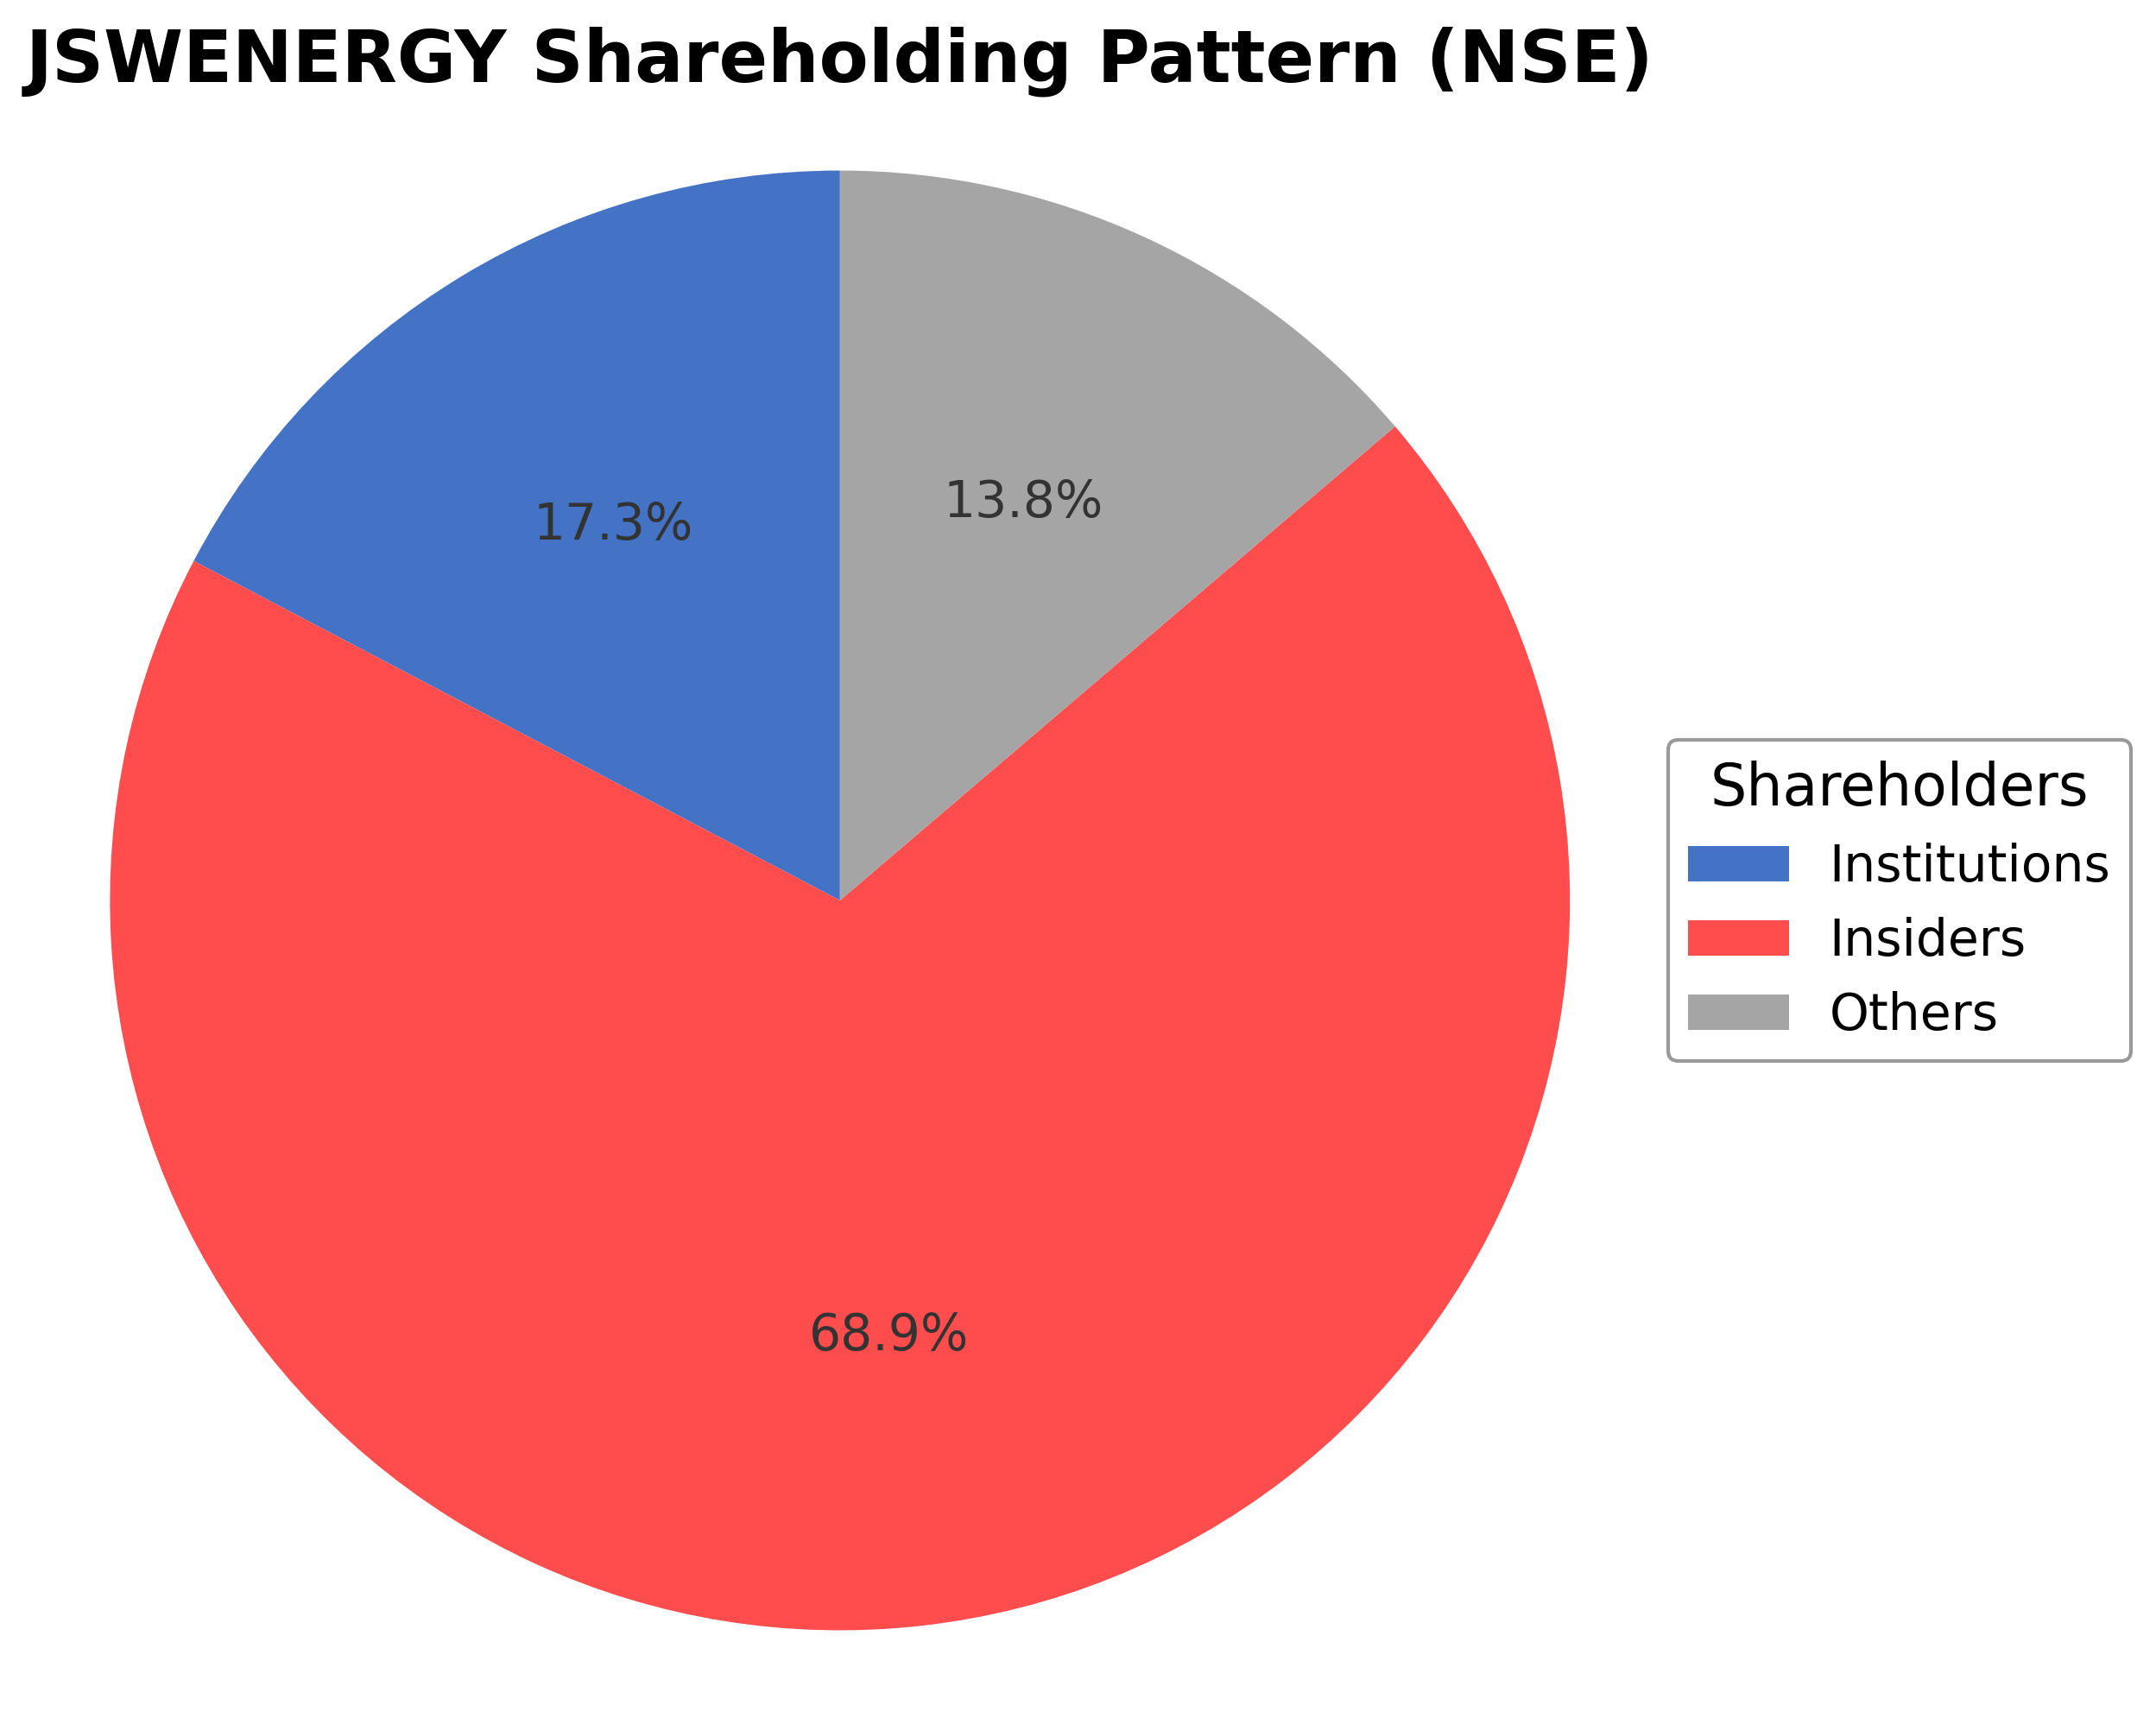
Shareholding Pattern
Sector and Industry Analysis
The power generation sector in India is a critical component of the country’s infrastructure, with a market size driven by growing energy demand from industrial, commercial, and residential users. The sector has witnessed steady growth, supported by government initiatives to increase power capacity and improve grid reliability. Key players include state-owned utilities and private companies such as NTPC, Tata Power, Adani Power, and JSW Energy, which collectively contribute to a diversified energy mix comprising thermal, hydro, and renewable sources.
Industry trends reflect a gradual shift from traditional thermal power towards renewable energy sources, driven by environmental concerns and cost competitiveness of solar and wind power. Despite this transition, thermal power remains significant, especially for base-load supply, with companies like JSW Energy maintaining substantial thermal assets while also investing in hydro and other clean energy projects. Barriers to entry include high capital intensity, regulatory approvals, and access to fuel resources, which favor established players with integrated operations and financial strength.
The regulatory environment is shaped by policies aimed at promoting sustainable energy, reducing carbon emissions, and ensuring affordable power supply. Key regulations include renewable purchase obligations, emissions standards for thermal plants, and tariff frameworks governed by state and central electricity regulatory commissions. These regulations impact operational costs and investment decisions, encouraging companies to diversify their energy portfolios and adopt cleaner technologies to align with national climate goals.
Note: Analysis synthesized from industry research, market reports, and regulatory filings. Information is subject to change based on market conditions.
Financial Ratios Dashboard
Illustrative Scenario Analysis
DCF Assumptions:
Method: Two-Stage EPS-Priority Model
Financials
Peer Analysis
| Company Name | Market Cap | P/E Ratio | P/B Ratio | EV/EBITDA | Price to CFO |
|---|---|---|---|---|---|
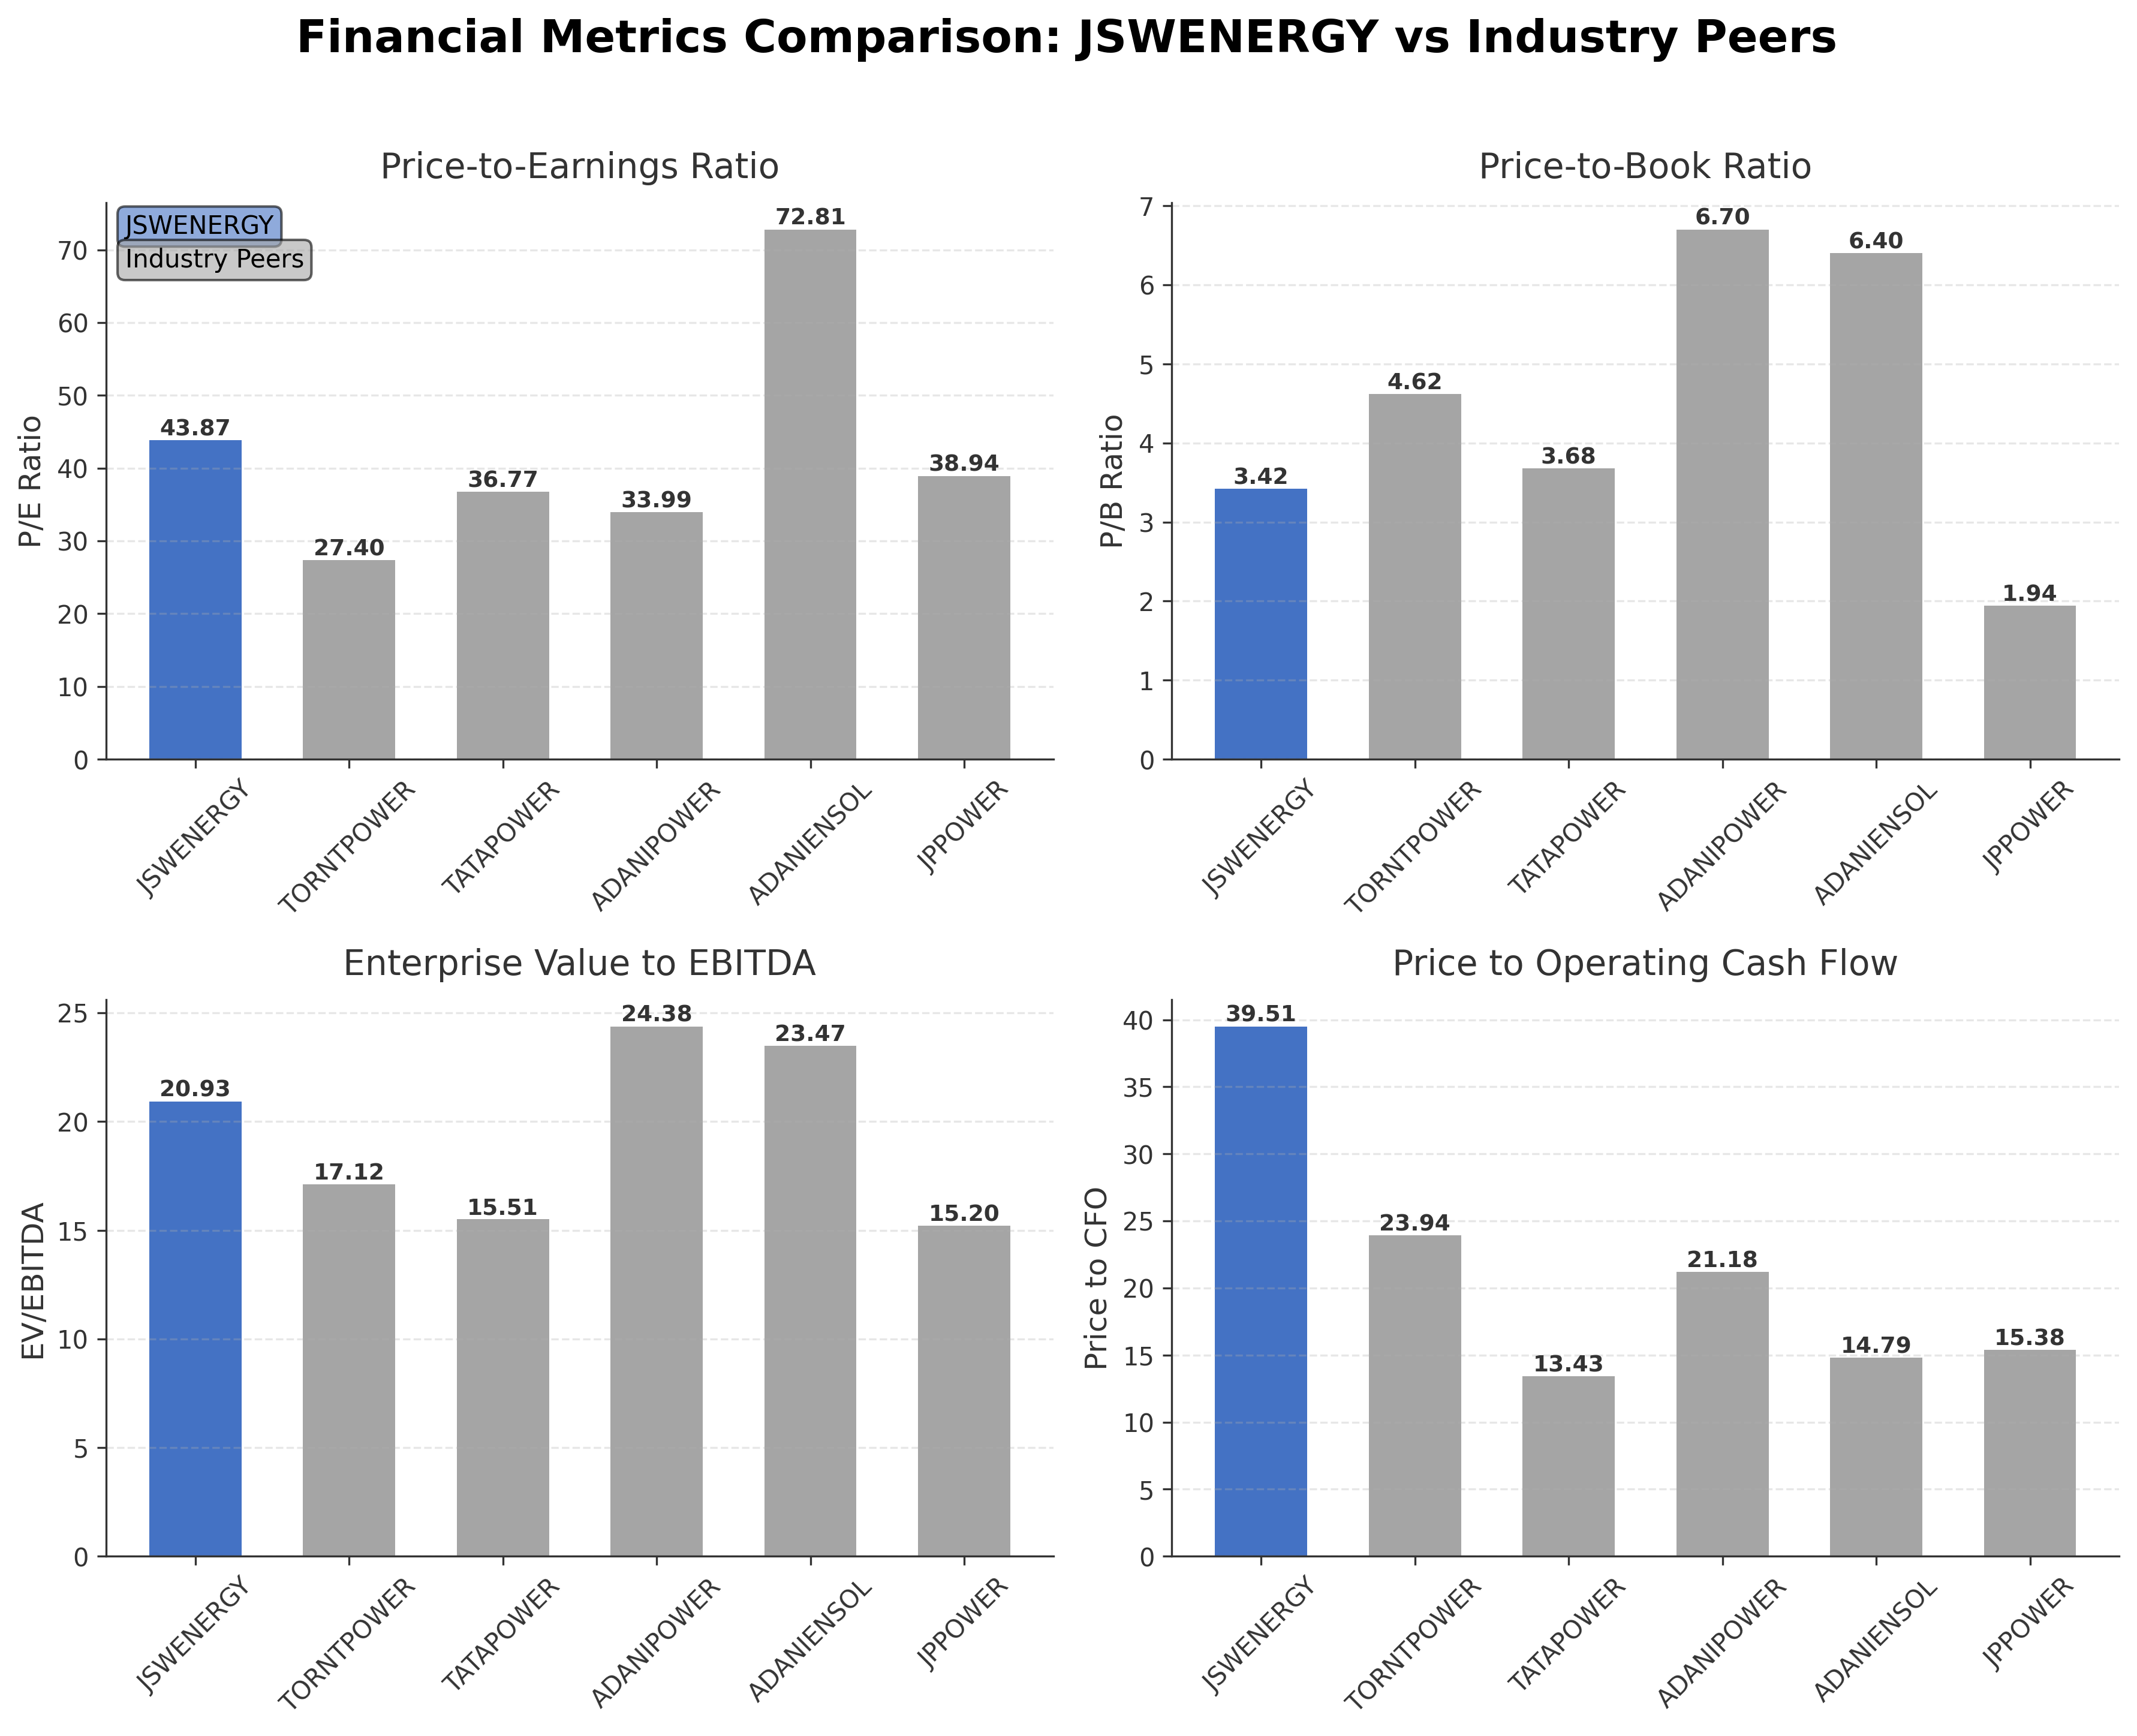
| JSW Energy Ltd. | ₹1.00T | 43.87 | 3.42 | 20.93 | 39.51 |
| Torrent Power Ltd. | ₹868.93B | 27.40 | 4.62 | 17.12 | 23.94 |
| Tata Power Company Limited | ₹1.39T | 36.77 | 3.68 | 15.51 | 13.43 |
| Adani Power Ltd. | ₹4.35T | 33.99 | 6.70 | 24.38 | 21.18 |
| Adani Energy Solutions Ltd. | ₹1.63T | 72.81 | 6.40 | 23.47 | 14.79 |
| Jaiprakash Power Ventures Ltd. | ₹130.76B | 38.94 | 1.94 | 15.20 | 15.38 |
Comparison Analysis: JSW Energy Ltd. trades at a higher P/E ratio of 43.87 compared to most peers, indicating a premium valuation. Its P/B ratio of 3.42 is moderate within the peer group, lower than Adani Power and Adani Energy Solutions but higher than Jaiprakash Power. The EV/EBITDA multiple of 20.93 is among the higher values, reflecting elevated enterprise valuation relative to earnings. JSW Energy’s price to CFO ratio of 39.51 is significantly above peers, suggesting a higher price relative to cash flow generation. Its return on equity of 0.07% is lower than most competitors, indicating comparatively modest profitability. Overall, JSW Energy appears richly valued relative to its peers, with strengths in market capitalization but room for improvement in profitability metrics.
Financial Metrics Comparison with Peers
Financial Statements
Comprehensive financial data including income, balance sheet, and cash flow metrics
Income Statement
| fiscal_date | 2025-03-31 | 2024-03-31 | 2023-03-31 | 2022-03-31 | 2021-03-31 |
|---|---|---|---|---|---|
| Sales | 114.84B | 114.26B | 103.12B | 81.19B | 68.53B |
| Cost Of Goods | 53.26B | 52.31B | 62.73B | 38.94B | 35.44B |
| Gross Profit | 61.58B | 61.95B | 40.40B | 42.25B | 33.09B |
| Operating Expense Selling General And Administrative | 1.97B | 1.56B | 1.29B | 839.10M | 665.90M |
| Operating Expense Other Operating Expenses | 2.92B | 2.61B | 2.55B | 1.89B | 1.11B |
| Operating Income | 37.45B | 37.74B | 21.77B | 25.53B | 17.24B |
| Non Operating Interest Income | 3.90B | 2.83B | 1.65B | 4.00B | 1.74B |
| Non Operating Interest Expense | 21.91B | 19.23B | 7.39B | 6.31B | 8.43B |
| Pretax Income | 22.14B | 21.67B | 19.43B | 22.38B | 10.99B |
| Income Tax | 2.31B | 4.42B | 4.63B | 4.95B | 2.76B |
| Net Income | 19.83B | 17.25B | 14.80B | 17.43B | 8.23B |
| Eps Basic | 11.19 | 10.50 | 9.01 | 10.52 | 4.84 |
| Eps Diluted | 11.18 | 10.47 | 8.99 | 10.50 | 4.84 |
| Basic Shares Outstanding | 1.74B | 1.64B | 1.64B | 1.64B | 1.64B |
| Diluted Shares Outstanding | 1.74B | 1.64B | 1.64B | 1.64B | 1.64B |
| Ebit | 44.05B | 40.90B | 26.82B | 28.69B | 19.42B |
| Ebitda | 59.02B | 56.79B | 36.35B | 40.69B | 30.98B |
| Net Income Continuous Operations | 22.14B | 21.67B | 19.43B | 22.38B | 10.99B |
| Minority Interests | -319.90M | -19.40M | -23.60M | -148.60M | -272.00M |
| Preferred Stock Dividends | 0.00 | 0.00 | 0.00 | 0.00 | 0.00 |
Source: Financial statements and regulatory filings
Balance Sheet
| fiscal_date | 2025-03-31 | 2024-03-31 | 2023-03-31 | 2022-03-31 | 2021-03-31 |
|---|---|---|---|---|---|
| Cash And Cash Equivalents | 32.34B | 30.92B | 34.22B | 5.85B | 3.67B |
| Accounts Receivable | 13.20B | 8.44B | 15.32B | 6.70B | 9.64B |
| Total Assets | 899.39B | 582.69B | 487.42B | 309.32B | 264.36B |
| Total Liabilities | 608.54B | 372.55B | 300.08B | 135.16B | 119.38B |
| Long Term Debt | 453.60B | 279.63B | 194.30B | 69.22B | 70.00B |
| Shareholders Equity | 290.85B | 210.14B | 187.34B | 174.17B | 144.98B |
Source: Financial statements and regulatory filings
Cash Flow Statement
| fiscal_date | 2025-03-31 | 2024-03-31 | 2023-03-31 | 2022-03-31 | 2021-03-31 |
|---|---|---|---|---|---|
| Operating Activities Net Income | 22.14B | 21.67B | 19.43B | 22.38B | 10.99B |
| Operating Activities Stock Based Compensation | 366.10M | 245.50M | 247.30M | 153.80M | 19.20M |
| Operating Activities Other Non Cash Items | 17.56B | 17.87B | 5.38B | 3.82B | 7.59B |
| Operating Activities Accounts Receivable | -7.27B | 6.39B | -5.02B | -66.50M | 8.04B |
| Operating Activities Other Assets Liabilities | -7.40B | 2.56B | -2.23B | -5.52B | 3.35B |
| Operating Activities Operating Cash Flow | 25.39B | 48.74B | 17.80B | 20.77B | 29.98B |
| Investing Activities Capital Expenditures | -67.07B | -80.32B | -42.37B | -22.94B | -3.42B |
| Investing Activities Net Acquisitions | -166.27B | 826.90M | -21.20B | 0.00 | N/A |
| Investing Activities Purchase Of Investments | -4.24B | -6.75B | -1.46B | -4.65B | -14.20M |
| Investing Activities Sale Of Investments | 5.20M | 4.60M | 0.00 | 1.67B | 0.00 |
| Investing Activities Other Investing Activity | -1.39B | 233.20M | -9.33B | -1.44B | -899.00M |
| Investing Activities Investing Cash Flow | -238.96B | -86.01B | -74.36B | -27.36B | -4.33B |
| Financing Activities Long Term Debt Issuance | 214.06B | 110.25B | 93.54B | 56.63B | 4.00B |
| Financing Activities Long Term Debt Payments | -27.35B | -67.23B | -9.70B | -60.36B | -21.95B |
| Financing Activities Short Term Debt Issuance | -2.45B | 683.10M | 3.53B | 7.66B | 2.90B |
| Financing Activities Common Stock Issuance | 49.47B | -106.90M | 42.70M | -844.20M | 9.70M |
| Financing Activities Common Dividends | -3.64B | -3.47B | -3.29B | -3.29B | -1.64B |
| Financing Activities Financing Cash Flow | 230.08B | 40.13B | 84.13B | -206.90M | -16.68B |
| End Cash Position | 52.52B | 41.80B | 44.69B | 18.35B | 10.51B |
| Free Cash Flow | -28.70B | -17.99B | -21.52B | 6.58B | 32.64B |
Source: Financial statements and regulatory filings
Technical Analysis
Key Insights
- JSW Energy is currently exhibiting an upward trend, trading above its 50-day (₹514.07) and 200-day (₹507.52) moving averages, indicating positive price momentum.
- Key support levels are identified near ₹500, with resistance encountered around the recent 52-week high of ₹585.65.
- Price remains above the 10-day moving average, reinforcing short-term bullish momentum.
- Momentum indicators show the RSI in a moderate range, suggesting neither overbought nor oversold conditions; MACD indicates a neutral to slightly positive crossover.
- Daily and weekly timeframes confirm a sustained upward trajectory, while monthly charts show consolidation within a rising channel.
- Market scenarios suggest potential continuation of the current trend if support holds, with possible volatility near resistance levels.
Trending News
1. Headline: JSW Energy Ltd. Shares Plunge Over 8 Percent After Q4 Profit Decline
Summary: ALSO READ: JSW Energy Q4 Results: Profit Slides Even As Revenue Jumps 40%; Dividend Declared · Essential Business Intelligence, Continuous LIVE TV, Sharp Market Insights, Practical Personal Finance Advice and Latest Stories — On NDTV Profit. ... Stock Market Crash News Mumbai Water Cut Stocks ...
Sentiment: negative
Summary: Home / Markets / Capital Market News / Stock Alert: JSW Energy, Heritage Foods, Satin Creditcare, Corona Remedies, Indian Hotels
Sentiment: neutral
3. Headline: JSW Energy Ltd Sees Sharp Open Interest Surge Amid Mixed Price Action
Summary: JSW Energy Ltd (JSWENERGY) has witnessed a notable 10.9% increase in open interest in its derivatives segment, signalling heightened market activity and shifting positioning among traders. Despite this surge, the stock has underperformed its sector and declined over the past two sessions, ...
Sentiment: positive
4. Headline: JSW Energy Consolidated March 2026 Net Sales at Rs 4,498.58 crore, up 41.05% Y-o-Y- Moneycontrol.com
Summary: JSW Energy EPS has decreased to Rs. 2.12 in March 2026 from Rs. 2.34 in March 2025. JSW Energy shares closed at 571.20 on May 07, 2026 (NSE) and has given 8.42% returns over the last 6 months and 18.73% over the last 12 months. ... Discover the latest Business News, Sensex, and Nifty updates.
Sentiment: negative
Summary: JSW Energy Limited reported earnings results for the fourth quarter and full year ended March 31, 2026. For the fourth quarter, the company reported sales was INR 44,985.8 million compared to INR...
Sentiment: neutral
Recent Updates
News Summary
As of May 11, 2026. JSW Energy Ltd. reported a significant 38% year-on-year increase in consolidated net profit for the quarter ended March 31, 2026, reaching Rs 574 crore. This strong earnings growth was supported by a 41% rise in revenue to Rs 4,499 crore, reflecting robust operational performance and demand expansion. The company’s official earnings release detailed these financial results, providing stakeholders with comprehensive insights into its fiscal year performance. These developments underscore JSW Energy's capacity to enhance profitability alongside revenue growth, despite some market volatility in the stock price following the announcement.
News Sentiment
The overall sentiment from recent updates is mixed to positive, driven primarily by the strong quarterly earnings growth and revenue expansion reported by JSW Energy. Positive sentiment is bolstered by the 38% increase in net profit and 41% rise in revenue, indicating effective operational execution. However, some negative market reactions and profit margin concerns temper enthusiasm, reflecting investor caution regarding cost pressures and valuation levels. The balanced tone suggests that while financial results are encouraging, market participants remain attentive to margin sustainability and broader sector dynamics.
Source List
Analytical Overview
Analysis Summary
JSW Energy’s valuation metrics, including a trailing P/E of 43.87 and forward P/E of 36.49, are elevated relative to the industry average P/E of 43.87, indicating a premium valuation that may reflect growth expectations but also limits margin of safety. The company exhibits a strong growth trajectory with quarterly revenue growth of 67.4% and a 38% increase in net profit year-over-year, supported by positive cash flow trends including operating cash flow of INR 25.4 billion and free cash flow of INR 19.5 billion. Financial health is challenged by a high debt-to-equity ratio of 218.7, although liquidity metrics like a current ratio of 1.03 and substantial cash reserves of INR 71.9 billion provide some cushion. Sector-specific challenges include regulatory risks and competitive pressures in the Indian power market, while opportunities arise from increasing demand for renewable energy and infrastructure expansion. Considering India-specific factors, the regulatory environment is evolving with a focus on clean energy, and consumer trends favor sustainable power solutions, which align with JSW Energy’s strategic initiatives.
Overall Business and Market Assessment
Supporting Factors: robust revenue and profit growth, strong cash flow generation, and a diversified energy portfolio that includes renewables
Risk Factors: the company’s high leverage and potential margin pressures amid regulatory and competitive challenges
SWOT Analysis
Strengths
- Strong revenue growth with a 41% increase in Q4FY26 revenue.
- Diversified energy portfolio including thermal, hydroelectric, and solar power.
- Robust cash flow generation supporting operational needs.
- Significant promoter ownership ensuring stable governance.
Weaknesses
- High debt-to-equity ratio of 218.7 indicating elevated financial leverage.
- Moderate return on equity at 6.7% reflecting limited profitability.
- Relatively high valuation multiples compared to peers.
- Profit margins under pressure despite revenue growth.
Opportunities
- Growing demand for renewable energy in India.
- Regulatory support for clean energy initiatives.
- Expansion potential in transmission and distribution segments.
- Synergies from JSW Group’s diversified industrial presence.
Threats
- Regulatory changes impacting tariffs and operations.
- Intense competition in the independent power producer sector.
- Volatility in fuel prices affecting cost structure.
- Economic slowdown potentially reducing energy demand.
Company Description
JSW Energy Ltd. operates as a major player in the energy sector, focusing on the generation, transmission, and distribution of power. As a key subsidiary of the diverse JSW Group, it plays a crucial role in India's energy landscape. The company's assets span thermal, hydroelectric, and solar power plants, reflecting a commitment to both traditional energy production and renewable sources. With significant operations across various Indian states, JSW Energy Ltd. contributes to meeting the rising energy demands of the country's industrial, commercial, and residential sectors. Its diverse energy portfolio and strategic initiatives in clean energy underscore its dedication to sustainability and innovation in power generation. As part of a larger conglomerate, JSW Energy Ltd. capitalizes on synergies and cross-sector collaborations within steel, cement, and infrastructure segments, enhancing operational efficiency and market reach. This makes it a significant entity in the Indian power market, poised to address the dynamic needs of a growing economy while aligning with global sustainability trends.