
J.B. Chemicals & Pharmaceuticals Ltd (JBCHEPHARM)
Stock Analysis Report
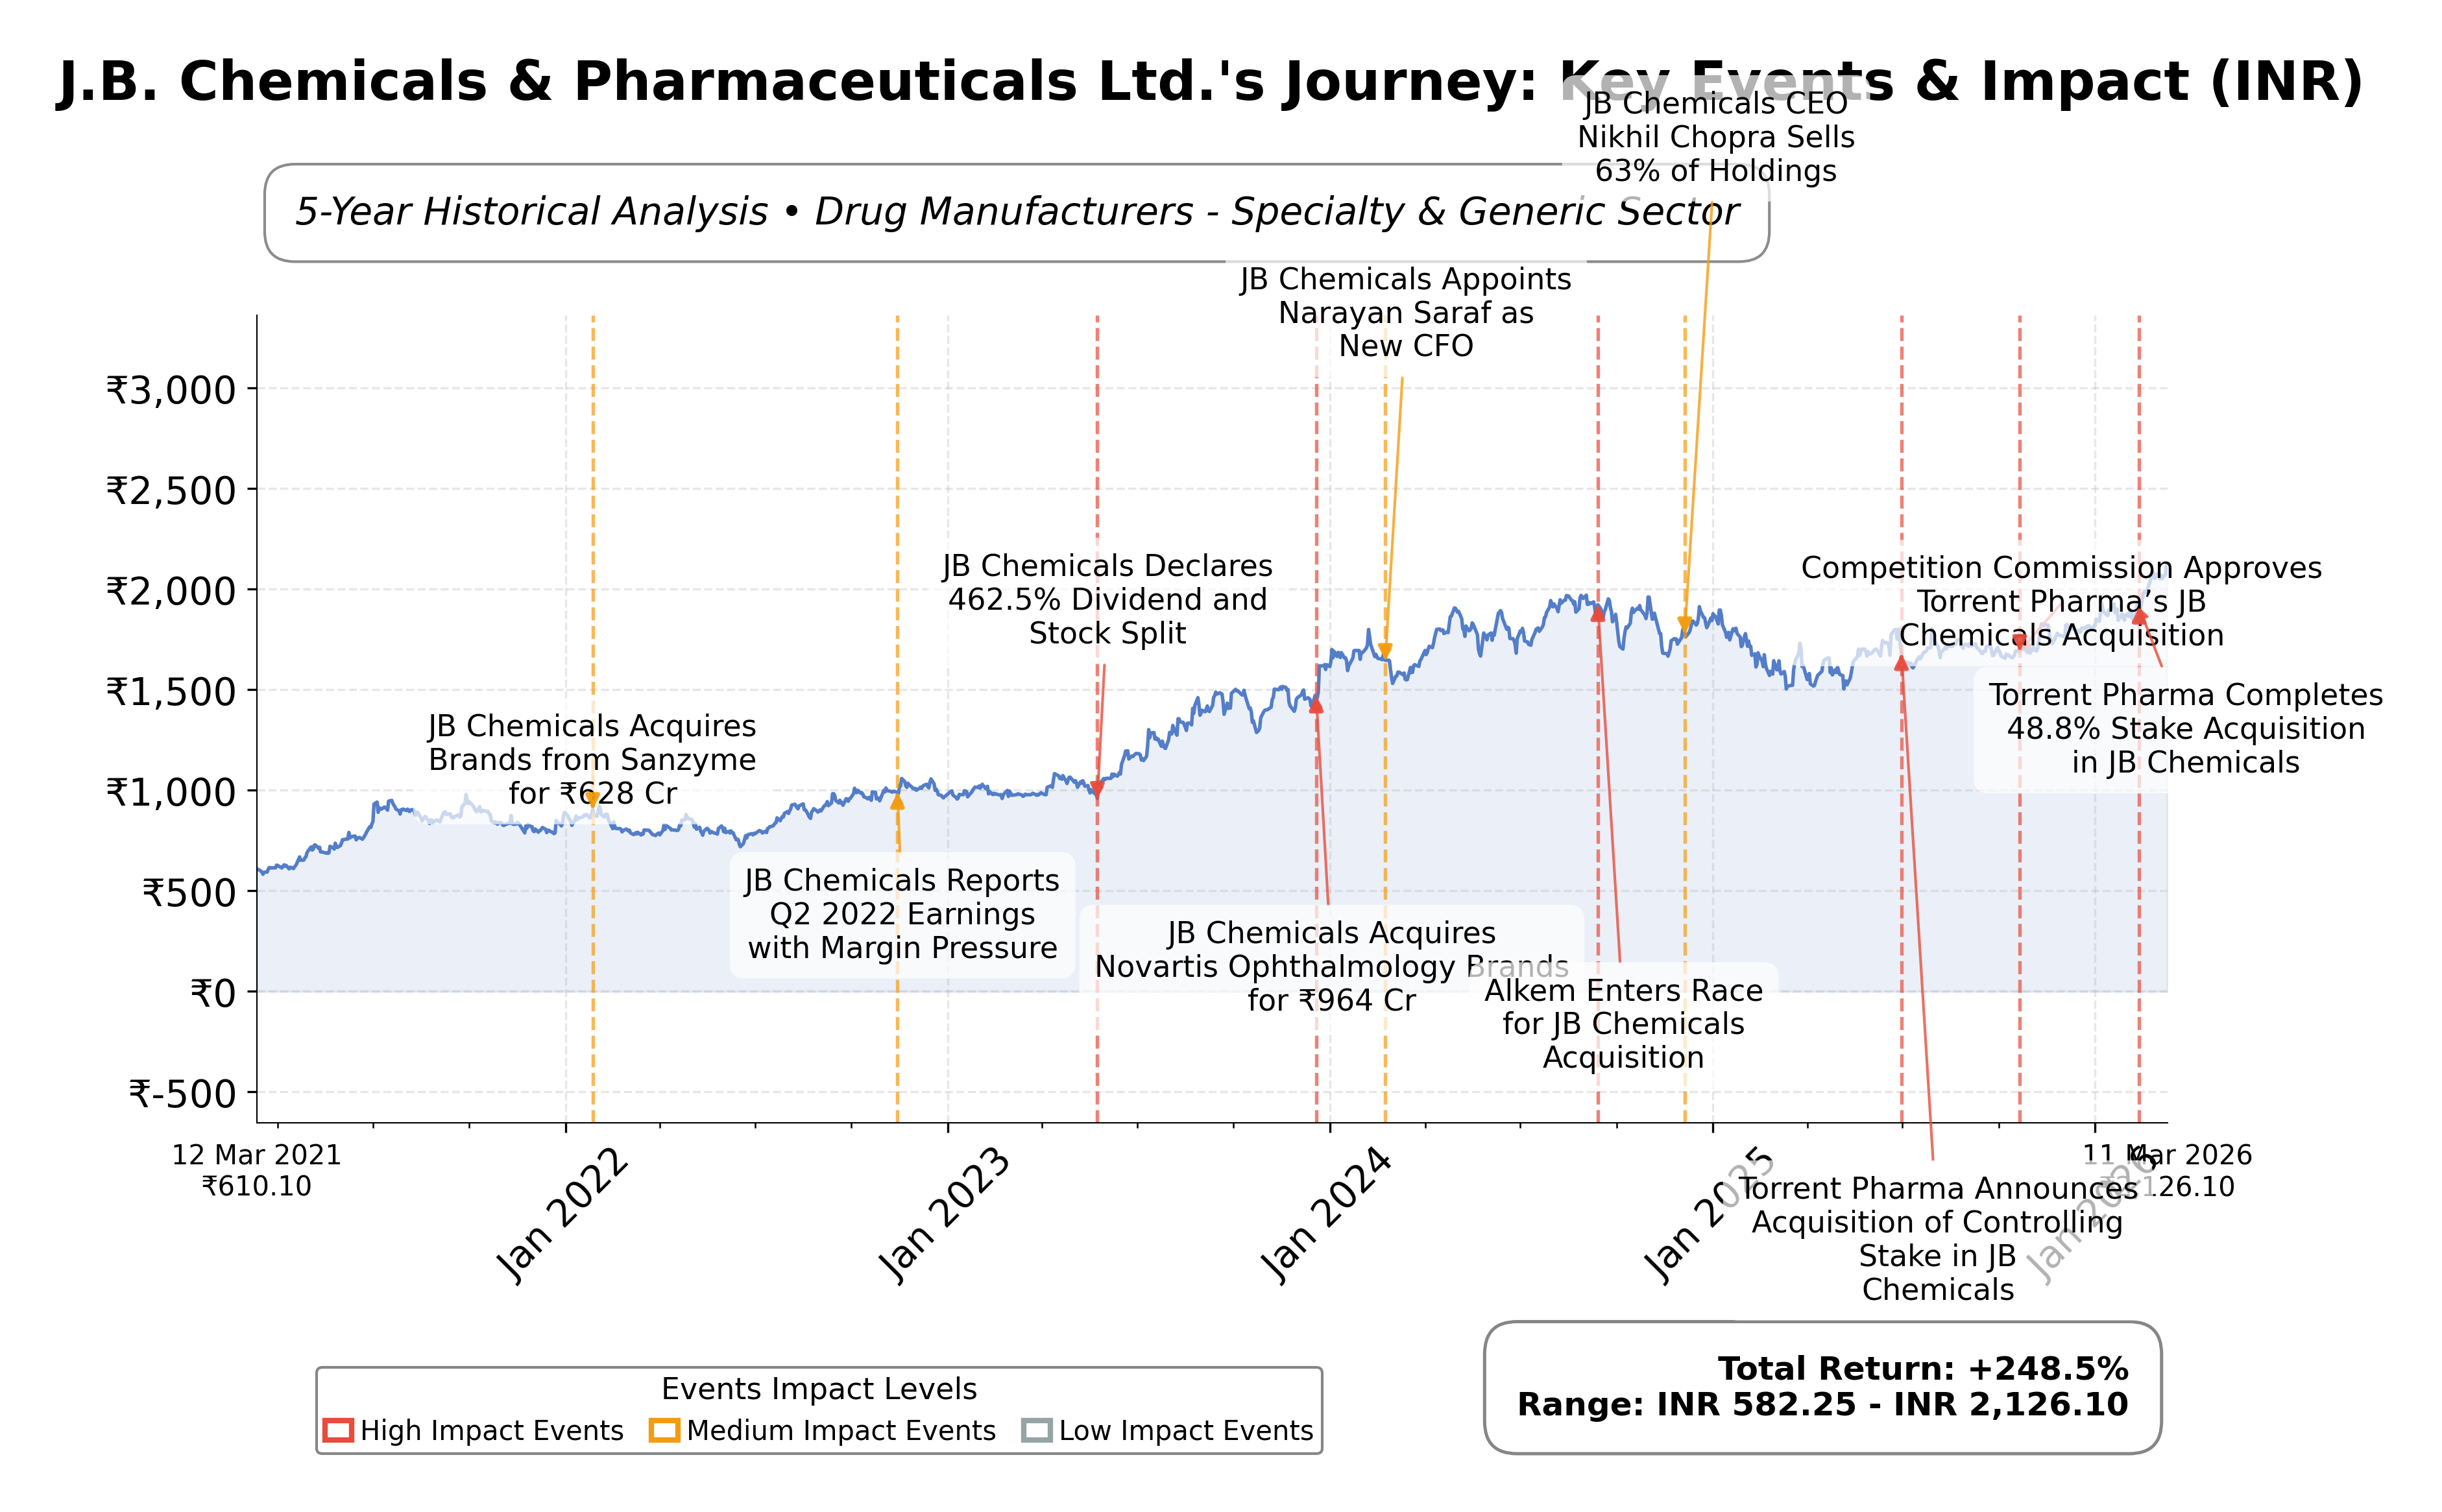
Stock Journey
Key Positives and Key Risks
Pros
- Strong revenue growth of 10.5% quarterly and earnings growth of 21.8% year-over-year indicate robust operational performance.
- Low total debt of ₹409.1 million against cash reserves of ₹5.94 billion demonstrates solid financial health and liquidity.
- Return on equity of 19.2% surpasses many peers, reflecting effective capital utilization and profitability.
Cons
- High trailing P/E ratio of 43.3 and forward P/E of 34.35 suggest premium valuation relative to industry averages.
- Recent resignation of Executive Vice President and other senior executives raises potential governance and operational risks.
Disclosure: This information is for general awareness and does not constitute investment advice
Report Summary
J.B. Chemicals & Pharmaceuticals Ltd. operates in the pharmaceutical sector, specializing in manufacturing high-quality formulations and specialty chemicals across multiple therapeutic segments such as cardiovascular, gastrointestinal, anti-infectives, and pain management. The company holds a strong market position in India with a growing international presence supported by a robust distribution network and continuous R&D investment. Financially, J.B. Chemicals reports a market capitalization of approximately â¹329.61 billion with a trailing P/E ratio of 43.3 and a forward P/E of 34.35, reflecting premium valuation metrics relative to earnings growth. The company maintains solid profitability with a gross margin near 69%, operating margin of 23.5%, and a return on equity around 19.2%, alongside strong cash flow generation and a healthy current ratio of 3.79. Recent technical indicators show the stock trading near its 52-week high of â¹2,114.7, supported by moving averages and momentum indicators signaling strength. Strategic developments include a significant merger with Torrent Pharmaceuticals and notable leadership changes, including the resignation of the Executive Vice President, which may influence governance and operational dynamics. Peer analysis within the Indian pharmaceutical industry reveals that J.B. Chemicals trades at higher valuation multiples compared to peers like Dr. Reddy's, Natco Pharma, and Aurobindo Pharma, with relatively strong return on equity but elevated price-to-cash-flow ratios. Positioned as a key player navigating a competitive and evolving pharmaceutical landscape, J.B. Chemicals has achieved recent milestones such as new 52-week highs and regulatory approvals for mergers, while facing challenges including management transitions and valuation scrutiny. The company's future trajectory hinges on successful integration of strategic initiatives and maintaining operational excellence amid sector headwinds. Given the comprehensive data and market context, a balanced approach emphasizing ongoing observation of valuation levels, operational execution, and sector developments may be prudent for those assessing the stock.",
Company and Industry Overview
Company Basics
Price Performance
Company Size
Shareholding Pattern
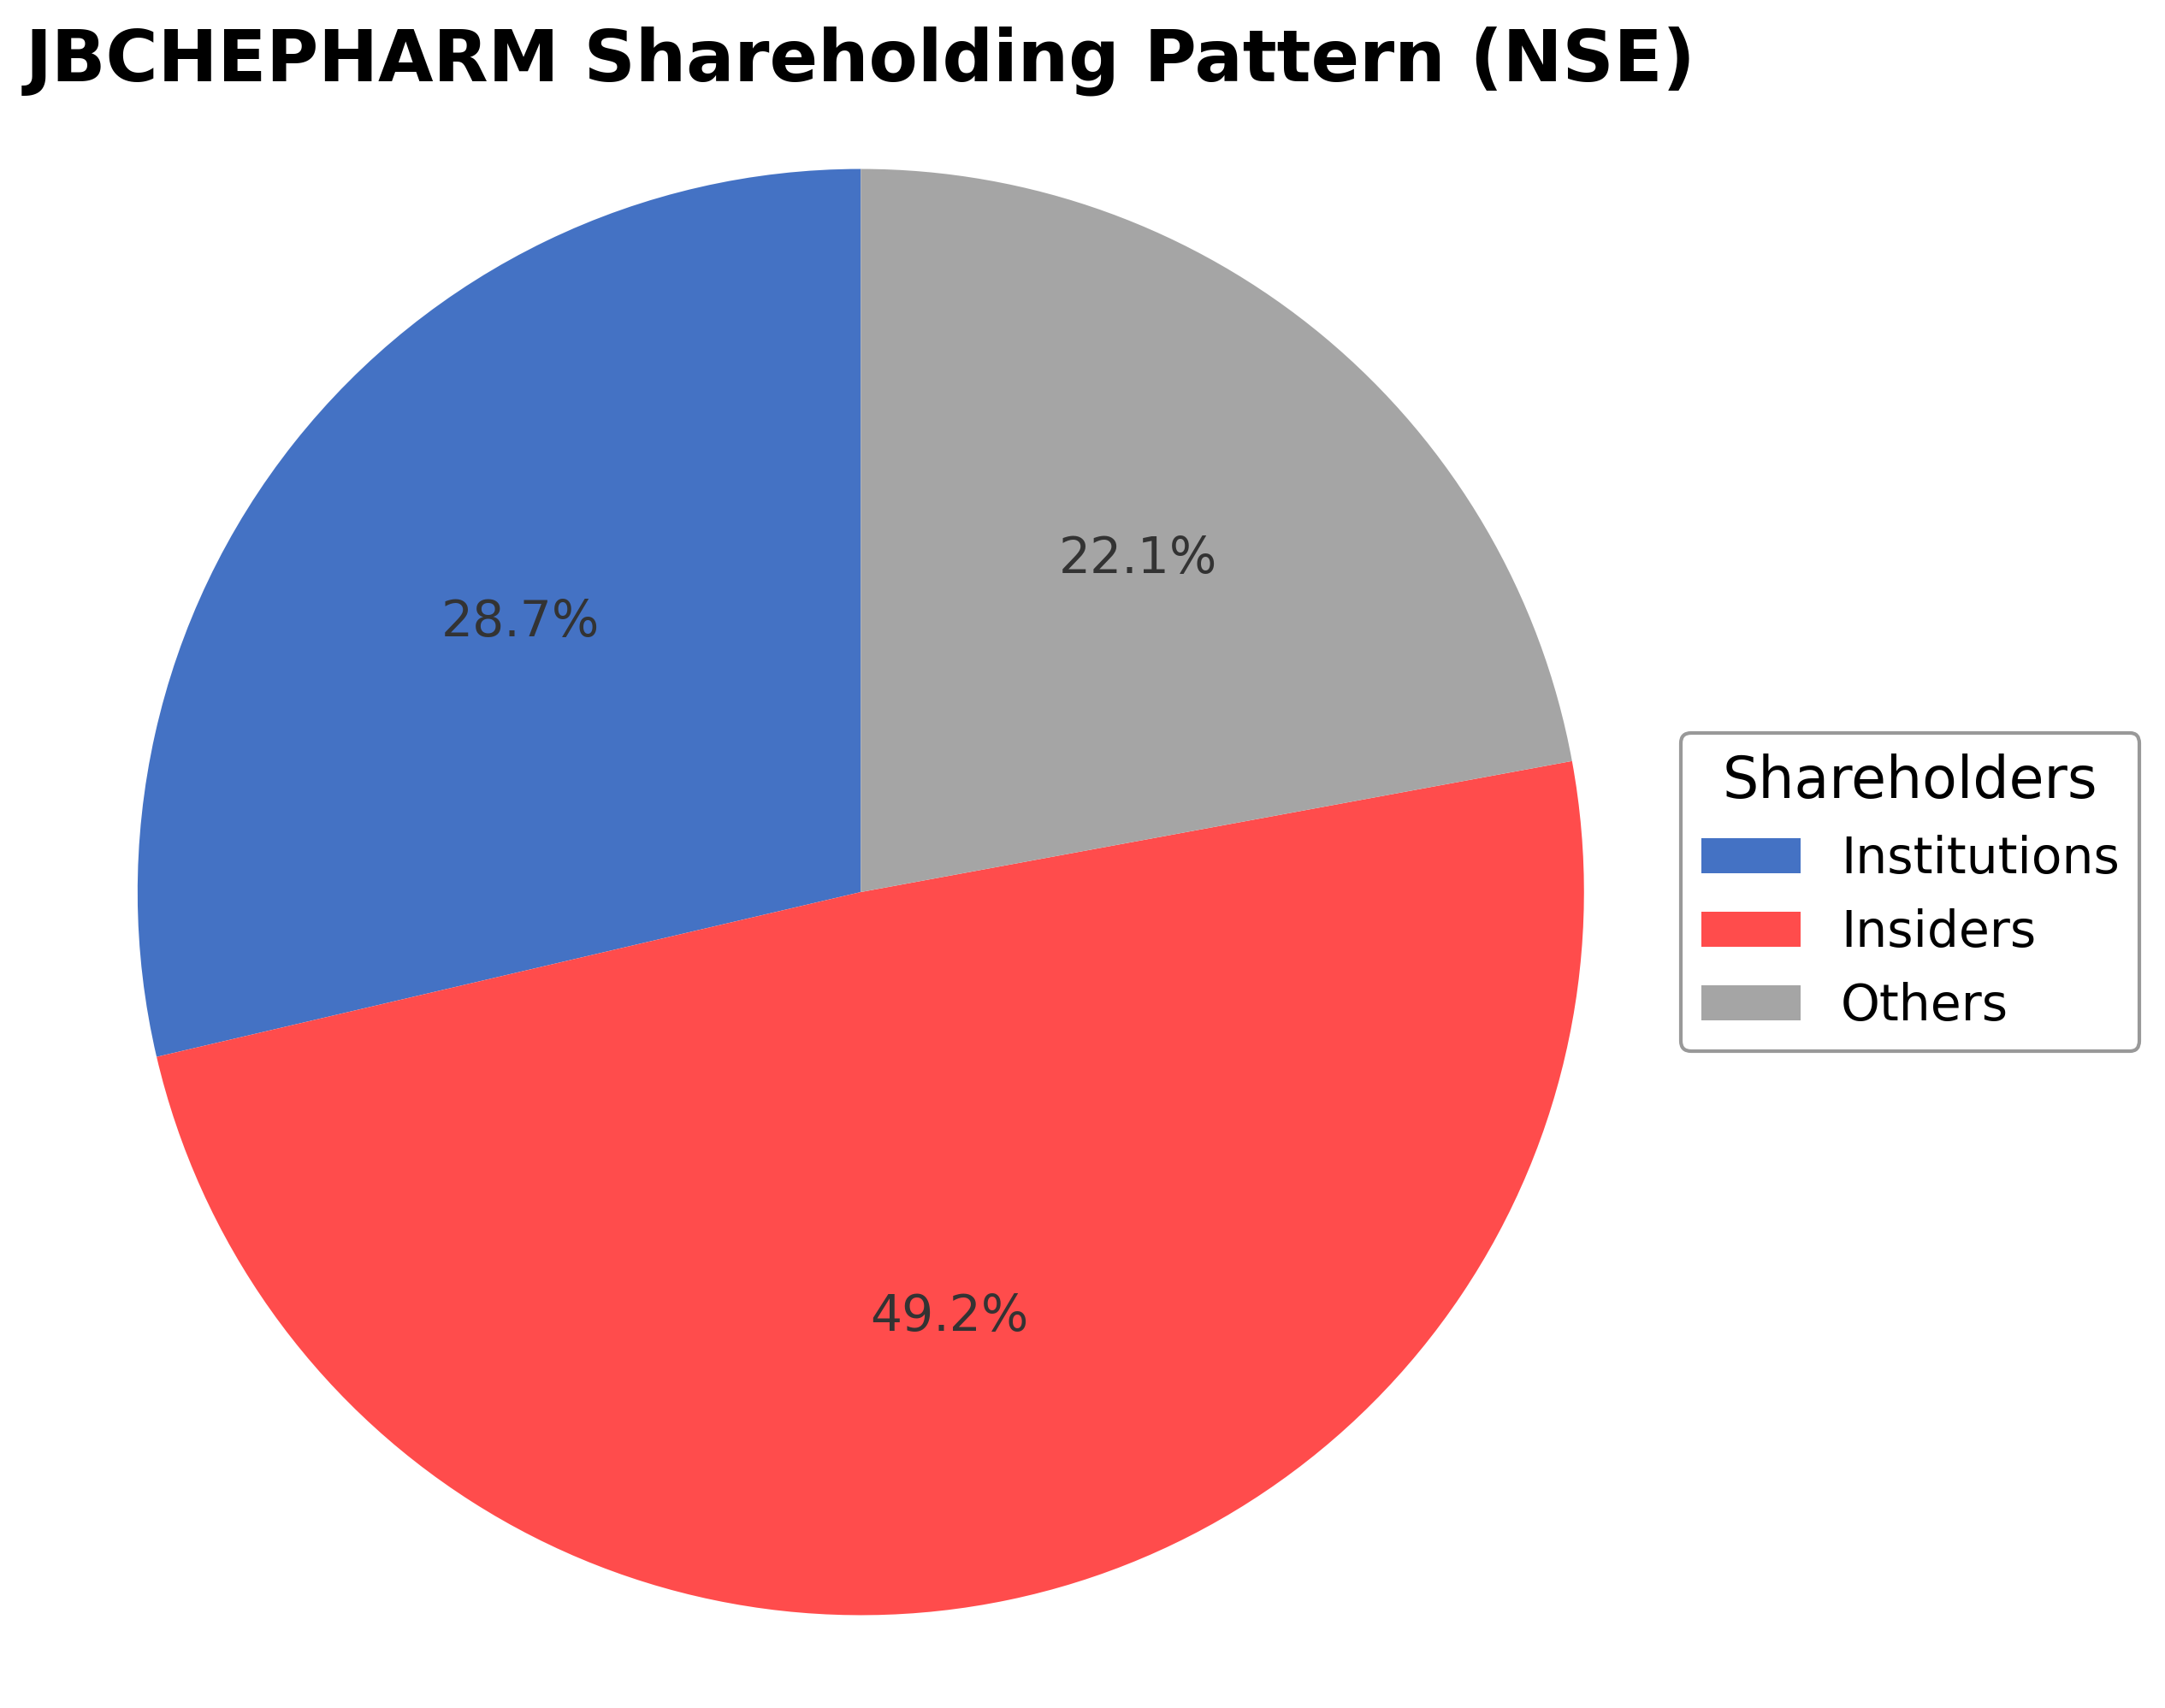
J.B. Chemicals & Pharmaceuticals Ltd. exhibits a shareholding structure dominated by insiders holding approximately 49.25%, institutional investors accounting for 28.66%, and the remaining 22.09% held by public and other shareholders. Over the past 12 to 24 months, the promoter stake has remained relatively stable, while institutional ownership has shown moderate accumulation, reflecting sustained confidence from mutual funds and asset managers. Major institutional investors have incrementally increased their positions, indicating positive market sentiment towards the company’s governance and strategic direction. This ownership distribution suggests a balanced governance framework with significant promoter control complemented by active institutional participation, which may influence future corporate actions and strategic initiatives. The company operates within the Indian pharmaceutical industry, characterized by competitive dynamics, regulatory oversight, and growth driven by domestic demand and export opportunities.
Sector and Industry Analysis
Sector and Industry Analysis: Pharmaceuticals Sector – Focus on J.B. Chemicals & Pharmaceuticals Ltd.
1. Sector Overview: The pharmaceutical sector in India, where J.B. Chemicals & Pharmaceuticals Ltd. operates, is a significant and rapidly growing component of the global healthcare industry. Valued at over USD 45 billion as of recent estimates, the Indian pharmaceutical market is projected to grow at a CAGR of approximately 9-12% over the next five years, driven by rising healthcare awareness, expanding middle-class demographics, and increasing government healthcare expenditure. Key players in this sector include multinational corporations such as Sun Pharmaceutical Industries, Dr. Reddy’s Laboratories, Cipla, and domestic firms like J.B. Chemicals, which specialize in formulations and active pharmaceutical ingredients (APIs). The sector’s growth is supported by India’s strong generic drug manufacturing capabilities and cost-competitive production infrastructure.
2. Industry Trends: The pharmaceutical industry is undergoing significant transformation driven by technological advancements and evolving consumer behavior. There is a marked shift towards biopharmaceuticals, biosimilars, and personalized medicine, although generic formulations continue to dominate the Indian market. Digital health technologies, including telemedicine and AI-driven drug discovery, are emerging opportunities that companies are beginning to explore. Additionally, increasing demand for chronic disease management drugs and vaccines, especially post-pandemic, has expanded market potential. The industry is also witnessing consolidation trends and strategic partnerships aimed at enhancing R&D capabilities and expanding global footprints.
3. Regulatory Landscape: The pharmaceutical sector is highly regulated globally and in India, with compliance requirements spanning drug approval, manufacturing practices, pricing controls, and intellectual property rights. The Drugs and Cosmetics Act, 1940, and regulations by the Central Drugs Standard Control Organization (CDSCO) govern drug approvals and quality standards in India. Price control mechanisms under the National Pharmaceutical Pricing Authority (NPPA) impact the pricing of essential medicines. Additionally, adherence to Good Manufacturing Practices (GMP) and evolving regulatory frameworks for biosimilars and clinical trials are critical. Internationally, compliance with FDA (USA), EMA (Europe), and WHO guidelines is essential for export-oriented firms. Regulatory scrutiny and policy shifts, such as increased focus on drug safety and data exclusivity, significantly influence operational strategies.
4. Competitive Dynamics: The Indian pharmaceutical market is characterized by a fragmented competitive structure with numerous small and mid-sized players alongside large conglomerates. Barriers to entry include stringent regulatory approvals, high R&D costs, and the need for robust distribution networks. Established companies benefit from economies of scale, diversified product portfolios, and strong brand recognition. Institutional and insider ownership patterns, as observed in firms like J.B. Chemicals, can influence strategic decisions and market liquidity. Competitive positioning often hinges on cost efficiency, product innovation, and geographic reach, with export markets providing growth avenues. The sector’s competitive intensity is moderated by patent cliffs, generic competition, and evolving healthcare policies, necessitating continuous innovation and compliance vigilance.
Note: Analysis synthesized from industry research, market reports, and regulatory filings. Information is subject to change based on market conditions.
Illustrative Scenario Analysis
DCF Assumptions:
Method: Two-Stage EPS-Priority Model
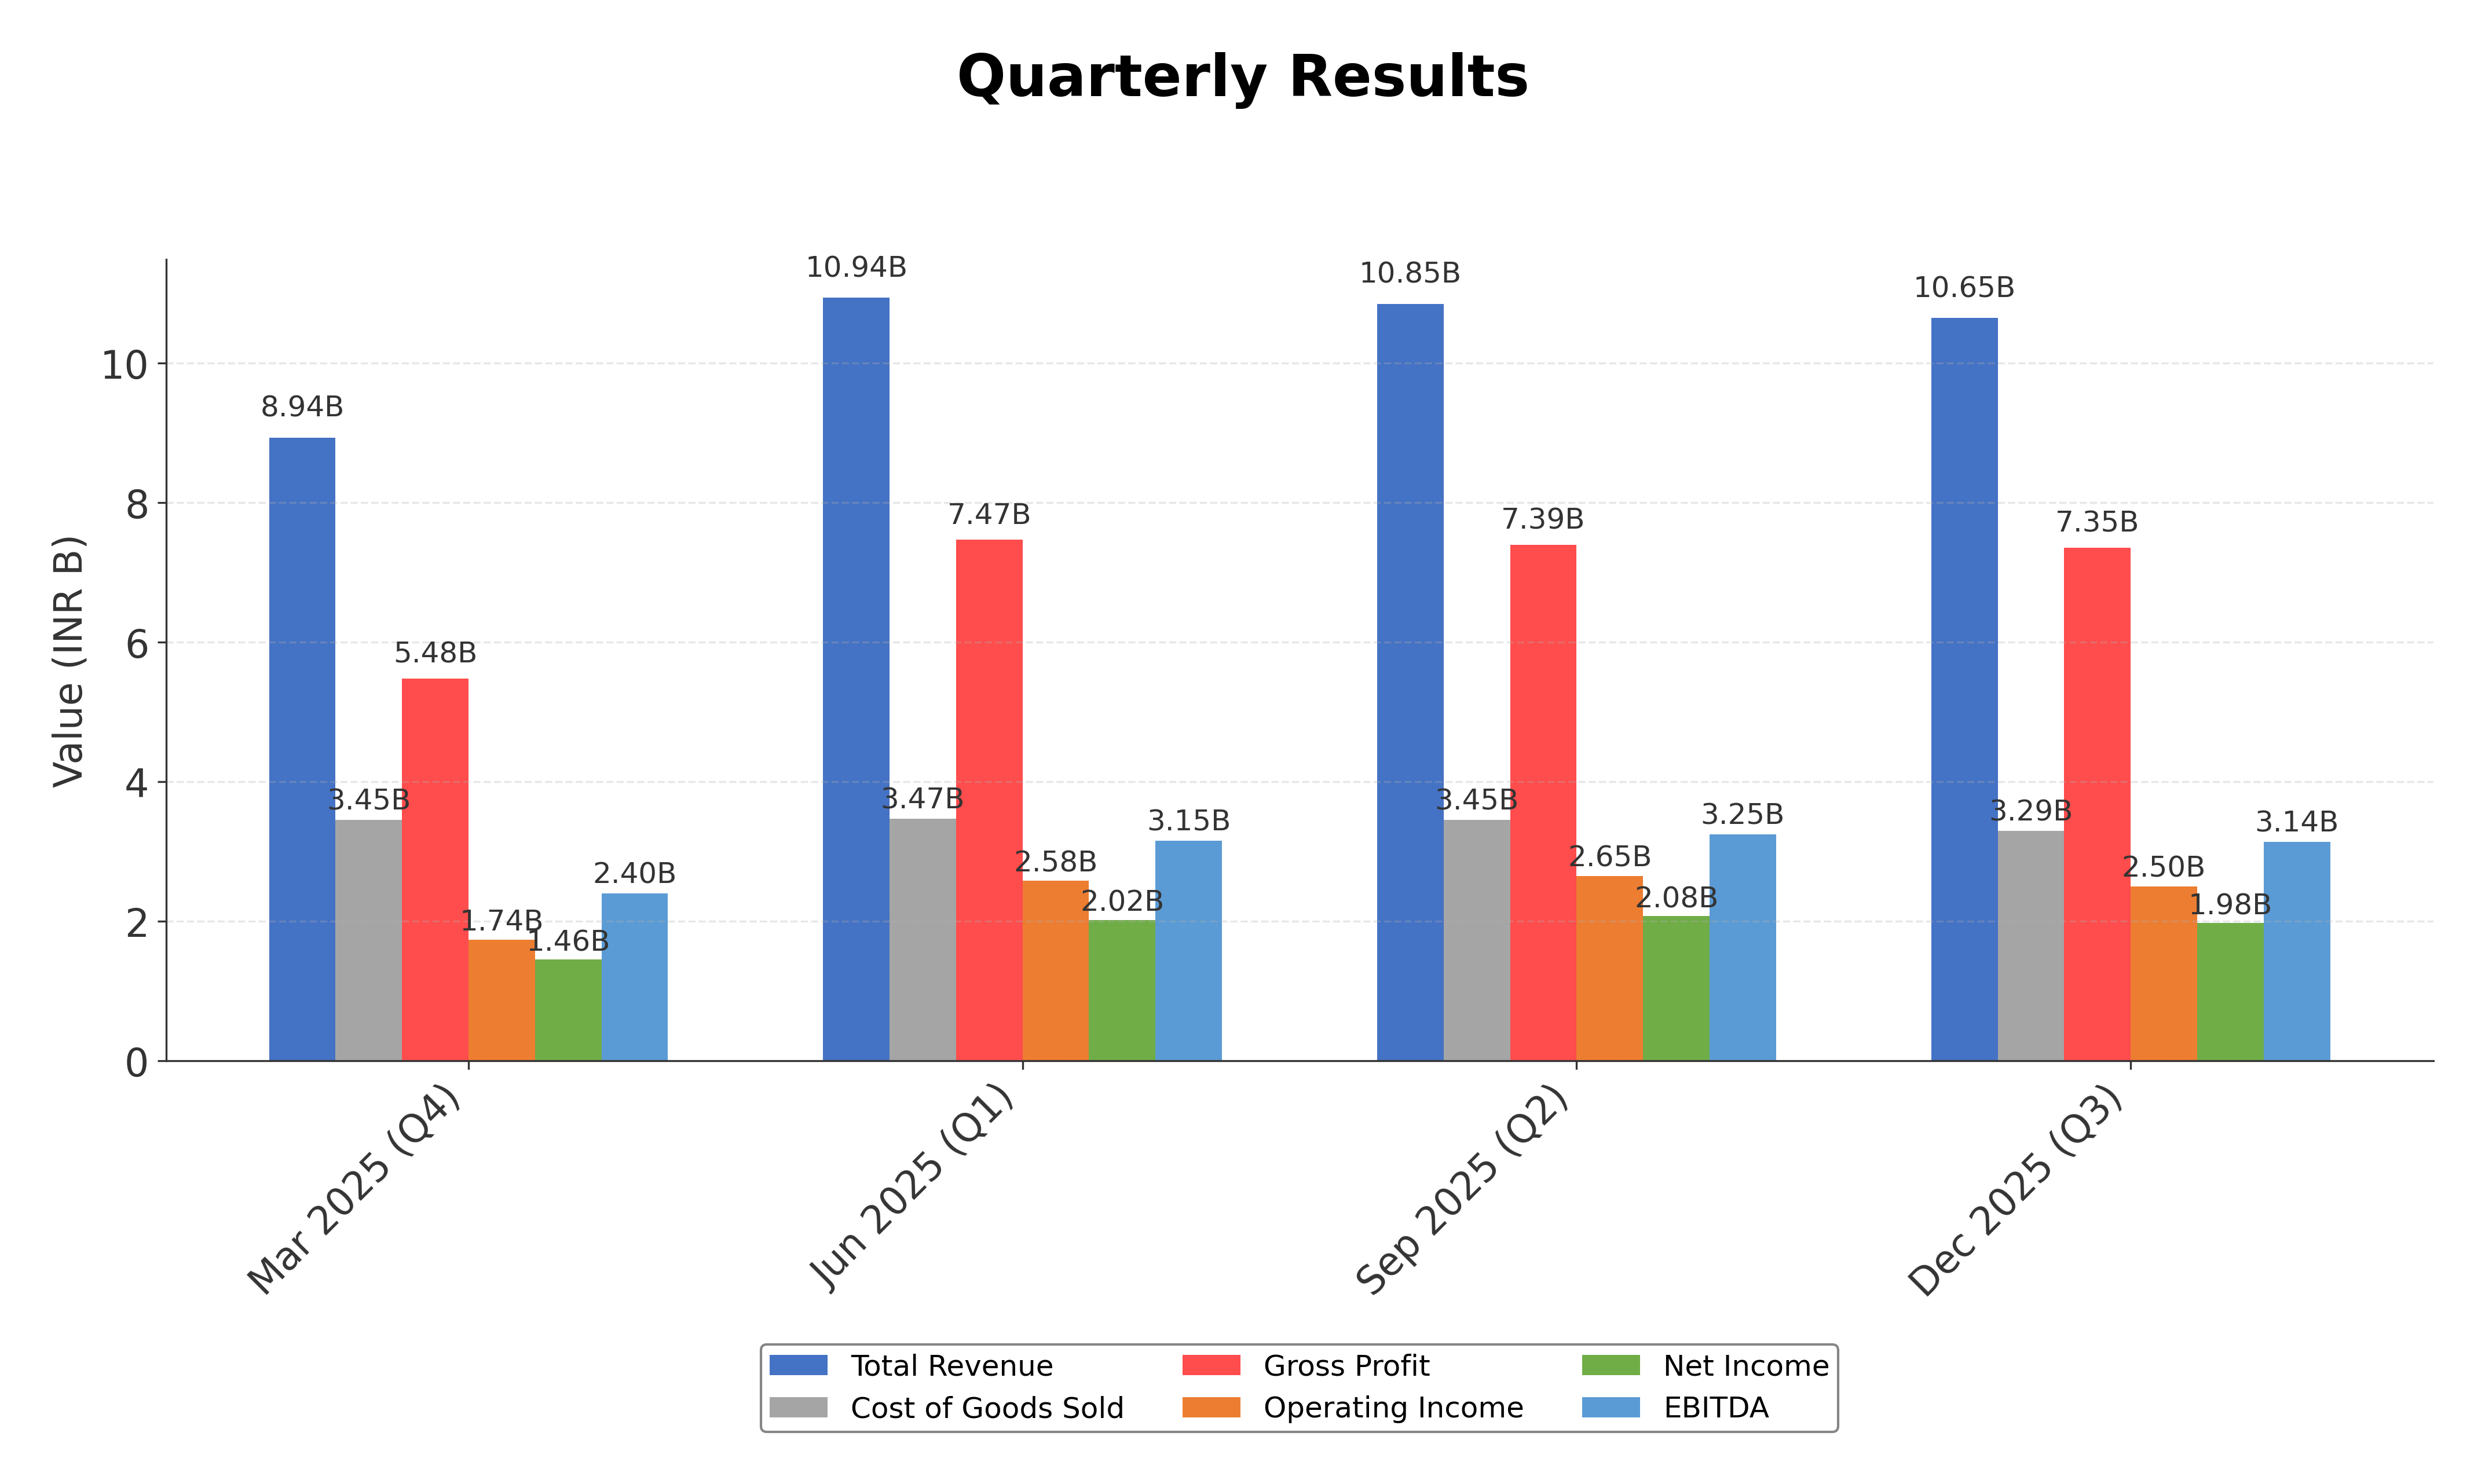
Financials
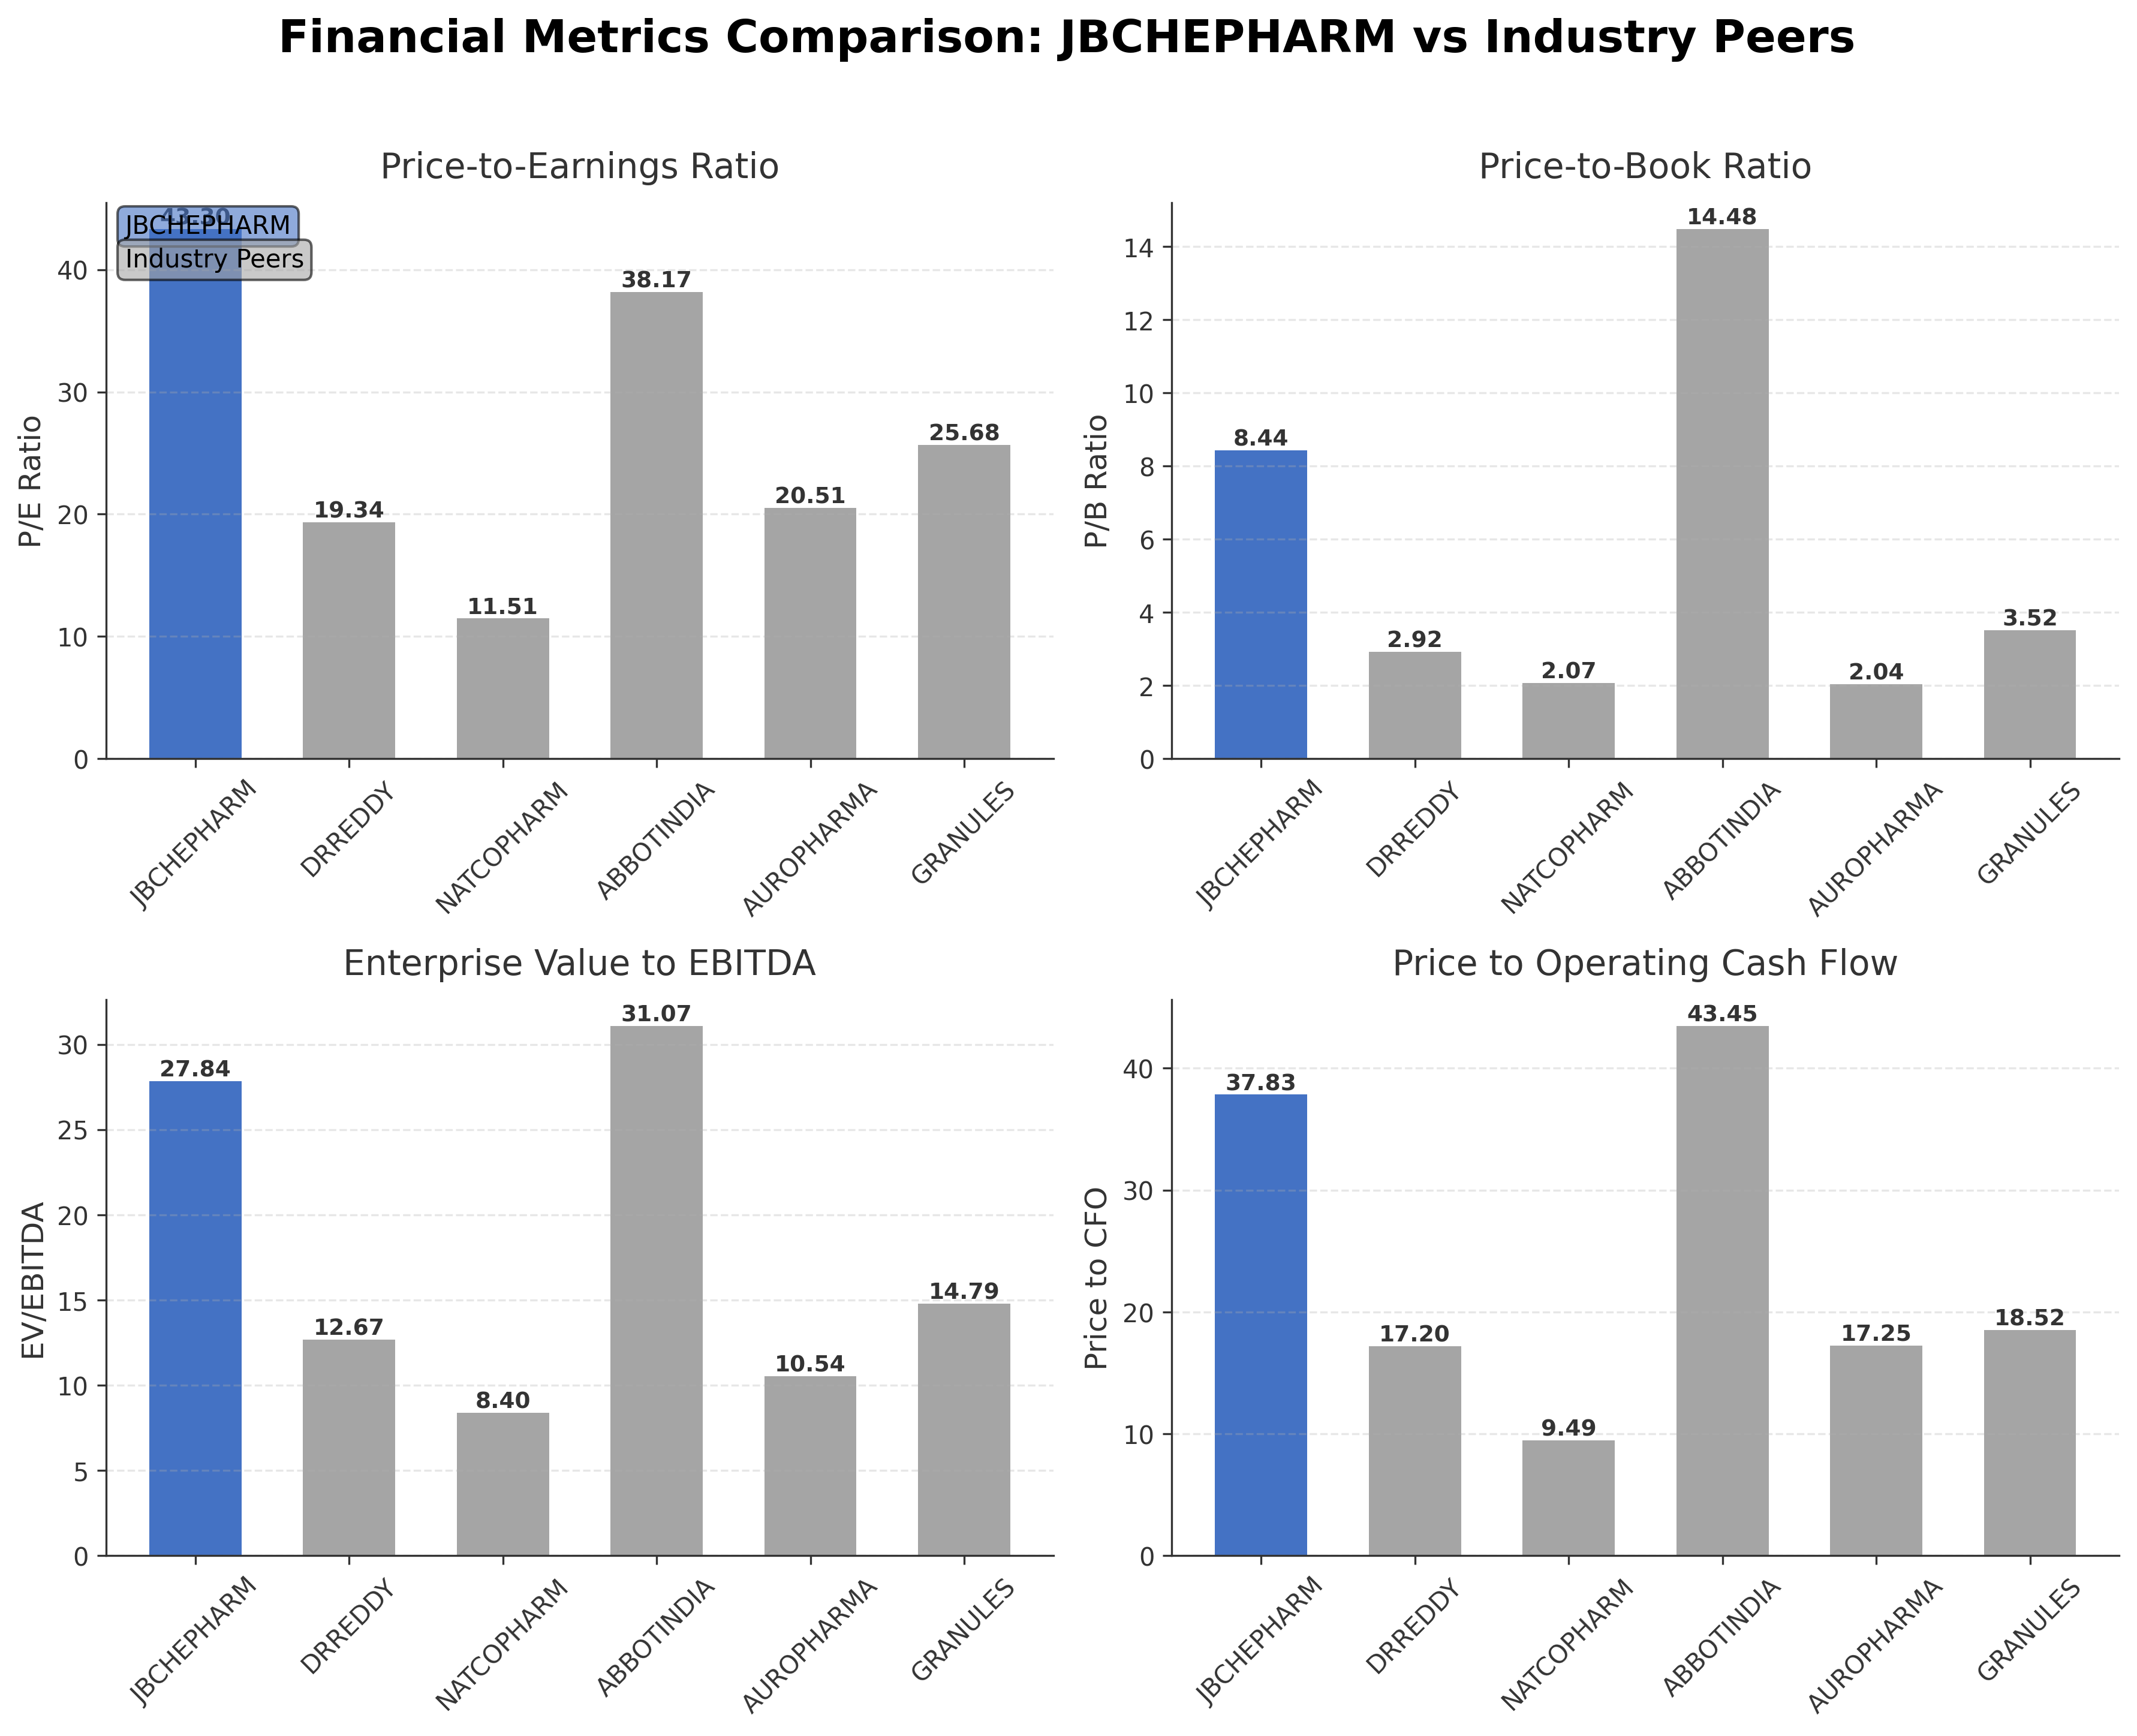
Peer Analysis
| Company Name | Market Cap | P/E Ratio | P/B Ratio | EV/EBITDA | Price to CFO |
|---|---|---|---|---|---|
| J.B. Chemicals & Pharmaceuticals Ltd. | ₹329.61B | 43.30 | 8.44 | 27.84 | 37.83 |
| Dr. Reddy's Laboratories Ltd. | ₹1.09T | 19.34 | 2.92 | 12.67 | 17.20 |
| Natco Pharma Ltd. | ₹182.74B | 11.51 | 2.07 | 8.40 | 9.49 |
| Abbott India Ltd. | ₹580.64B | 38.17 | 14.48 | 31.07 | 43.45 |
| Aurobindo Pharma Ltd. | ₹715.49B | 20.51 | 2.04 | 10.54 | 17.25 |
| Granules India Ltd. | ₹140.06B | 25.68 | 3.52 | 14.79 | 18.52 |
Comparison Analysis: J.B. Chemicals & Pharmaceuticals Ltd. trades at a notably higher P/E ratio of 43.30 compared to its Indian pharmaceutical peers, reflecting a premium valuation. Its price-to-book ratio of 8.44 is also elevated relative to most peers except Abbott India, which has a higher P/B of 14.48. The company exhibits a strong return on equity at 19.21%, surpassing several peers such as Dr. Reddy's and Aurobindo Pharma but trailing Abbott India and Natco Pharma. Its EV/EBITDA ratio of 27.84 is significantly above the peer average, indicating higher enterprise valuation relative to earnings. The price to cash flow metric is also elevated at 37.83, suggesting a premium on cash flow generation. Overall, J.B. Chemicals demonstrates robust profitability and market capitalization but trades at higher multiples compared to regional industry peers, indicating market expectations of sustained growth or premium positioning.
Financial Metrics Comparison with Peers
Financial Statements
Comprehensive financial data including income, balance sheet, and cash flow metrics
Income Statement
| fiscal_date | 2025-03-31 | 2024-03-31 | 2023-03-31 | 2022-03-31 | 2021-03-31 |
|---|---|---|---|---|---|
| Sales | 38.62B | 34.48B | 31.17B | 24.24B | 20.19B |
| Cost Of Goods | 13.40B | 12.03B | 11.85B | 8.43B | 7.17B |
| Gross Profit | 25.22B | 22.45B | 19.32B | 15.81B | 13.01B |
| Operating Expense Selling General And Administrative | 4.66B | 4.16B | 3.75B | 3.16B | 1.98B |
| Operating Expense Other Operating Expenses | 3.42B | 3.29B | 3.04B | 5.99B | 2.04B |
| Operating Income | 8.55B | 7.53B | 5.87B | 4.71B | 4.88B |
| Non Operating Interest Income | 53.26M | 44.28M | 25.36M | 9.34M | 17.74M |
| Non Operating Interest Expense | 106.90M | 436.52M | 354.08M | 51.20M | 69.43M |
| Pretax Income | 8.87B | 7.52B | 5.55B | 5.05B | 5.97B |
| Income Tax | 2.28B | 1.99B | 1.45B | 1.19B | 1.48B |
| Net Income | 6.60B | 5.53B | 4.10B | 3.86B | 4.49B |
| Eps Basic | 42.45 | 35.66 | 26.50 | 24.93 | 28.98 |
| Eps Diluted | 41.56 | 34.85 | 26.17 | 24.91 | 28.98 |
| Basic Shares Outstanding | 155.36M | 154.95M | 77.32M | 154.58M | 154.56M |
| Diluted Shares Outstanding | 155.36M | 154.95M | 77.32M | 154.58M | 154.56M |
| Ebit | 8.98B | 7.95B | 5.91B | 5.10B | 6.04B |
| Ebitda | 10.36B | 9.01B | 6.97B | 5.83B | 5.70B |
| Net Income Continuous Operations | 8.87B | 7.52B | 5.55B | 5.05B | 5.97B |
| Minority Interests | 0.00 | 0.00 | -1.70M | -6.80M | -5.59M |
| Preferred Stock Dividends | 0.00 | 0.00 | 0.00 | 0.00 | 0.00 |
Data provided by Twelve Data
Balance Sheet
| fiscal_date | 2025-03-31 | 2024-03-31 | 2023-03-31 | 2022-03-31 | 2021-03-31 |
|---|---|---|---|---|---|
| Cash And Cash Equivalents | 1.15B | 882.15M | 769.34M | 565.44M | 286.86M |
| Accounts Receivable | 8.15B | 6.87B | 5.76B | 5.56B | 3.89B |
| Total Assets | 42.74B | 39.94B | 35.54B | 26.07B | 22.38B |
| Total Liabilities | 8.40B | 10.71B | 10.74B | 4.69B | 4.25B |
| Long Term Debt | 63.53M | 332.77M | 3.99B | 206.18M | 51.41M |
| Shareholders Equity | 34.33B | 29.23B | 24.80B | 21.39B | 18.13B |
Data provided by Twelve Data
Cash Flow Statement
| fiscal_date | 2025-03-31 | 2024-03-31 | 2023-03-31 | 2022-03-31 | 2021-03-31 |
|---|---|---|---|---|---|
| Operating Activities Net Income | 8.87B | 7.52B | 5.55B | 5.05B | 5.97B |
| Operating Activities Stock Based Compensation | 549.03M | 419.67M | 693.73M | 626.50M | 0.00 |
| Operating Activities Other Non Cash Items | 51.49M | 387.05M | 311.94M | 10.30M | 12.81M |
| Operating Activities Accounts Receivable | -498.00M | -716.04M | -417.47M | -2.93B | -705.99M |
| Operating Activities Other Assets Liabilities | -264.42M | -720.28M | -205.23M | -625.10M | -700.86M |
| Operating Activities Operating Cash Flow | 8.71B | 6.89B | 5.94B | 2.13B | 4.57B |
| Investing Activities Capital Expenditures | -964.74M | -1.26B | -717.33M | -550.90M | -209.51M |
| Investing Activities Net Intangibles | -227.19M | -1.35B | -6.92B | -6.44B | 215.68M |
| Investing Activities Purchase Of Investments | -12.37B | -8.69B | -7.57B | -5.08B | -5.41B |
| Investing Activities Sale Of Investments | 10.55B | 7.21B | 5.57B | 12.09B | 3.17B |
| Investing Activities Investing Cash Flow | -2.78B | -2.73B | -2.72B | 6.45B | -2.54B |
| Financing Activities Long Term Debt Payments | 0.00 | -1.79B | -872.50M | 0.00 | N/A |
| Financing Activities Short Term Debt Issuance | -3.44B | -125.96M | 17.83M | -3.30M | 3.22M |
| Financing Activities Common Stock Issuance | 240.03M | 199.91M | 84.83M | 0.00 | N/A |
| Financing Activities Common Dividends | -2.37B | -1.57B | -1.28B | -1.28B | -732.40M |
| Financing Activities Financing Cash Flow | -5.57B | -3.29B | 3.98B | -1.28B | -729.18M |
| End Cash Position | 1.15B | 882.15M | 769.34M | 565.40M | 224.74M |
| Free Cash Flow | 7.82B | 5.39B | -1.39B | -5.37B | 2.67B |
| Financing Activities Long Term Debt Issuance | N/A | 0.00 | 6.09B | 0.00 | N/A |
| Financing Activities Other Financing Charges | N/A | N/A | -55.80M | N/A | N/A |
| Investing Activities Net Acquisitions | N/A | N/A | N/A | 0.00 | -85.00M |
| Investing Activities Other Investing Activity | N/A | N/A | N/A | N/A | -2.26M |
| Financing Activities Common Stock Repurchase | N/A | N/A | N/A | N/A | 0.00 |
Data provided by Twelve Data
Technical Analysis
Key Insights
- The current trend direction is bullish with the stock price trading near its 52-week high of ₹2114.7, supported by upward momentum and consistent price appreciation.
- Key support levels are identified around ₹1773 (200-day moving average) and ₹1925 (50-day moving average), while resistance is near the recent high of ₹2114.7 to ₹2140.
- The stock is trading above its 10-day, 50-day, and 200-day moving averages, indicating strong upward momentum across short, medium, and long-term timeframes.
- Momentum indicators show RSI levels in the upper range, suggesting strong buying interest, while MACD remains positive, confirming bullish momentum; stochastic oscillators also support a continuation of the current trend.
- Multi-timeframe analysis across daily, weekly, and monthly charts confirms a sustained uptrend with no immediate signs of reversal, reflecting consistent strength in price action.
- Potential market scenarios include continuation of the uptrend if support levels hold, while a break below the 50-day moving average could signal consolidation or a pullback.
Trending News
1. Headline: Ahead of Market: 10 things that will decide stock market action on Friday - The Economic Times
Summary: Today, 68 stocks hit their 52 week highs while 378 stocks slipped to their 52-week lows. Among the ones which hit their 52 week highs included ABB India, Aeroflex Industries, Coal India, Jammu & Kashmir Bank, JB Chemicals & Pharmaceuticals, NTPC and Vidya Wires.
Sentiment: negative
2. Headline: Jagsonpal Pharma surges 12% after buyback plan of up to 16 lakh shares at ₹250 each - CNBC TV18
Summary: The maximum buyback offer size is ₹40 crore or 18.35% of the paid-up equity share capital and free reserves of the company, Jagsonpal Pharma said in an exchange filing.
Sentiment: positive
3. Headline: J.B. Chemicals EVP Resigns; Filing Delay Sparks Governance Concerns | Whalesbook
Summary: J.B. Chemicals EVP Jason D'souza resigns March 6. A filing delay due to inadvertence raises governance questions for the company.
Sentiment: negative
4. Headline: JB Chemicals announces resignation of Executive Vice President Jason D’souza | Business Upturn
Summary: JB Chemicals & Pharmaceuticals has announced the resignation of its Executive Vice President, Jason D’souza, effective from the close of business on 6 March 2026.
Sentiment: neutral
5. Headline: Nifty Pharma index hits 52-week high; Ipca, Aurobindo rally up to 4% | Markets News - Business Standard
Summary: Of these, Ajanta Pharma, Aurobindo Pharma, Glenmark Pharmaceuticals and JB Chemicals & Pharmaceuticals hit their respective 52-week highs in intra-day trade today.
Sentiment: positive
6. Headline: J B Chemicals & Pharmaceuticals Ltd Hits New 52-Week High at Rs.2119.85
Summary: J B Chemicals & Pharmaceuticals Ltd has reached a significant milestone by hitting a new 52-week high of Rs. 2119.85 on 10 Mar 2026, marking a notable surge ...
Sentiment: positive
7. Headline: JB Chemicals announces resignation of three senior executives | Business Upturn
Summary: JB Chemicals & Pharmaceuticals has announced the resignation of three senior executives, effective early March 2026.
Sentiment: neutral
8. Headline: JB Chemicals announces senior management changes with three resignations | Business Upturn
Summary: JB Chemicals & Pharmaceuticals has announced the resignation of three senior executives, marking a significant shift in its leadership team.
Sentiment: neutral
Summary: While Nifty Pharma giants struggle with regulatory headwinds and pricing pressures, two outliers are quietly catching the attention of smart investors. These companies boast superior Return on Capital Employed (ROCE) and have maintained a rare streak of consistent quarterly profit growth throughout ...
Sentiment: positive
10. Headline: Torrent Pharma shares in focus after steady Q3; Street positive on JB merger benefits - CNBC TV18
Summary: Shares of Torrent Pharmaceuticals Ltd. will be in focus on Monday, February 16, after the company reported December quarter earnings that were largely in-line with Street expectations. Torrent has completed the acquisition of a controlling stake in JB Chemicals & Pharmaceuticals Ltd., with ...
Sentiment: positive
Powered by Brave
Recent Updates
News Summary
Recent developments for J.B. Chemicals & Pharmaceuticals Ltd. include the company reaching a new 52-week high of ₹2140.25, signaling strong market performance. The merger with Torrent Pharmaceuticals valued at approximately $3.1 billion has received regulatory clearance from the Competition Commission of India, marking a pivotal strategic milestone. Torrent Pharma's acquisition of a controlling stake (46.39%) in J.B. Chemicals has been publicly announced, with an open offer planned, indicating significant consolidation in the Indian pharmaceutical sector. Additionally, the company has published postal ballot notices for shareholders, reflecting ongoing corporate governance activities. These events collectively highlight a phase of strategic transformation, regulatory compliance, and market confidence in the company's growth prospects.
News Sentiment
The overall sentiment from recent news is moderately positive, driven by merger approvals and stock price milestones, tempered by neutral tones around acquisition details and shareholder communications. Positive market reactions to the 52-week highs and merger benefits contrast with neutral regulatory and corporate governance updates, suggesting balanced market expectations with cautious optimism.
Analytical Overview
Analysis Summary
Valuation Metrics: J.B. Chemicals & Pharmaceuticals Ltd. trades at a trailing P/E of 43.3 and forward P/E of 34.35, which are above the industry average of 43.3, indicating a premium valuation relative to earnings expectations.
Growth Trajectory: The company demonstrates a positive revenue growth rate of 10.5% quarterly and a year-over-year earnings growth of 21.8%, supported by strong operating and profit margins, reflecting a robust growth trajectory.
Financial Health: With a low total debt of ₹409.1 million against cash reserves of ₹5.94 billion and a current ratio of 3.79, the company exhibits strong liquidity and financial stability, supported by healthy operating cash flow of ₹8.71 billion and free cash flow of ₹6.60 billion.
Sector-Specific Factors: The pharmaceutical sector in India faces regulatory scrutiny and pricing pressures but benefits from increasing domestic demand and export opportunities; J.B. Chemicals' focus on specialty and generic drugs positions it well amid these dynamics.
Market Positioning: The company holds a competitive advantage through diversified product offerings, strong R&D investment, and a wide distribution network, which are critical in sustaining growth and navigating sector challenges.
Investment Conclusion
Supporting Factors: No data
Risk Factors: No data
SWOT Analysis
Strengths
- Strong product portfolio across multiple therapeutic segments.
- Robust financial position with low debt and high liquidity.
- Consistent revenue and earnings growth supported by R&D investment.
- Established distribution network domestically and internationally.
Weaknesses
- High valuation multiples compared to industry peers.
- Recent executive resignations may impact operational stability.
- Relatively concentrated promoter ownership limiting broader institutional influence.
- Dependence on regulatory approvals for product launches and mergers.
Opportunities
- Expansion through strategic mergers and acquisitions.
- Growing demand for specialty and generic pharmaceuticals in India and abroad.
- Increasing healthcare expenditure and access in emerging markets.
- Potential to leverage R&D for innovative product development.
Threats
- Regulatory scrutiny and pricing pressures in the pharmaceutical sector.
- Competitive intensity from domestic and international players.
- Potential integration risks from recent merger activities.
- Market volatility impacting investor sentiment and valuation.
Company Description
J.B. Chemicals & Pharmaceuticals Ltd. is a prominent pharmaceutical company with a focus on manufacturing high-quality pharmaceutical formulations and specialty chemicals. This company is recognized for its comprehensive portfolio of products encompassing various therapeutic segments, including cardiovascular, gastrointestinal, anti-infectives, and pain management. It also produces a range of active pharmaceutical ingredients (APIs) that are crucial for the formulation of these medicines. Its innovative approach and commitment to delivering affordable healthcare solutions have established it as a key player both domestically and internationally. With a strong distribution network, J.B. Chemicals & Pharmaceuticals serves hospitals, clinics, and pharmacies across multiple continents. The company continuously invests in research and development to enhance its product offerings and sustain its competitive edge in the rapidly evolving pharmaceutical industry. As part of the broader healthcare sector, the company plays a vital role in improving access to essential medications, reflecting its impact on public health and its significant contribution to global medical advancements.