
Jamna Auto Industries Ltd (JAMNAAUTO)
Stock Analysis Report
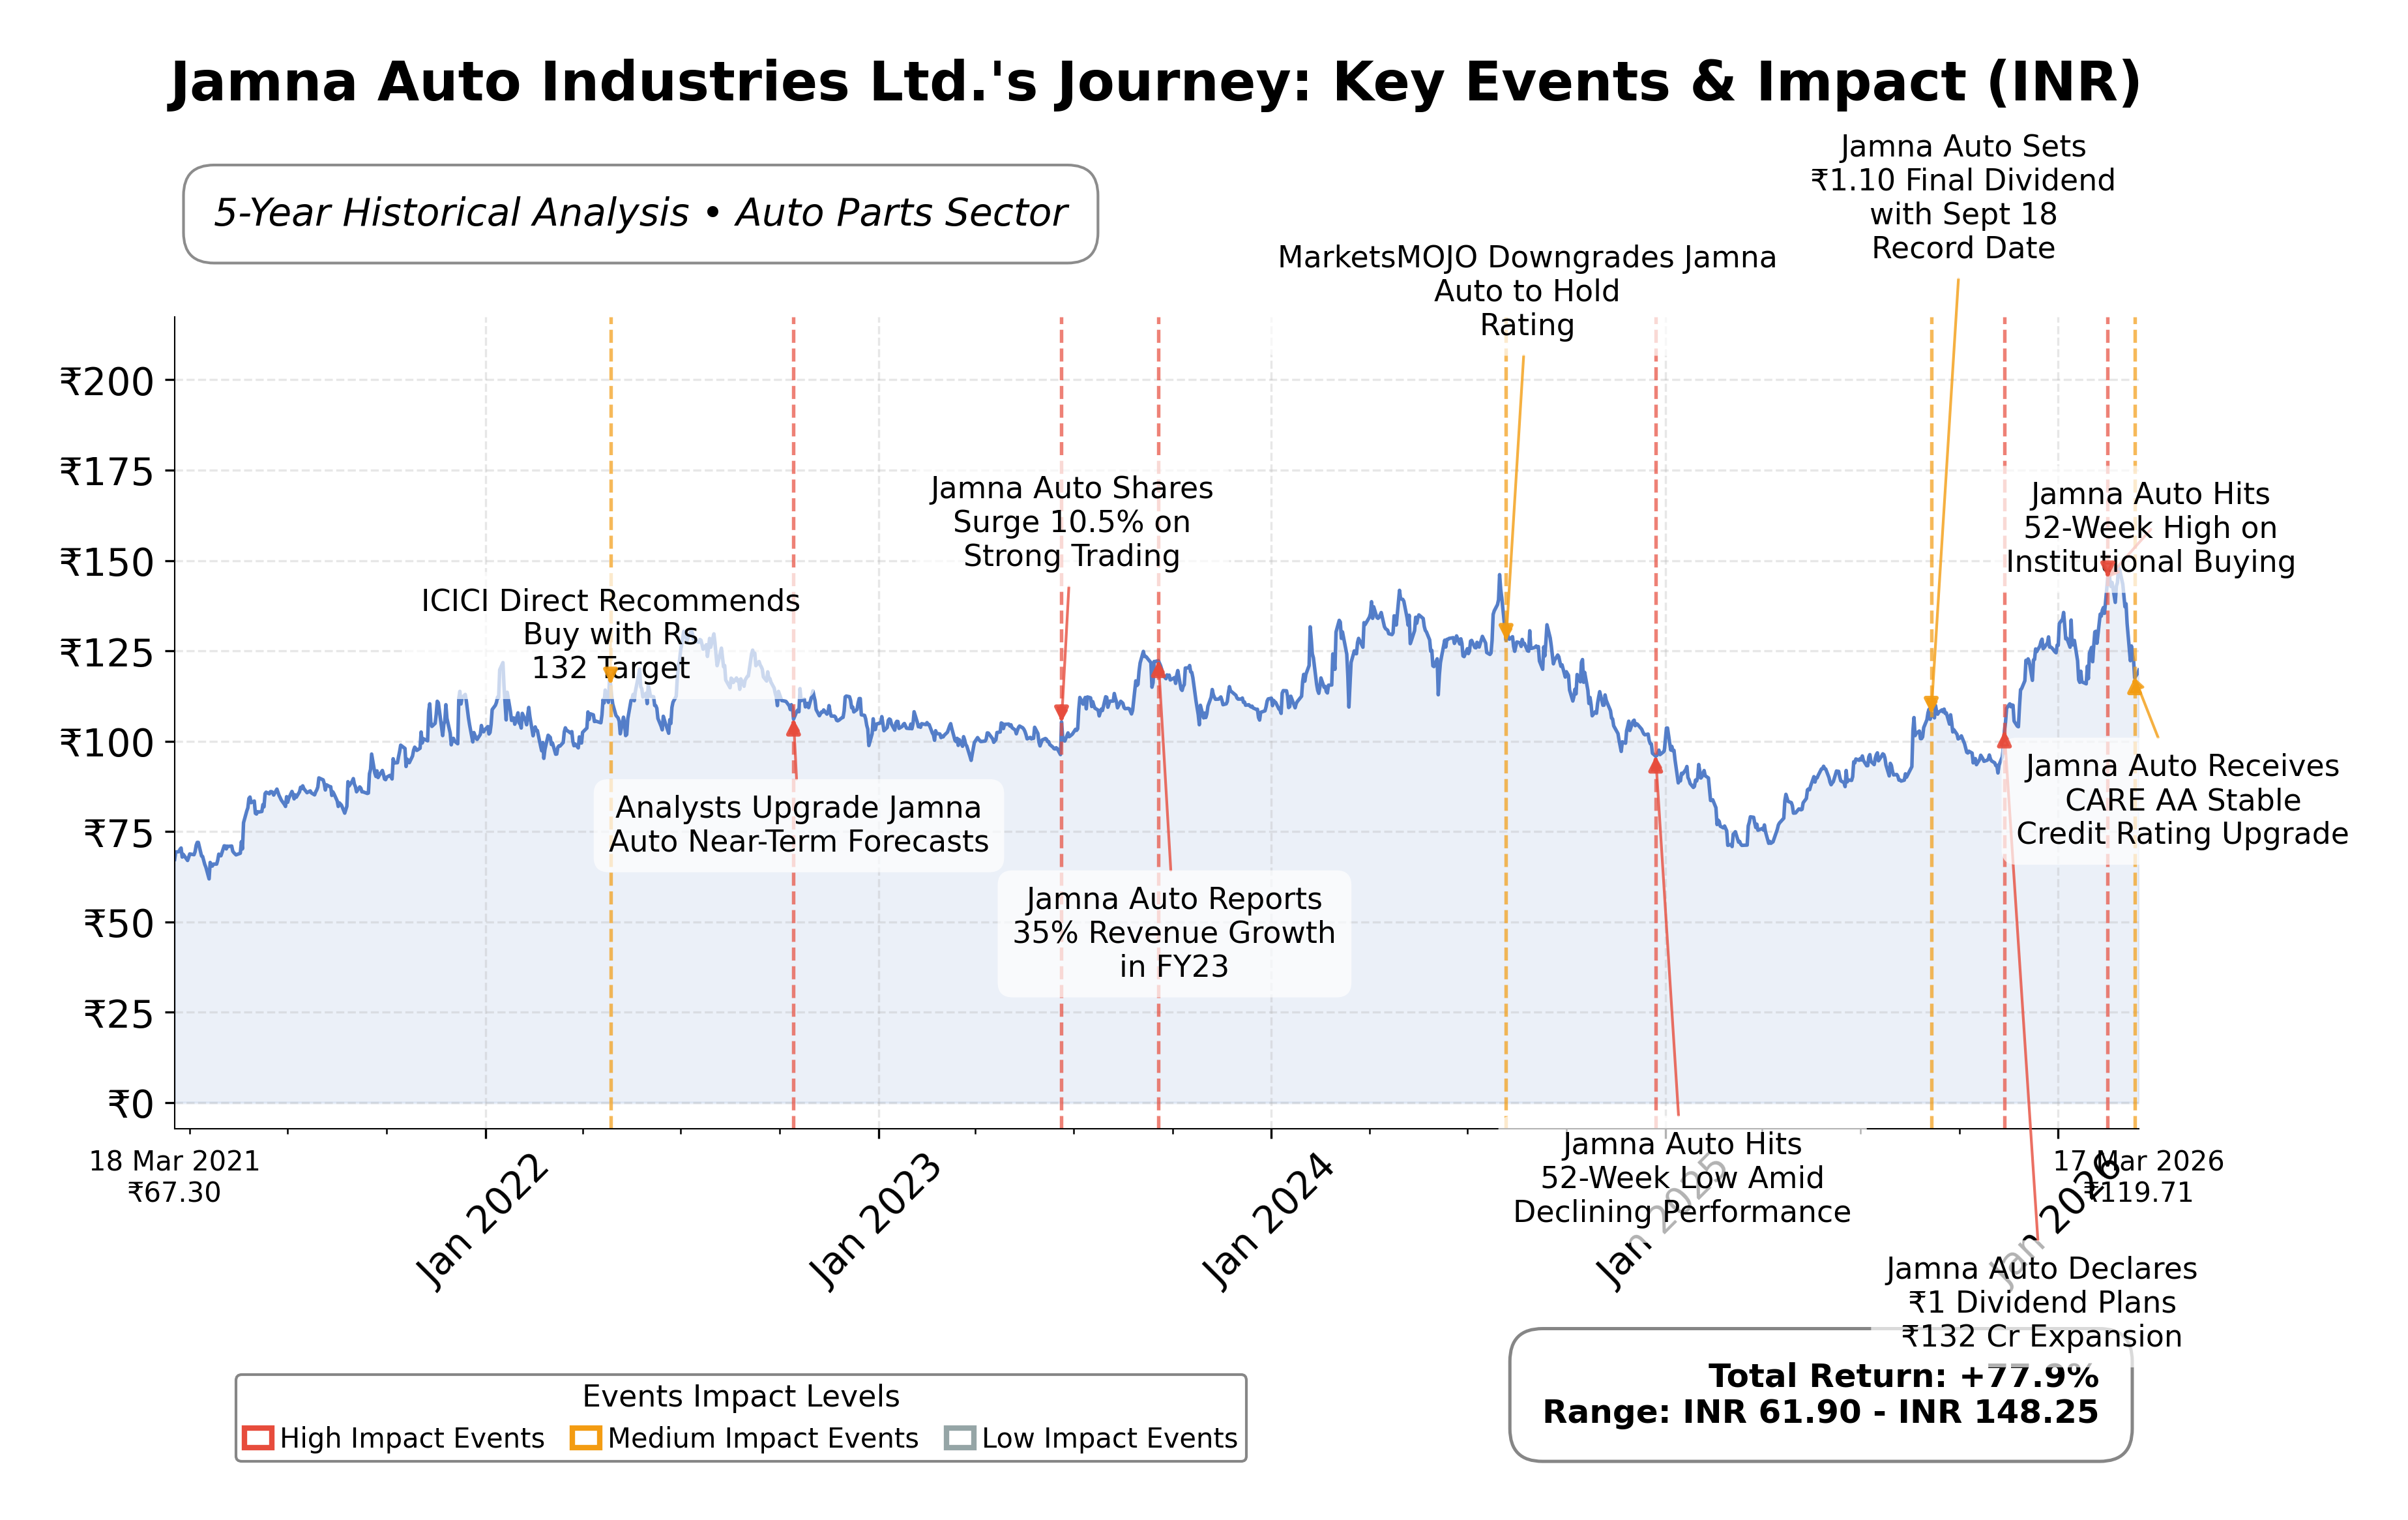
Stock Journey
Key Positives and Key Risks
Pros
- Strong return on equity of 18.16% indicating efficient use of shareholder capital.
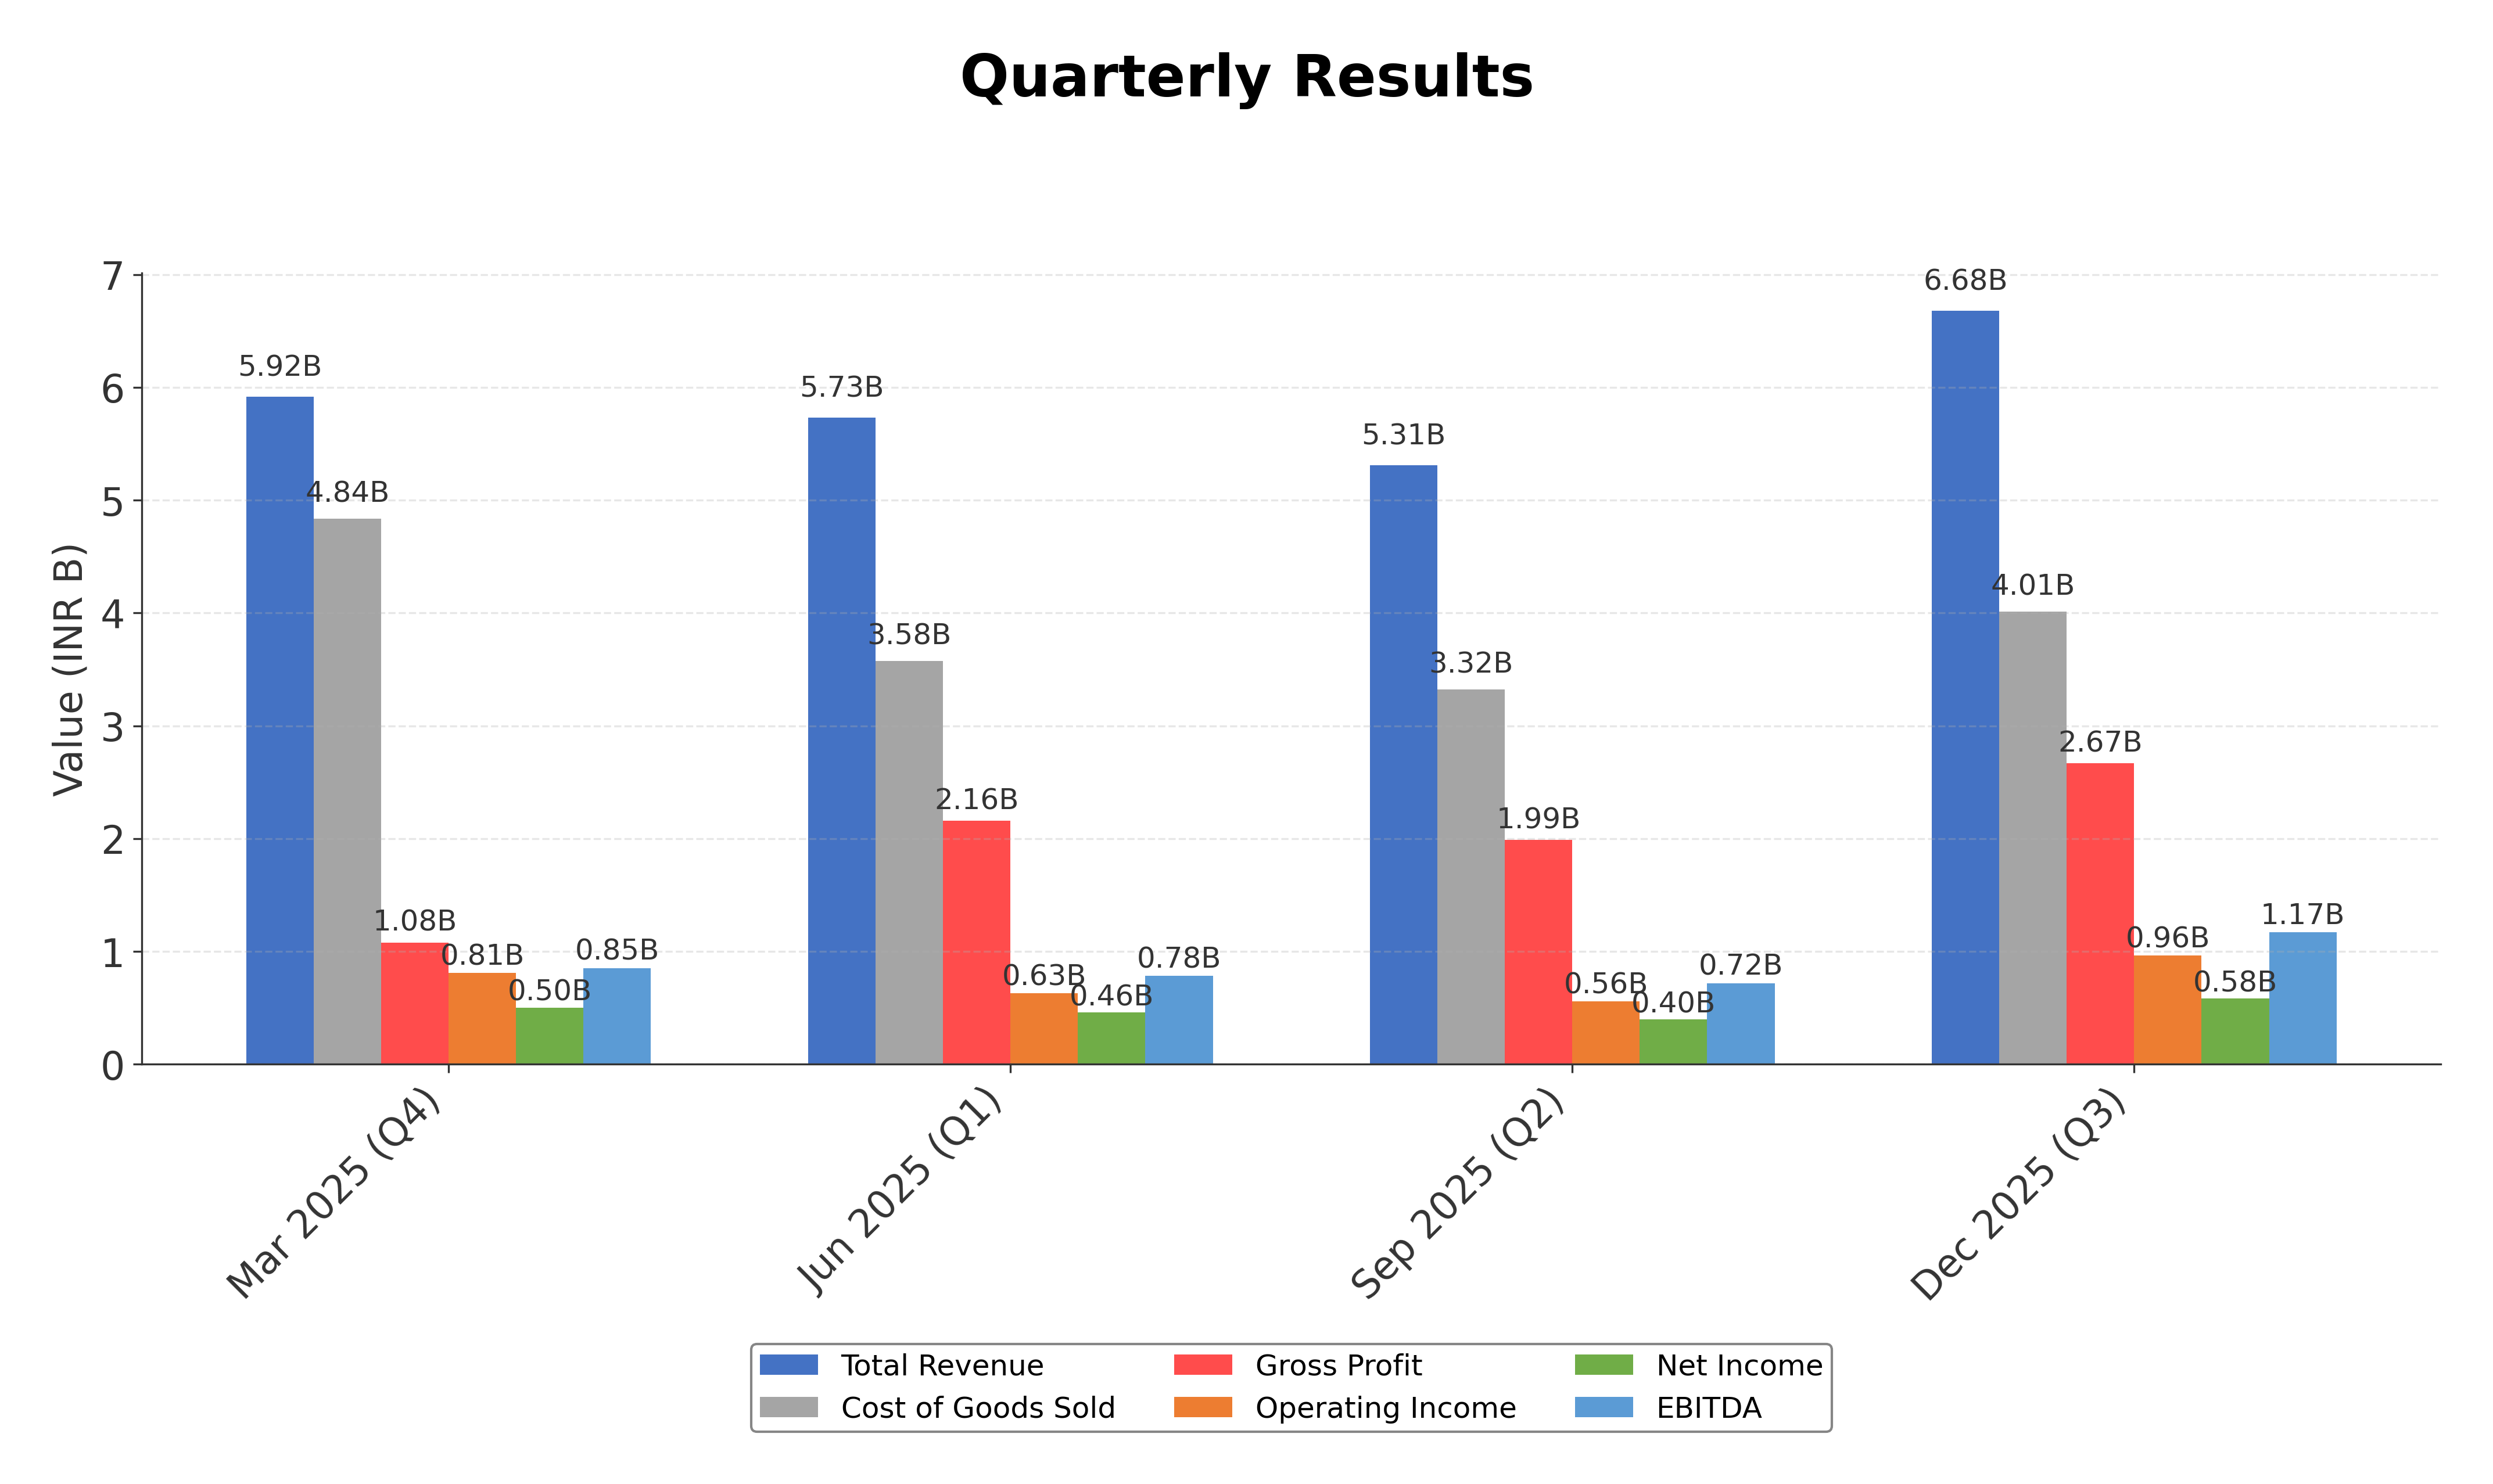
- Robust quarterly revenue growth of 18.7% and earnings growth of 32.9% year-over-year.
- Stable credit rating with CARE AA; Stable on bank facilities worth Rs 550 crore.
Cons
- Recent stock price decline with downside risk of approximately 22.17% from 52-week high.
- Higher enterprise value to EBITDA ratio at 15.89 compared to some peers, suggesting premium valuation.
- Limited institutional investor holding at 9.04%, potentially impacting liquidity and market perception.
Disclosure: This information is for general awareness and does not constitute investment advice
Report Summary
Jamna Auto Industries Ltd. operates as a prominent manufacturer specializing in automotive suspension solutions, with a core focus on leaf springs and air suspensions for the commercial vehicle segment. Established in 1954, the company is positioned as a significant player within India's automotive components industry, supplying durable suspension systems essential for trucks, buses, and other commercial vehicles. Its manufacturing footprint spans strategic locations across India, supporting both domestic original equipment manufacturers (OEMs) and international export markets.
Financially, Jamna Auto Industries demonstrates solid performance with a trailing P/E ratio of 25.08 and a forward P/E of 18.43, indicating reasonable valuation relative to earnings expectations. The company reported a trailing twelve months (TTM) revenue of approximately INR 24.10 billion and a net income of INR 1.94 billion, with a profit margin of 8.05%. Return on equity (ROE) stands at 18.16%, reflecting efficient capital utilization. The enterprise value to EBITDA ratio is 15.89, and the company maintains a current ratio of 1.35, suggesting adequate short-term liquidity.
From a technical perspective, Jamna Auto's stock price recently experienced volatility with a 52-week range between INR 69.7 and INR 152.6, currently trading near INR 124.9. Key strategic initiatives include maintaining creditworthiness as evidenced by CARE Ratings reaffirming a stable AA rating on bank facilities. Leadership changes were not explicitly noted, but recent technical momentum shifts and mixed valuation signals suggest a cautious market stance. Strengths include robust operational cash flow and dividend consistency, while risks involve price pressure and market sentiment fluctuations.
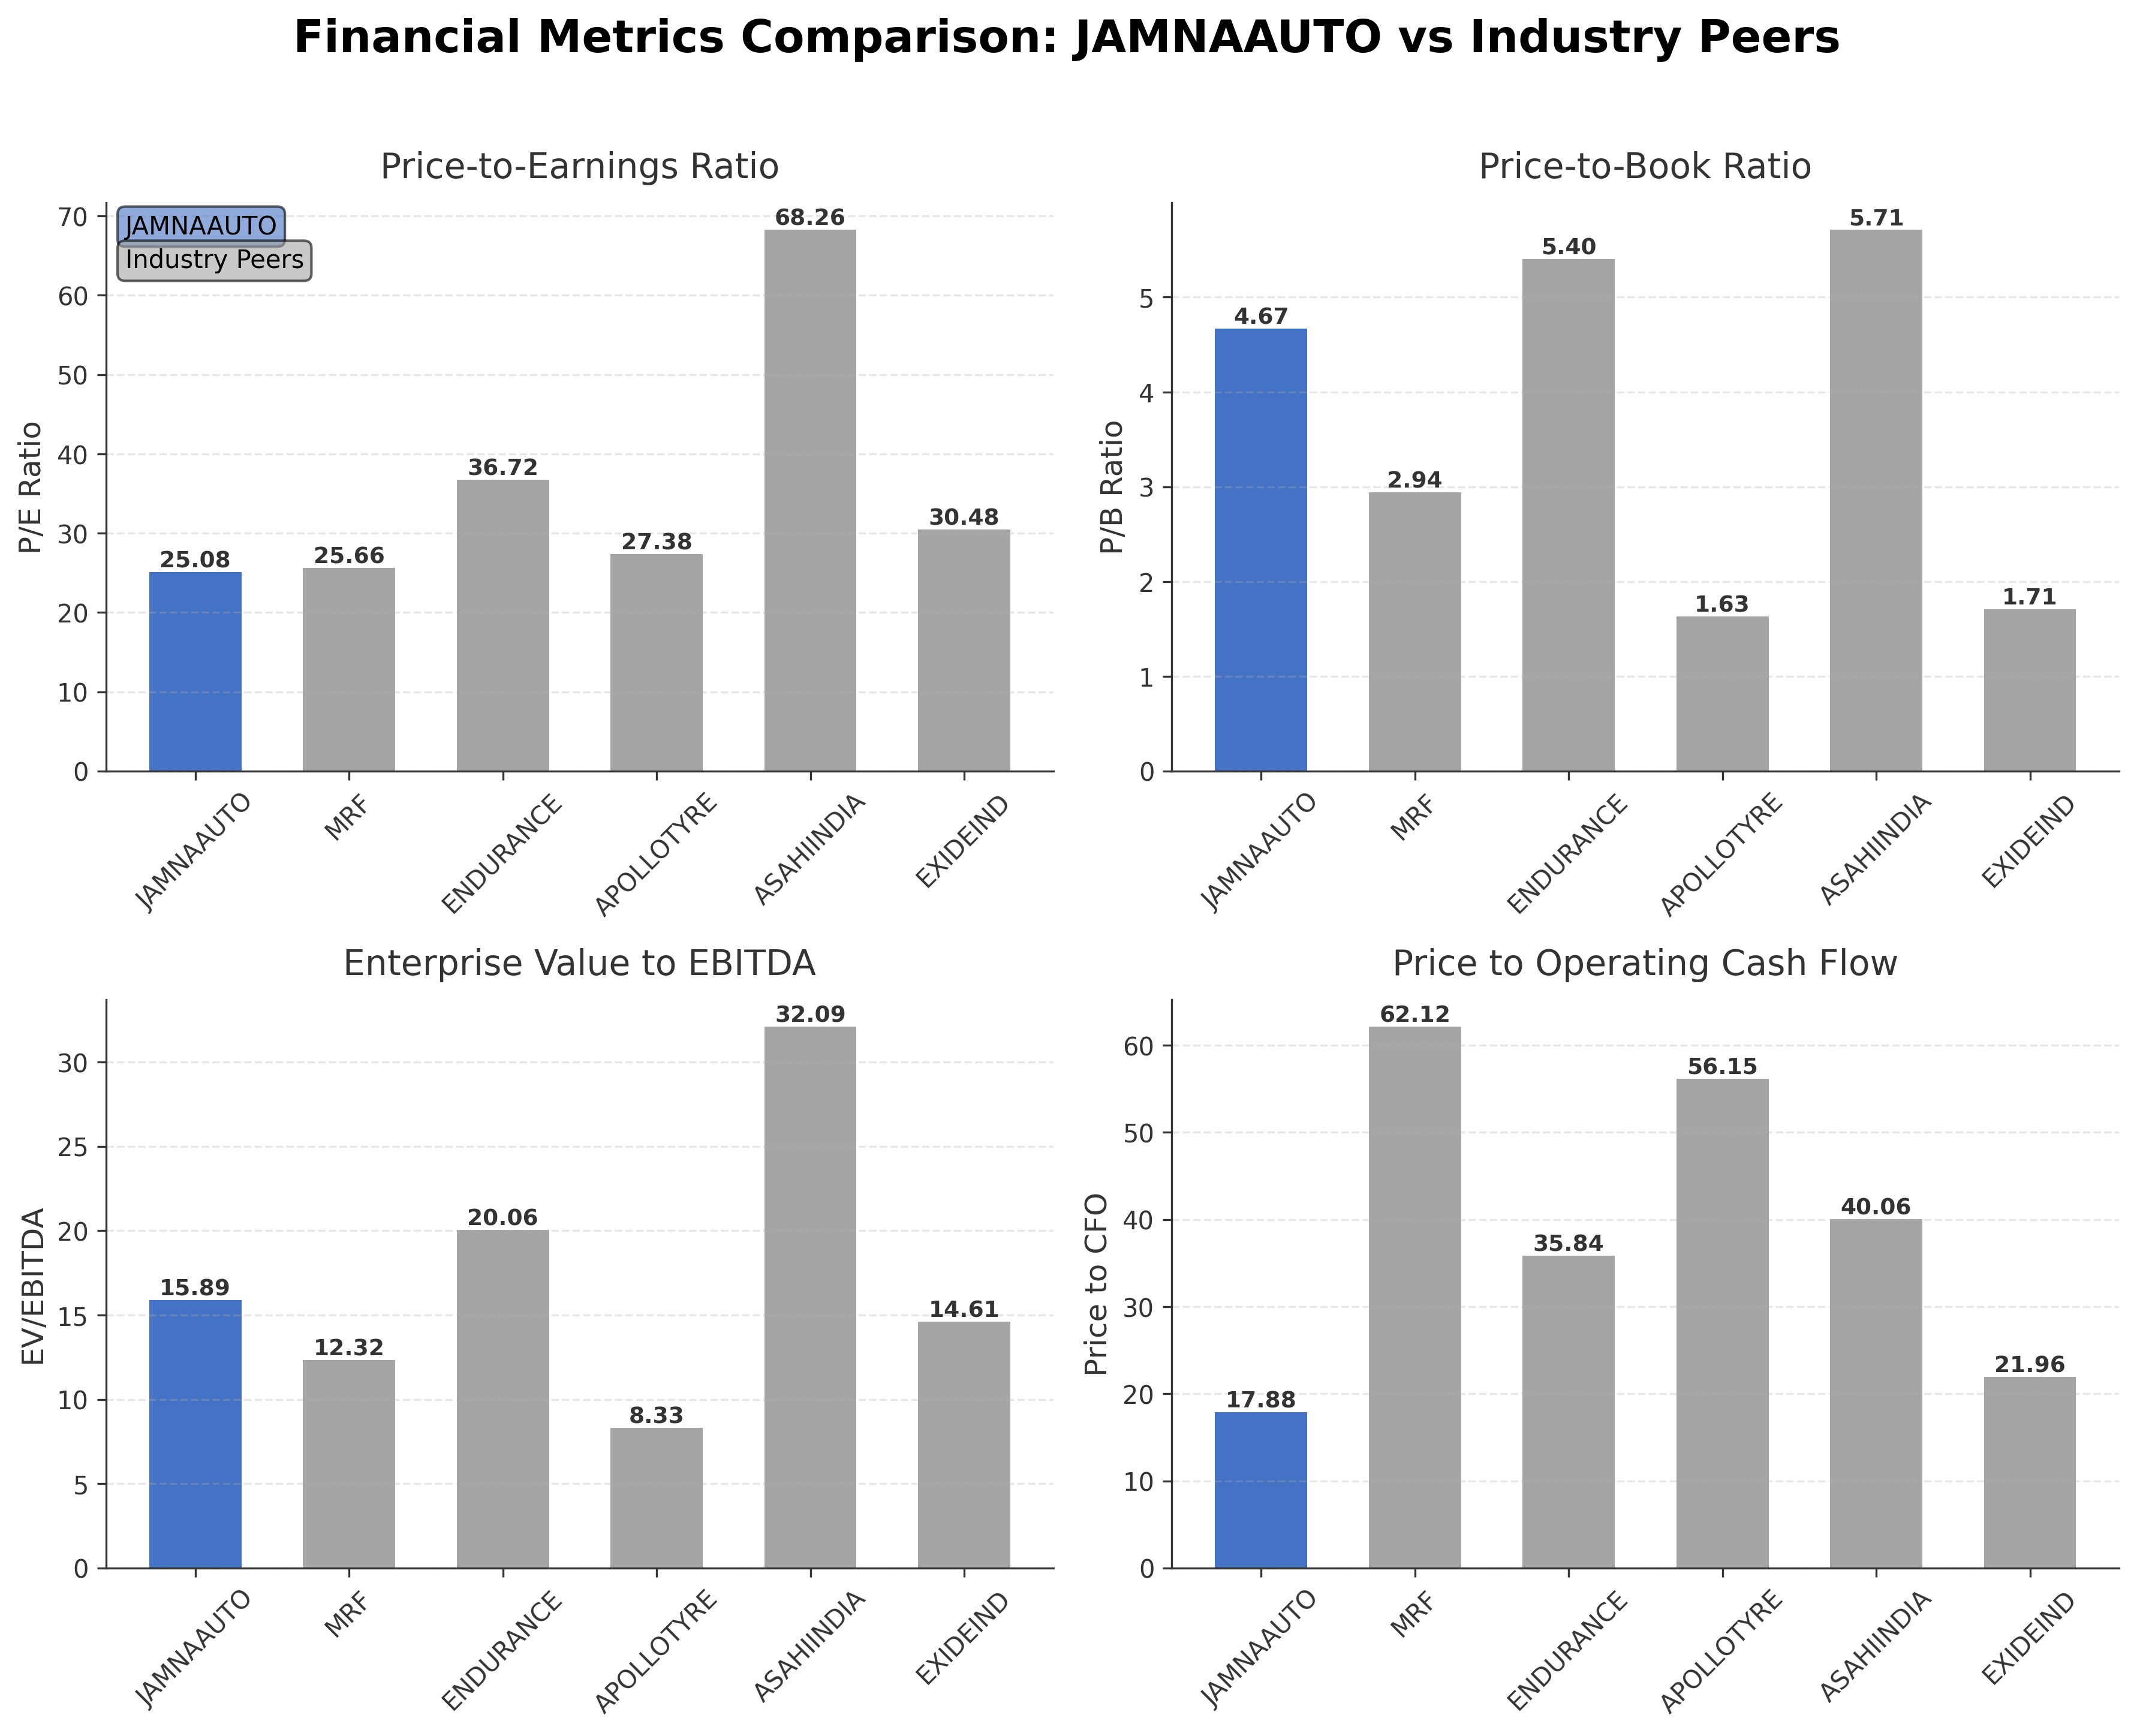
In peer comparison within the Indian auto parts sector, Jamna Auto's market capitalization of approximately INR 53.0 billion is modest relative to larger peers such as MRF Ltd. (INR 572.22 billion) and Endurance Technologies Ltd. (INR 338.07 billion). Its P/E ratio of 25.08 is competitive, positioned below Endurance's 36.72 but above Apollo Tyres' 27.38. The company exhibits a higher return on equity (18.16%) compared to several peers, indicating relative profitability strength. However, its EV/EBITDA ratio of 15.89 is higher than Apollo Tyres and MRF, suggesting a premium valuation on earnings before interest, taxes, depreciation, and amortization.
Jamna Auto Industries Ltd. navigates a dynamic commercial vehicle suspension market marked by evolving technological demands and competitive pressures. Recent achievements include strong revenue growth and credit rating affirmation, while ongoing challenges involve managing market volatility and sustaining operational momentum amid price fluctuations. The company stands at a pivotal juncture where strategic execution and market conditions will significantly influence its trajectory. Evaluating the current financial and technical data suggests a balanced perspective may be appropriate for those monitoring the stock's performance and industry developments.
Company and Industry Overview
Company Basics
Price Performance
Company Size
Shareholding Pattern
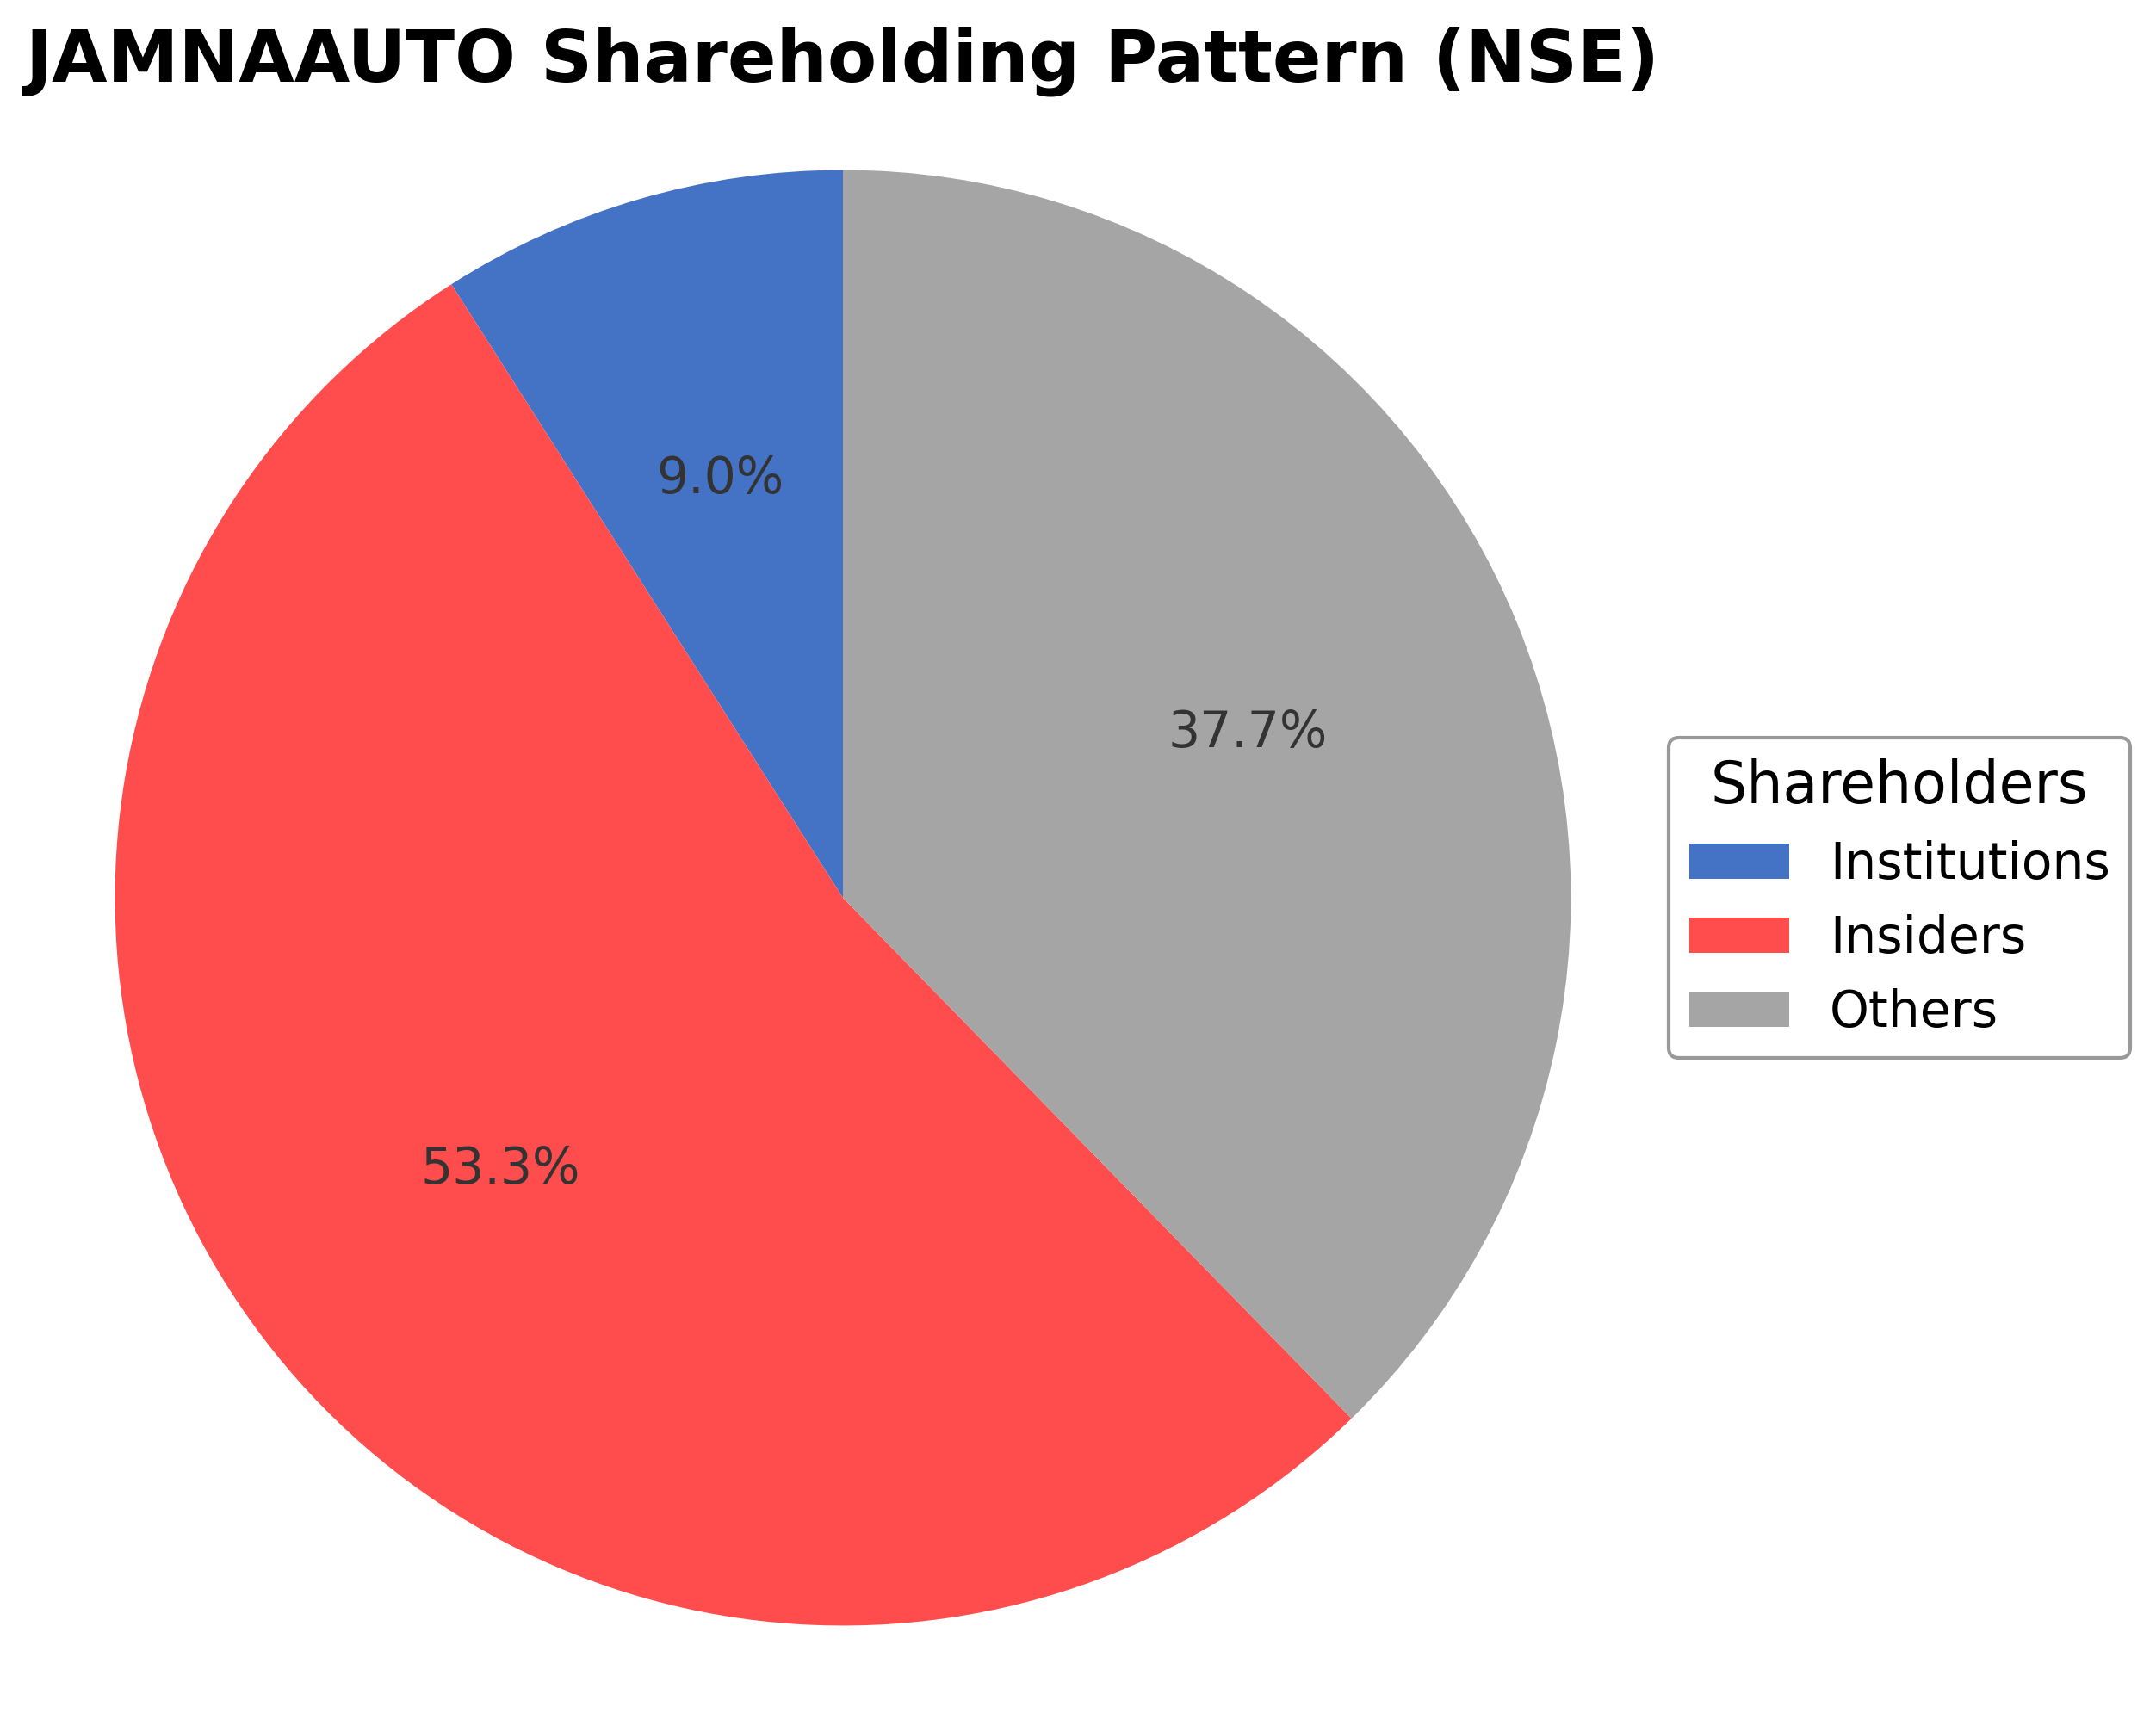
Jamna Auto Industries Ltd.'s ownership structure comprises approximately 53.27% held by insiders including executives and board members, while institutional investors such as mutual funds and asset managers hold about 9.04%. The remaining 37.69% is held by public shareholders including retail investors and employee stock plans. Over the past 12 to 24 months, institutional holdings have shown moderate stability with no significant accumulation or distribution trends reported. This shareholding pattern reflects a stable governance framework with significant promoter control, balanced by institutional participation that may influence strategic decisions and market perception within the Indian auto parts industry.
Sector and Industry Analysis
Jamna Auto Industries Ltd operates within the Indian auto ancillary sector, specifically focusing on suspension systems for commercial vehicles (CVs). The auto ancillary sector in India is a critical component of the broader automobile industry, valued at over USD 50 billion and growing at a CAGR of approximately 10-12%, driven by rising vehicle production and increasing demand for replacement parts. Key players in the suspension segment include Jamna Auto, Minda Industries, and Endurance Technologies, with Jamna Auto commanding a dominant 62-65% market share in the domestic CV OEM segment, underscoring its leadership position. The sector benefits from India’s expanding commercial vehicle fleet, infrastructure development, and increasing freight transportation needs.
Industry trends reveal a gradual technological evolution from conventional leaf springs to advanced parabolic leaf springs, air suspensions, and lift axles, which offer improved ride comfort, fuel efficiency, and load management. The shift towards electric and hybrid commercial vehicles is expected to influence suspension system designs, emphasizing lighter materials and integration with vehicle electronics. Additionally, increasing regulatory focus on vehicle safety and emission norms is driving demand for technologically advanced suspension components. Consumer behavior in the commercial vehicle segment prioritizes durability, cost-effectiveness, and after-sales service, creating opportunities for aftermarket growth alongside OEM sales.
The regulatory landscape governing the auto ancillary industry in India is shaped by the Automotive Industry Standards (AIS), Central Motor Vehicle Rules, and safety regulations enforced by the Ministry of Road Transport and Highways (MoRTH). Compliance with Bharat Stage (BS) emission norms indirectly impacts ancillary manufacturers by influencing vehicle design and component specifications. The government’s push for “Make in India” and incentives for electric vehicle adoption also affect the sector’s strategic direction. Additionally, quality certifications such as ISO/TS 16949 are critical for OEM suppliers to maintain contracts and market access, emphasizing stringent compliance and continuous improvement.
Competitive dynamics in the suspension systems industry are characterized by a concentrated market structure with a few dominant players like Jamna Auto enjoying high market share and strong OEM relationships. Barriers to entry include high capital expenditure for manufacturing facilities, stringent quality standards, and the need for long-term OEM partnerships. Jamna Auto’s near debt-free balance sheet and consistent profitability (ROCE ~20.7%, ROE ~19.2%) reinforce its competitive positioning. The aftermarket segment offers additional growth avenues but is fragmented and price-sensitive. Innovation in product design, cost optimization, and supply chain efficiency remain critical competitive levers in maintaining and expanding market presence.
Note: Analysis synthesized from industry research, market reports, and regulatory filings. Information is subject to change based on market conditions.
Illustrative Scenario Analysis
DCF Assumptions:
Method: Two-Stage EPS-Priority Model
Financials
Peer Analysis
| Company Name | Market Cap | P/E Ratio | P/B Ratio | EV/EBITDA | Price to CFO |
|---|---|---|---|---|---|
| Jamna Auto Industries Ltd. | ₹52.99B | 25.08 | 4.67 | 15.89 | 17.88 |
| MRF Ltd. | ₹572.22B | 25.66 | 2.94 | 12.32 | 62.12 |
| Endurance Technologies Ltd. | ₹338.07B | 36.72 | 5.40 | 20.06 | 35.84 |
| Apollo Tyres Ltd. | ₹253.52B | 27.38 | 1.63 | 8.33 | 56.15 |
| Asahi India Glass Ltd. | ₹211.59B | 68.26 | 5.71 | 32.09 | 40.06 |
| Exide Industries Ltd. | ₹252.18B | 30.48 | 1.71 | 14.61 | 21.96 |
Comparison Analysis: Jamna Auto Industries Ltd. holds a mid-sized market capitalization within the Indian auto parts sector, significantly smaller than industry giants like MRF Ltd. and Endurance Technologies Ltd. The company’s P/E ratio of 25.08 is competitive and below Endurance’s 36.72, indicating relatively moderate valuation. Its price-to-book ratio of 4.67 is higher than several peers such as Apollo Tyres and Exide Industries, suggesting a premium on book value. Jamna Auto’s EV/EBITDA ratio of 15.89 is elevated compared to peers like Apollo Tyres (8.33) and MRF (12.32), reflecting a higher enterprise valuation relative to earnings. The company demonstrates a strong return on equity at 18.16%, surpassing most peers, highlighting efficient capital use and profitability.
Financial Metrics Comparison with Peers
Financial Statements
Comprehensive financial data including income, balance sheet, and cash flow metrics
Income Statement
| fiscal_date | 2025-03-31 | 2024-03-31 | 2023-03-31 | 2022-03-31 | 2021-03-31 |
|---|---|---|---|---|---|
| Sales | 22.24B | 23.72B | 22.72B | 16.82B | 10.58B |
| Cost Of Goods | 14.96B | 16.37B | 16.27B | 11.78B | 6.98B |
| Gross Profit | 7.28B | 7.35B | 6.45B | 5.04B | 3.60B |
| Operating Expense Selling General And Administrative | 826.41M | 724.60M | 622.18M | 495.47M | 409.67M |
| Operating Expense Other Operating Expenses | 2.06B | 2.15B | 2.19B | 1.36B | 853.16M |
| Operating Income | 2.63B | 2.89B | 2.32B | 1.94B | 1.09B |
| Non Operating Interest Income | 10.95M | 8.52M | 2.81M | 3.95M | 1.90M |
| Non Operating Interest Expense | 45.71M | 46.38M | 27.74M | 31.90M | 61.20M |
| Pretax Income | 2.56B | 2.83B | 2.29B | 1.91B | 1.01B |
| Income Tax | 754.32M | 778.48M | 610.12M | 504.69M | 279.19M |
| Net Income | 1.80B | 2.05B | 1.68B | 1.41B | 729.63M |
| Eps Basic | 4.52 | 5.15 | 4.23 | 3.53 | 1.83 |
| Eps Diluted | 4.51 | 5.14 | 4.21 | 3.52 | 1.83 |
| Basic Shares Outstanding | 398.82M | 398.71M | 398.49M | 398.34M | 398.33M |
| Diluted Shares Outstanding | 398.82M | 398.71M | 398.49M | 398.34M | 398.33M |
| Ebit | 2.60B | 2.88B | 2.32B | 1.94B | 1.07B |
| Ebitda | 3.11B | 3.34B | 2.74B | 2.31B | 1.43B |
| Net Income Continuous Operations | 2.56B | 2.83B | 2.29B | 1.91B | 1.01B |
| Minority Interests | -1.00K | -1.00K | -1.00K | -1.00K | -1.00K |
| Preferred Stock Dividends | 0.00 | 0.00 | 0.00 | 0.00 | 0.00 |
Data provided by Twelve Data
Balance Sheet
| fiscal_date | 2025-03-31 | 2024-03-31 | 2023-03-31 | 2022-03-31 | 2021-03-31 |
|---|---|---|---|---|---|
| Cash And Cash Equivalents | 1.40B | 734.05M | 510.15M | 225.34M | 380.21M |
| Accounts Receivable | 1.59B | 1.82B | 627.16M | 2.89B | 1.70B |
| Total Assets | 15.25B | 13.50B | 10.40B | 11.93B | 9.98B |
| Total Liabilities | 5.32B | 4.47B | 2.56B | 5.09B | 4.18B |
| Long Term Debt | 111.29M | 89.62M | 92.10M | 108.94M | 90.74M |
| Shareholders Equity | 9.93B | 9.03B | 7.84B | 6.85B | 5.80B |
Data provided by Twelve Data
Cash Flow Statement
| fiscal_date | 2025-03-31 | 2024-03-31 | 2023-03-31 | 2022-03-31 | 2021-03-31 |
|---|---|---|---|---|---|
| Operating Activities Net Income | 2.56B | 2.83B | 2.29B | 1.91B | 1.01B |
| Operating Activities Stock Based Compensation | 11.89M | 12.92M | 16.24M | 23.16M | 6.62M |
| Operating Activities Other Non Cash Items | 5.32M | 16.50M | 5.60M | 9.01M | 37.71M |
| Operating Activities Accounts Receivable | 299.32M | -1.23B | 2.26B | -1.07B | -1.03B |
| Operating Activities Other Assets Liabilities | 89.82M | -383.82M | -33.34M | -978.91M | -886.85M |
| Operating Activities Operating Cash Flow | 2.96B | 1.25B | 4.54B | -107.23M | -863.28M |
| Investing Activities Capital Expenditures | -1.86B | -1.63B | -882.97M | -366.46M | -180.13M |
| Investing Activities Net Acquisitions | -28.99M | N/A | N/A | N/A | N/A |
| Investing Activities Purchase Of Investments | -6.96M | -19.45M | 0.00 | N/A | -997.00K |
| Investing Activities Investing Cash Flow | -1.90B | -1.61B | -882.97M | -365.80M | -181.13M |
| Financing Activities Short Term Debt Issuance | -310.88M | 1.39B | -1.59B | 631.98M | 286.09M |
| Financing Activities Common Stock Issuance | 1.93M | 5.48M | 10.45M | 7.95M | 0.00 |
| Financing Activities Common Dividends | -917.27M | -877.12M | -717.27M | -398.32M | -99.58M |
| Financing Activities Other Financing Charges | 947.49M | 492.34M | -225.86M | 50.00K | N/A |
| Financing Activities Financing Cash Flow | -278.74M | 1.01B | -2.52B | 241.66M | -362.68M |
| End Cash Position | 1.40B | 734.05M | 510.15M | 225.34M | 380.21M |
| Free Cash Flow | 926.41M | -734.51M | 2.85B | -359.40M | 674.48M |
| Investing Activities Other Investing Activity | N/A | 45.60M | N/A | N/A | N/A |
| Investing Activities Sale Of Investments | N/A | N/A | 0.00 | 660.00K | 0.00 |
| Financing Activities Long Term Debt Payments | N/A | N/A | N/A | 0.00 | -549.20M |
| Financing Activities Long Term Debt Issuance | N/A | N/A | N/A | N/A | 0.00 |
Data provided by Twelve Data
Technical Analysis
Key Insights
- The current trend direction shows recent price volatility with a downward correction from the 52-week high of ₹152.6 to the current price of ₹124.9, indicating short-term bearish pressure within a longer-term uptrend.
- Key support levels are identified near ₹121 and ₹110, while resistance is observed around ₹132 and the 50-day moving average at ₹131.5.
- The stock price is trading below the 50-day moving average (₹131.5) but remains above the 200-day moving average (₹109.1), suggesting mixed momentum signals across timeframes.
- Momentum indicators show a Relative Strength Index (RSI) trending lower, indicating weakening buying pressure; MACD reflects a bearish crossover, while stochastic oscillators suggest oversold conditions in the short term.
- Multi-timeframe analysis reveals daily charts showing consolidation after a sharp decline, weekly charts maintaining a mild bullish trend, and monthly charts indicating sustained upward momentum over the medium term.
- Potential market scenarios include a possible retest of support levels if selling pressure persists or a rebound towards resistance if momentum indicators improve, reflecting a cautious technical setup.
Trending News
1. Headline: Jamna Auto Industries Ltd Falls 10.09%: 4 Key Factors Driving the Weekly Decline
Summary: Jamna Auto Industries Ltd experienced a challenging week, with its share price declining by 10.09% from Rs.147.60 to Rs.132.70, significantly underperforming the Sensex which fell 3.00% over the same period. The week was marked by a sharp gap down at the start, continued selling pressure midweek, ...
Sentiment: negative
2. Headline: CARE reaffirms and assigns high credit ratings to Jamna Auto bank facilities - TipRanks.com
Summary: An update from Jamna Auto Industries Limited ( ($IN:JAMNAAUTO) ) is now available. Jamna Auto Industries Limited, a major Indian automotive components manufacturer ...
Sentiment: positive
3. Headline: Jamna Auto Industries Ltd Downgraded to Buy Amid Mixed Technical and Valuation Signals
Summary: Jamna Auto Industries Ltd has seen its investment rating downgraded from Strong Buy to Buy as of 9 March 2026, primarily due to a shift in technical indicators, despite maintaining robust financial performance and valuation metrics. This nuanced change reflects a more cautious stance amid evolving ...
Sentiment: negative
4. Headline: Jamna Auto Industries Ltd Sees Technical Momentum Shift Amid Price Decline
Summary: Jamna Auto Industries Ltd, a key player in the Auto Components & Equipments sector, has experienced a notable shift in its technical momentum, reflecting a transition from a bullish to a mildly bullish trend. Despite a sharp day decline of 7.95%, the stock’s longer-term fundamentals and technical ...
Sentiment: positive
5. Headline: Jamna Auto Industries Ltd Hits Intraday Low Amid Price Pressure on 9 March 2026
Summary: Jamna Auto Industries Ltd experienced a significant intraday decline on 9 Mar 2026, touching a low of Rs 121, reflecting intense price pressure amid broader ...
Sentiment: negative
Summary: In FY26 so far, the stock has surged 83%, increasing from Rs 75 to Rs 137, after a 43% drop in FY25. Jamna Auto Industries
Sentiment: positive
7. Headline: Jamna Auto Industries Ltd Opens with Significant Gap Down Amid Market Concerns
Summary: Jamna Auto Industries Ltd witnessed a sharp gap down at the opening bell on 2 Mar 2026, with the stock plunging 11.25% to an intraday low of Rs 131, reflecti...
Sentiment: negative
8. Headline: Jamna Auto Industries Ltd: A Multibagger Stock Delivering Exceptional Returns
Summary: Jamna Auto Industries Ltd has emerged as a standout performer in the Auto Components & Equipments sector, delivering multibagger returns of over 100% in the past year. Outpacing the Sensex by a wide margin, the company’s robust fundamentals, operational efficiency, and strategic positioning ...
Sentiment: positive
9. Headline: Jamna Auto Industries Ltd is Rated Strong Buy
Summary: Jamna Auto Industries Ltd is rated 'Strong Buy' by MarketsMOJO, with this rating last updated on 16 February 2026. However, all fundamentals, returns, and financial metrics discussed here reflect the stock's current position as of 28 February 2026, providing investors with the latest comprehensive ...
Sentiment: neutral
10. Headline: Jamna Auto Industries Ltd Surges on High-Value Trading and Institutional Interest
Summary: Jamna Auto Industries Ltd (JAMNAAUTO) witnessed a remarkable surge in trading activity on 16 Feb 2026, driven by robust institutional interest and significant value turnover. The stock hit a new 52-week high of Rs 149.9, outperforming its sector and broader market indices, signalling renewed ...
Sentiment: positive
Powered by Brave
Recent Updates
News Summary
Recent news highlights Jamna Auto Industries Ltd's reaffirmation of a stable AA credit rating by CARE Ratings for bank facilities totaling Rs 550 crore, reinforcing the company's strong financial standing. The stock has experienced intraday price pressure with a notable low of Rs 121 on 9 March 2026, reflecting market volatility. Analysis from Simply Wall St indicates valuation metrics are in line with industry standards. The company has recommended a final dividend of Rs 1.10 per share for the fiscal year ending March 31, 2025, demonstrating consistent shareholder returns. Additionally, a recent downgrade in investment rating from Strong Buy to Buy reflects mixed technical signals despite solid fundamentals.
News Sentiment
The overall sentiment from recent updates is mixed to cautiously positive, with credit rating affirmations and dividend announcements supporting financial stability, while technical and market pressures introduce a note of caution. Sentiment across sources varies from positive credit assessments to neutral and negative technical outlooks, indicating a balanced market perception.
Analytical Overview
Analysis Summary
Valuation Metrics: Jamna Auto Industries Ltd's trailing P/E ratio of 25.08 aligns closely with the industry average of 25.08, while its forward P/E of 18.43 suggests a more attractive valuation relative to expected earnings growth.
Growth Trajectory: The company exhibits a robust revenue growth rate of 18.7% quarter-over-quarter and a strong quarterly earnings growth of 32.9% year-over-year, supported by healthy operating and gross margins.
Financial Health: With a low debt-to-equity ratio of 0.15 and positive operating cash flow of INR 2.96 billion, Jamna Auto maintains solid financial health and liquidity, supported by a current ratio of 1.35.
Sector Specific Factors: The automotive components sector in India faces cyclical demand influenced by commercial vehicle production trends and regulatory standards, presenting both growth opportunities and challenges in supply chain management.
Market Positioning And Competitive Advantages: Jamna Auto's established presence in suspension systems, strong promoter holding, and credit rating stability provide competitive advantages within the Indian auto parts industry.
Investment Conclusion
Supporting Factors: No data
Risk Factors: No data
SWOT Analysis
Strengths
- Established market leader in automotive suspension solutions since 1954.
- Strong return on equity at 18.16% reflecting efficient capital use.
- Stable credit rating with CARE AA; Stable reaffirmed.
- Robust revenue growth of 18.7% quarter-over-quarter.
Weaknesses
- Relatively high price-to-book ratio at 4.67 compared to peers.
- Recent stock price volatility with significant intraday declines.
- Limited institutional investor holding at 9.04%, potentially reducing liquidity.
- Dependence on commercial vehicle segment subject to cyclical demand.
Opportunities
- Expansion in commercial vehicle production in India and international markets.
- Technological advancements in suspension systems enhancing product offerings.
- Potential for increased institutional investment and market visibility.
- Growing logistics and passenger transport sectors driving demand.
Threats
- Market sensitivity to regulatory changes affecting automotive components.
- Competitive pressures from larger auto parts manufacturers.
- Economic downturns impacting commercial vehicle sales and production.
- Volatility in raw material prices affecting cost structures.
Company Description
Jamna Auto Industries Ltd. is a leading manufacturer specializing in automotive suspension solutions, primarily leaf springs and air suspensions, catering to the commercial vehicle segment. Established in 1954, the company has positioned itself as a significant player in the automotive components industry in India. The main function of Jamna Auto Industries is to provide durable and efficient suspension systems that enhance vehicle performance and passenger comfort. Its products are integral to the functionality of commercial vehicles such as trucks and buses, impacting industries reliant on road transportation like logistics and passenger travel. With manufacturing facilities scattered across strategic locations in India, Jamna Auto not only supplies to notable domestic original equipment manufacturers (OEMs) but also exports to several international markets. Its role in the financial market is underscored by its contribution to the automotive supply chain, representing growth potential through advancements in technology and increased commercial vehicle production globally."}