

Jain Resource Recycling Limited (JAINREC)
Stock Analysis Report
Stock Journey
Key Positives and Key Risks
Pros
- Strong revenue growth of 55.8% year-over-year indicating expanding business scale.
- Robust return on equity at approximately 31%, reflecting efficient capital use.
- Healthy cash reserves of ₹13.93 billion exceeding total debt of ₹12.94 billion, supporting financial stability.
Cons
- High trailing P/E ratio of 53.80 and price-to-book ratio of 12.86, suggesting elevated valuation.
- Negative operating cash flow despite positive free cash flow, indicating potential liquidity management challenges.
- Concentrated promoter ownership at over 81%, which may limit external governance influence.
Disclosure: This information is for general awareness and does not constitute investment advice
Report Summary
Jain Resource Recycling Limited operates primarily in the recycling and production of non-ferrous metal products, including lead, copper, and aluminum alloys. Listed on the NSE under the Basic Materials sector, the company serves diverse industries such as lead-acid batteries, electrical and electronics, pigments, automotive, and manufacturing. Its operations include manufacturing and trading of specialty metals, positioning it as a significant player in India’s circular economy and non-ferrous metals market.
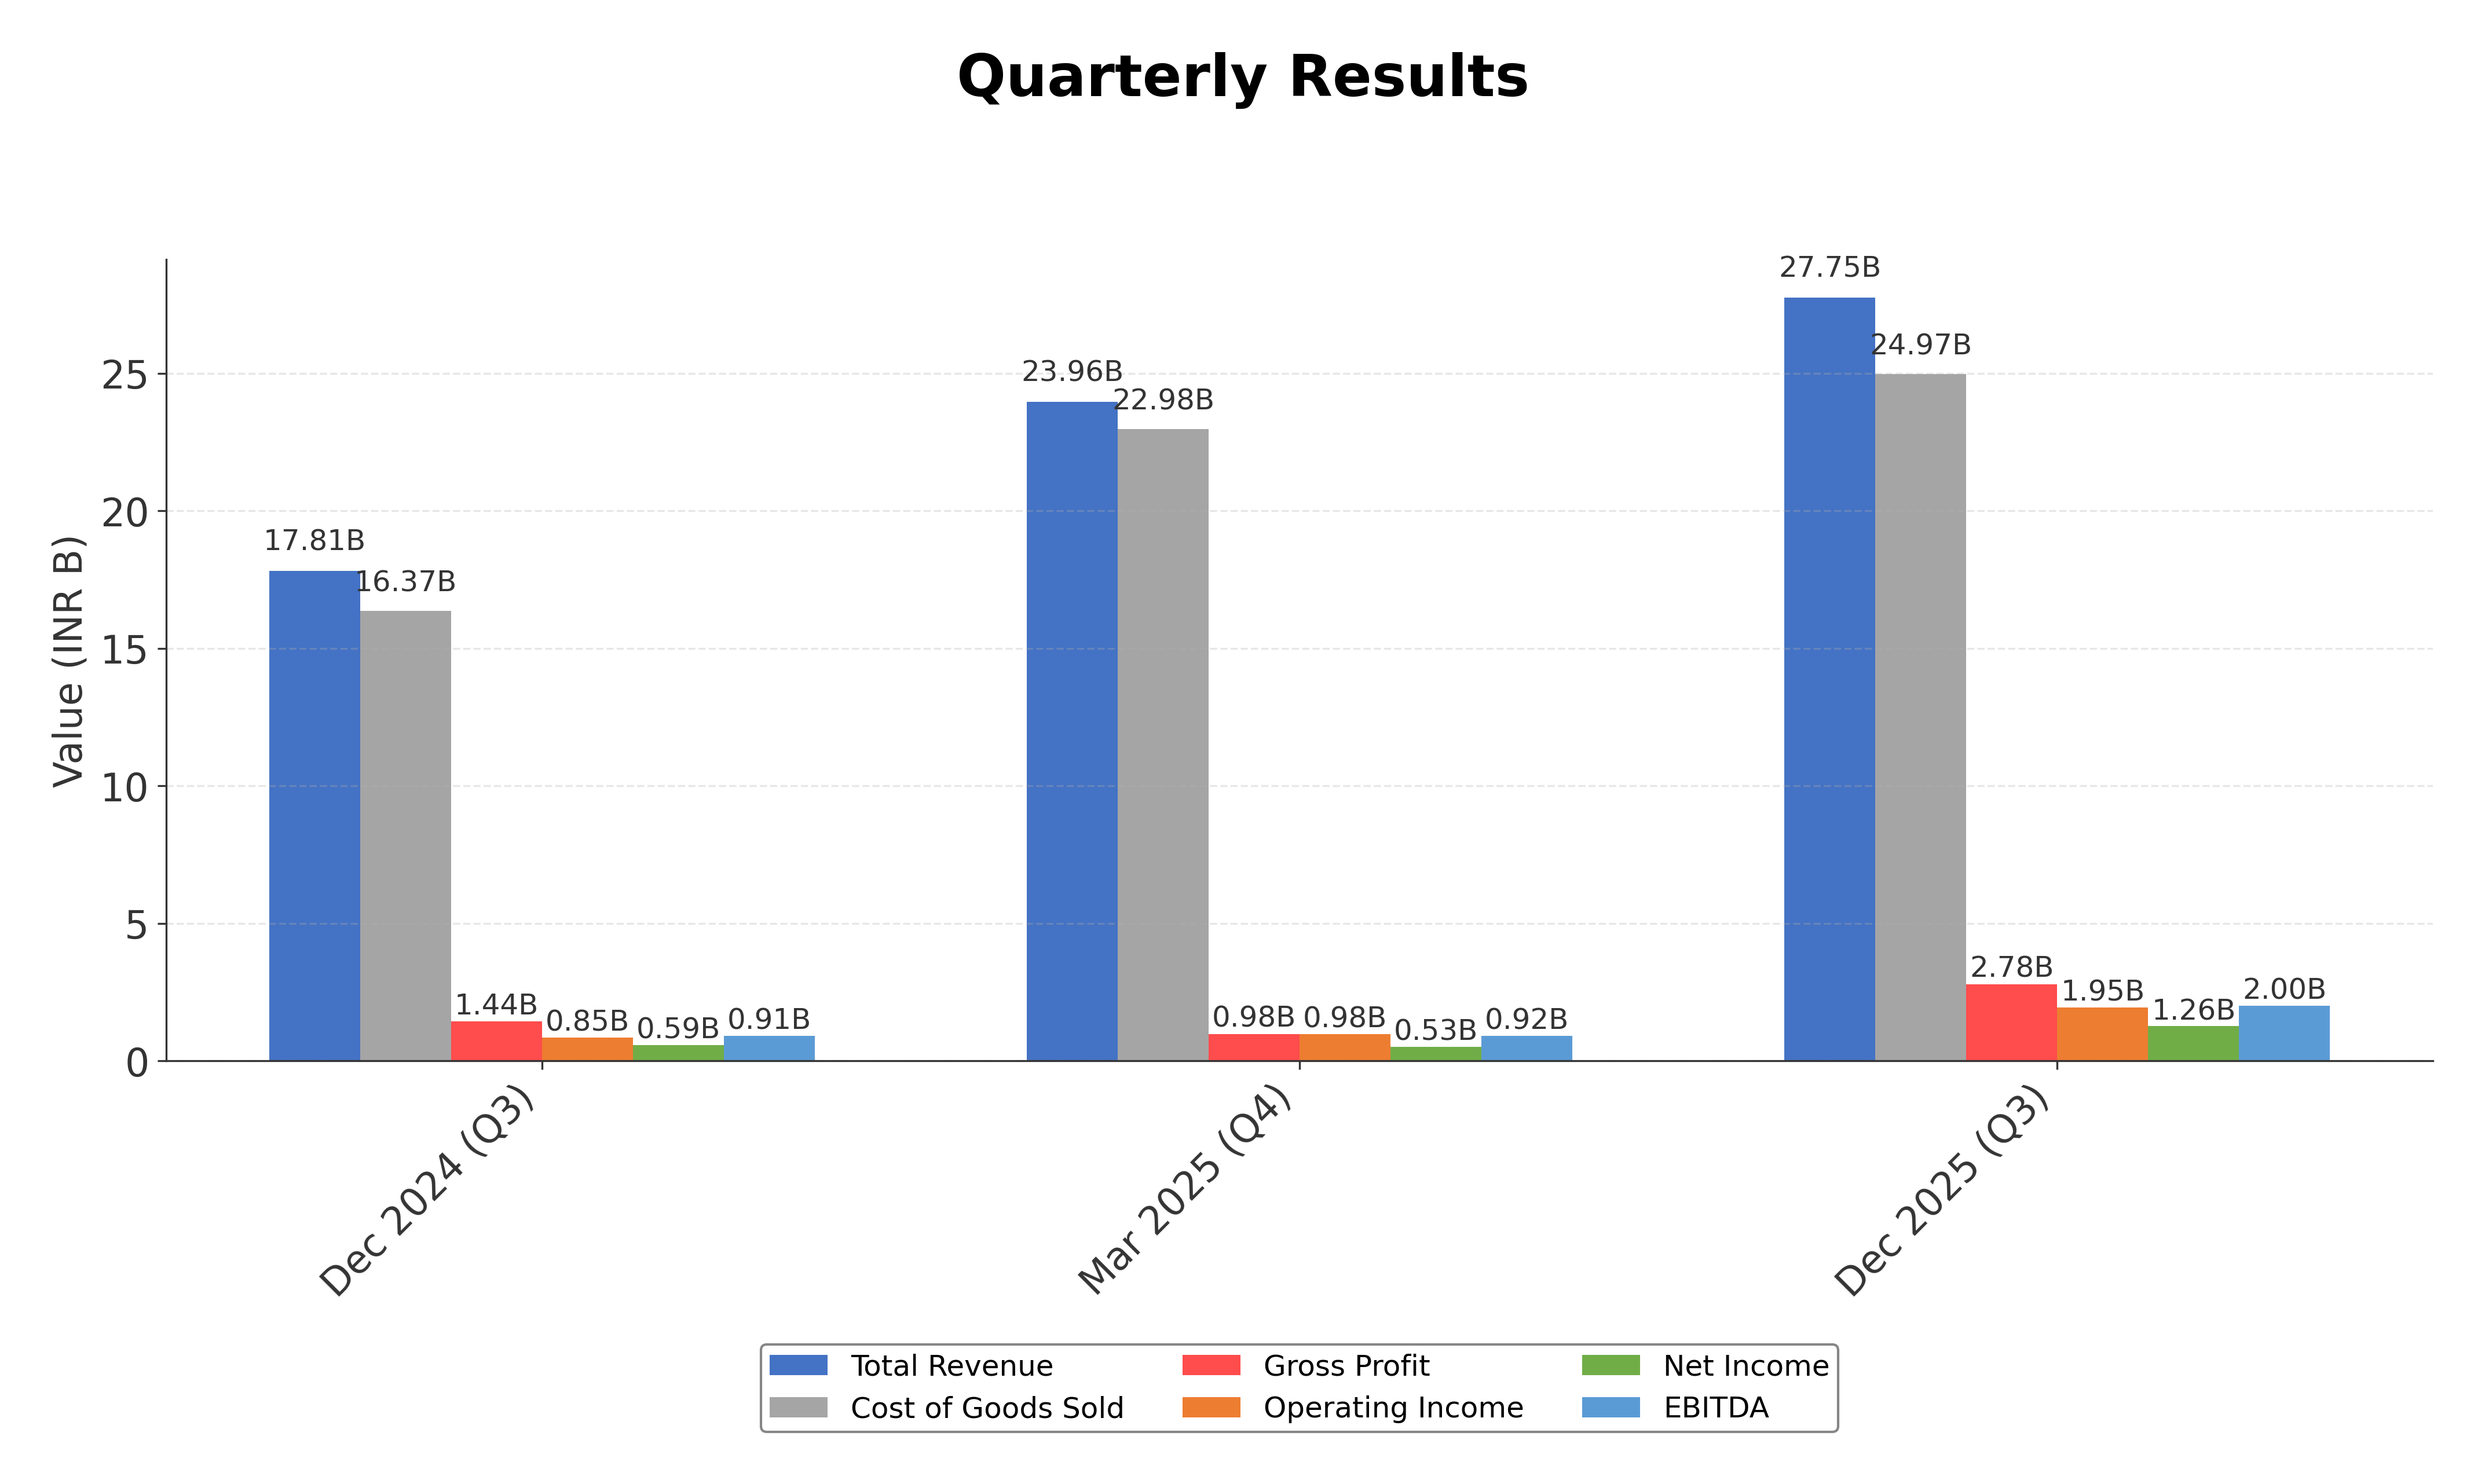
Financially, Jain Resource Recycling reported trailing twelve months (TTM) revenue of approximately ₹88.95 billion with a gross margin of 10.03%, operating margin of 7.03%, and net profit margin of 3.81%. The company’s return on equity (ROE) stands at 30.95%, return on assets (ROA) at 12.22%, and return on invested capital (ROIC) is robust at 27.2% as per industry data. These metrics indicate solid profitability and efficient capital utilization within its operational framework.
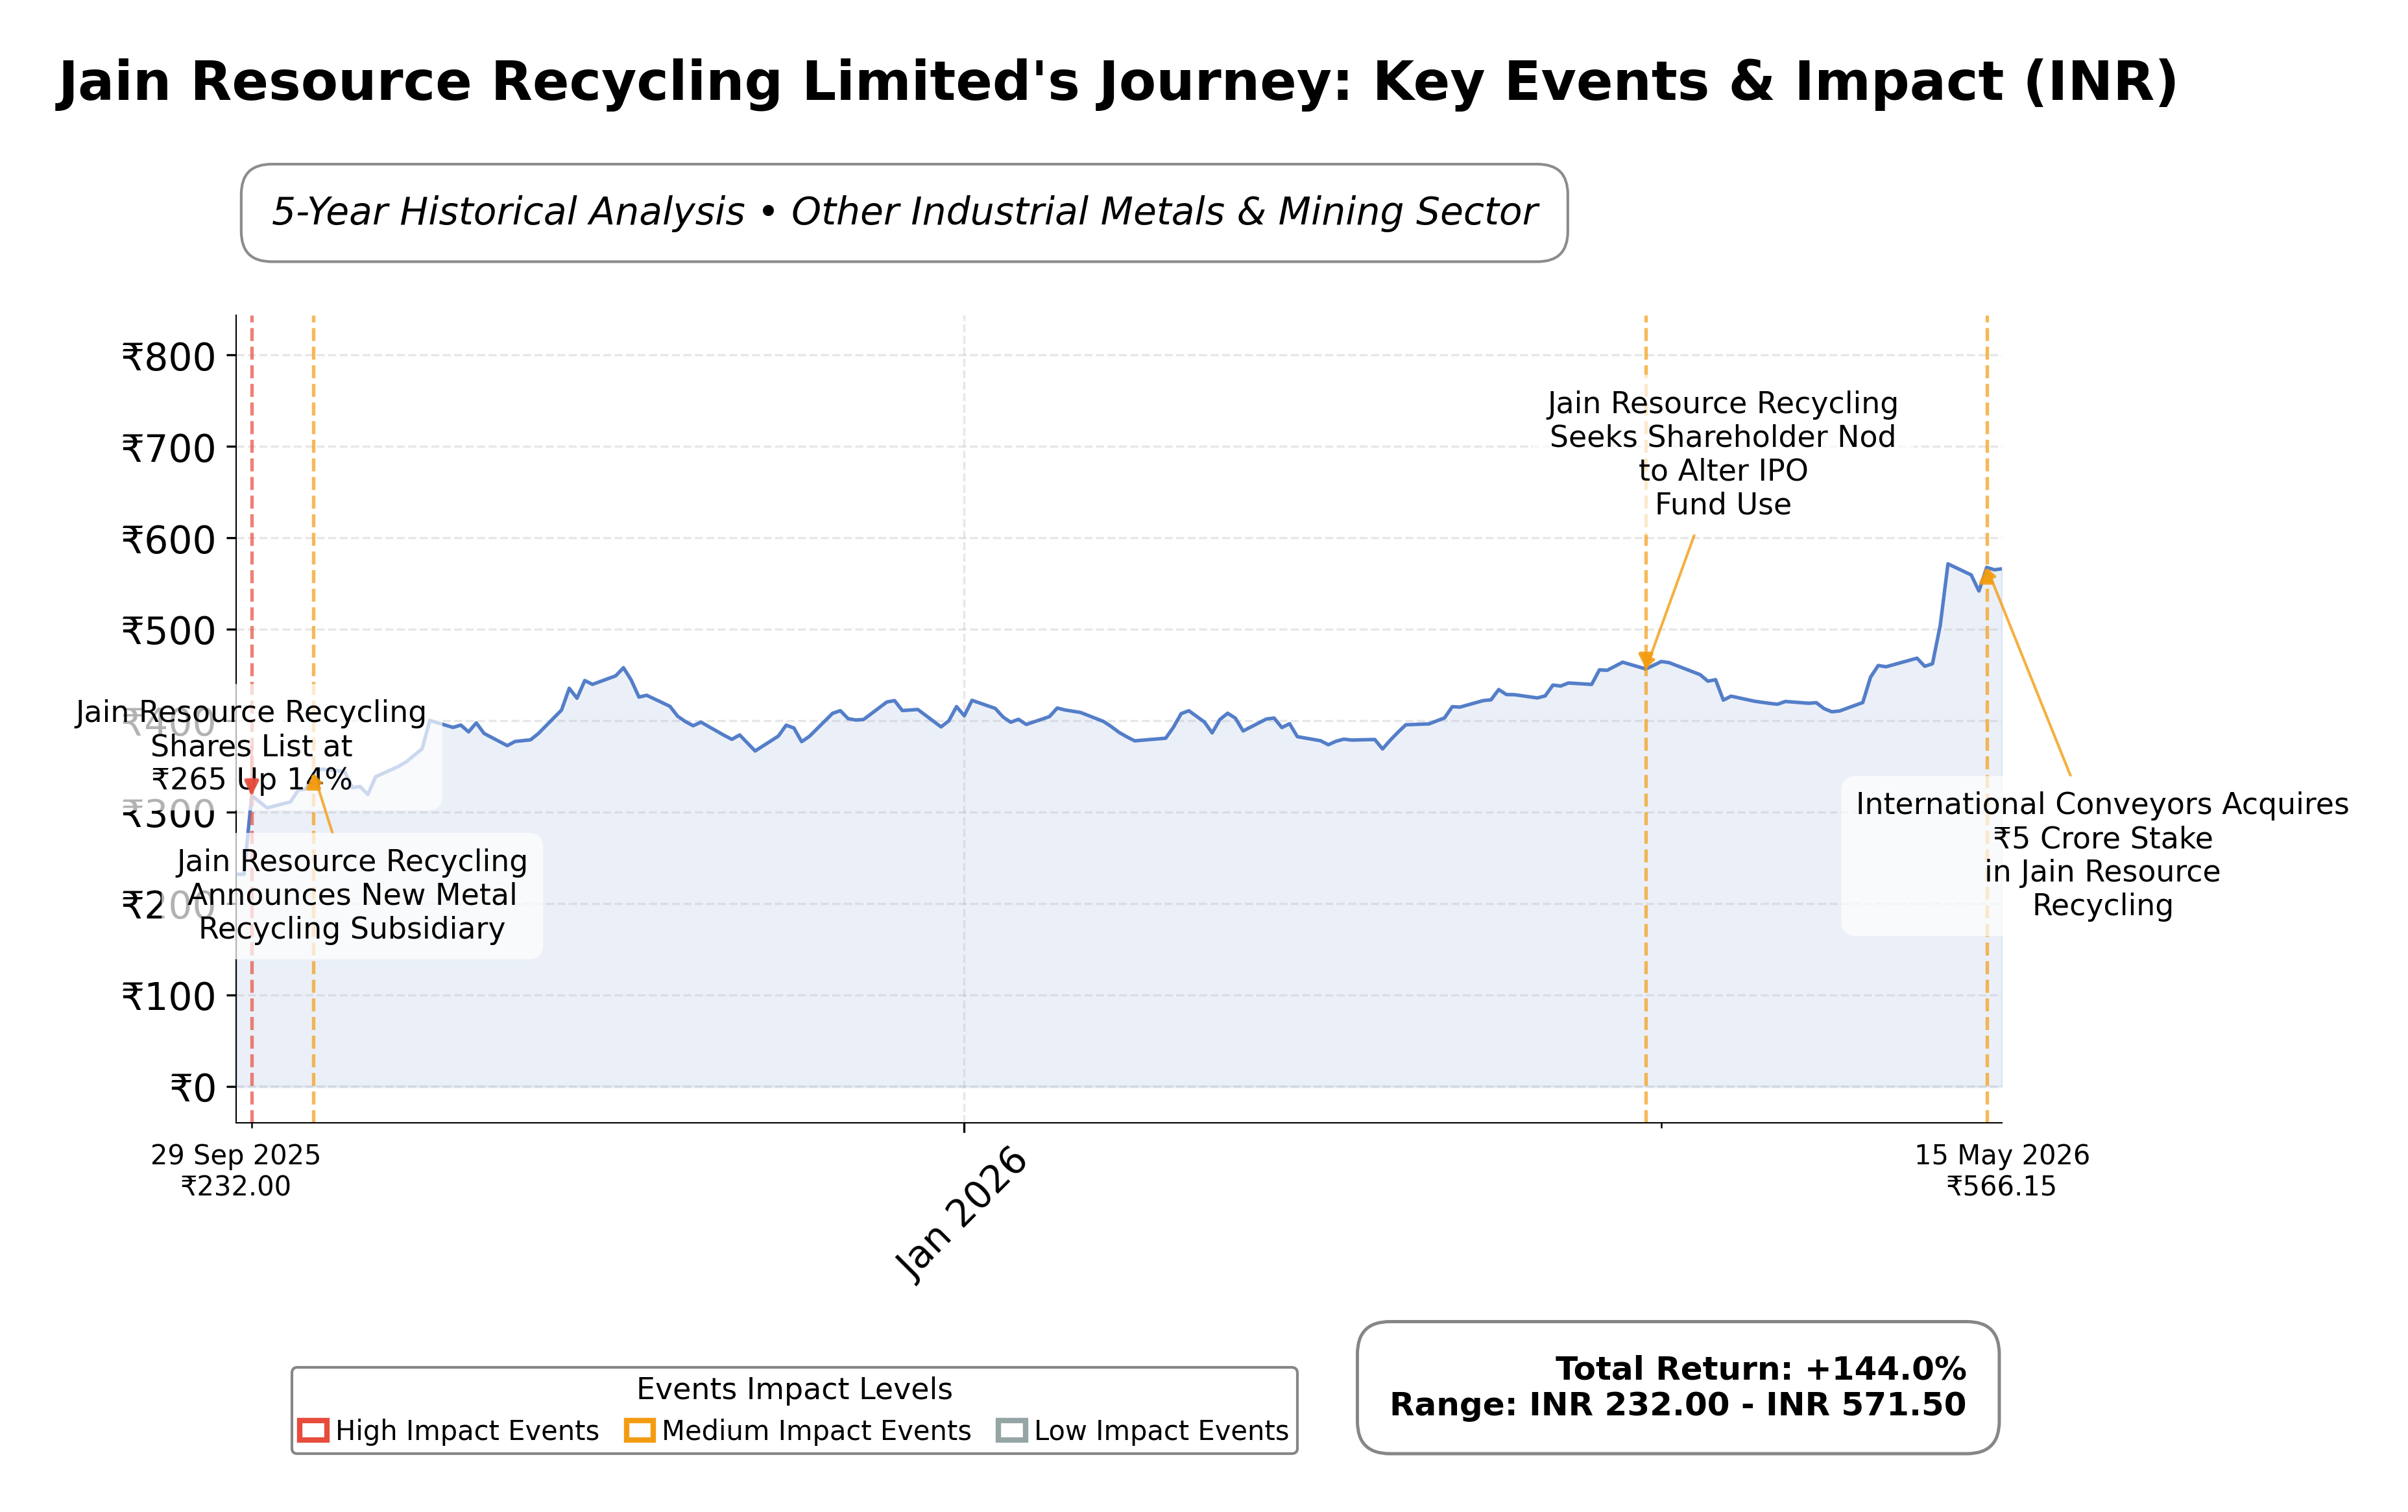
Valuation metrics reveal a trailing price-to-earnings (P/E) ratio of 53.80 and a forward P/E of 31.68, with a price-to-book (P/B) ratio of 12.86 and an enterprise value to EBITDA (EV/EBITDA) multiple of 35.79. The market capitalization is approximately ₹195 billion. The stock trades near its 52-week high of ₹593.95, currently priced at ₹541.85, reflecting a moderate upside potential of about 9.6% from the current price to the 52-week high.
Key strengths include a strong balance sheet with ₹13.93 billion in cash and cash equivalents against ₹12.94 billion in total debt, maintaining a current ratio of 1.51, and a positive levered free cash flow of ₹2.24 billion. Risks involve relatively high valuation multiples compared to peers, potential regulatory challenges in the metals recycling sector, and competitive pressures. Recent strategic developments include a ₹5 crore stake acquisition by International Conveyors Limited and upcoming FY26 earnings announcements, reflecting ongoing investor interest and corporate governance activities.
Technically, the stock exhibits a strong upward trend supported by recent price rallies and momentum shifts, trading above its 50-day and 200-day moving averages. However, mixed technical signals and valuation concerns have led to a nuanced market stance. Overall, the data suggest a cautious but attentive approach to the stock, balancing growth prospects against valuation and market dynamics.
Company and Industry Overview
Company Basics
Price Performance
Company Size
Shareholding Pattern
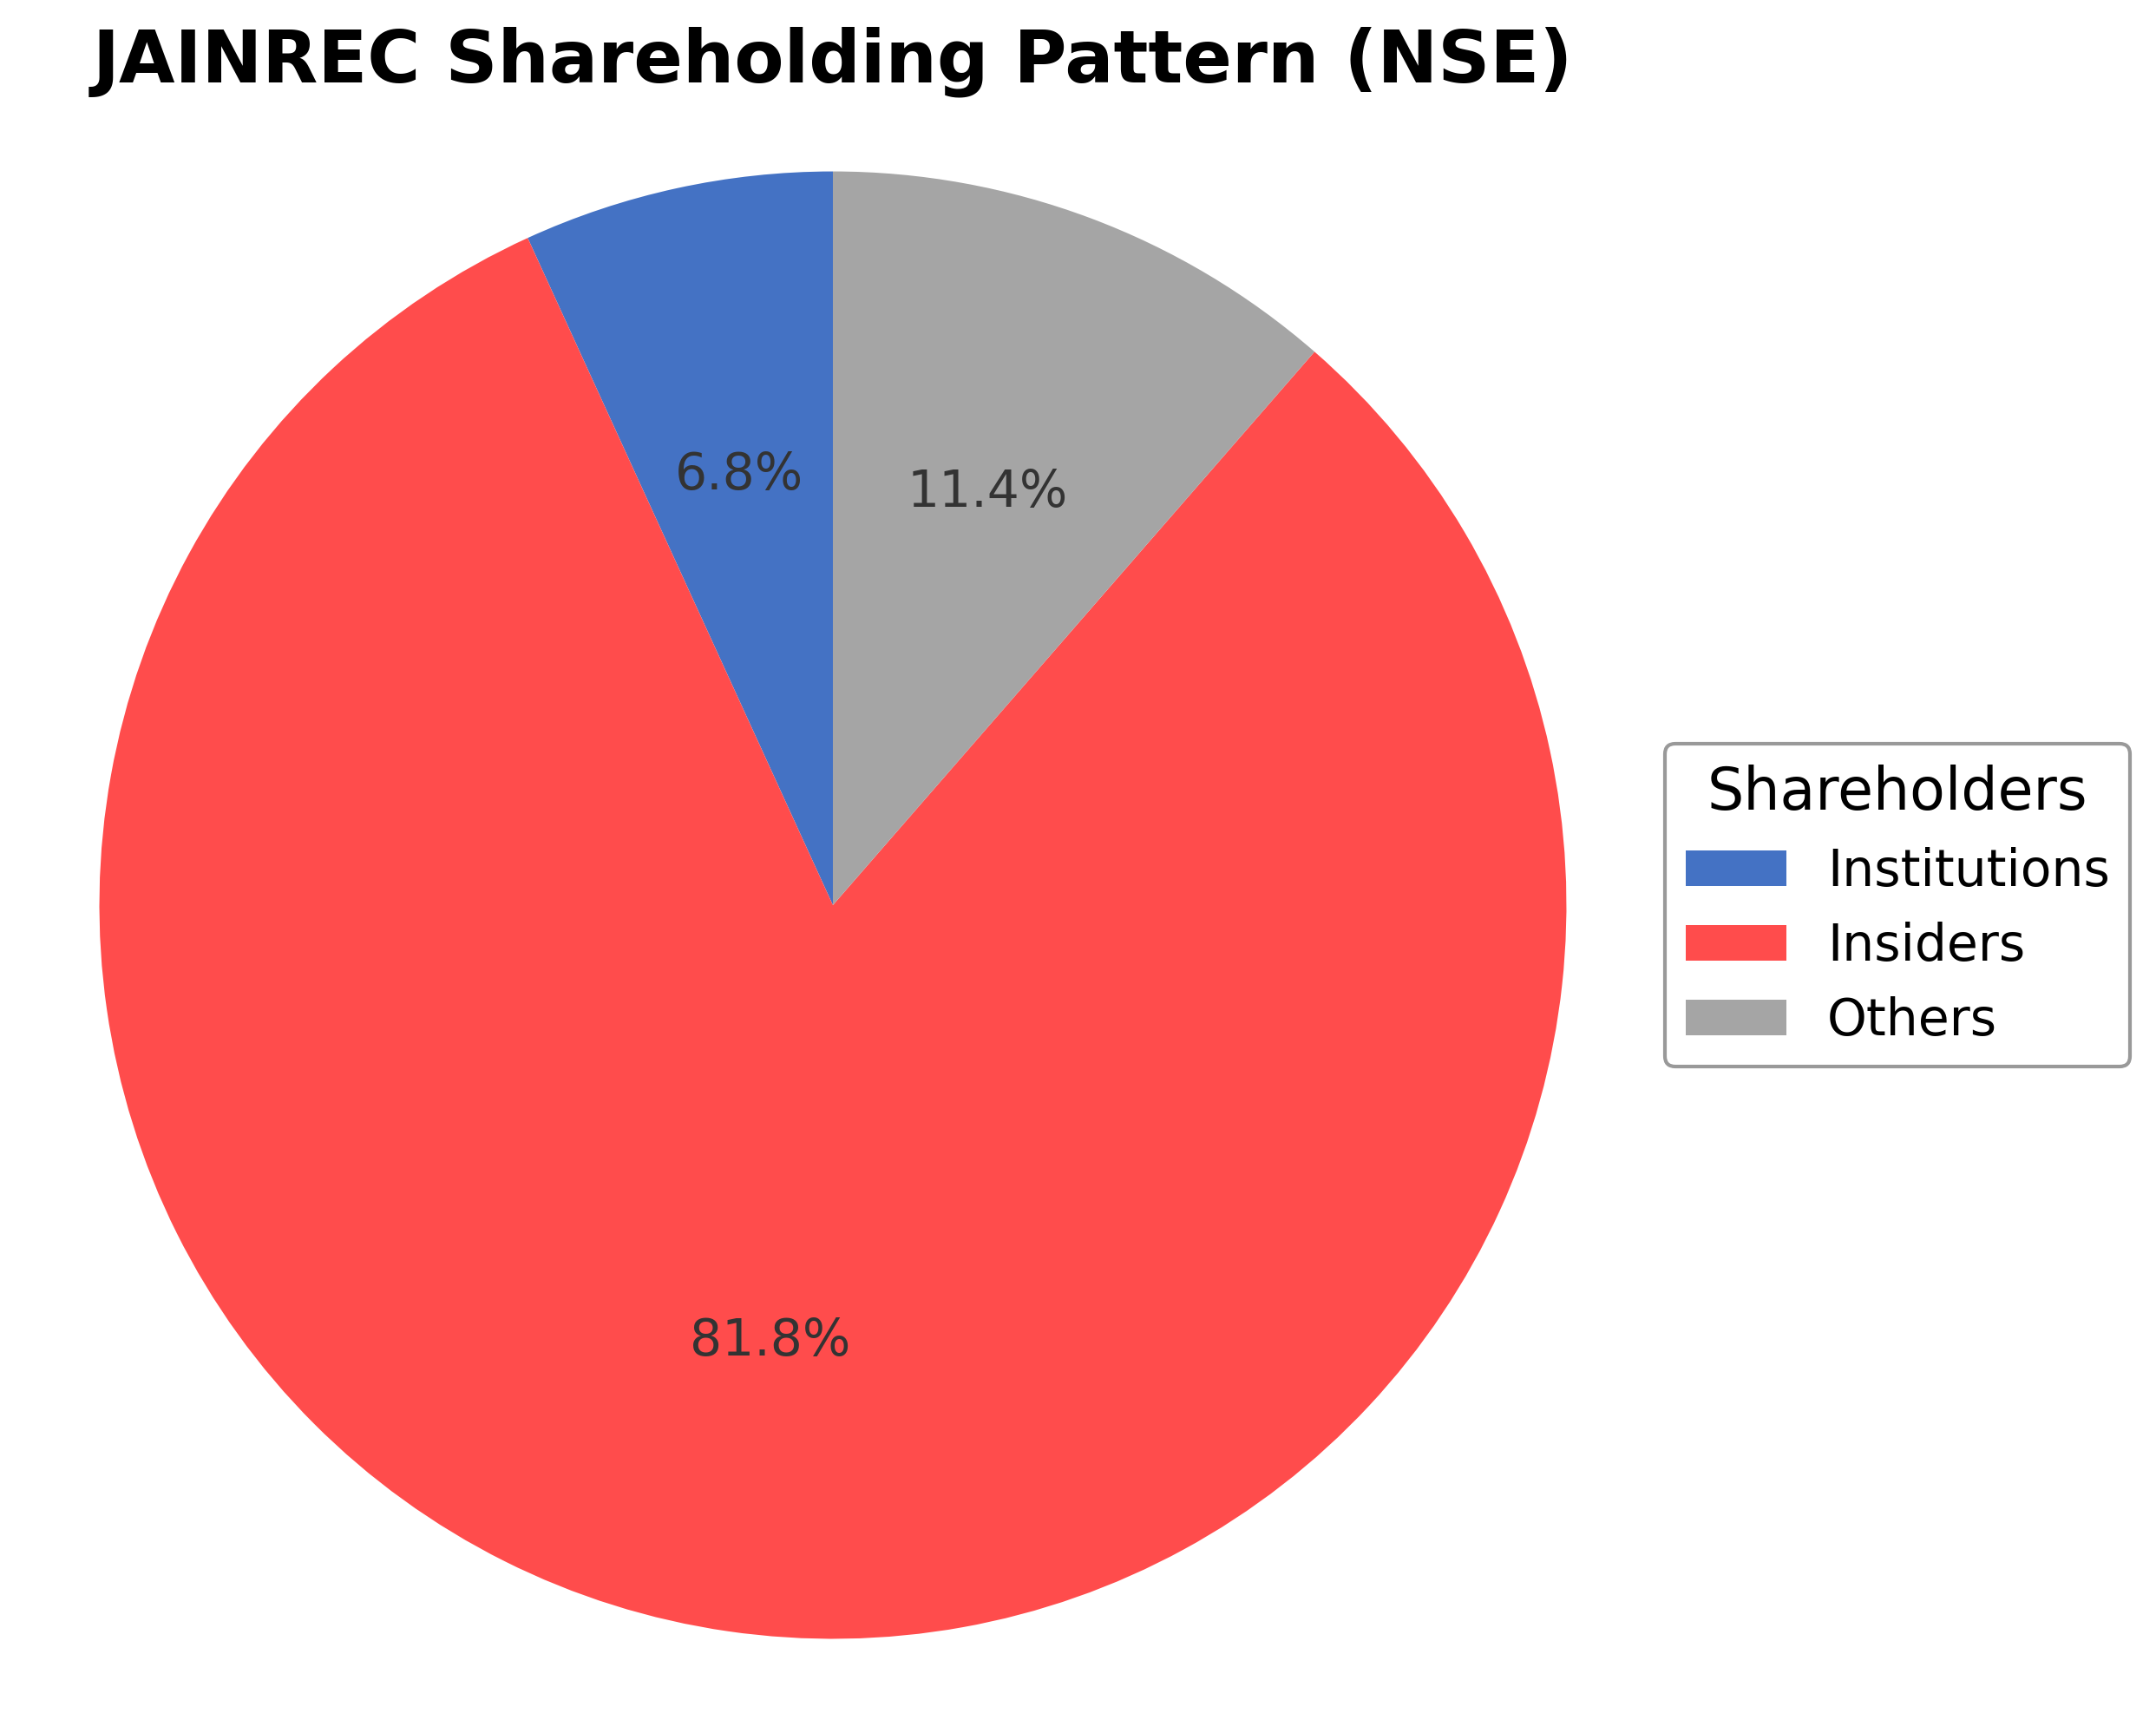
Jain Resource Recycling Limited's ownership structure is predominantly held by insiders, including executives and board members, who control approximately 81.77% of shares, reflecting strong promoter confidence. Institutional investors hold about 6.83%, indicating moderate institutional interest, while public and other shareholders account for roughly 11.40%. Over the past 12-24 months, insider holdings have remained stable with no significant dilution, while institutional positions have shown cautious accumulation aligned with the company's growth trajectory. This shareholding pattern suggests a governance framework heavily influenced by promoters, with institutional investors providing a degree of external oversight. The concentrated insider ownership may facilitate strategic decision-making but also necessitates transparency to align with minority shareholder interests. Overall, the structure reflects market sentiment favoring the company’s long-term operational focus within the metals recycling industry.
Sector and Industry Analysis
The non-ferrous metal recycling sector in India has witnessed significant growth driven by increasing demand for sustainable metal sourcing and cost-effective raw materials. The market encompasses recycling of metals like lead, copper, and aluminium, with large-scale players such as Jain Resource Recycling Ltd operating alongside established competitors. The sector benefits from rising industrial activity and global metal price volatility, which encourages recycling over primary extraction, contributing to a robust growth trajectory.
Industry trends highlight a shift towards integrated recycling and refining operations to enhance efficiency and product quality, as seen with companies producing London Metal Exchange-registered lead ingots. Competitive dynamics are shaped by the capital-intensive nature of recycling infrastructure and the need for technological expertise, creating moderate barriers to entry. Firms with established supply chains for scrap metals and strong trading capabilities hold advantageous positions in this fragmented but growing industry.
The regulatory environment emphasizes environmental compliance and sustainable waste management, with policies encouraging metal recycling to reduce mining impact and carbon footprint. Standards for product quality and export certifications, such as LME registration, also influence operational practices. Continued regulatory support and evolving environmental norms are expected to foster industry expansion while imposing stringent operational requirements on recyclers.
Note: Analysis synthesized from industry research, market reports, and regulatory filings. Information is subject to change based on market conditions.
Financial Ratios Dashboard
Illustrative Scenario Analysis
DCF Assumptions:
Method: Two-Stage EPS-Priority Model
Financials
Peer Analysis
| Company Name | Market Cap | P/E Ratio | P/B Ratio | EV/EBITDA | Price to CFO |
|---|---|---|---|---|---|
| Jain Resource Recycling Limited | ₹194.97B | 53.80 | 12.86 | 35.79 | -2271.09 |
| Vedanta Ltd. | ₹1.29T | 18.46 | 3.22 | 5.87 | 3.27 |
| Hindustan Zinc Ltd. | ₹2.69T | 19.49 | 11.91 | 12.60 | 15.84 |
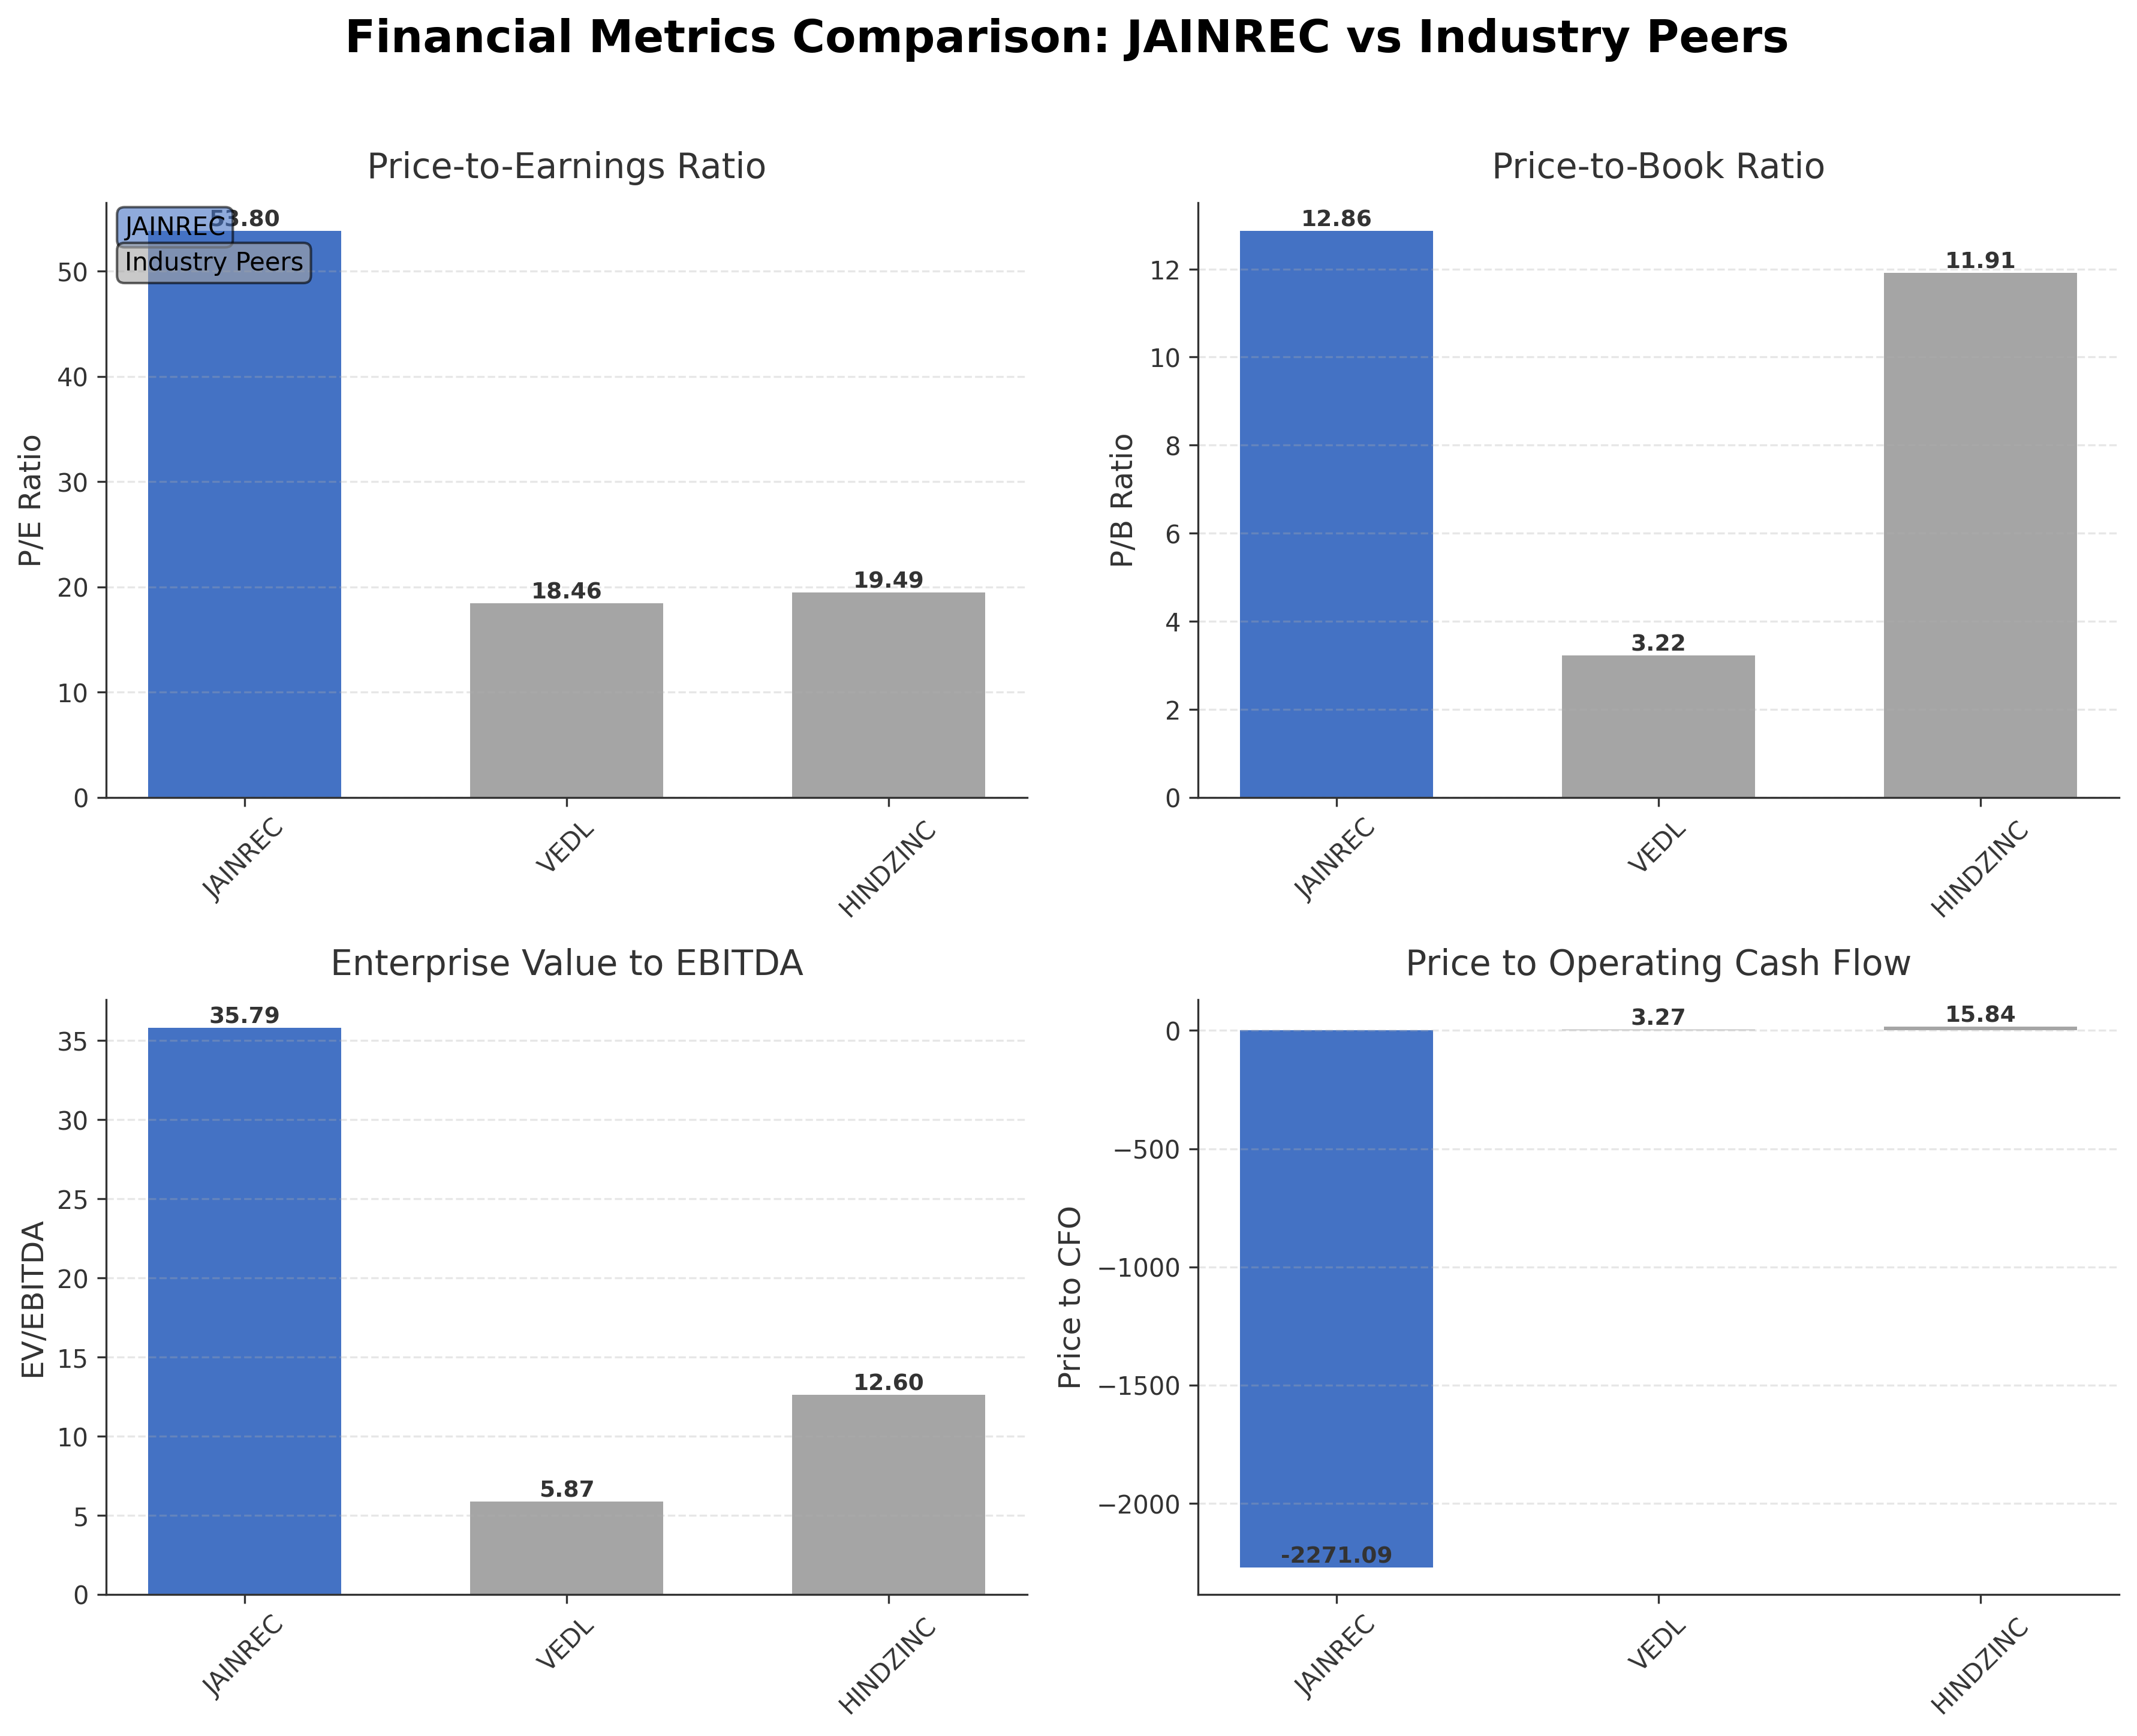
Comparison Analysis: Jain Resource Recycling Limited trades at significantly higher valuation multiples compared to its regional peers Vedanta Ltd. and Hindustan Zinc Ltd., with a trailing P/E of 53.80 versus 18.46 and 19.49 respectively, and an EV/EBITDA of 35.79 compared to 5.87 and 12.60. Its price-to-book ratio of 12.86 is also elevated relative to Vedanta's 3.22 and slightly above Hindustan Zinc's 11.91. Despite higher valuations, Jain Resource Recycling demonstrates a strong return on equity of approximately 31%, outperforming Vedanta but below Hindustan Zinc's robust 77%. The company’s negative price to cash flow ratio contrasts with positive figures for peers, indicating differences in cash flow dynamics. Overall, Jain Resource Recycling exhibits premium valuation metrics reflective of its growth profile but with comparatively mixed cash flow efficiency.
Financial Metrics Comparison with Peers
Financial Statements
Comprehensive financial data including income, balance sheet, and cash flow metrics
Income Statement
| fiscal_date | 2025-03-31 | 2024-03-31 | 2023-03-31 |
|---|---|---|---|
| Sales | 70.65B | 44.14B | 30.60B |
| Cost Of Goods | 65.47B | 40.25B | 28.01B |
| Gross Profit | 5.19B | 3.89B | 2.59B |
| Operating Expense Selling General And Administrative | 351.81M | 310.49M | 238.80M |
| Operating Expense Other Operating Expenses | 889.76M | 623.08M | 501.18M |
| Operating Income | 3.60B | 2.15B | 1.14B |
| Non Operating Interest Income | 320.76M | 242.05M | 179.05M |
| Non Operating Interest Expense | 751.65M | 533.48M | 303.63M |
| Pretax Income | 3.05B | 2.15B | 1.24B |
| Income Tax | 813.06M | 507.75M | 318.12M |
| Net Income | 2.23B | 1.64B | 918.10M |
| Eps Basic | 6.50 | N/A | N/A |
| Eps Diluted | 6.50 | N/A | N/A |
| Basic Shares Outstanding | 345.09M | N/A | N/A |
| Diluted Shares Outstanding | 345.09M | N/A | N/A |
| Ebit | 3.80B | 2.68B | 1.54B |
| Ebitda | 4.02B | 2.71B | 1.67B |
| Net Income Continuous Operations | 3.05B | 2.15B | 1.24B |
| Minority Interests | 10.49M | 0.00 | 90.00K |
| Preferred Stock Dividends | 0.00 | 0.00 | 0.00 |
Source: Financial statements and regulatory filings
Balance Sheet
| fiscal_date | 2025-03-31 | 2024-03-31 | 2023-03-31 |
|---|---|---|---|
| Cash And Cash Equivalents | 235.88M | 814.05M | 55.18M |
| Accounts Receivable | 1.29B | 1.83B | 2.54B |
| Total Assets | 18.36B | 15.29B | 11.16B |
| Total Liabilities | 11.12B | 11.60B | 9.15B |
| Long Term Debt | 101.75M | 401.18M | 465.07M |
| Shareholders Equity | 7.25B | 3.69B | 2.01B |
Source: Financial statements and regulatory filings
Cash Flow Statement
| fiscal_date | 2025-03-31 | 2024-03-31 | 2023-03-31 |
|---|---|---|---|
| Operating Activities Net Income | 3.05B | 2.15B | 1.24B |
| Operating Activities Other Non Cash Items | 473.54M | 160.33M | 125.74M |
| Operating Activities Accounts Receivable | 528.93M | 707.88M | -420.67M |
| Operating Activities Other Assets Liabilities | -4.13B | -2.30B | -484.98M |
| Operating Activities Operating Cash Flow | -85.85M | 711.85M | 456.31M |
| Investing Activities Capital Expenditures | -337.16M | -250.04M | -220.32M |
| Investing Activities Net Acquisitions | 1.86M | 0.00 | 0.00 |
| Investing Activities Purchase Of Investments | -234.98M | -736.20M | -10.00M |
| Investing Activities Sale Of Investments | 0.00 | 327.69M | 83.05M |
| Investing Activities Investing Cash Flow | -570.28M | -658.55M | -147.27M |
| Financing Activities Long Term Debt Issuance | 15.96M | 11.55M | 606.54M |
| Financing Activities Long Term Debt Payments | -1.36B | -2.91B | -3.43B |
| Financing Activities Short Term Debt Issuance | 420.57M | 1.82B | -322.73M |
| Financing Activities Common Stock Issuance | 1.33B | 64.62M | 22.16M |
| Financing Activities Other Financing Charges | -650.00K | -22.19M | N/A |
| Financing Activities Financing Cash Flow | 413.06M | -1.04B | -3.13B |
| End Cash Position | 235.88M | 814.05M | 55.18M |
| Free Cash Flow | -353.86M | 42.25M | -111.88M |
Source: Financial statements and regulatory filings
Technical Analysis
Key Insights
- The current trend direction is upward with recent strong price rallies indicating bullish momentum in the short to medium term.
- Key support levels are observed near ₹435 and ₹405, corresponding to the 50-day and 200-day moving averages respectively, while resistance is near the 52-week high of ₹594.
- The stock price is trading above its 10-day, 50-day (₹435.91), and 200-day (₹405.32) moving averages, suggesting sustained positive momentum.
- Momentum indicators show RSI in a moderately overbought range, MACD indicates a positive crossover, and stochastic oscillators reflect bullish momentum but nearing potential short-term exhaustion.
- Multi-timeframe analysis reveals consistent bullish trends on daily and weekly charts, with monthly charts indicating a longer-term uptrend but with some consolidation phases.
- Potential market scenarios include continuation of the upward trend supported by strong fundamentals, while short-term pullbacks may occur due to overbought conditions and valuation concerns.
Trending News
1. Headline: Jain Irrigation Systems FY26 Results: Revenue Up 10.7%, Net Loss at ₹39.99 Crore
Summary: Jain Irrigation Systems reported consolidated revenue of ₹6,399.52 Crore for FY26, up 10.7% YoY, with EBITDA growing 12.8% to ₹808.9 Crore and EBITDA margin expanding to 12.6%. Exceptional items totalling ₹55.33 Crore, including Labour Code gratuity impacts and subsidiary disruption costs, ...
Sentiment: positive
2. Headline: Jain Resource Recycling updates Q4FY26 earnings call link ahead of May 18 event
Summary: How has Jain Resource Recycling's stock performance trended ahead of the earnings announcement, and what are analyst consensus expectations for revenue and profitability?fuzz it · What strategic expansion plans or capital allocation decisions might the management team reveal given the current landscape of India's resource recycling and circular economy sector?fuzz it ... Jain Resource Recycling Limited ...
Sentiment: positive
3. Headline: Jain Resource Recycling Ltd Schedules FY26 Results & Investor Call for May 18 | Whalesbook Corporate News
Summary: Select the stocks you want to track in real time. ... Receive instant updates directly to WhatsApp. ... Jain Resource Recycling Ltd announced its earnings conference call will be held on May 18, 2026. The company will disclose its audited financial results for the year ended March 31, 2026. Reader Takeaway: Shareholders await FY26 performance; management outlook to be key. Jain Resource Recycling Limited ...
Sentiment: neutral
4. Headline: Jain Resource Recycling to Announce Fiscal 2026 Financial Results, Investor Call May 18 | Whalesbook Corporate News
Summary: Jain Resource Recycling Ltd sets May 18 for its fiscal year 2026 financial results announcement and investor call. Shareholders await performance details.
Sentiment: neutral
5. Headline: International Conveyors Acquisition; Shares Rise 0.27%
Summary: International Conveyors acquired shares of Jain Resource Recycling for ₹5 crore as shares gained 0.27% on May 13, 2026.
Sentiment: positive
Recent Updates
News Summary
As of May 18, 2026. Recent developments for Jain Resource Recycling Limited include the acquisition of 87,105 equity shares by International Conveyors Limited for ₹5 Crore, signaling external investor interest without regulatory hurdles. The company has scheduled its FY26 financial results announcement and investor call for May 18, 2026, with expectations of detailed disclosures on revenue growth and profitability. The April 2026 postal ballot concluded successfully with shareholder approval for key resolutions including subsidiary director remuneration, managing director compensation, IPO fund utilization for loan repayment, and amendments to the Articles of Association. These approvals may enhance operational flexibility and support debt reduction strategies. Additionally, the company reported strong Q2 FY26 growth with a 78% increase in net profit to ₹992 million and revenue rising to ₹21.14 billion, reflecting improved operational efficiency and market demand. The stock has experienced notable price momentum shifts, with mixed technical signals influencing recent market sentiment.
News Sentiment
The overall sentiment from recent updates is cautiously positive, driven by strong quarterly financial performance and strategic shareholder approvals. The acquisition by International Conveyors Limited and successful postal ballot outcomes contribute to confidence in governance and capital allocation. However, mixed technical signals and valuation concerns temper enthusiasm, reflecting a balanced market perspective. The forthcoming FY26 results announcement is a focal point for investors seeking clarity on growth trajectory and strategic direction. This combination of operational strength and market caution shapes a nuanced outlook for the company.
Source List
- https://scanx.trade/stock-market-news/companies/international-conveyors-acquires-equity-shares-of-jain-resource-recycling-limited-for-5-crore/40193404
- https://scanx.trade/stock-market-news/companies/jain-resource-recycling-limited-schedules-board-meeting-on-may-18-2026-to-approve-fy26-financial-results/40246104
- https://scanx.trade/stock-market-news/earnings/jain-resource-recycling-reports-strong-q1-h1-fy2026-results-appoints-new-director/22577328
Analytical Overview
Analysis Summary
Jain Resource Recycling’s valuation metrics, including a trailing P/E of 53.80 and forward P/E of 31.68, are significantly higher than the industry average P/E of approximately 19, indicating a premium valuation that reflects growth expectations but also raises concerns about price sustainability. The company’s revenue growth rate of 55.8% year-over-year and positive levered free cash flow of ₹2.24 billion demonstrate a strong growth trajectory supported by operational improvements and expanding market demand. Financial health is mixed; while cash reserves of ₹13.93 billion exceed total debt of ₹12.94 billion, the operating cash flow is slightly negative, and the debt-to-equity ratio stands at a moderate 0.95, suggesting manageable leverage but requiring monitoring.
Sector-specific challenges include regulatory scrutiny in the metals recycling industry and competitive pressures from larger integrated players, while opportunities arise from increasing demand for sustainable metal recycling and circular economy initiatives in India. Given the company’s Indian market positioning, factors such as evolving environmental regulations, government incentives for recycling, and domestic industrial growth are critical considerations influencing future performance.
Overall Business and Market Assessment
Supporting Factors: No data
Risk Factors: elevated valuation multiples relative to peers, potential volatility in cash flow generation, and sector-specific regulatory challenges
SWOT Analysis
Strengths
- Strong return on equity of approximately 31% indicating efficient capital utilization.
- Robust revenue growth of 55.8% year-over-year demonstrating expanding market presence.
- Healthy cash position exceeding total debt, supporting financial flexibility.
- Integrated recycling and manufacturing operations across multiple non-ferrous metals.
Weaknesses
- High valuation multiples with a trailing P/E of 53.80 and P/B of 12.86.
- Negative operating cash flow despite positive free cash flow, indicating working capital pressures.
- Limited dividend payout history, potentially reducing income appeal to investors.
- Concentrated promoter ownership may limit external governance influence.
Opportunities
- Growing demand for sustainable metal recycling driven by environmental regulations.
- Expansion potential in India’s circular economy and specialty metals trading.
- Strategic partnerships and acquisitions to diversify product offerings and markets.
- Government incentives promoting recycling and resource efficiency.
Threats
- Regulatory risks associated with environmental compliance and metal recycling standards.
- Competitive pressures from larger integrated metals producers and recyclers.
- Volatility in commodity prices impacting profitability and cash flows.
- Macroeconomic uncertainties affecting industrial demand and capital expenditure.
Company Description
Jain Resource Recycling Limited is an Indian manufacturer and exporter specializing in the recycling and production of non-ferrous metal products. The company processes non-ferrous metal scrap to produce lead and lead alloy ingots, copper and copper ingots, and aluminum and aluminum alloys. Additionally, Jain Resource Recycling trades in specialty metals including nickel cathode, silicon metal, tin ingots, and zinc ingots. The company serves diverse industries such as lead-acid batteries, electrical and electronics, pigments, automotive, and manufacturing sectors. Operating from its headquarters in Chennai, India, the company maintains manufacturing facilities and distribution networks that support both domestic and international markets. Jain Resource Recycling plays a significant role in the circular economy by converting scrap materials into refined metal products, serving as a critical supplier to downstream industrial applications requiring high-quality non-ferrous metals and alloys.