

ITC Ltd (ITC)
Stock Analysis Report
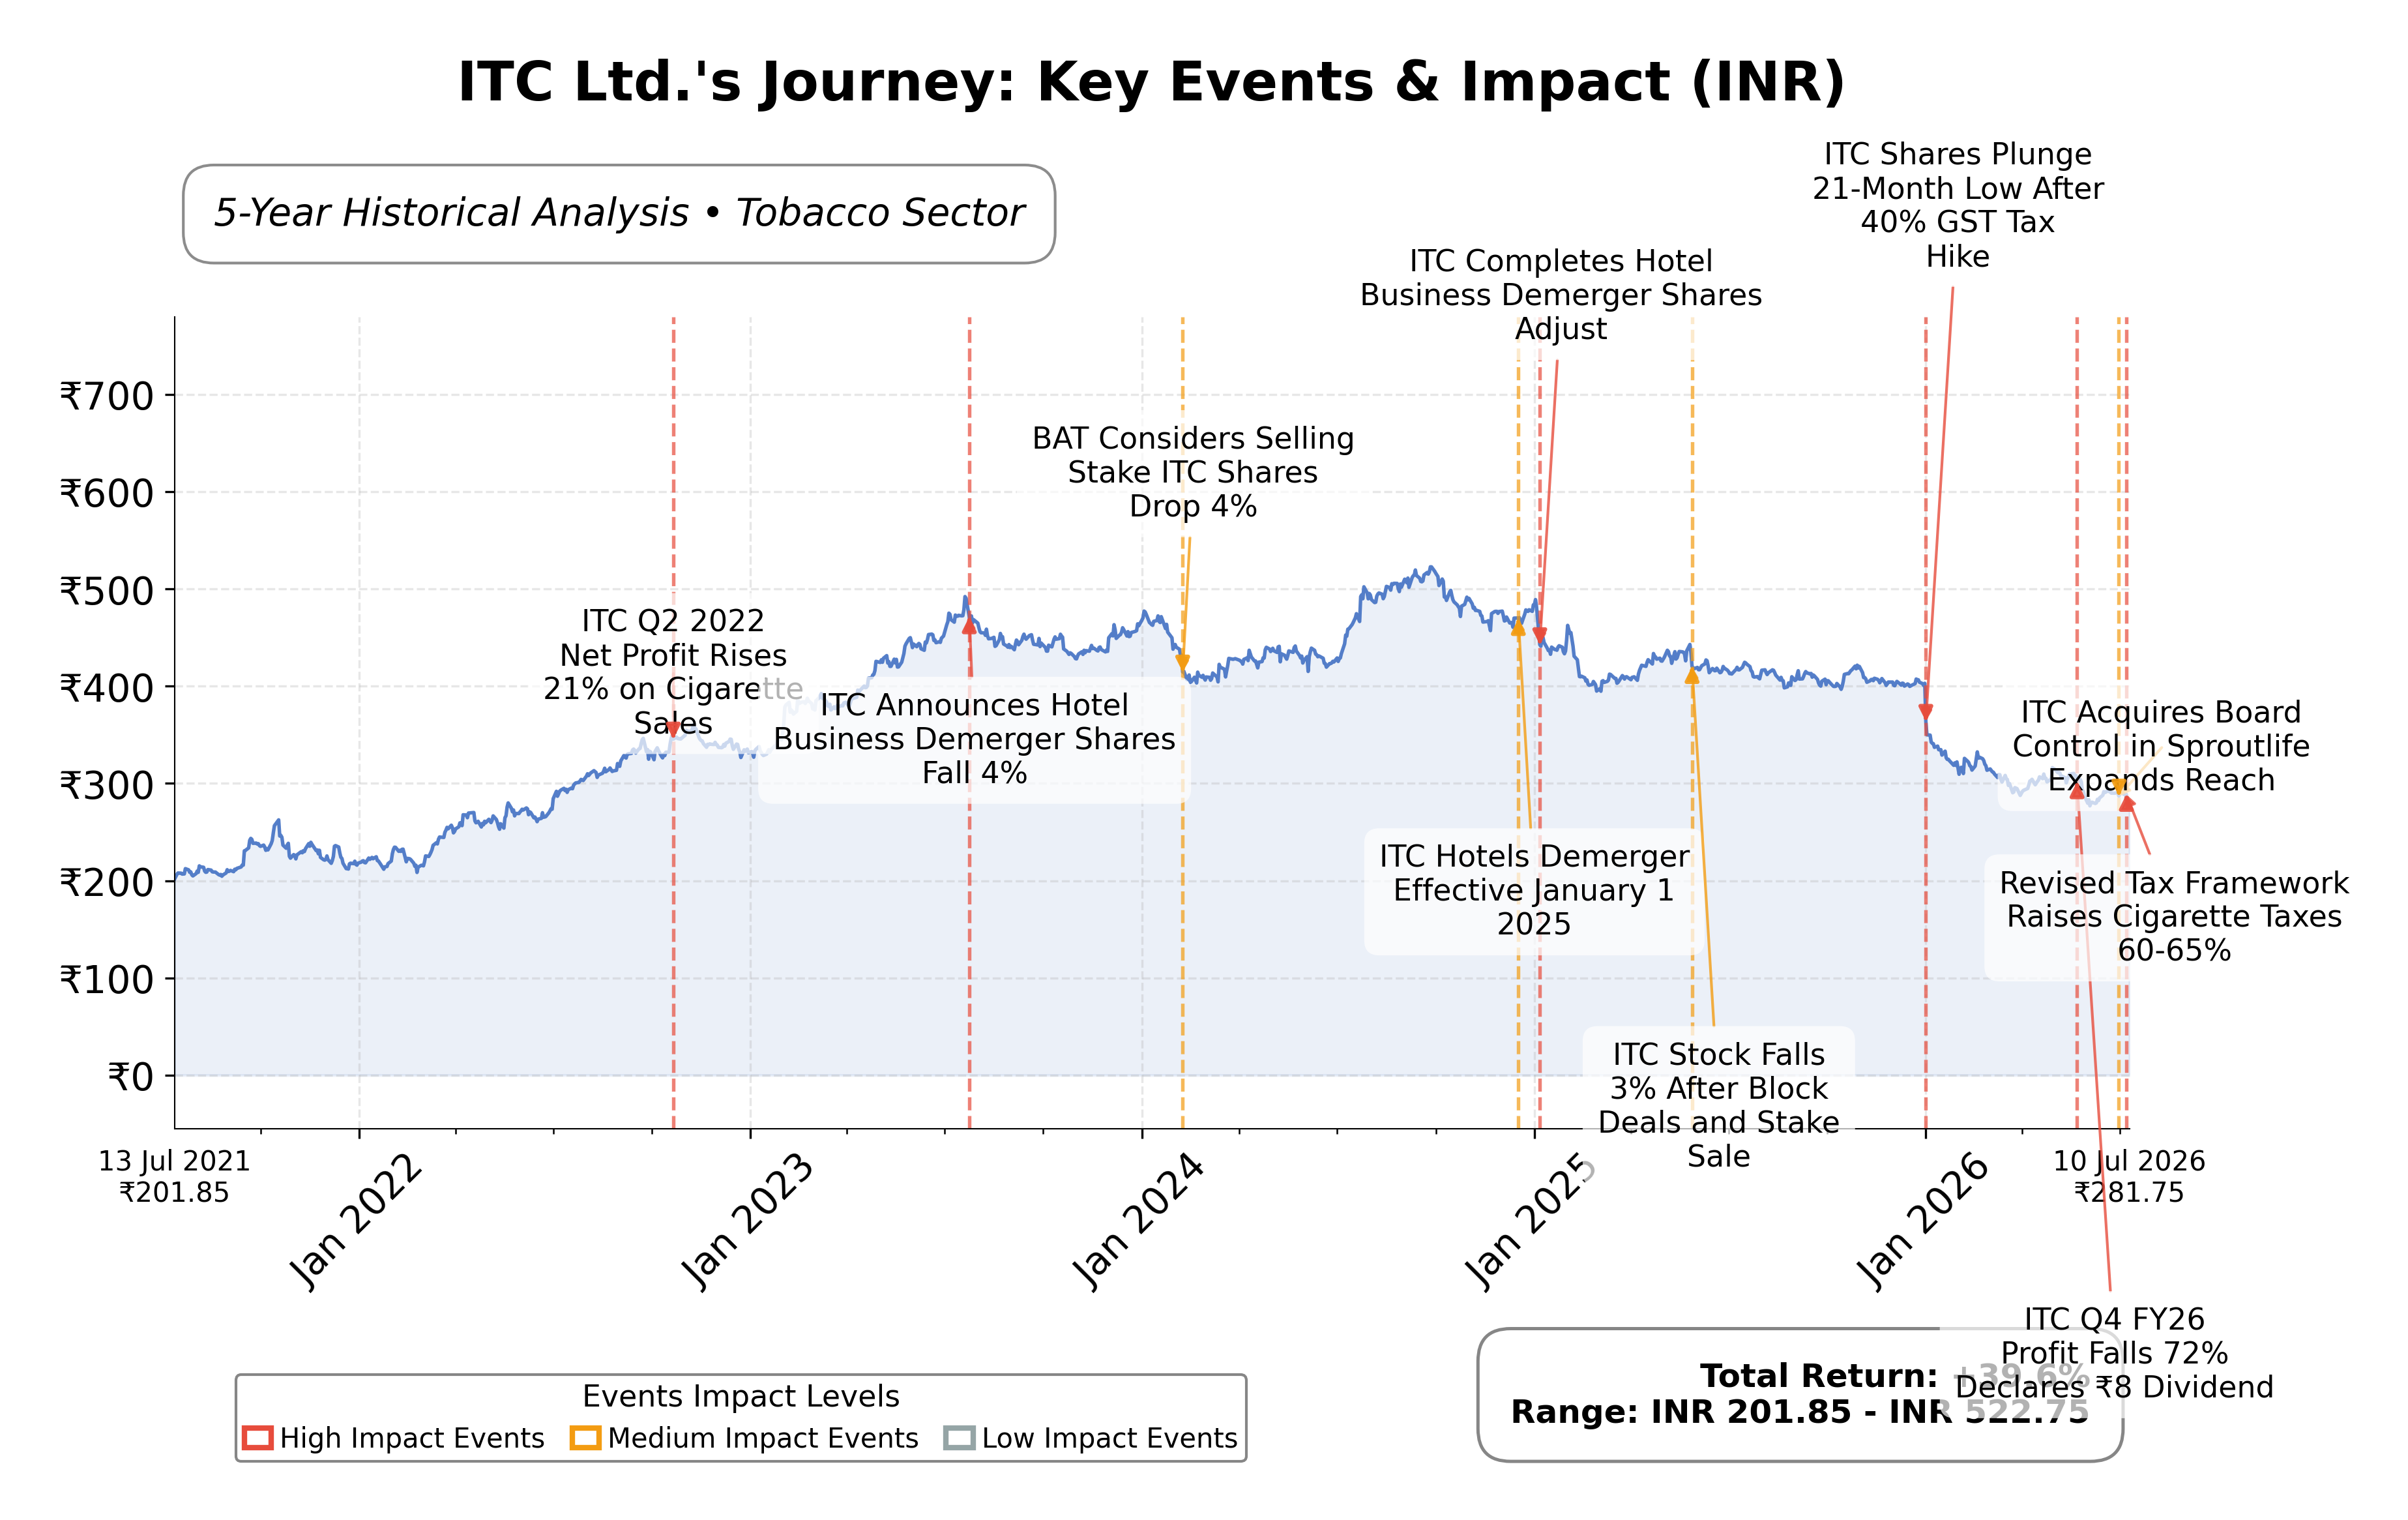
Stock Journey
Key Positives and Key Risks
Pros
- Strong profitability with a net profit margin of 26.23% and return on equity of 29.34%, indicating efficient capital use and earnings generation.
- Robust cash flow with operating cash flow of ₹184.64 billion and free cash flow of ₹131.31 billion supports dividend payouts and financial stability.
- Low debt levels reflected in a total debt to equity ratio of 0.03, enhancing financial flexibility and reducing risk.
Cons
- Recent quarterly revenue growth declined by 5%, signaling potential short-term sales challenges.
- Stock trading near 52-week low of ₹275.05 with downside risk of approximately 52.7% from the 52-week high, indicating price volatility.
- Regulatory risks in the tobacco segment and competitive pressures in FMCG could impact future profitability.
Disclosure: This information is for general awareness and does not constitute investment advice
Report Summary
ITC Ltd. is a prominent Indian diversified conglomerate listed on the NSE, operating primarily in the Consumer Defensive sector with a focus on tobacco products, fast-moving consumer goods (FMCG), paperboards, packaging, agri-business, and information technology services. The company holds a strong market position in India, leveraging its multi-business model that integrates branded packaged foods, personal care, cigarettes, and other consumer products alongside upstream businesses such as paper and packaging. ITC’s broad portfolio serves both retail consumers and industrial customers, supported by its extensive domestic presence and selective international operations.
Financially, ITC reported trailing twelve months (TTM) revenue of approximately ₹788.68 billion with a gross margin of 67.34%, operating margin of 36.41%, and net profit margin of 26.23%, indicating robust profitability and operational efficiency. The company’s return on equity (ROE) stands at 29.34%, and return on assets (ROA) at 17.59%, reflecting effective capital utilization and asset management. Its return on invested capital (ROIC) is supported by strong cash flows, with operating cash flow of ₹184.64 billion and free cash flow of ₹131.31 billion, underscoring solid financial health.
Valuation metrics show ITC trading at a trailing P/E ratio of 17.08 and a forward P/E of 16.05, with a price-to-book ratio of 4.89 and an EV/EBITDA multiple of 12.20. The market capitalization is approximately ₹3.53 trillion. The stock price currently stands near ₹279.90, closer to its 52-week low of ₹275.05 than the high of ₹427, indicating a downside risk of about 52-week high minus current price divided by current price equals approximately 52.7%. The valuation multiples suggest the stock is priced moderately relative to its fundamentals and industry peers.
ITC’s strengths include a diversified business model with strong cash generation, low debt levels (total debt to equity ratio of 0.03), and leadership in the tobacco and FMCG sectors. Key risks involve regulatory challenges related to tobacco products, competitive pressures in FMCG, and macroeconomic factors impacting consumer spending. Recent strategic actions include the amalgamation of Sresta Natural Bioproducts and Wimco Limited, enhancing segment capabilities, and continued emphasis on sustainability and digital transformation under the leadership of Chairman and MD Sanjiv Puri.
Technically, the stock is trading below its 200-day moving average (₹338.17) and near the 50-day moving average (₹294.19), with momentum indicators showing mixed signals. Recent news reflects a neutral to slightly positive sentiment with stable earnings growth and institutional interest, suggesting a cautious stance. Overall, the data indicates a balanced environment where market participants may consider monitoring developments closely without immediate directional bias.
Company and Industry Overview
Company Basics
Price Performance
Company Size
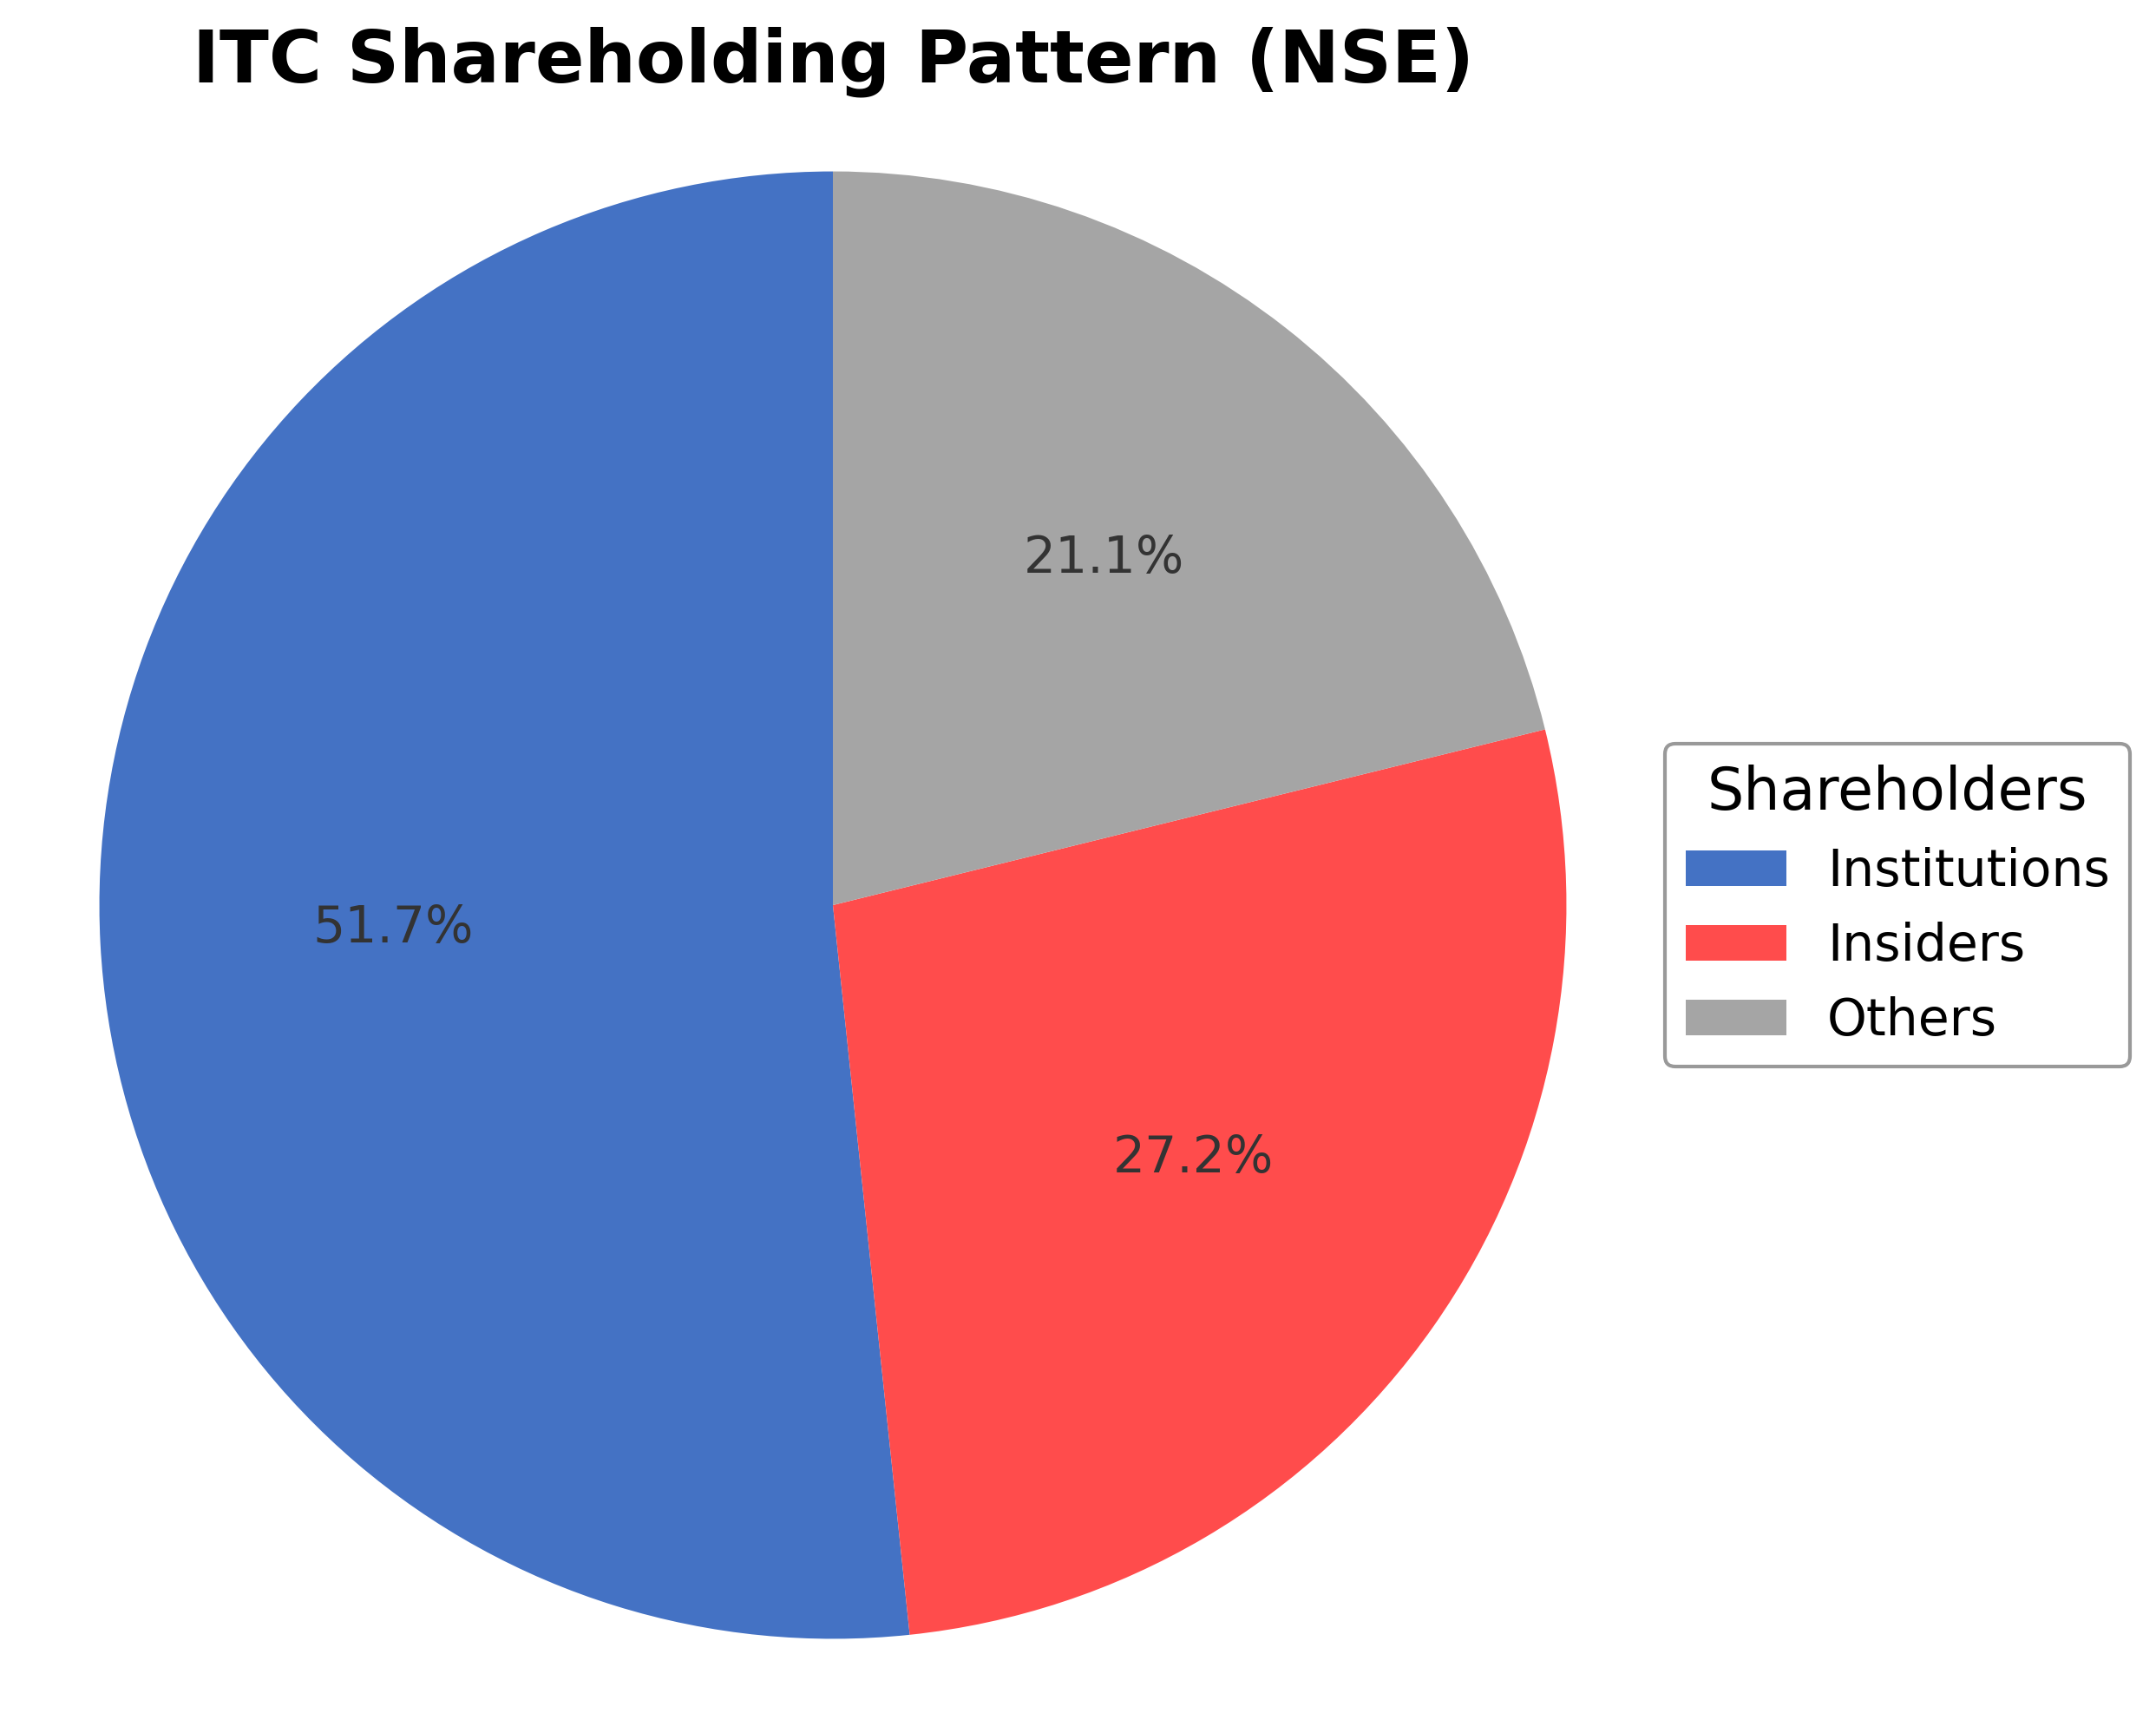
Shareholding Pattern
Sector and Industry Analysis
The global Isothermal Titration Calorimetry (ITC) market is valued at approximately USD 1.25 billion in 2024 and is projected to grow to USD 2.15 billion by 2033, reflecting a compound annual growth rate (CAGR) of 7.5%. This sector serves primarily the life sciences, pharmaceutical, and biotechnology industries by providing critical thermodynamic data for molecular interaction analysis. Leading companies such as Malvern Panalytical, TA Instruments, and MicroCal dominate the market, leveraging strong R&D capabilities and extensive distribution networks.
Key industry trends include advances in automation, miniaturization, and sensitivity enhancements that broaden ITC’s applicability across research and industrial settings. The rise of biologics and personalized medicine has increased demand for detailed molecular interaction data, intensifying competition among established players and encouraging new entrants to develop more affordable and user-friendly systems. Barriers to entry remain high due to the need for proprietary technology, intellectual property control, and specialized calibration standards, although emerging biotech firms and academic institutions are beginning to challenge incumbents through innovation and collaborative research.
Regulatory agencies such as the FDA and EMA are increasingly requiring comprehensive biophysical profiling for biologic approvals, which elevates the importance of ITC data accuracy and reproducibility. These evolving regulatory frameworks drive demand for higher instrument calibration and validation standards, fostering market growth. Additionally, the globalization of biopharmaceutical R&D, particularly in emerging markets, is expanding ITC adoption, supported by government incentives and investments in biotech infrastructure, shaping a positive outlook for the sector.
Note: Analysis synthesized from industry research, market reports, and regulatory filings. Information is subject to change based on market conditions.
Financial Ratios Dashboard
Illustrative Scenario Analysis
DCF Assumptions:
Method: Two-Stage EPS-Priority Model
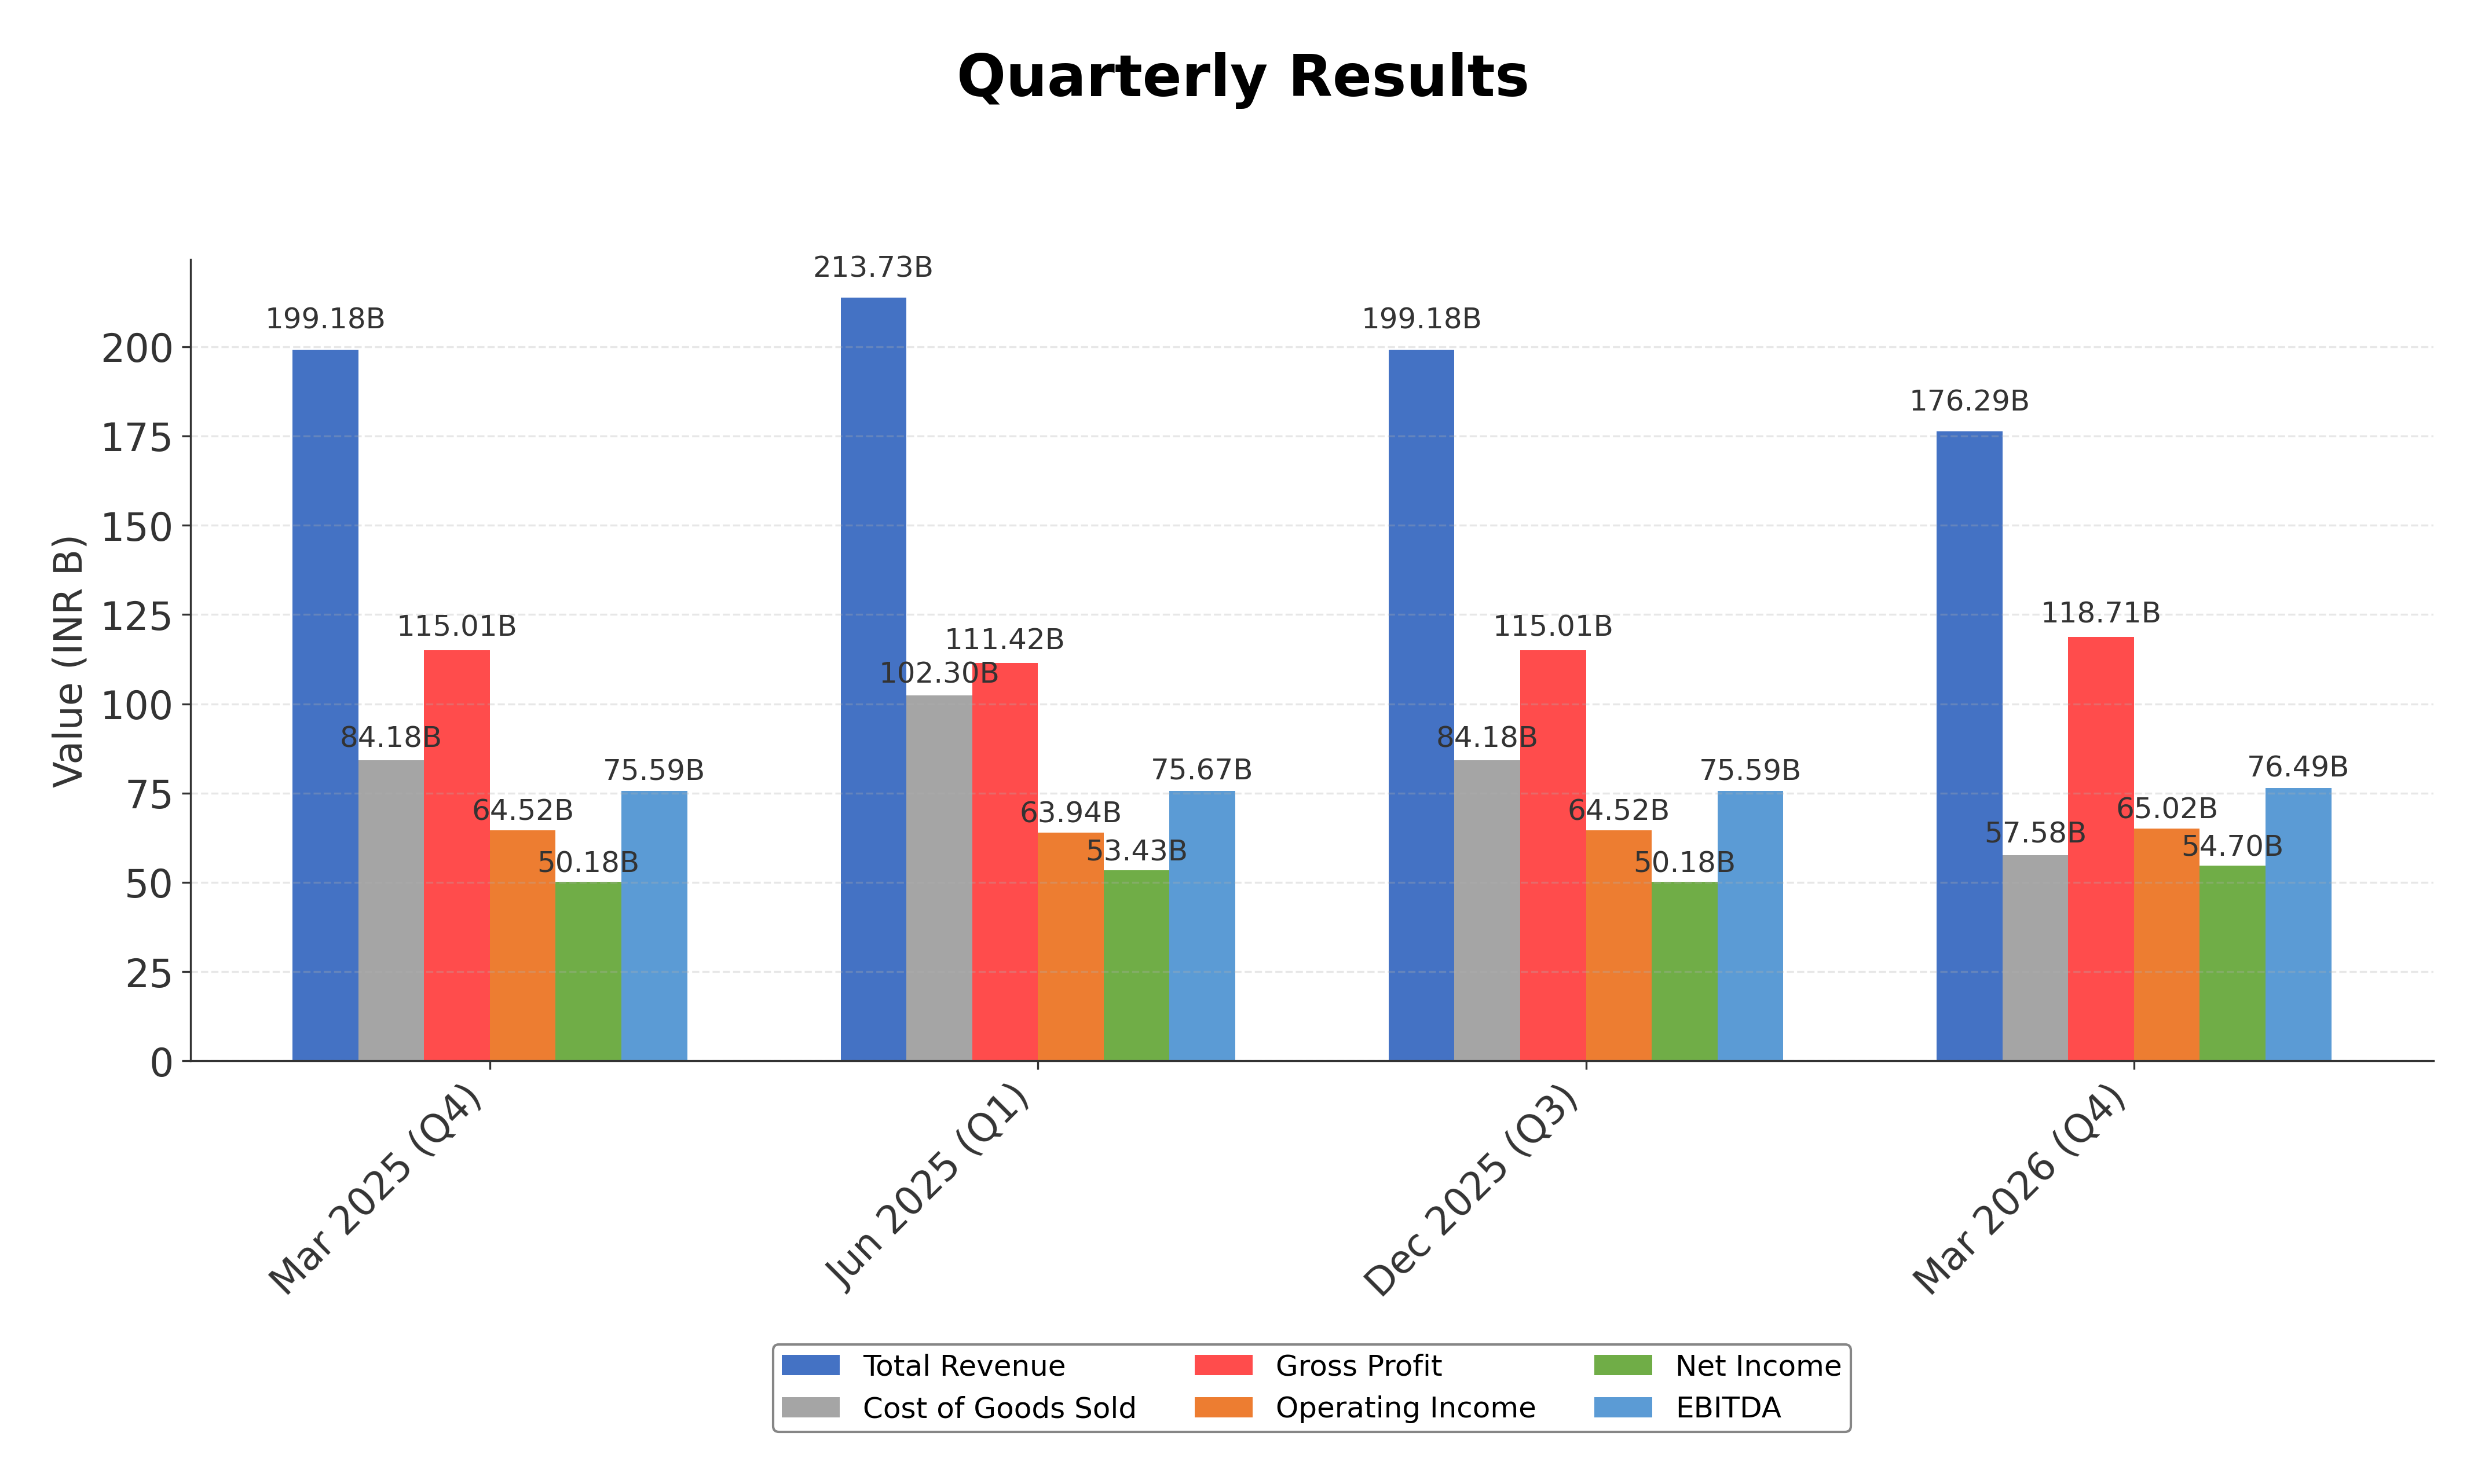
Financials
Peer Analysis
| Company Name | Market Cap | P/E Ratio | P/B Ratio | EV/EBITDA | Price to CFO |
|---|---|---|---|---|---|
| ITC Ltd. | ₹3.53T | 17.08 | 4.89 | 12.2 | 19.12 |
| Godfrey Phillips India Ltd. | ₹329.95B | 21.49 | 5.28 | 20.47 | 63.68 |
| VST Industries Ltd. | ₹40.87B | 14.45 | 3.33 | 8.09 | 18.72 |
| Hindustan Unilever Ltd. | ₹5.05T | 47.41 | 10.39 | 34.26 | 45.94 |
| Nestle India Ltd. | ₹2.81T | 80.71 | 54.71 | 54.51 | 55.59 |
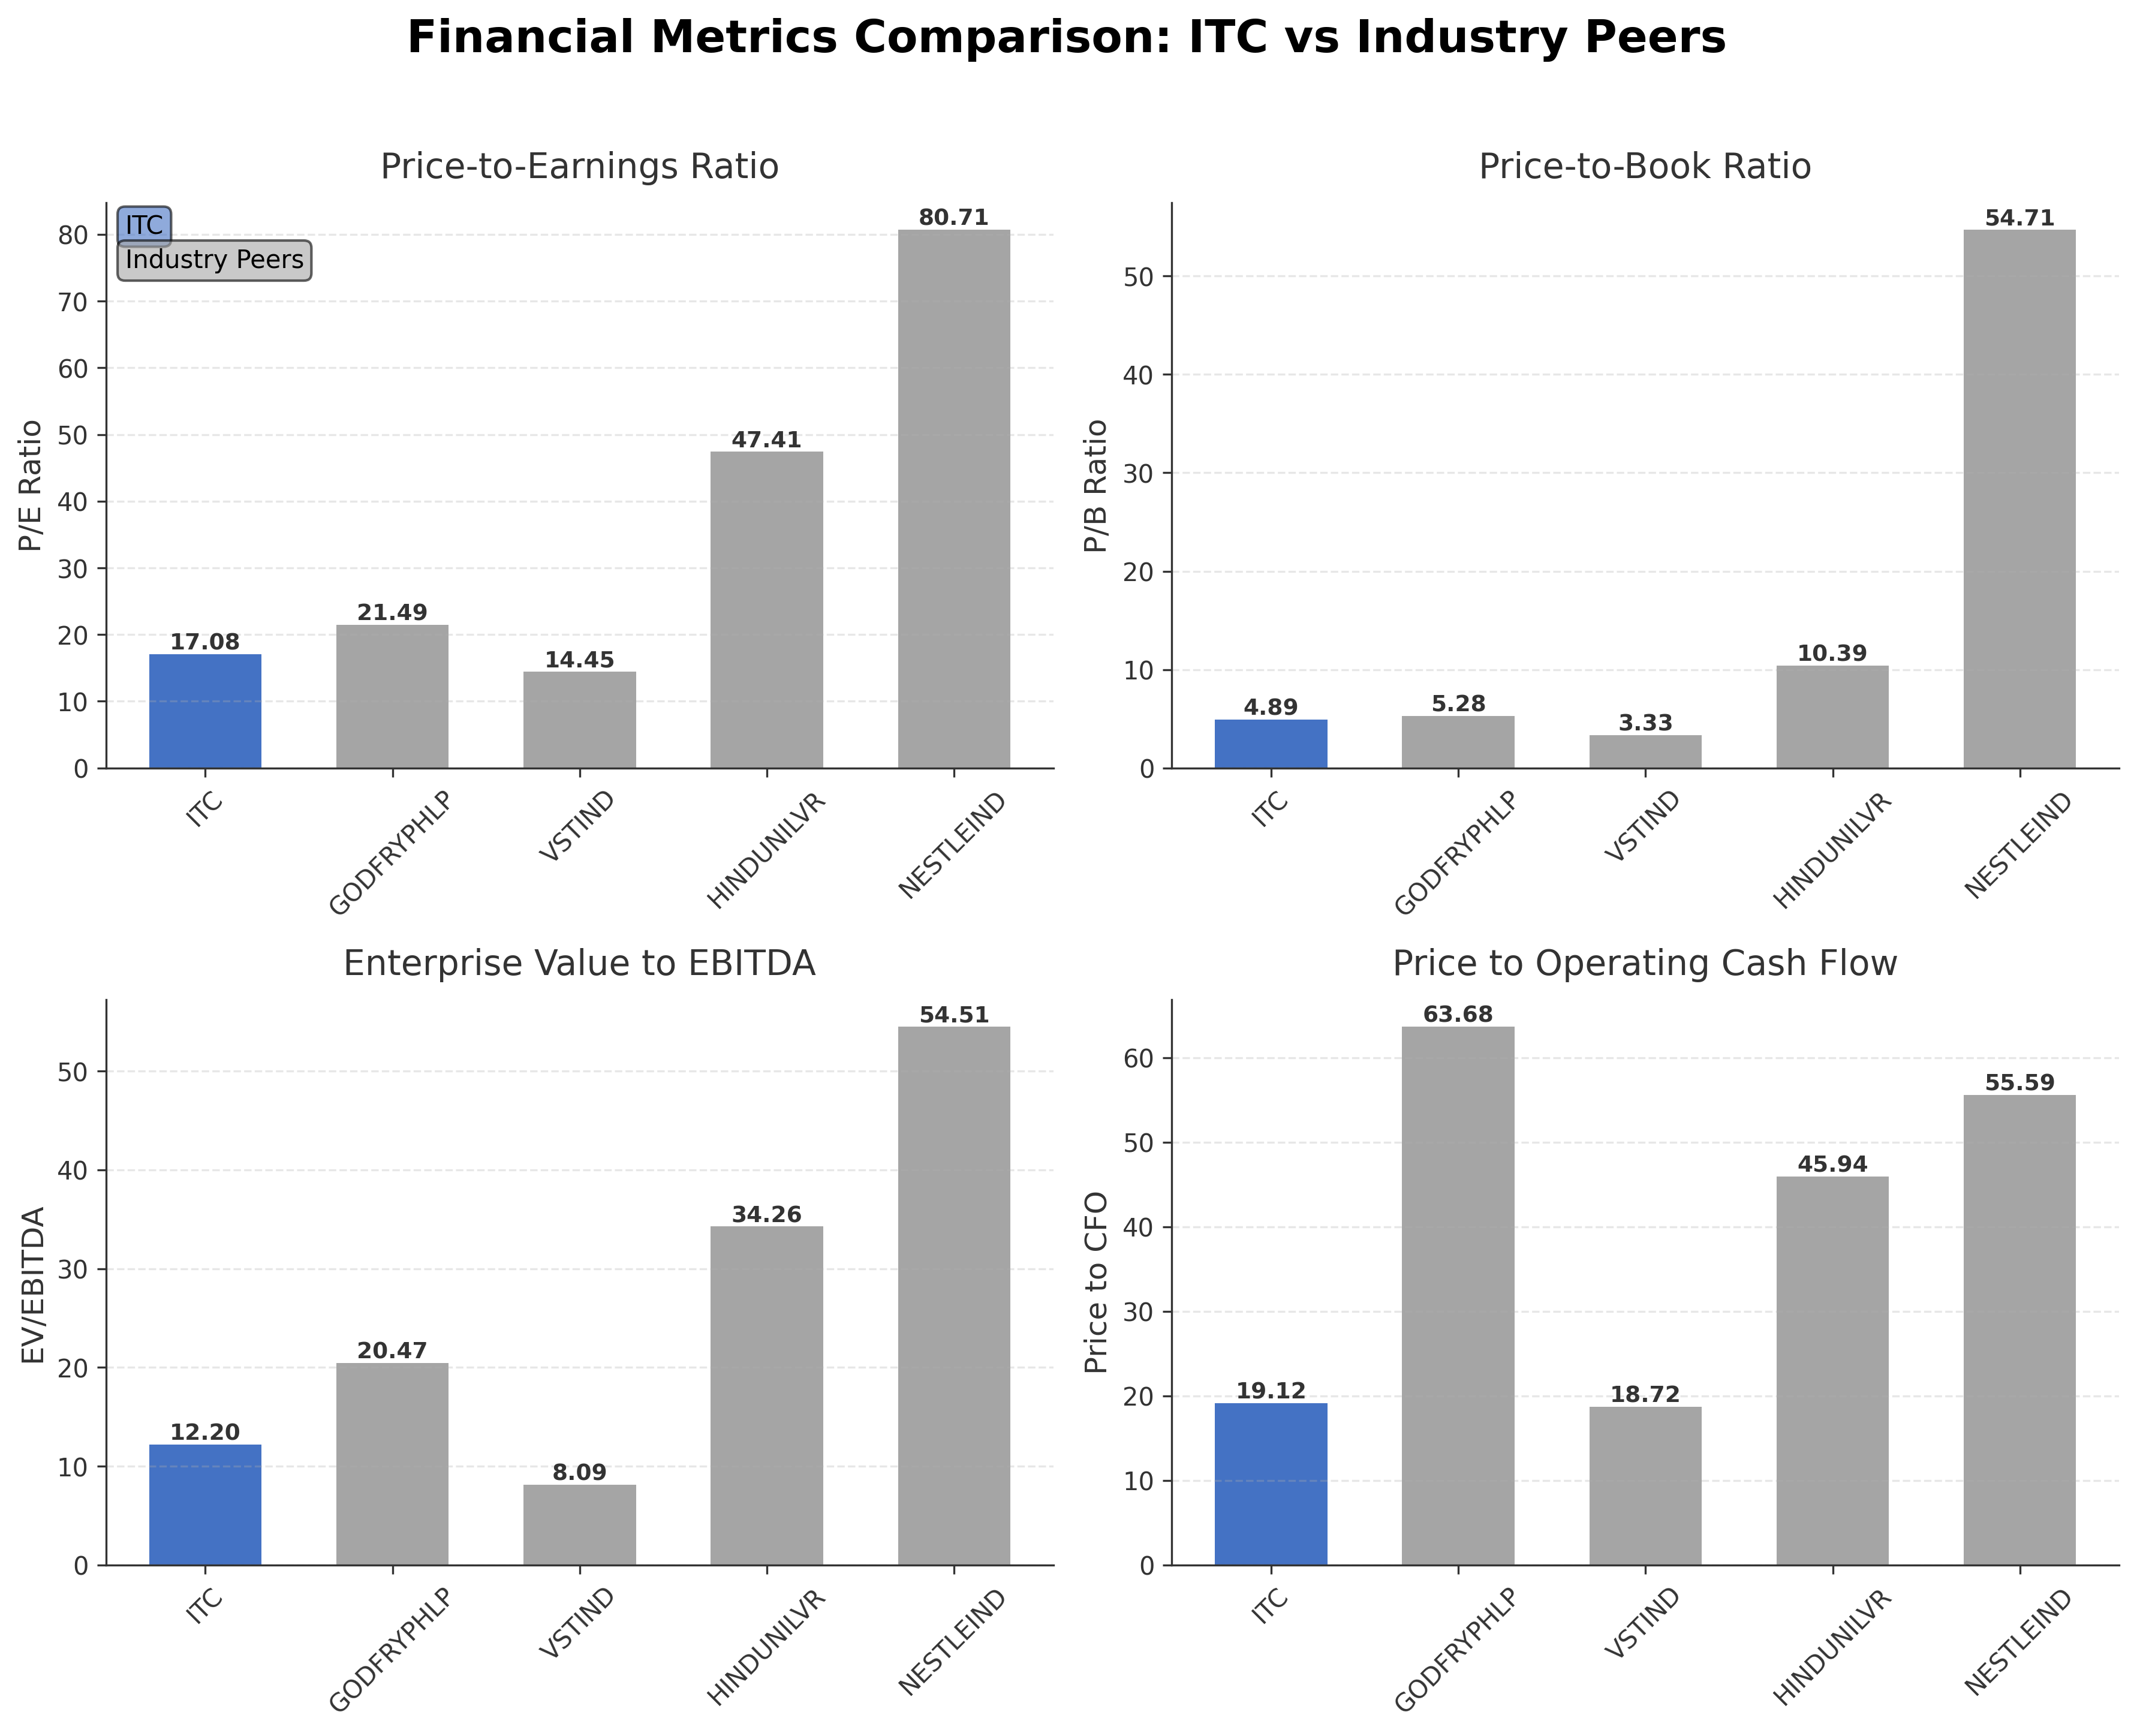
Comparison Analysis: ITC Ltd. presents a moderate valuation profile compared to its peers in the tobacco and consumer goods industry, with a trailing P/E of 17.08 and EV/EBITDA of 12.20, which are lower than premium peers such as Hindustan Unilever and Nestle India but higher than smaller tobacco companies like VST Industries. ITC's return on equity at 29.34% is robust, surpassing most peers except Nestle India, which exhibits an exceptionally high ROE. The price-to-cash flow ratio of 19.12 indicates reasonable cash flow valuation relative to peers. Overall, ITC balances scale, profitability, and valuation metrics effectively within its competitive set.
Financial Metrics Comparison with Peers
Financial Statements
Comprehensive financial data including income, balance sheet, and cash flow metrics
Income Statement
| fiscal_date | 2026-03-31 | 2025-03-31 | 2024-03-31 | 2023-03-31 | 2022-03-31 |
|---|---|---|---|---|---|
| Sales | 782.13B | 746.53B | 703.15B | 702.45B | 600.81B |
| Cost Of Goods | 330.01B | 323.76B | 277.00B | 294.61B | 267.46B |
| Gross Profit | 452.12B | 422.77B | 426.15B | 407.85B | 333.35B |
| Operating Expense Selling General And Administrative | 47.66B | 42.29B | 24.89B | 21.45B | 17.66B |
| Operating Expense Other Operating Expenses | 66.71B | 64.02B | 77.75B | 74.18B | 62.24B |
| Operating Income | 255.96B | 241.93B | 244.18B | 238.97B | 188.95B |
| Non Operating Interest Income | 14.62B | 14.89B | 17.11B | 15.34B | 10.83B |
| Non Operating Interest Expense | 851.70M | 450.60M | 459.60M | 432.00M | 393.60M |
| Pretax Income | 280.33B | 269.27B | 271.40B | 259.15B | 207.40B |
| Income Tax | 70.15B | 68.90B | 63.89B | 64.38B | 52.37B |
| Net Income | 210.18B | 350.52B | 207.51B | 194.77B | 155.03B |
| Eps Basic | 16.52 | 27.79 | 16.42 | 15.50 | 12.37 |
| Eps Diluted | 16.51 | 27.75 | 16.38 | 15.46 | 12.37 |
| Basic Shares Outstanding | 12.52B | 12.50B | 12.46B | 12.38B | 12.32B |
| Diluted Shares Outstanding | 12.52B | 12.50B | 12.46B | 12.38B | 12.32B |
| Ebit | 281.19B | 269.72B | 271.86B | 259.58B | 207.80B |
| Ebitda | 294.28B | 278.98B | 281.13B | 274.44B | 218.91B |
| Net Income Continuous Operations | 280.33B | 425.82B | 271.40B | 259.15B | 207.40B |
| Minority Interests | -3.29B | -3.06B | -2.93B | -2.85B | -2.60B |
| Preferred Stock Dividends | 0.00 | 0.00 | 0.00 | 0.00 | 0.00 |
| Operating Expense Research And Development | N/A | N/A | 2.42B | 2.05B | 1.99B |
Data provided by Twelve Data
Balance Sheet
| fiscal_date | 2026-03-31 | 2025-03-31 | 2024-03-31 | 2023-03-31 | 2022-03-31 |
|---|---|---|---|---|---|
| Cash And Cash Equivalents | 6.43B | 6.20B | 6.26B | 4.63B | 2.71B |
| Accounts Receivable | 39.23B | 47.20B | 40.26B | 29.56B | 24.62B |
| Total Assets | 937.92B | 880.91B | 918.26B | 858.83B | 772.60B |
| Total Liabilities | 209.19B | 176.93B | 169.36B | 163.44B | 144.38B |
| Long Term Debt | 2.01B | 1.37B | 2.32B | 2.17B | 1.99B |
| Shareholders Equity | 728.73B | 703.98B | 748.90B | 695.39B | 628.22B |
Data provided by Twelve Data
Cash Flow Statement
| fiscal_date | 2026-03-31 | 2025-03-31 | 2024-03-31 | 2023-03-31 | 2022-03-31 |
|---|---|---|---|---|---|
| Operating Activities Net Income | 280.33B | 425.82B | 271.40B | 259.15B | 207.40B |
| Operating Activities Stock Based Compensation | 1.28B | 1.34B | 1.07B | 604.10M | 331.70M |
| Operating Activities Other Non Cash Items | -13.77B | -14.60B | -16.65B | -14.91B | -10.43B |
| Operating Activities Accounts Receivable | 4.68B | -10.23B | -9.34B | -8.84B | -7.32B |
| Operating Activities Other Assets Liabilities | -33.06B | -29.75B | -25.45B | -10.98B | -4.66B |
| Operating Activities Operating Cash Flow | 239.46B | 372.57B | 221.04B | 225.03B | 185.32B |
| Investing Activities Capital Expenditures | -21.32B | -21.03B | -34.55B | -26.94B | -20.09B |
| Investing Activities Net Acquisitions | -4.63B | -2.79B | -650.40M | -96.30M | -731.20M |
| Investing Activities Purchase Of Investments | -713.91B | -738.30B | -797.19B | -933.57B | -773.19B |
| Investing Activities Sale Of Investments | 706.99B | 747.42B | 836.30B | 889.85B | 761.17B |
| Investing Activities Investing Cash Flow | -32.87B | -14.70B | 3.90B | -71.39B | -32.83B |
| Financing Activities Long Term Debt Issuance | 600.00M | 0.00 | N/A | N/A | N/A |
| Financing Activities Long Term Debt Payments | -1.05B | -540.20M | -15.70M | -7.30M | -3.50M |
| Financing Activities Short Term Debt Issuance | 19.64B | 370.00M | 80.00M | 0.00 | N/A |
| Financing Activities Common Stock Issuance | 4.05B | 7.97B | 14.43B | 24.77B | 2.92B |
| Financing Activities Common Dividends | -182.71B | -177.82B | -198.99B | -154.18B | -137.88B |
| Financing Activities Other Financing Charges | -1.46B | 275.40M | 121.20M | 353.70M | 149.20M |
| Financing Activities Financing Cash Flow | -160.94B | -169.74B | -184.38B | -129.06B | -134.82B |
| End Cash Position | 6.19B | 6.22B | 5.97B | 4.06B | 2.67B |
| Free Cash Flow | 162.81B | 153.48B | 136.16B | 161.35B | 136.34B |
| Investing Activities Other Investing Activity | N/A | N/A | N/A | -637.50M | N/A |
Data provided by Twelve Data
Technical Analysis
Key Insights
- ITC Ltd. is currently trading in a downtrend, with price action below the 200-day moving average at ₹338.17 and near the 50-day moving average at ₹294.19, indicating recent weakness in momentum.
- Key support levels are identified near ₹275, the 52-week low, while resistance is observed around ₹300 and further at the 200-day moving average near ₹338.
- The stock is positioned below the 200-day MA, slightly below the 50-day MA, and above the 10-day moving average, suggesting short-term consolidation within a longer-term bearish context.
- Momentum indicators such as RSI are near neutral levels, MACD shows a bearish crossover, and Stochastic oscillators suggest limited upward momentum currently.
- Across daily, weekly, and monthly timeframes, the trend remains predominantly bearish with occasional short-term rebounds, reflecting cautious investor sentiment.
- Potential market scenarios include continued consolidation near current support levels or a test of resistance at the 50-day and 200-day moving averages, with momentum indicators guiding near-term price action.
Trending News
1. Headline: ITC Share Price Live Updates: ITC's Price Analysis - The Economic Times
Summary: Welcome to the ITC Stock Liveblog, your go-to platform for real-time updates and analysis on a top-performing stock. Stay ahead of the market with our in-depth coverage of ITC, including: Last traded price 279.65, Market capitalization: 350699.82, Volume: 12559492, Price-to-earnings ratio 16.94, ...
Sentiment: neutral
2. Headline: Stocks in news: Stocks in news: DMart, HCL Tech, ICICI Pru AMC, Dr Reddy’s, NTPC, IndiGo - The Economic Times
Summary: Markets saw a strong rebound on Friday, driven by global cues and IT earnings. HCL Tech and ICICI Pru AMC will announce their first quarter results today. DMart reported an 11.3% rise in net profit, while Tata Motors launched a new edition. Dr Reddy's faces supply issues, and IndiGo received ...
Sentiment: positive
3. Headline: Buy ITC Put Option - The HinduBusinessLine
Summary: Explore a bearish strategy on ITC by buying July 280 put options, targeting profits as the stock declines.
Sentiment: negative
Summary: ITC Share Price: Find the latest news on ITC Stock Price. Get all the information on ITC with historic price charts for NSE / BSE. Experts & Broker view also get the ITC Ltd. buy/sell tips detailed news, announcements, Forecasts, Analysts, Valuation, Earning forecasts, Estimates, Recommendations, ...
Sentiment: neutral
5. Headline: INTC Stock - Intel Stock Price, Rating and News - NASDAQ: INTC | Morningstar
Summary: See the latest Intel stock price NASDAQ: INTC stock rating, related news, valuation, dividends and more to help you make your investing decisions.
Sentiment: neutral
Powered by Brave
Recent Updates
News Summary
As of 21 May 2026. ITC Ltd. reported audited standalone and consolidated financial results for the fiscal year ended March 31, 2026, with unmodified auditor opinions. The company recommended a final dividend of ₹8 per share, totaling ₹14.50 for FY26, reflecting strong cash generation. Standalone revenue rose to ₹84,927 crore from ₹77,693 crore year-over-year, while standalone net profit increased to ₹20,286 crore from ₹19,561 crore. Consolidated revenue and net profit also showed growth, reaching ₹92,339 crore and ₹21,018 crore respectively. The amalgamation of Sresta Natural Bioproducts and Wimco Limited was completed, impacting segment comparability. Leadership under Chairman and MD Sanjiv Puri continues to focus on sustainability, digital transformation, and operational agility. The company maintains a diversified portfolio spanning cigarettes, packaged foods, personal care, paperboards, packaging, agri-trading, and hotels, supporting a broad consumer and industrial base.
News Sentiment
The overall sentiment from recent updates is predominantly positive, driven by steady revenue and profit growth, successful strategic amalgamations, and consistent dividend payouts. Institutional interest, exemplified by increased stakes from funds like Parag Parikh Flexi Cap, further supports this tone. Neutral to positive market commentary and stable operational execution underpin confidence in ITC's diversified business model. However, some cautiousness is reflected in market option strategies anticipating potential near-term price corrections. The balanced sentiment suggests a stable outlook grounded in solid fundamentals and strategic initiatives.
Source List
- https://quartr.com/companies/itc-limited_10883
- https://www.alphaspread.com/security/nse/itc/investor-relations
- https://itcportal.com/investors/itc-report-and-accounts.html
Analytical Overview
Analysis Summary
ITC Ltd.'s valuation metrics, including a trailing P/E of 17.08 and forward P/E of 16.05, are slightly below the industry average P/E of 17.08, indicating reasonable pricing relative to earnings expectations. The PEG ratio of 1.93 suggests moderate growth expectations relative to valuation. Revenue growth shows a slight decline of 5% quarterly but an overall year-over-year increase in FY26 revenues, signaling a stable growth trajectory supported by strong cash flow generation with operating cash flow of ₹184.64 billion and free cash flow of ₹131.31 billion. The company's financial health is robust, with a low total debt to equity ratio of 0.03 and a strong current ratio of 3.04, reflecting ample liquidity and low leverage. Sector-specific challenges include regulatory pressures on tobacco products and competitive dynamics in FMCG, while opportunities arise from expanding branded product portfolios and digital transformation initiatives. Considering India-specific factors, ITC benefits from a large domestic consumer base, evolving regulatory frameworks, and increasing demand for packaged goods.
Overall Business and Market Assessment
Supporting Factors: No data
Risk Factors: regulatory changes affecting the tobacco segment and competitive pressures within FMCG
SWOT Analysis
Strengths
- ITC Ltd. has a diversified business model spanning tobacco, FMCG, paperboards, packaging, and agri-business.
- The company maintains strong profitability with a gross margin of 67.34% and net margin of 26.23%.
- Robust cash flow generation supports financial stability and dividend payouts.
- Low debt levels with a total debt to equity ratio of 0.03 enhance financial flexibility.
Weaknesses
- Recent quarterly revenue growth declined by 5%, indicating short-term sales pressure.
- High price-to-book ratio of 4.89 may reflect premium valuation relative to book value.
- Dependence on the tobacco segment exposes the company to regulatory risks.
- Operating margin at 36.41% leaves limited room for margin expansion.
Opportunities
- Expansion of branded packaged foods and personal care products can drive future growth.
- Digital transformation and IT services offer avenues for diversification.
- Strategic acquisitions like Sresta Natural Bioproducts enhance portfolio strength.
- Growing domestic consumer market supports demand for FMCG products.
Threats
- Stringent tobacco regulations and excise hikes may impact profitability.
- Intense competition in FMCG could pressure market share and margins.
- Macroeconomic factors such as inflation may affect consumer spending.
- Potential volatility in agricultural commodity prices could impact agri-business.
Company Description
ITC Ltd. is an Indian diversified conglomerate headquartered in Kolkata, operating as a multi-business enterprise across key sectors of the real economy. The company’s core activities span fast-moving consumer goods, including branded packaged foods, personal care, cigarettes, and other everyday consumer products, serving a broad base of retail customers and households in India and select international markets. ITC Ltd. is also a significant player in paperboards and specialty papers, supplying packaging and printing substrates to consumer goods, pharmaceuticals, and other industries. Its agri-business segment connects farmers with domestic and global demand, dealing in commodities and value-added agri products. In addition, ITC Ltd. provides information technology services through its subsidiary ITC Infotech, offering digital and technology solutions to enterprises across sectors. Founded in 1910 and headquartered in Kolkata, India, ITC Ltd. occupies an important position in India’s private sector as a large, integrated provider of consumer, packaging, agri, and IT services.