
IRB Infrastructure Developers Limited (IRB)
Stock Analysis Report
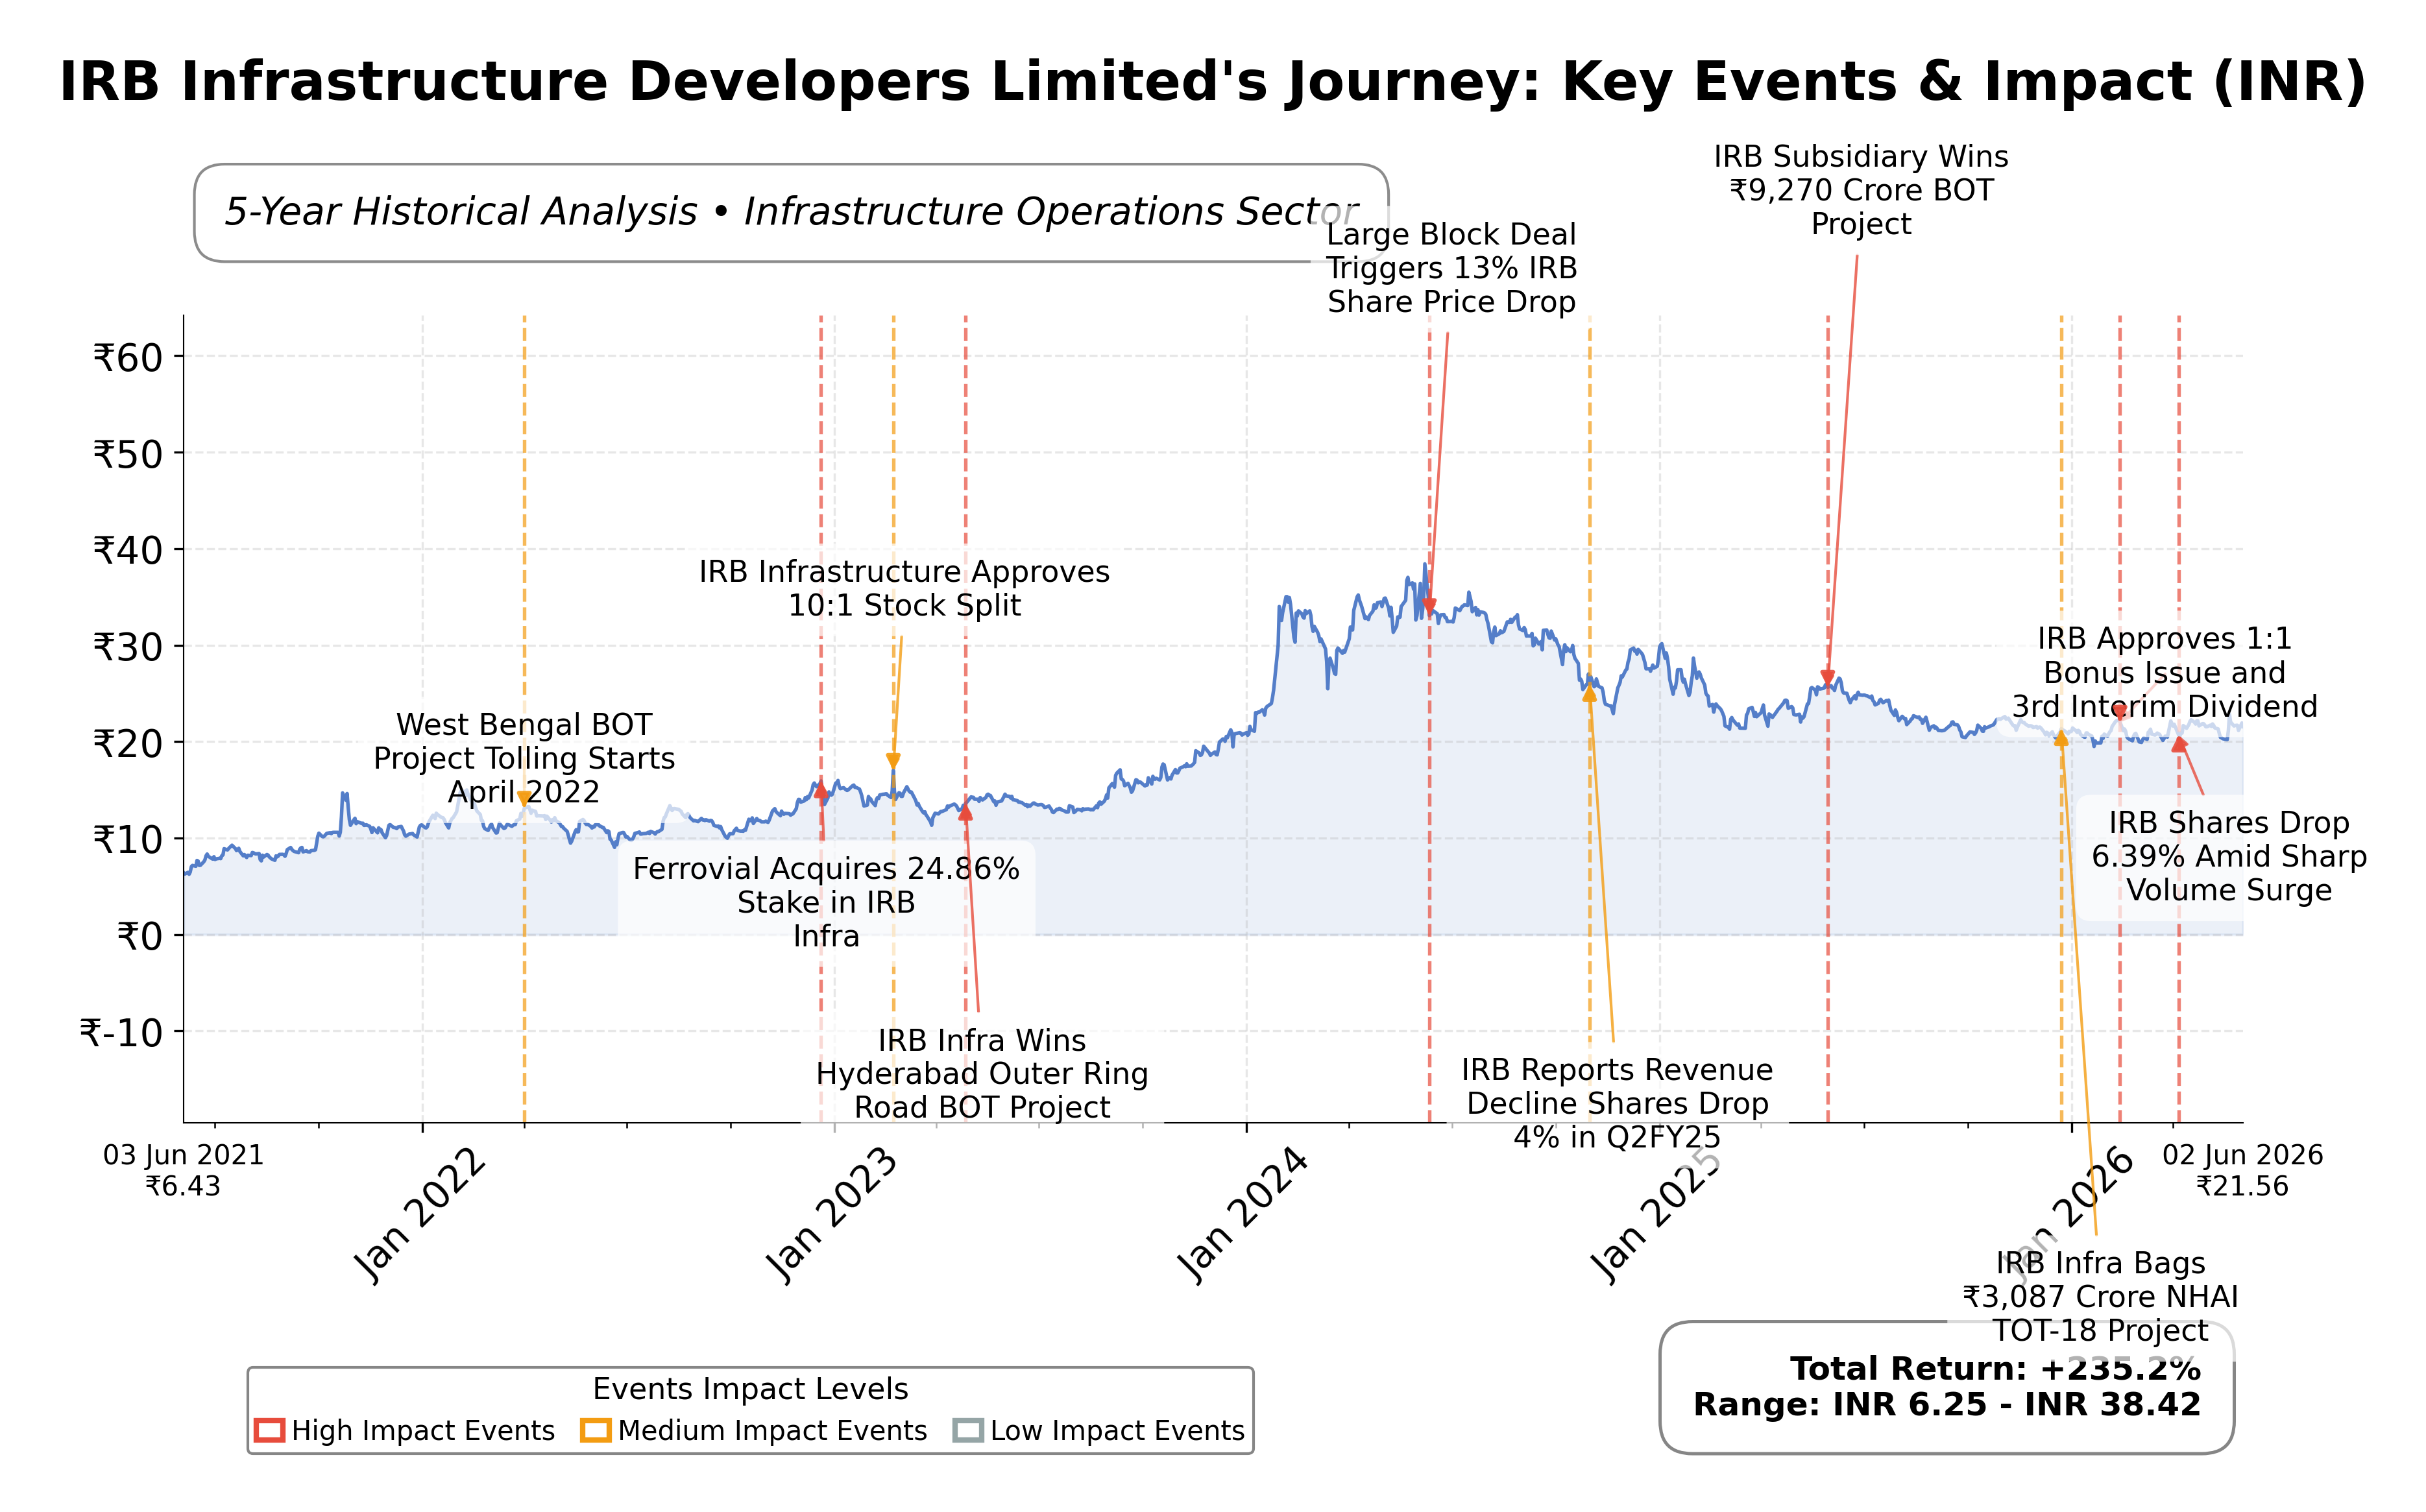
Stock Journey
Key Positives and Key Risks
Pros
- Operating cash flow of INR 20.98 billion demonstrates strong cash generation supporting operations.
- Robust order book of INR 385 billion provides revenue visibility and growth potential.
- Forward P/E of 18.12 indicates market expectations for earnings growth relative to current valuation.
Cons
- High debt-to-equity ratio of 95.6 reflects significant leverage and financial risk.
- Negative quarterly revenue growth of -17.2% signals recent challenges in top-line expansion.
- Return on equity of 4.17% is relatively low, indicating modest profitability.
Disclosure: This information is for general awareness and does not constitute investment advice
Report Summary
IRB Infrastructure Developers Limited is a leading Indian infrastructure company specializing in the construction, development, and management of road and highway projects. Operating primarily under the Public-Private Partnership (PPP) model, the company is listed on the NSE and belongs to the Industrials sector, with a focus on infrastructure operations. Its portfolio includes expressways, city roads, bridges, and flyovers, contributing significantly to India's transportation network and economic development. The company also has a presence in real estate development, leveraging its expertise in large-scale project execution.
Financially, IRB reported trailing twelve months (TTM) revenue of approximately INR 63.3 billion with a gross margin of 57.63%, operating margin of 23.65%, and net profit margin of 13.43%. The return on equity (ROE) stands at 4.17%, and return on assets (ROA) is 1.76%, indicating moderate profitability and asset utilization efficiency. The company’s operating cash flow for the TTM is INR 20.98 billion, with a levered free cash flow of INR 13.9 billion, reflecting solid cash generation capabilities despite a quarterly revenue decline of 17.2%.
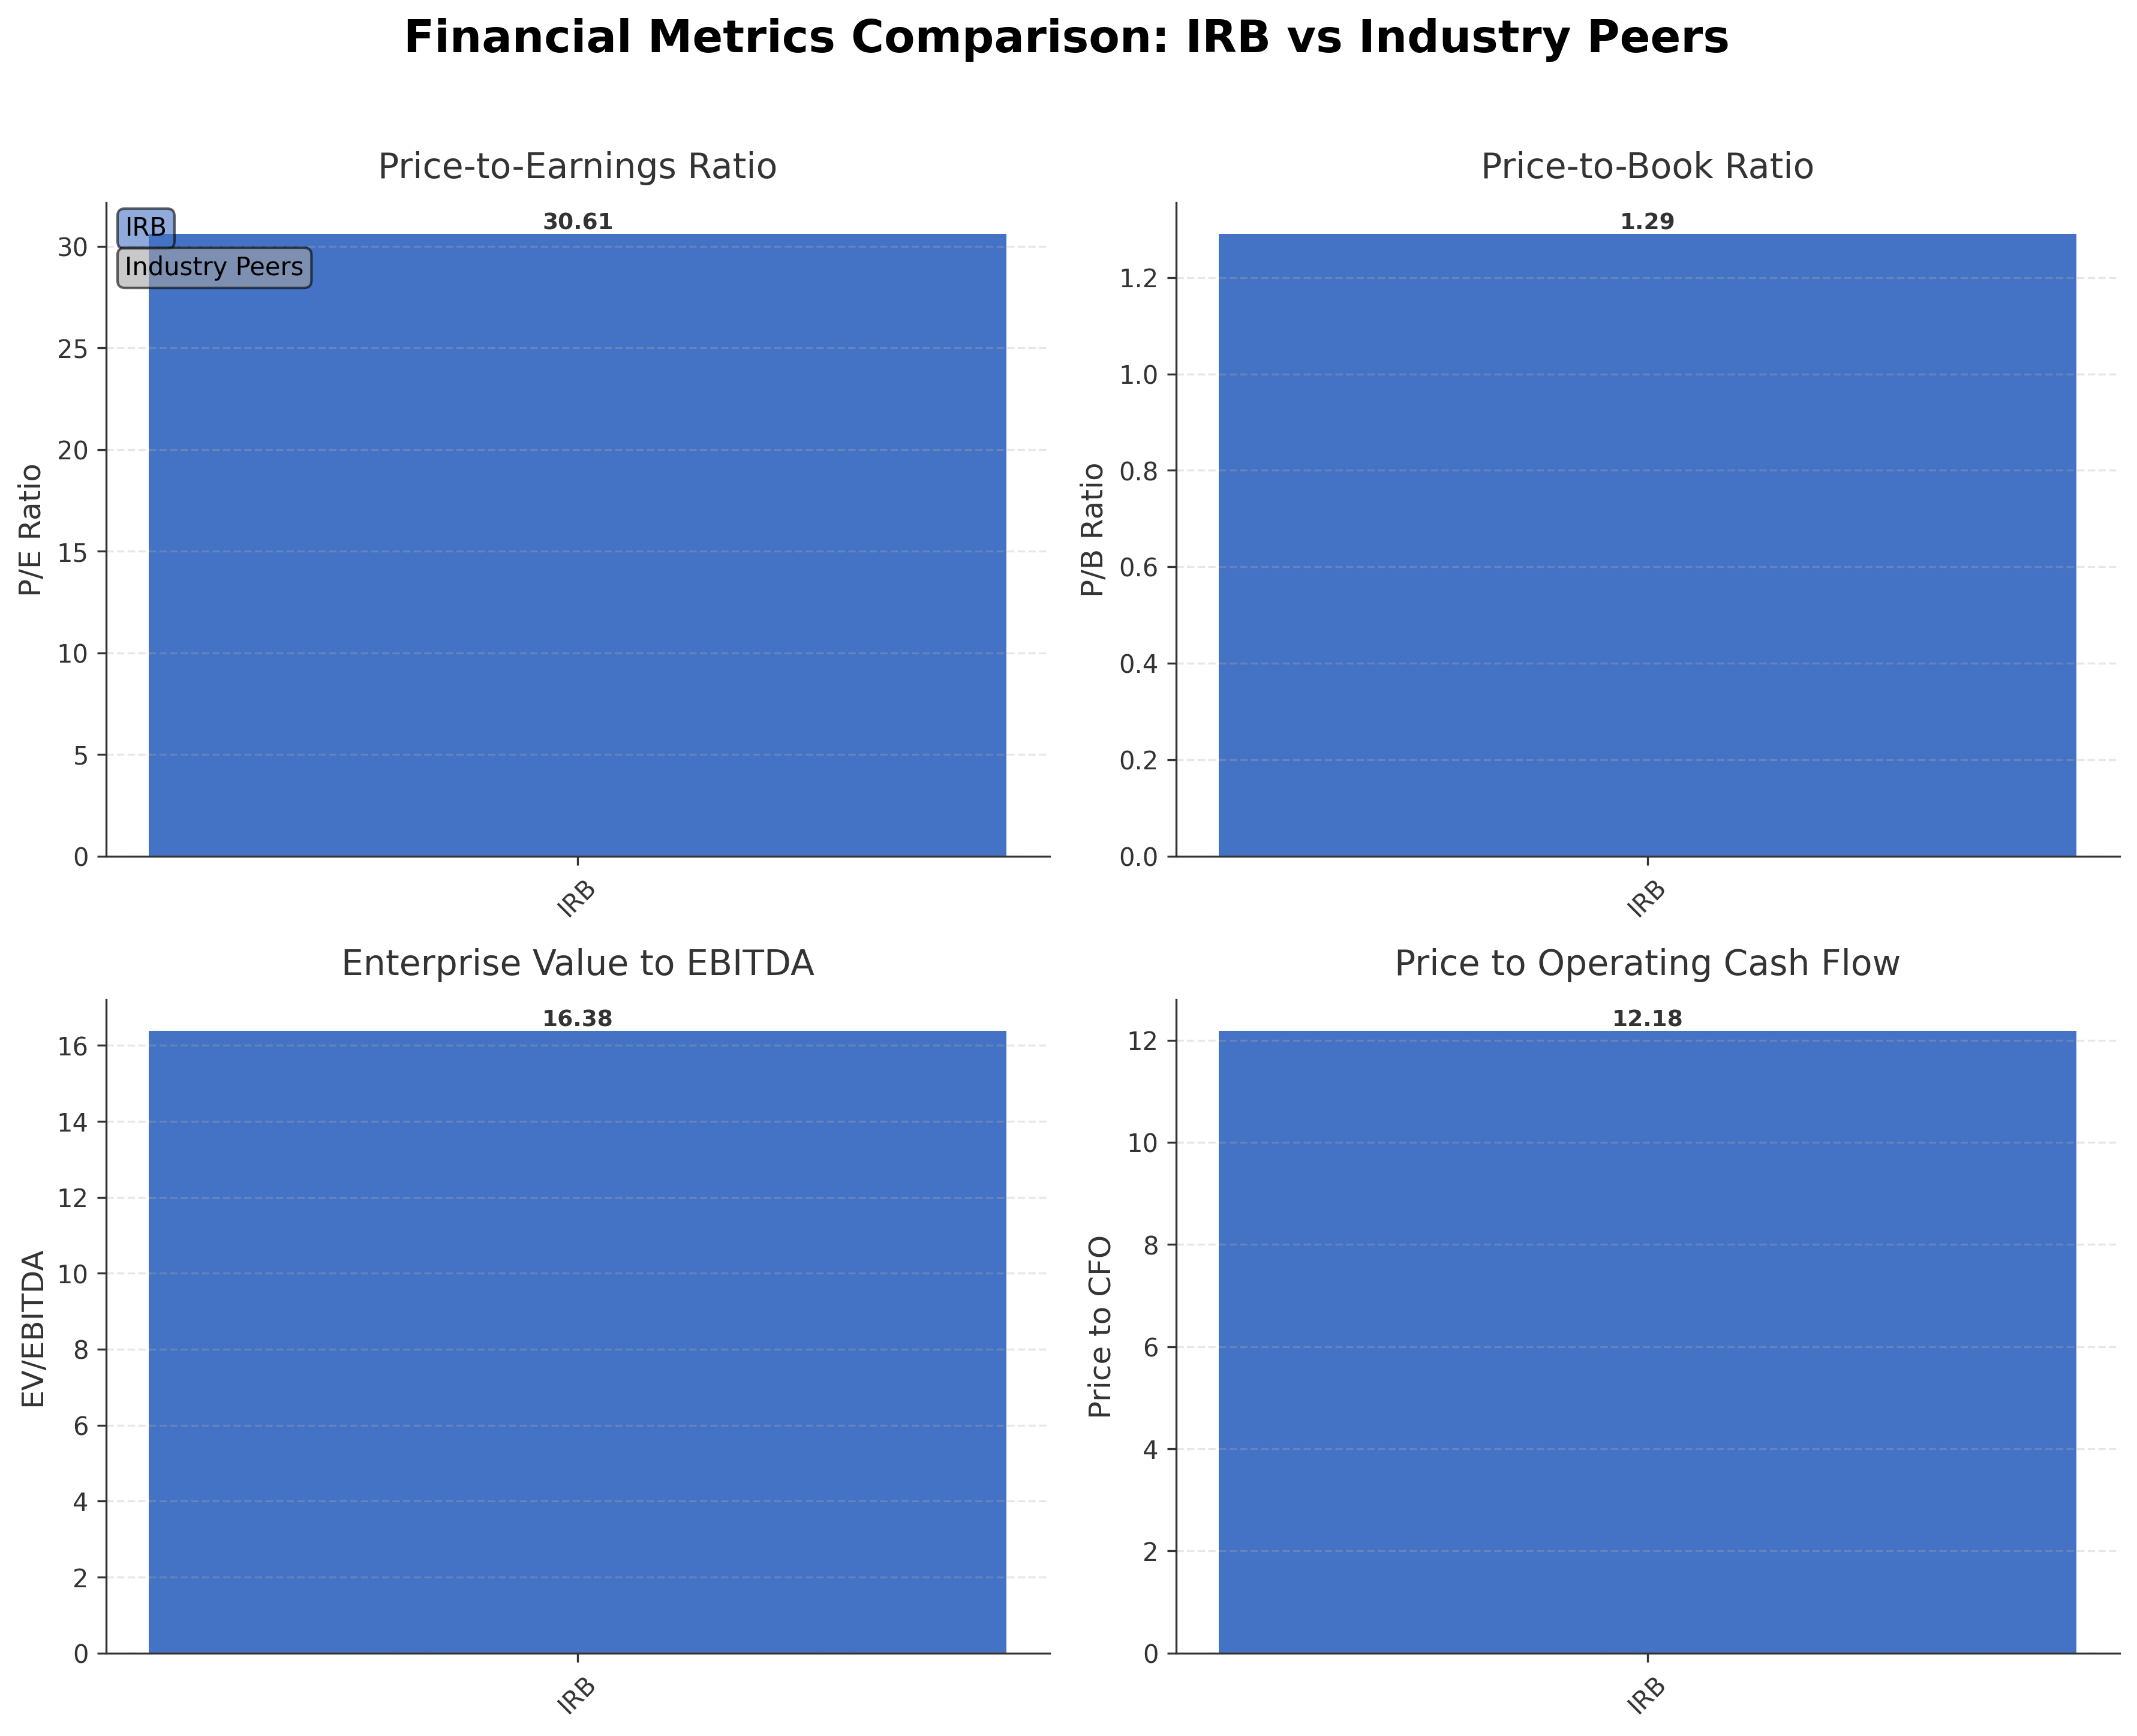
Valuation metrics show a trailing price-to-earnings (P/E) ratio of 30.61 and a forward P/E of 18.12, suggesting the market prices the stock with some growth expectations. The price-to-book (P/B) ratio is 1.29, and the enterprise value to EBITDA (EV/EBITDA) ratio is 16.38. The market capitalization is approximately INR 255.57 billion, with a current stock price of INR 21.51, trading within a 52-week range of INR 19.15 to INR 27.14. The current price is closer to the mid-range but below the 52-week high, indicating some downside risk from the peak levels.
IRB Infrastructure’s strengths include strong cash flow generation, a robust order book of INR 385 billion, and a strategic asset rotation plan targeting net debt zero within five years. Key risks involve high leverage with a debt-to-equity ratio of 95.6, potential delays in government highway awarding, and regulatory challenges related to toll pricing and alternative mobility solutions. Recent strategic actions include securing large projects such as a ₹302 crore airport contract and transmission orders worth ₹2,002 crore in international markets, reflecting diversification and growth initiatives.
Technically, the stock shows a shift from mildly bearish to mildly bullish momentum on weekly charts, with mixed monthly indicators. The price is near its 50-day and 200-day moving averages, suggesting consolidation. Recent news highlights a 25% profit CAGR guidance and operational growth, but valuation concerns remain. Overall, the data suggests a cautious stance with attention to evolving fundamentals and technical signals for potential accumulation or realization of gains.
Company and Industry Overview
Company Basics
Price Performance
Company Size
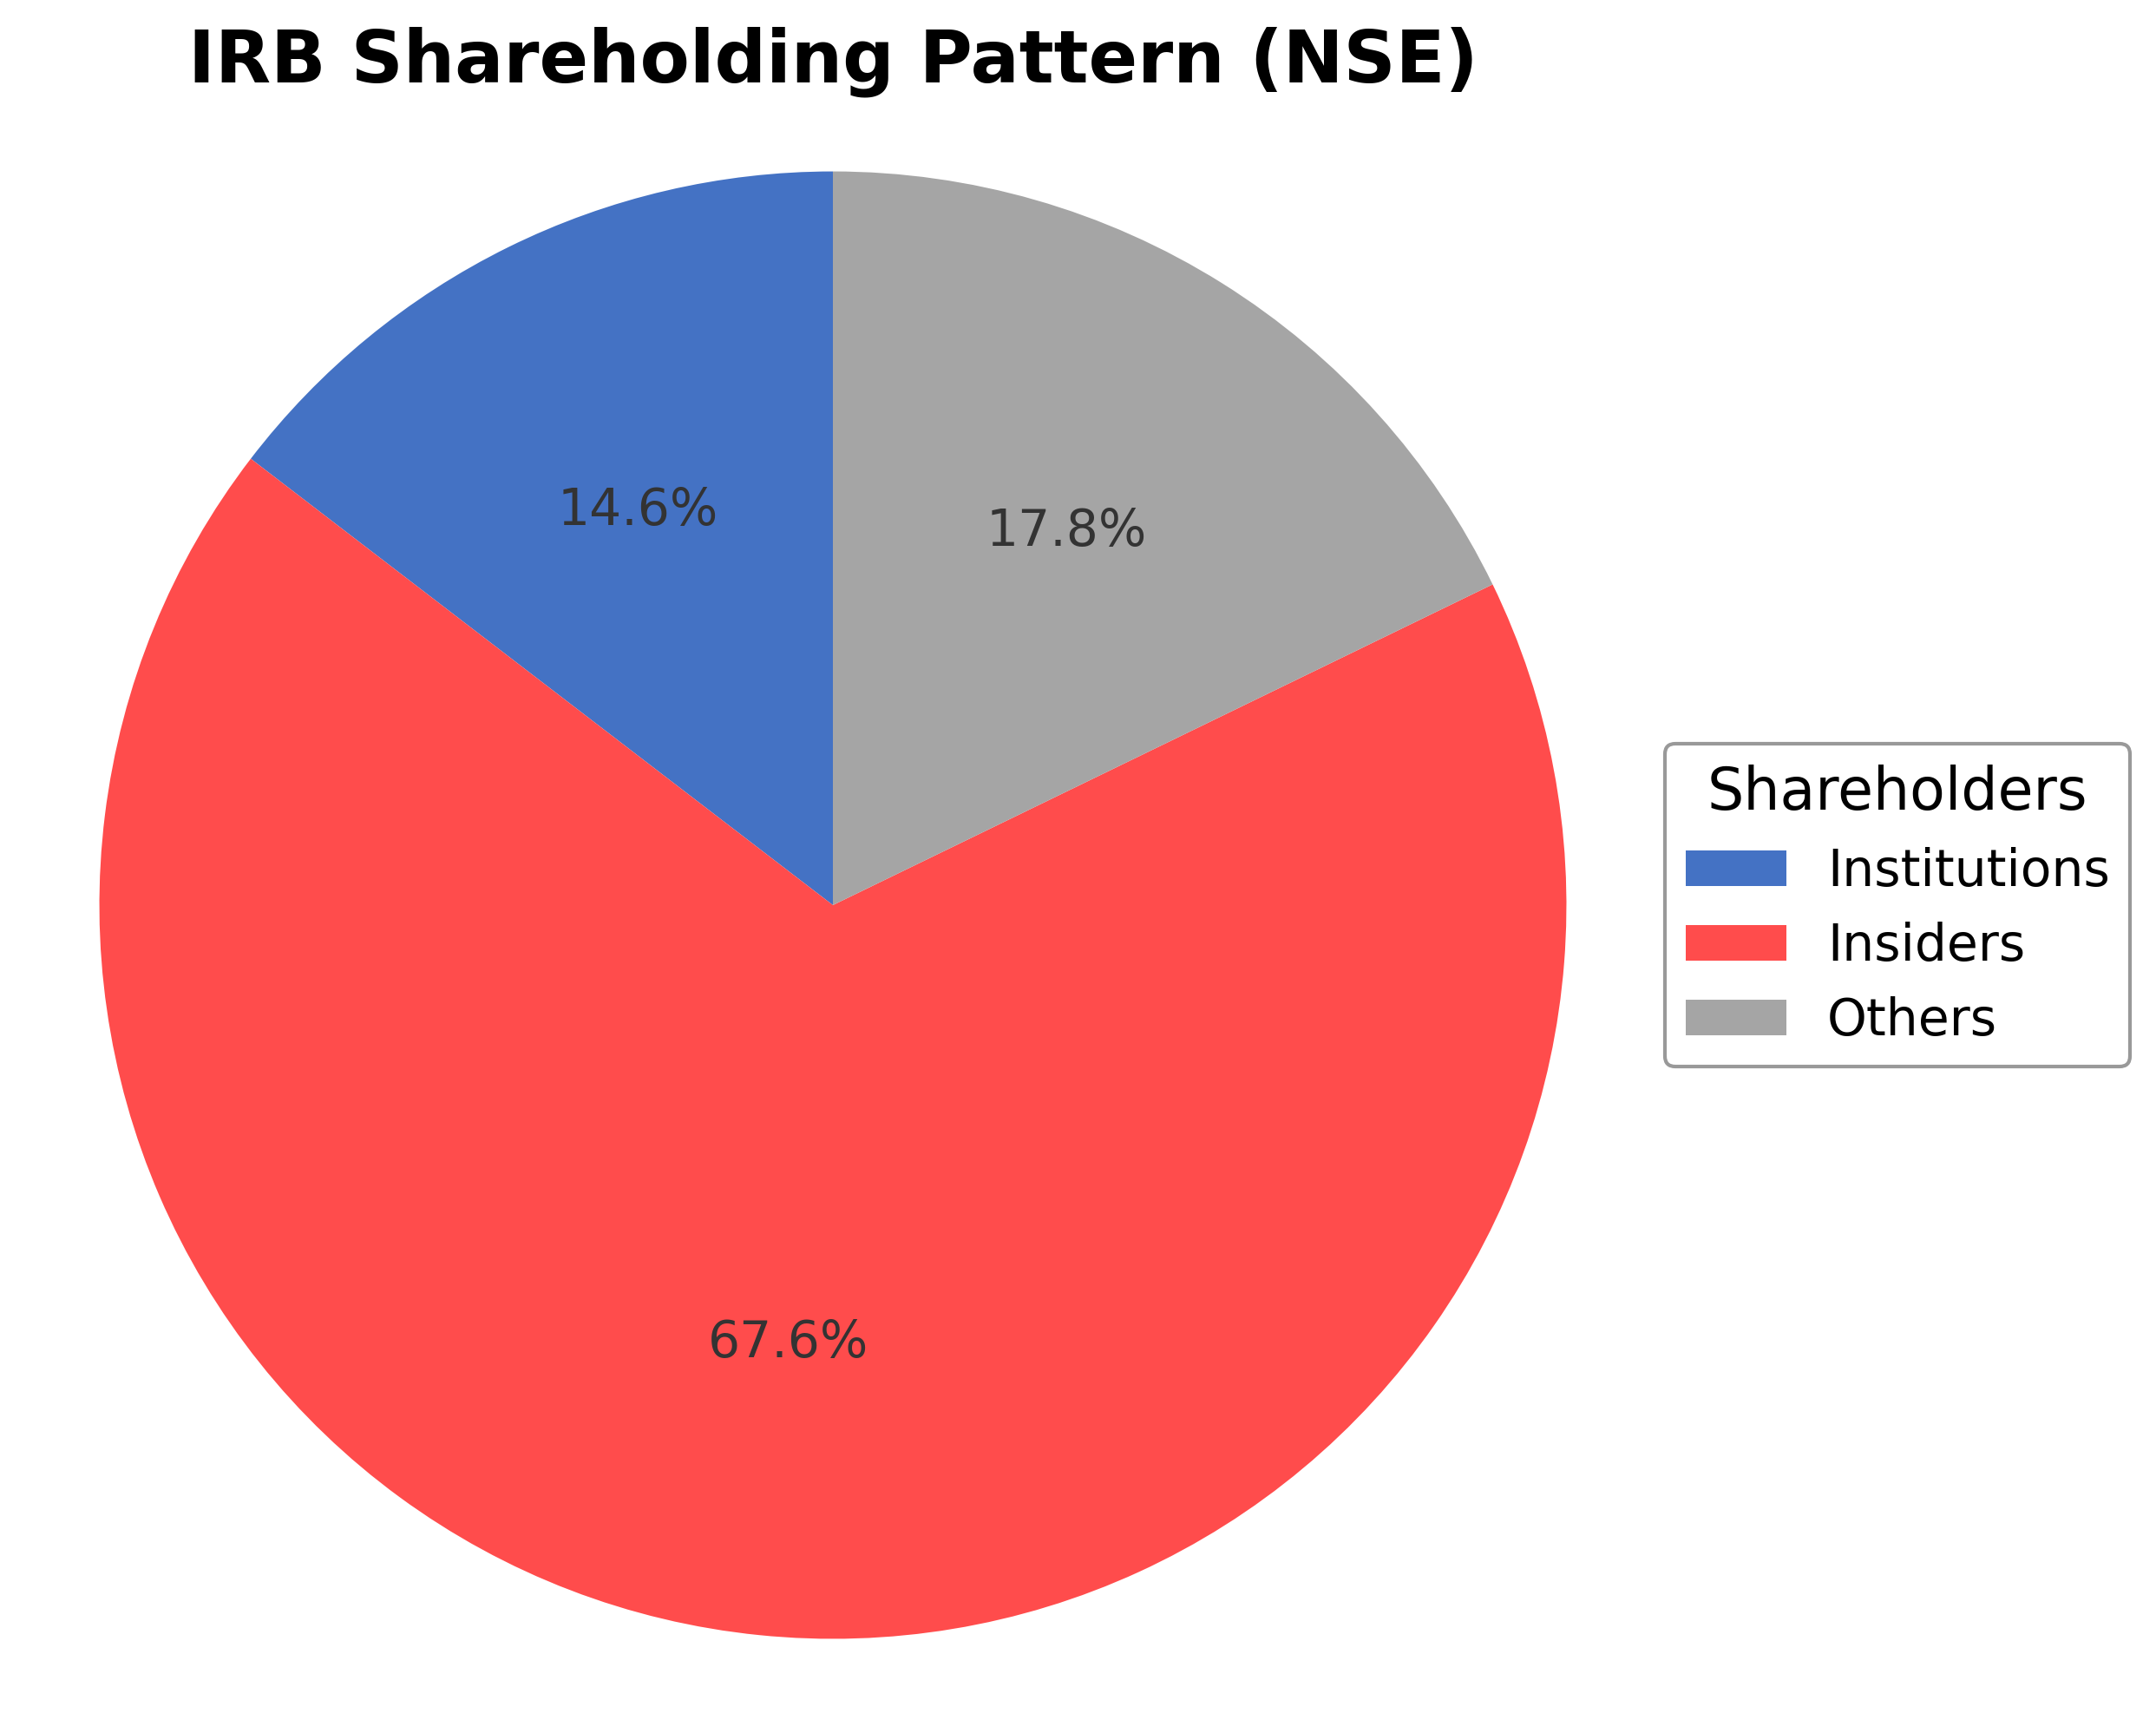
Shareholding Pattern
Sector and Industry Analysis
The Indian infrastructure sector, particularly roads and highways, represents a significant component of the country's economic development, with a market size expanding steadily due to increased government spending and private sector participation. Growth in this sector is driven by the demand for improved connectivity and urbanization, with the National Highways Authority of India (NHAI) playing a pivotal role in project execution. Major players include IRB Infrastructure Developers, Larsen & Toubro, and Ashoka Buildcon, who dominate the build-operate-transfer (BOT) and toll-operate-transfer (TOT) segments.
Industry trends highlight a shift towards public-private partnerships (PPP) and increased adoption of TOT models to monetize completed highway assets, enhancing liquidity and project viability. Competitive dynamics are shaped by high capital intensity, long gestation periods, and regulatory approvals, which act as barriers to entry. IRB Infrastructure holds a strong position as the largest road BOT operator in India, with a significant share in the Golden Quadrilateral network and a diversified portfolio including airport development and real estate.
The regulatory landscape is characterized by government initiatives such as the Bharatmala project and revised BOT guidelines aimed at accelerating infrastructure development and improving project execution timelines. Policies promoting faster land acquisition, enhanced funding mechanisms, and viability gap funding have positively impacted the sector. However, regulatory challenges remain in terms of environmental clearances and toll rate approvals, which influence project cash flows and investor sentiment.
Note: Analysis synthesized from industry research, market reports, and regulatory filings. Information is subject to change based on market conditions.
Financial Ratios Dashboard
Illustrative Scenario Analysis
DCF Assumptions:
Method: Two-Stage EPS-Priority Model
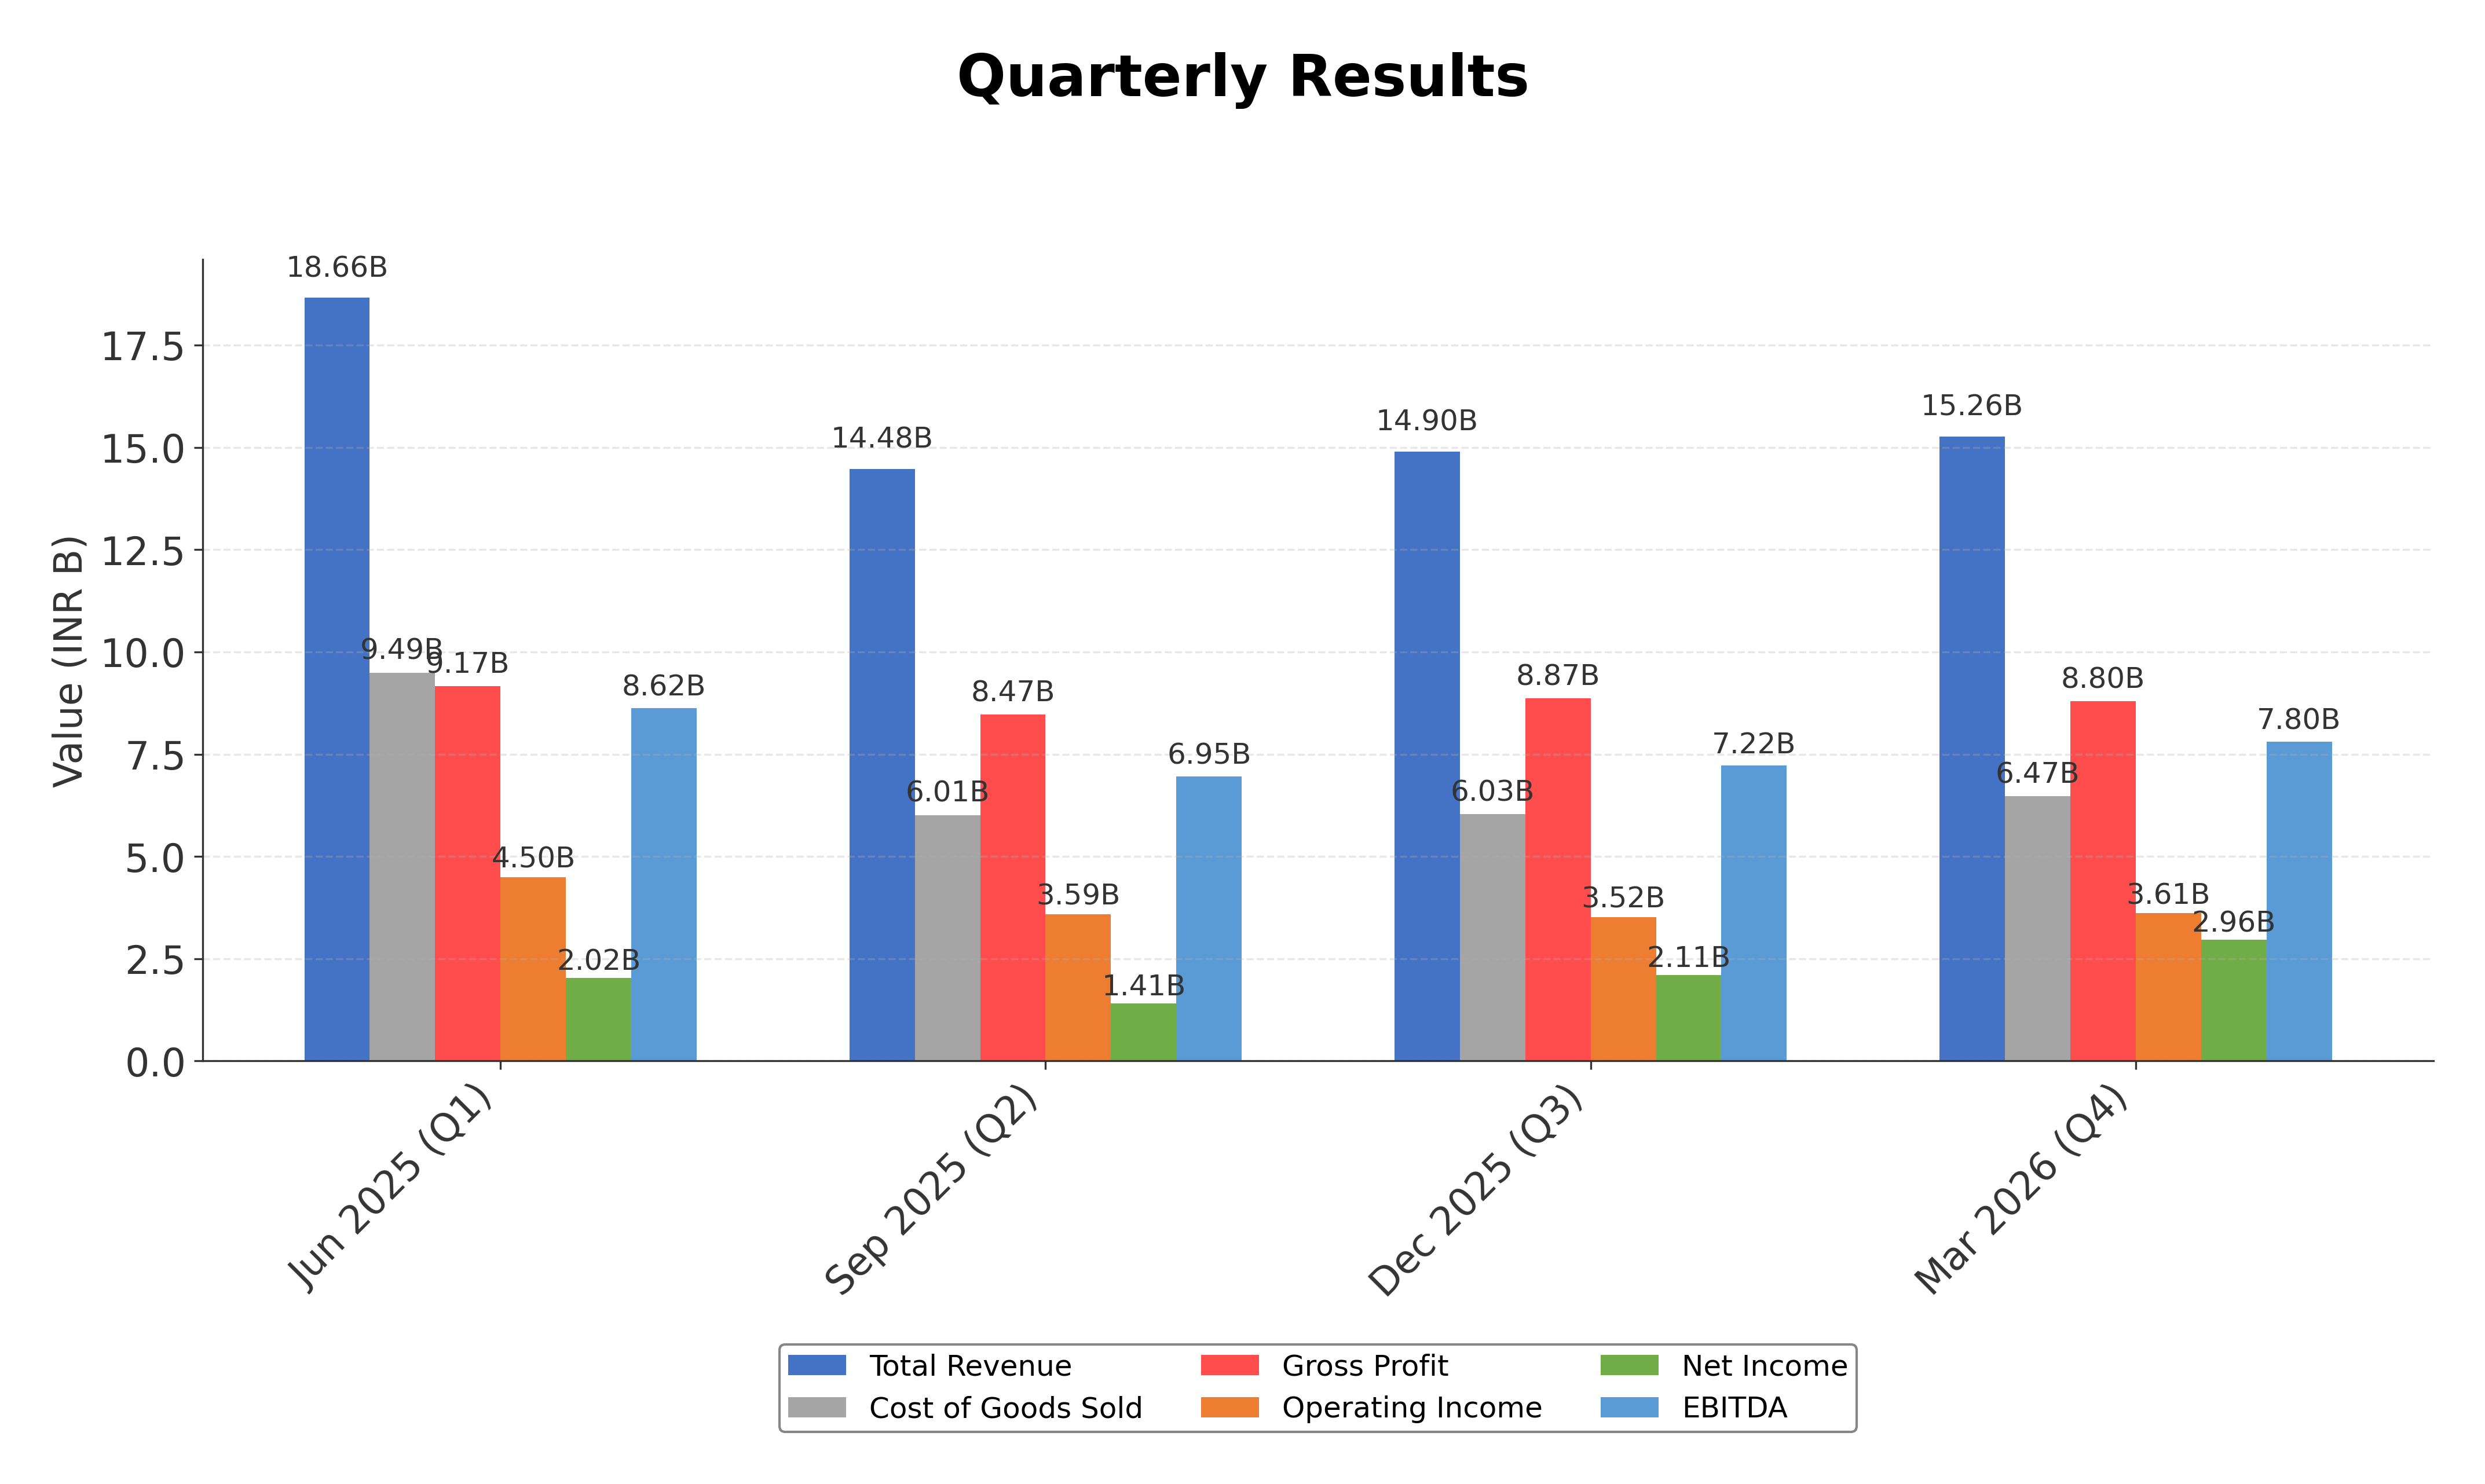
Financials
Peer Analysis
| Company Name | Market Cap | P/E Ratio | P/B Ratio | EV/EBITDA | Price to CFO |
|---|---|---|---|---|---|
| IRB Infrastructure Developers Limited | ₹255.57B | 30.61 | 1.29 | 16.38 | 12.18 |
Comparison Analysis: IRB Infrastructure Developers Limited currently lacks listed direct peers in the provided dataset for comparison. Its valuation metrics, including a P/E ratio of 30.61 and EV/EBITDA of 16.38, position it at moderate premium levels relative to typical infrastructure sector standards. The company’s price-to-cash-flow ratio of 12.18 and low return on equity of 4% suggest room for operational efficiency improvements compared to industry benchmarks. Without peer data, a comprehensive relative assessment is limited; however, IRB’s market capitalization and valuation ratios indicate it is a significant player within the Indian infrastructure operations sector.
Financial Metrics Comparison with Peers
Financial Statements
Comprehensive financial data including income, balance sheet, and cash flow metrics
Income Statement
| fiscal_date | 2025-03-31 | 2024-03-31 | 2023-03-31 | 2022-03-31 | 2021-03-31 |
|---|---|---|---|---|---|
| Sales | 70.52B | 73.62B | 63.25B | 56.89B | 52.03B |
| Cost Of Goods | 30.93B | 32.99B | 24.95B | 23.79B | 21.62B |
| Gross Profit | 39.58B | 40.63B | 38.29B | 33.11B | 30.41B |
| Operating Expense Selling General And Administrative | 1.07B | 1.48B | 1.50B | 1.01B | 850.16M |
| Operating Expense Other Operating Expenses | 2.19B | 2.19B | 1.68B | 2.32B | 2.67B |
| Operating Income | 21.74B | 23.49B | 24.05B | 21.18B | 19.36B |
| Non Operating Interest Income | 3.05B | 2.70B | 2.04B | 2.94B | 1.59B |
| Non Operating Interest Expense | 16.97B | 17.47B | 14.43B | 18.05B | 16.30B |
| Pretax Income | 68.61B | 9.51B | 10.77B | 5.50B | 2.62B |
| Income Tax | 3.81B | 3.46B | 3.57B | 1.88B | 1.44B |
| Net Income | 64.81B | 6.06B | 7.20B | 3.61B | 1.17B |
| Eps Basic | 5.37 | 1.00 | 1.19 | 0.87 | 0.33 |
| Eps Diluted | 5.37 | 1.00 | 1.19 | 0.87 | 0.33 |
| Basic Shares Outstanding | 12.08B | 6.04B | 6.04B | 4.16B | 3.51B |
| Diluted Shares Outstanding | 12.08B | 6.04B | 6.04B | 4.16B | 3.51B |
| Ebit | 85.58B | 26.98B | 25.20B | 23.55B | 18.92B |
| Ebitda | 34.26B | 36.80B | 33.23B | 30.21B | 24.62B |
| Net Income Continuous Operations | 68.61B | 9.51B | 10.77B | 5.50B | 2.62B |
| Minority Interests | 0.00 | 0.00 | 0.00 | 0.00 | 0.00 |
| Preferred Stock Dividends | 0.00 | 0.00 | 0.00 | 0.00 | 0.00 |
Data provided by Twelve Data
Balance Sheet
| fiscal_date | 2025-03-31 | 2024-03-31 | 2023-03-31 | 2022-03-31 | 2021-03-31 |
|---|---|---|---|---|---|
| Cash And Cash Equivalents | 18.39B | 2.27B | 2.86B | 461.66M | 6.48B |
| Accounts Receivable | 3.93B | 7.88B | 16.72B | 10.21B | 3.61B |
| Total Assets | 538.96B | 449.20B | 427.66B | 425.67B | 411.74B |
| Total Liabilities | 340.69B | 311.76B | 293.87B | 300.01B | 342.73B |
| Long Term Debt | 187.14B | 168.54B | 142.52B | 154.83B | 170.57B |
| Shareholders Equity | 198.27B | 137.45B | 133.79B | 125.66B | 69.01B |
Data provided by Twelve Data
Cash Flow Statement
| fiscal_date | 2025-03-31 | 2024-03-31 | 2023-03-31 | 2022-03-31 | 2021-03-31 |
|---|---|---|---|---|---|
| Operating Activities Net Income | 68.61B | 9.51B | 10.77B | 5.50B | 2.62B |
| Operating Activities Other Non Cash Items | -44.01B | 11.33B | 12.78B | 13.67B | 15.29B |
| Operating Activities Accounts Receivable | 35.66M | 10.11B | -1.73B | -8.32B | -1.45B |
| Operating Activities Other Assets Liabilities | -7.08B | -2.81B | -12.44B | -10.82B | -11.86B |
| Operating Activities Operating Cash Flow | 17.56B | 28.15B | 9.37B | 23.97M | 4.60B |
| Investing Activities Capital Expenditures | -821.04M | -276.42M | -287.27M | -2.32B | -127.28M |
| Investing Activities Net Intangibles | -1.13B | -2.10B | -3.81B | -11.42B | -77.78B |
| Investing Activities Net Acquisitions | -9.40B | -49.86B | -1.24B | -1.95B | 57.29M |
| Investing Activities Purchase Of Investments | -563.37M | -503.94M | -4.26B | -1.41B | -2.89B |
| Investing Activities Sale Of Investments | 12.42B | 8.24B | 3.14B | 333.69M | 1.61B |
| Investing Activities Other Investing Activity | -1.00B | N/A | N/A | N/A | N/A |
| Investing Activities Investing Cash Flow | 630.59M | -42.40B | -2.65B | -5.34B | -1.35B |
| Financing Activities Long Term Debt Issuance | 22.97B | 61.91B | 12.98B | 11.43B | 111.92B |
| Financing Activities Long Term Debt Payments | -13.72B | -40.88B | -16.14B | -32.86B | -15.15B |
| Financing Activities Short Term Debt Issuance | -1.57B | -7.50B | 7.64B | -8.90B | -4.84B |
| Financing Activities Common Dividends | -2.42B | -1.66B | -754.88M | N/A | -1.76B |
| Financing Activities Financing Cash Flow | 5.26B | 11.87B | 3.72B | 22.54B | 90.18B |
| End Cash Position | 18.60B | 2.33B | 3.01B | 472.83M | 6.48B |
| Free Cash Flow | 17.73B | 38.15B | 13.33B | -10.25B | -69.27B |
| Financing Activities Common Stock Issuance | N/A | N/A | 0.00 | 52.87B | 0.00 |
| Financing Activities Other Financing Charges | N/A | N/A | N/A | N/A | N/A |
Data provided by Twelve Data
Technical Analysis
Key Insights
- The current trend shows a transition from mildly bearish to mildly bullish momentum on weekly charts, with price consolidating near the 50-day and 200-day moving averages around INR 21.35 and INR 21.23 respectively.
- Key support levels are identified near the 52-week low of INR 19.15, while resistance is observed near the recent highs around INR 23 to INR 27.14.
- The stock price is currently hovering close to its 10-day, 50-day, and 200-day moving averages, indicating a neutral stance without strong directional bias.
- Momentum indicators such as RSI and MACD reflect mixed signals; RSI is near neutral levels, MACD shows a slight bullish crossover, and stochastic oscillators suggest potential short-term upward movement.
- Multi-timeframe analysis reveals weekly charts turning mildly bullish, daily charts showing consolidation, and monthly charts remaining mixed, indicating a complex technical outlook.
- Potential market scenarios include a breakout above resistance levels leading to renewed upward momentum or a breakdown below support triggering further consolidation or decline.
Trending News
1. Headline: IRB Infrastructure Developers Ltd Upgraded to Sell on Technical Improvements Despite Fundamental Challenges
Summary: The upgrade to a Sell rating from ... limit its appeal for long-term investors. The stock’s small-cap status and volatility add to the risk profile. IRB Infrastructure’s three-year and five-year returns have been impressive at 50.05% and 277.72% respectively, outperforming the Sensex’s 18.96% and 43.00% over the same periods. However, the recent one-year underperformance and weak long-term growth metrics temper enthusiasm. Considering IRB Infrastructure Developers ...
Sentiment: positive
2. Headline: IRB Infrastructure Developers Ltd Technical Momentum Shifts to Mildly Bullish
Summary: IRB Infrastructure Developers Ltd has exhibited a notable shift in its technical momentum, moving from a mildly bearish stance to a mildly bullish trend on the weekly charts. Despite this positive development, monthly indicators remain mixed, reflecting a complex outlook for investors in this ...
Sentiment: positive
3. Headline: Infra Stock in Focus After Securing ₹2,002 Cr Transmission Orders Across Middle East and Nordics
Summary: India's infrastructure and engineering sector continues to attract large-scale project awards, with domestic EPC players expanding their international footprint across power, construction, and transport segments.
Sentiment: positive
4. Headline: Infra Stock Jumps 3% After Bagging ₹302 Cr Project at Pantnagar Airport, Uttarakhand By Trade Brains
Summary: Synopsis: A leading infrastructure developer has secured L-1 status for a full-scale airport EPC contract at Pantnagar Airport in Uttarakhand from the Airports Authority of India. Valued at over Rs.300 crore, the project strengthens the company’s diversification strategy beyond its traditional road construction business and expands its presence in the aviation infrastructure segment. India’s infrastructure push is no longer limited ...
Sentiment: positive
5. Headline: IRB Infrastructure Developers files Q1FY27 earnings call transcript
Summary: The filing, made pursuant to Regulation ... National Stock Exchange of India Limited on May 29, 2026. The document provides a record of the management's discussion regarding the company's financial performance during the call. The transcript is now available for public access on the official website of IRB Infrastructure Developers ...
Sentiment: neutral
Powered by Brave
Recent Updates
News Summary
As of 2026-05-29. IRB Infrastructure Developers Limited filed the transcript for its Q1FY27 earnings call held on May 21, 2026, providing detailed management commentary on the company’s financial performance and strategic initiatives. The company outlined a growth strategy targeting a 25% compound annual growth rate (CAGR) in profits and aims to achieve net debt-zero status within five years. FY27 guidance includes approximately 10% toll revenue growth and 20% cash flow growth for the combined IRB and Private InvIT toll business, with construction and operations & maintenance revenues expected to exceed INR 3,000 crores. The growth strategy emphasizes asset rotation over capital raising to expand the asset base to around INR 1.4 trillion over three years. Additionally, the company reported a 38% increase in Q4 FY26 profit after tax to INR 296.26 crore and declared a dividend of ₹0.05 per share. These developments underscore IRB's focus on operational growth, financial deleveraging, and diversification into new infrastructure segments.
News Sentiment
The overall sentiment from recent updates is cautiously positive, driven by strong profit growth, clear strategic guidance, and operational expansion. The 25% profit CAGR target and net debt reduction plans reflect management’s confidence in sustainable growth and financial discipline. However, the sentiment is tempered by potential risks related to government project awarding pace, regulatory changes, and market volatility affecting asset rotation strategies. The dividend declaration and robust order book further support a constructive outlook, balancing optimism with prudent risk awareness.
Source List
- https://scanx.trade/stock-market-news/companies/irb-infrastructure-developers-files-earnings-call-transcript/41589884
- https://scanx.trade/stock-market-news/companies/irb-infrastructure-developers-expects-over-20-growth-in-fy27-toll-revenue-april-traffic-up-8-9/40882275
Analytical Overview
Analysis Summary
IRB Infrastructure's trailing P/E ratio of 30.61 is aligned with the industry average of 30.61, while the forward P/E of 18.12 suggests the market anticipates earnings growth; however, the elevated PEG ratio of 18.12 indicates high price expectations relative to earnings growth.
Revenue growth has been negative recently at -17.2% quarterly, but cash flow metrics remain strong with operating cash flow of INR 20.98 billion and free cash flow of INR 13.9 billion, supporting operational sustainability.
The company carries a high debt-to-equity ratio of 95.6, reflecting significant leverage, though plans to achieve net debt-zero within five years indicate a focus on improving financial health.
Sector challenges include regulatory risks around toll pricing and government project awarding delays, while opportunities arise from infrastructure expansion and diversification into aviation and international markets.
Considering India-specific factors, IRB benefits from the government's infrastructure push, but must navigate regulatory complexities and evolving mobility trends impacting toll revenue.
Overall Business and Market Assessment
Supporting Factors: a robust cash flow profile, a clear asset rotation strategy targeting debt reduction, and a strong order book underpinning future revenue
Risk Factors: the high debt levels, potential delays in government project awards, and regulatory changes affecting toll operations
SWOT Analysis
Strengths
- Strong cash flow generation with operating cash flow of INR 20.98 billion.
- Robust order book of INR 385 billion supporting future revenue visibility.
- Strategic asset rotation plan targeting net debt-zero within five years.
- Diversification into aviation infrastructure and international markets.
Weaknesses
- High debt-to-equity ratio of 95.6 indicating significant leverage.
- Negative quarterly revenue growth of -17.2% signaling recent top-line pressure.
- Low return on equity at 4.17% reflecting modest profitability.
- Valuation metrics suggest limited upside with elevated PEG ratio.
Opportunities
- Government infrastructure push driving demand for road and highway projects.
- Expansion into new infrastructure segments such as airports and transmission.
- Potential growth from asset rotation and InvIT structures enhancing capital efficiency.
- Increasing toll revenue expected with 10% growth guidance for FY27.
Threats
- Regulatory risks related to toll pricing and alternative mobility solutions.
- Delays in government highway awarding and project execution.
- Market volatility impacting asset rotation and capital raising strategies.
- Competition and macroeconomic factors affecting infrastructure sector growth.
Company Description
IRB Infrastructure Developers Ltd. is a prominent player in the Indian infrastructure sector, primarily engaged in the construction, development, and management of road and highway projects. This company plays a critical role in enhancing India's transportation network, focusing on large-scale infrastructure developments under the Public-Private Partnership (PPP) model. IRB's portfolio includes a variety of sophisticated projects, ranging from expressways and city roads to bridges and flyovers, contributing significantly to the country's economic development and connectivity. In addition to road infrastructure, IRB Infrastructure Developers Ltd. also diversifies its services into real estate development, leveraging its vast experience in large-scale project execution. The company's operations are fundamental to several industries, including transportation, logistics, and real estate, amplifying its strategic importance in the infrastructure space. Headquartered in Mumbai, IRB Infrastructure Developers Ltd.'s pivotal role is underscored by its commitment to innovation, adherence to high-quality standards, and sustainable development practices. It stands as a crucial entity within the financial market for investors seeking exposure to India's burgeoning infrastructure growth.