


InterGlobe Aviation Ltd (INDIGO)
Stock Analysis Report
Stock Journey
Key Positives and Key Risks
Pros
- Market capitalization of approximately ₹1.93 trillion reflects strong market presence and investor interest.
- Revenue growth of 6.2% quarterly and 21.3% yield growth indicate positive operational momentum.
Cons
- Negative return on equity of -34.23% and return on assets of -1.76% highlight profitability challenges.
- High debt-to-equity ratio of 866.46 signals significant financial leverage and risk.
- Negative levered free cash flow of INR -23.9 billion suggests liquidity pressures.
Disclosure: This information is for general awareness and does not constitute investment advice
Report Summary
InterGlobe Aviation Ltd., widely recognized by its brand IndiGo, operates as India's largest low-cost airline, providing both domestic and international air travel services. Listed on the National Stock Exchange of India (NSE) under the symbol INDIGO, the company is a key player in the Industrials sector, specifically within the Airlines industry. IndiGo's business model focuses on cost-effective, punctual, and reliable air transportation using a modern fleet predominantly composed of Airbus aircraft. The airline's extensive network connects major and minor airports across India and select international destinations, positioning it as a market leader in the Asian aviation space.
Financially, InterGlobe Aviation reported trailing twelve months (TTM) revenue of INR 846.75 billion with a gross margin of 10.9%, operating margin of 15.76%, and a net profit margin of 3.79%. However, the company shows negative returns on equity (ROE) of -34.23% and return on assets (ROA) of -1.76%, indicating challenges in profitability and asset utilization. The return on invested capital (ROIC) is not explicitly stated but is implied to be under pressure given the negative ROE and ROA. Quarterly revenue growth stands at 6.2%, while quarterly earnings growth year-over-year declined by 77.5%, reflecting volatility in earnings performance.
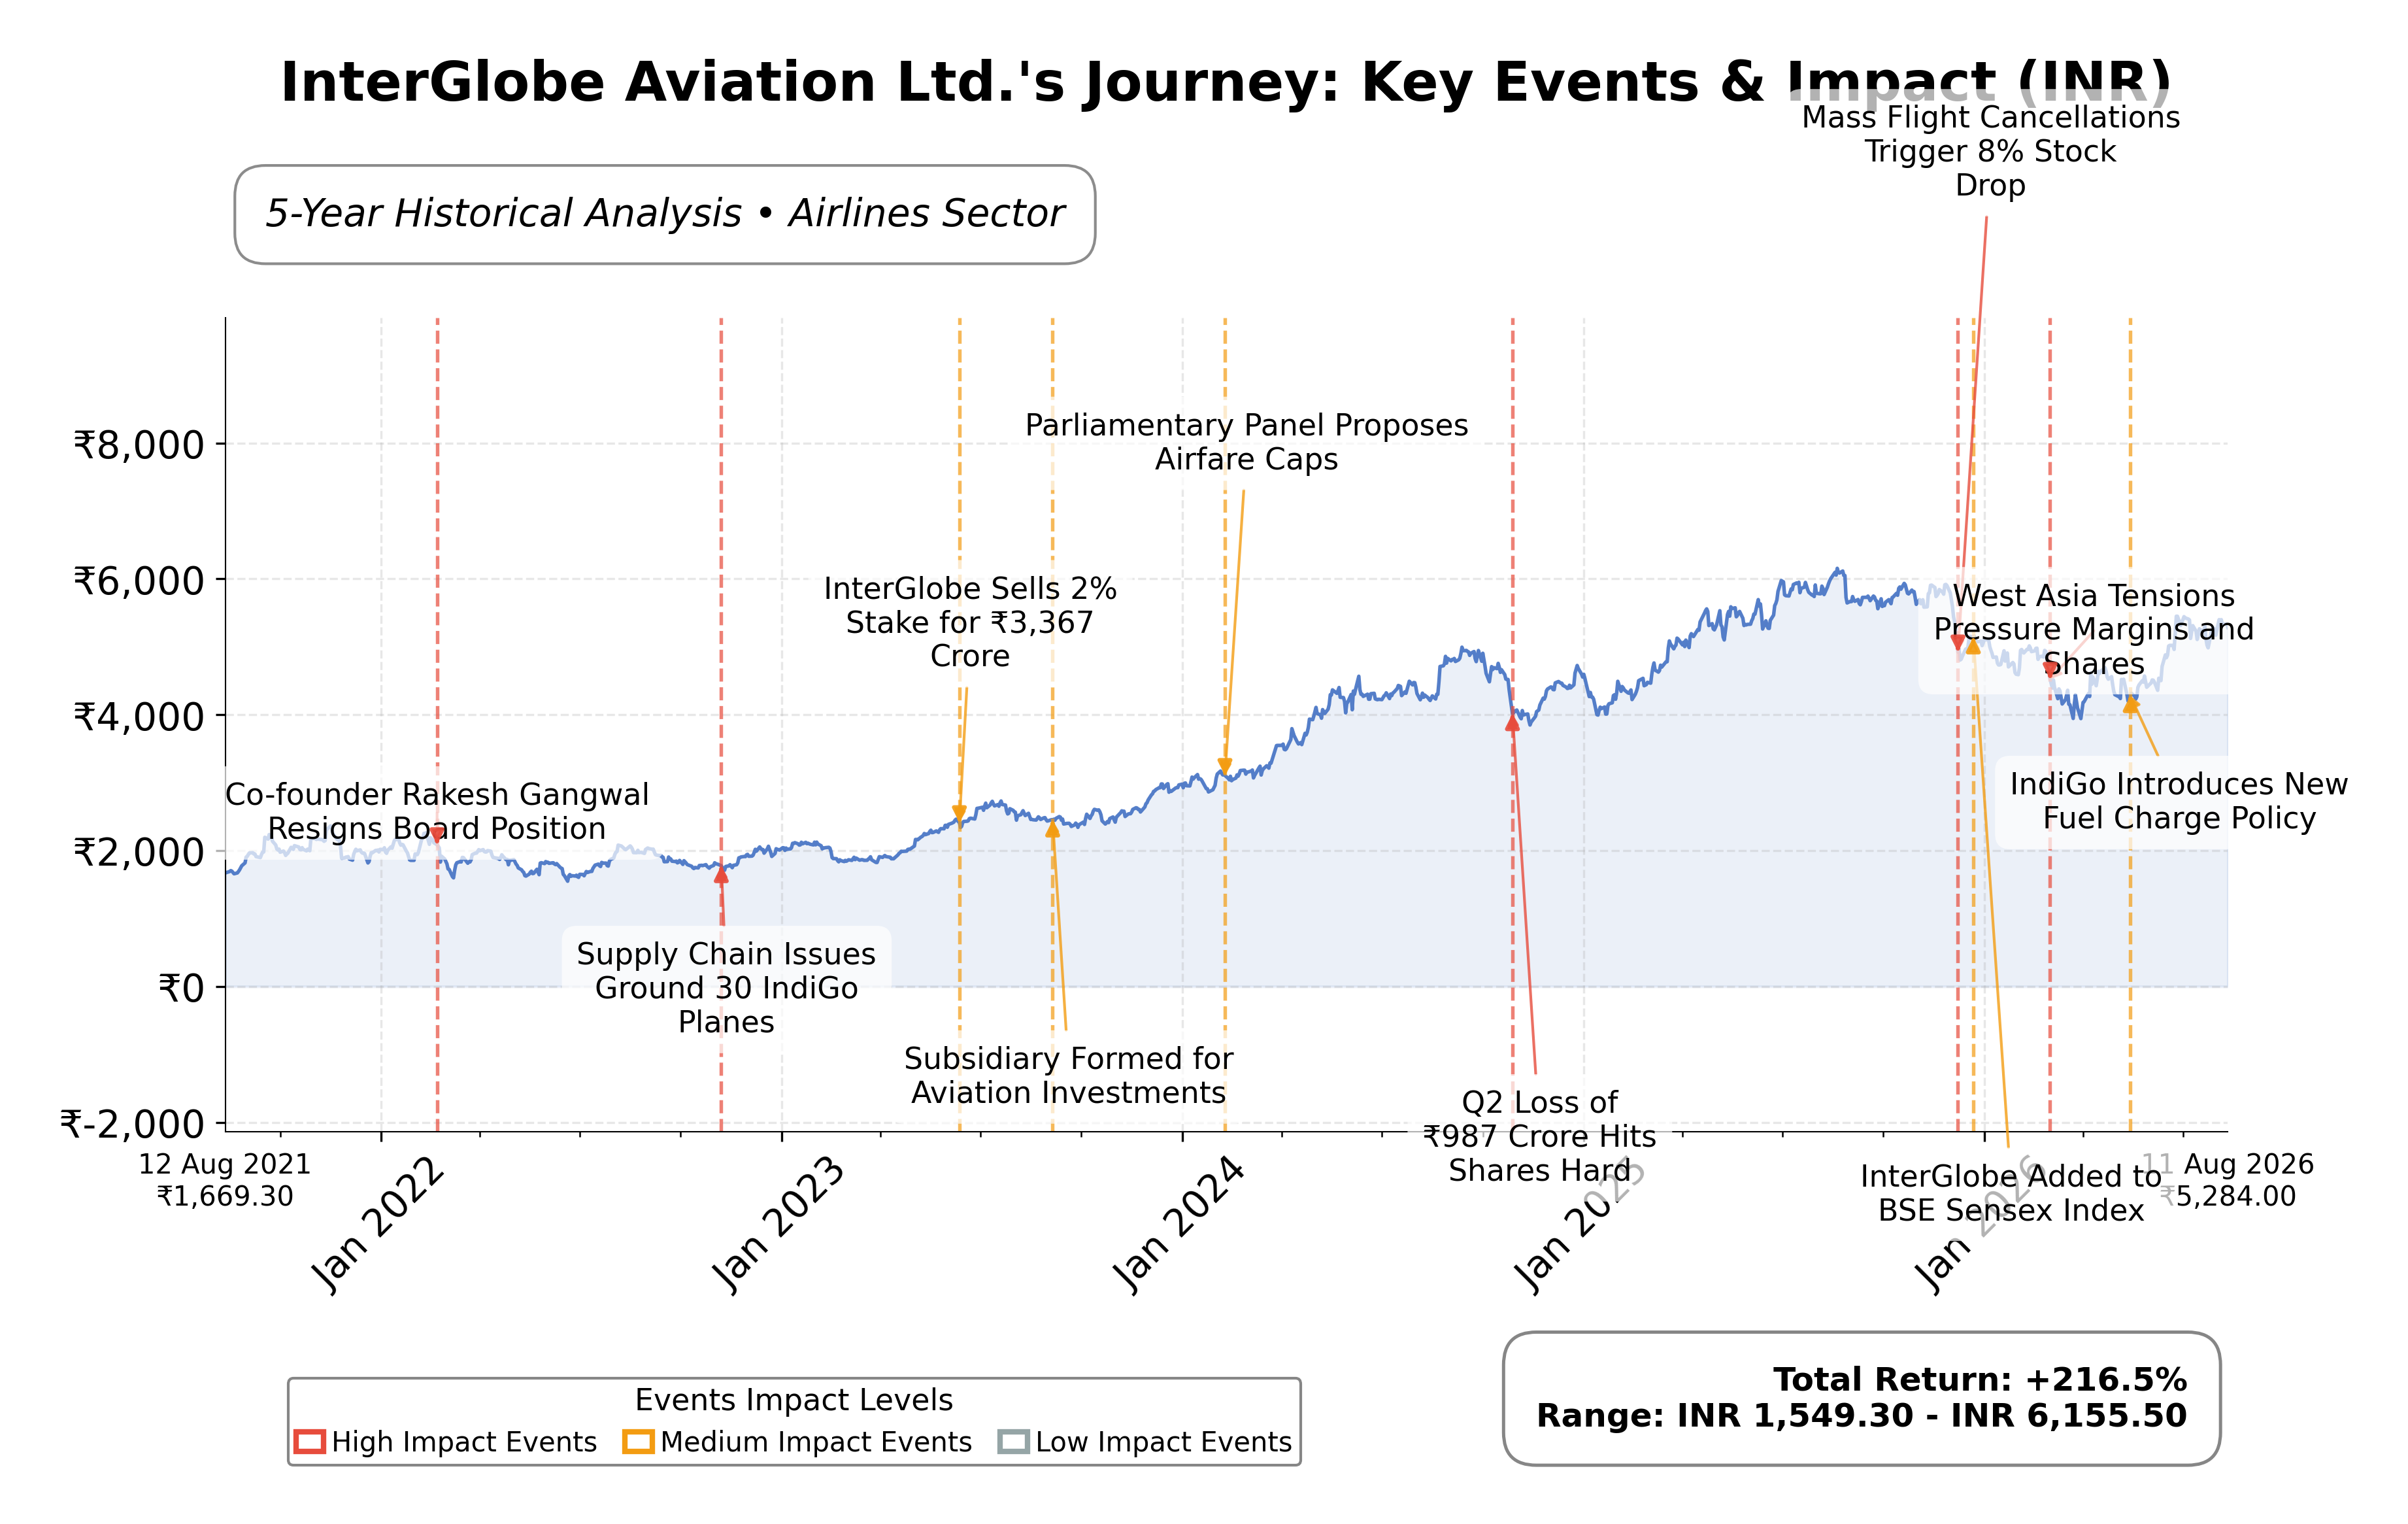
Valuation metrics reveal a trailing price-to-earnings (P/E) ratio of 52.96 and a forward P/E of 21.42, suggesting the market prices the stock with expectations of improved future earnings. The price-to-book (P/B) ratio is notably high at 27.19, and the enterprise value to EBITDA (EV/EBITDA) ratio is 16.42, indicating a premium valuation relative to book value and earnings before interest, taxes, depreciation, and amortization. The market capitalization is approximately INR 1.93 trillion, with the current share price at INR 5,333, trading below its 52-week high of INR 6,232.50 and above the 52-week low of INR 3,895.20, reflecting a 15.6% decline from the high.
InterGlobe Aviation's strengths include its dominant market share in India’s airline industry, a large and modern fleet, and strong cash reserves of INR 496.3 billion. However, the company faces significant risks from elevated fuel costs, geopolitical tensions affecting capacity deployment, and a high debt-to-equity ratio of 866.46, which may constrain financial flexibility. Recent strategic developments include early-stage talks with Embraer for regional jet orders and network expansions to new airports such as Jamnagar and Jewa Airport in Noida. Leadership remains stable with CEO Petrus Johannes Theodorus Elbers at the helm.
Technically, the stock exhibits a mixed momentum profile with price action near key moving averages (50-day and 200-day around INR 4,887 and INR 4,911 respectively) and a beta of 0.606, indicating moderate volatility relative to the market. Recent news shows a blend of positive developments, such as yield growth and network expansion, alongside challenges like rising fuel costs and earnings pressure. Overall, the data suggests a cautious stance with conditions warranting close monitoring of operational and financial metrics before considering portfolio adjustments.
Company and Industry Overview
Company Basics
Price Performance
Company Size
Shareholding Pattern
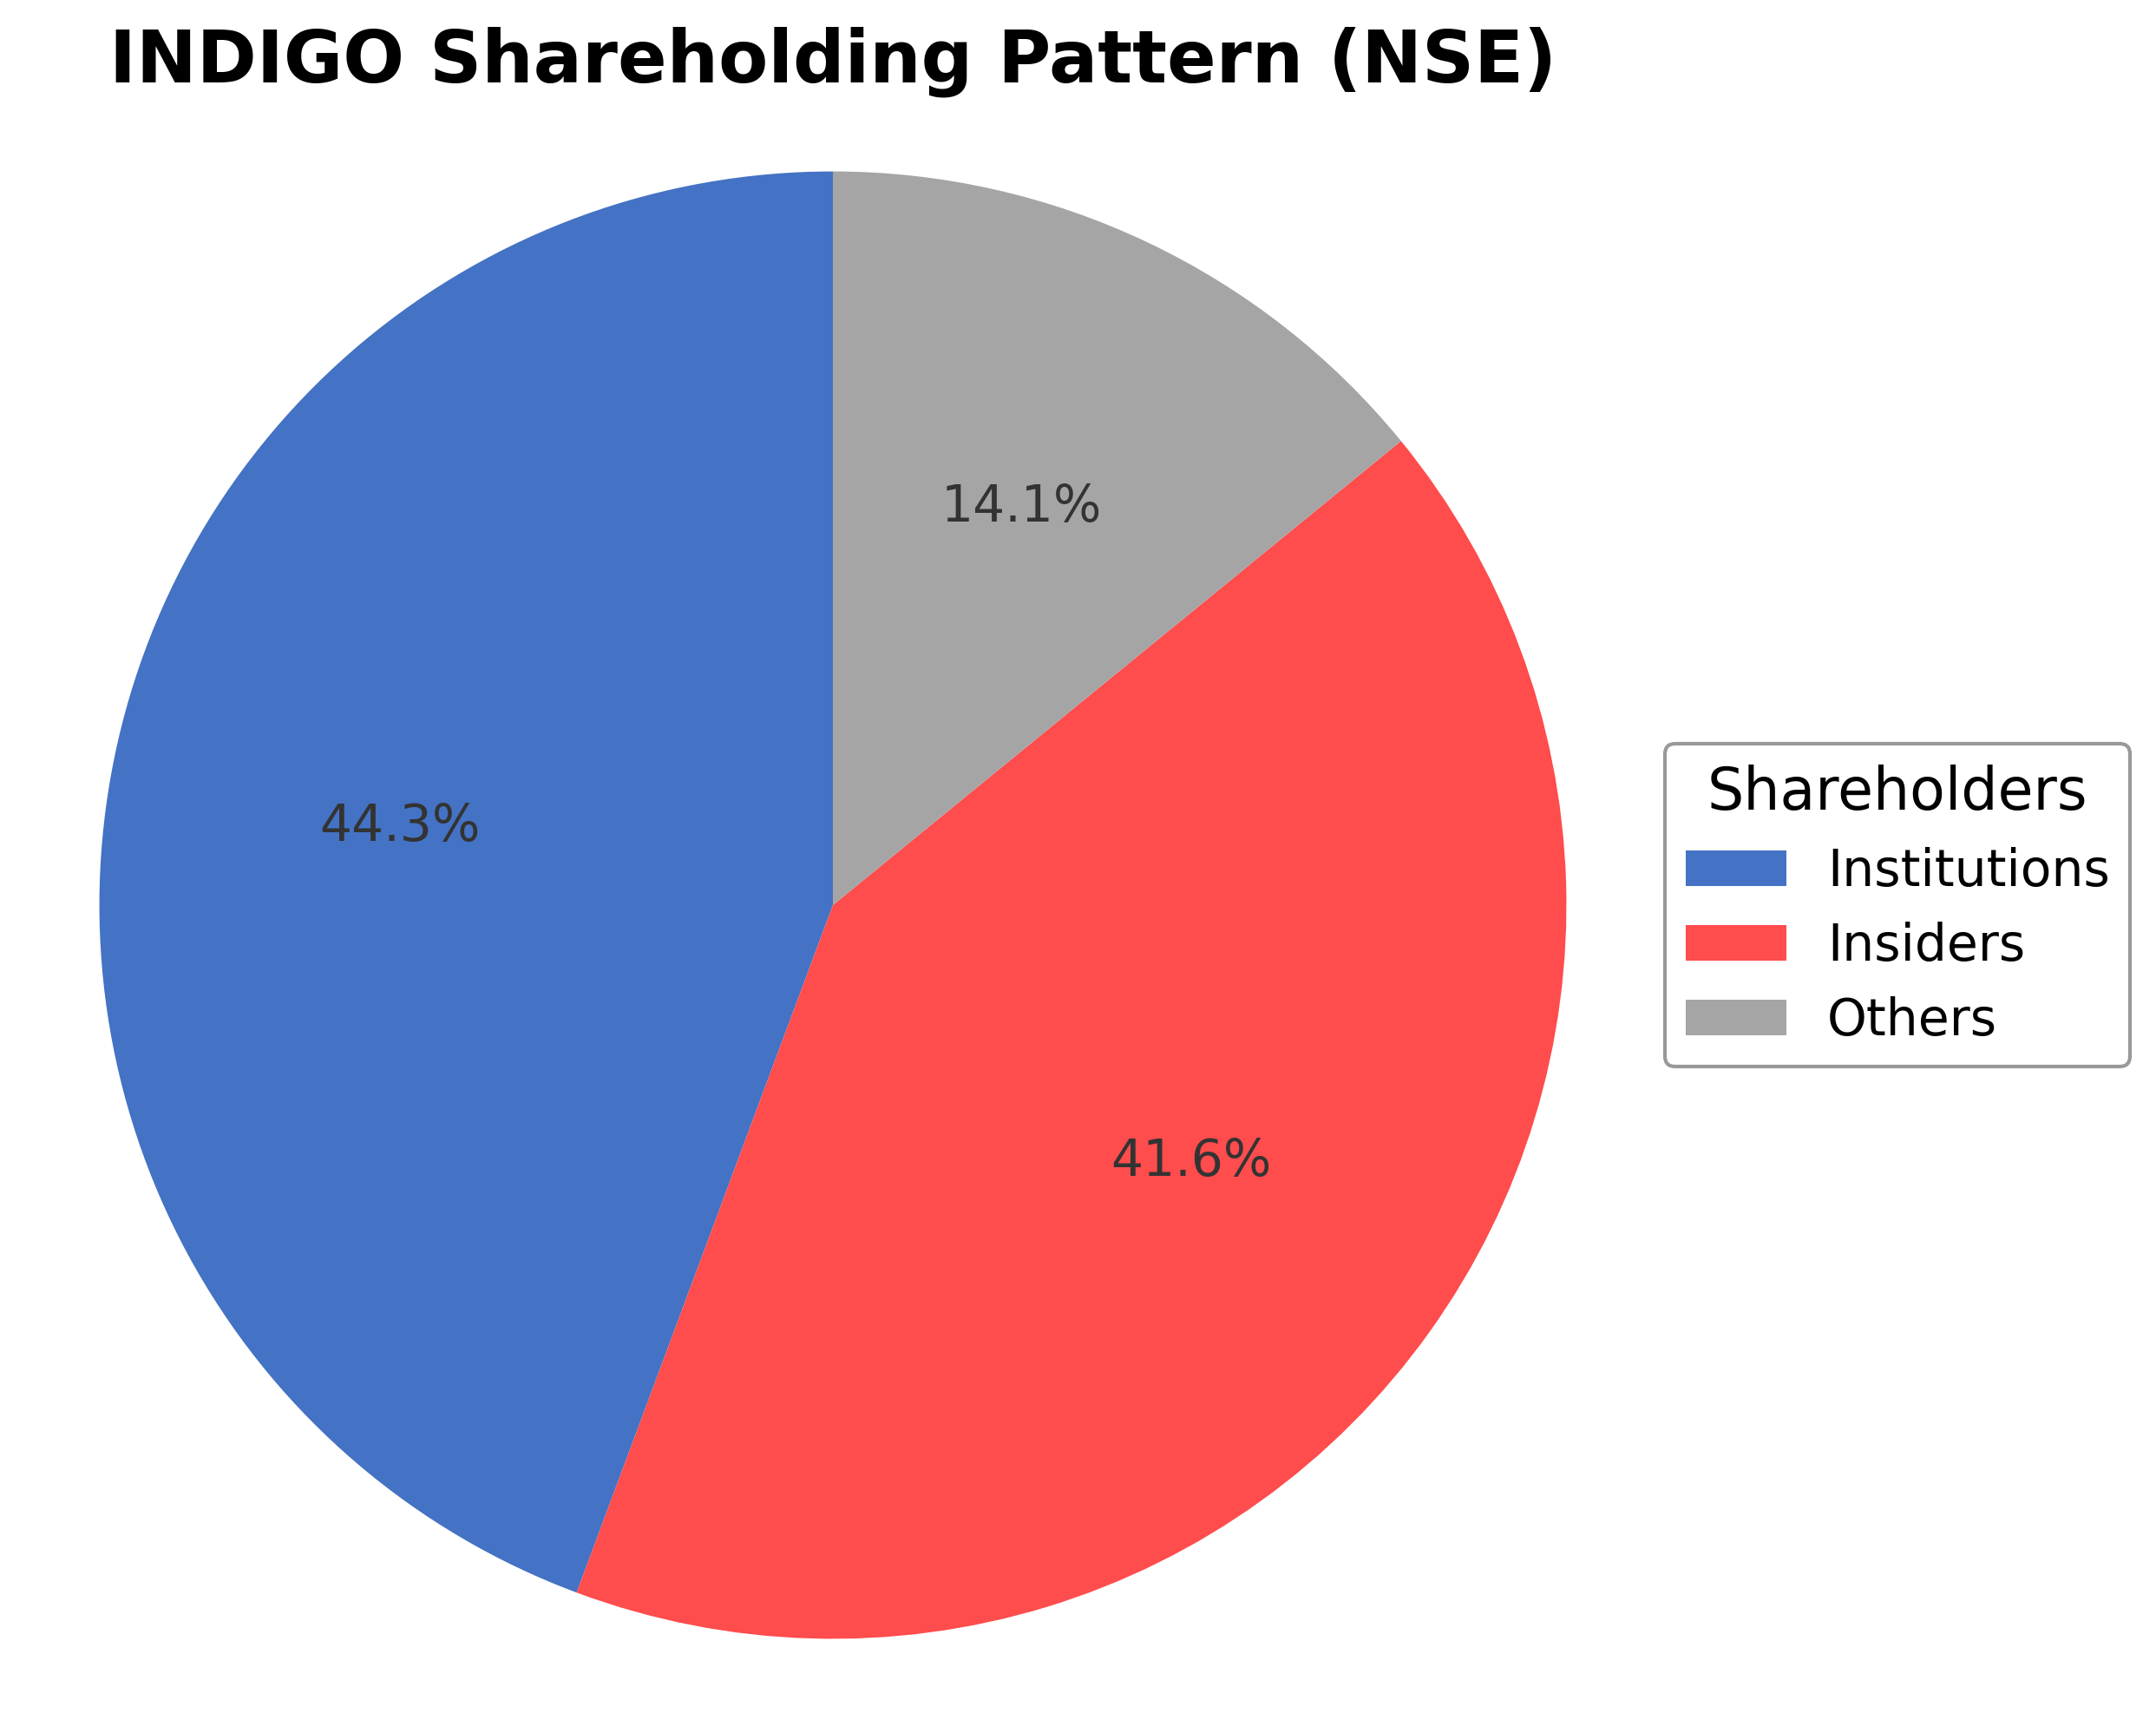
InterGlobe Aviation Ltd.'s ownership structure comprises approximately 41.58% held by insiders including executives and promoters, 44.32% by institutional investors such as mutual funds and pension funds, and the remaining 14.10% by public shareholders and other retail investors. Over the past 12 to 24 months, institutional holdings have shown moderate accumulation, reflecting confidence from key investment firms, while promoter stakes have remained relatively stable. This balanced shareholding pattern suggests a governance framework influenced by both strategic insiders and professional investors. The significant institutional presence may support disciplined corporate oversight and strategic direction, while the promoter stake ensures continuity in leadership and long-term vision. Overall, the ownership distribution indicates a stable market sentiment with a focus on sustainable growth within the competitive Indian airline industry.
Sector and Industry Analysis
India’s aviation sector is one of the fastest-growing markets globally, driven by rising disposable incomes, urbanization, and increasing air travel penetration. The domestic market is dominated by a few key players, with IndiGo commanding over 60% market share, making it the largest airline by passenger volume in Asia. The sector’s growth trajectory is supported by expanding airport infrastructure and increasing connectivity to tier-2 and tier-3 cities, although capacity constraints remain a challenge.
Industry trends highlight a shift toward low-cost carrier (LCC) models emphasizing cost efficiency, punctuality, and fleet modernization, with IndiGo leading in these areas. Competitive dynamics are shaped by disciplined capacity management, fuel efficiency, and expanding international routes, which help diversify revenue streams. Barriers to entry include high capital intensity, regulatory approvals, and the need for extensive fleet and network scale to achieve profitability and operational resilience.
The regulatory environment in India’s aviation sector involves oversight on safety, pricing, and foreign investment, with recent policies encouraging international expansion and infrastructure development. Environmental regulations and fluctuating fuel prices remain significant challenges, impacting operating costs and margins. The outlook is positive, supported by government initiatives to enhance airport capacity and connectivity, although currency volatility and geopolitical factors could influence sector performance.
Note: Analysis synthesized from industry research, market reports, and regulatory filings. Information is subject to change based on market conditions.
Financial Ratios Dashboard
Illustrative Scenario Analysis
DCF Assumptions:
Method: Two-Stage EPS-Priority Model
Financials
Peer Analysis
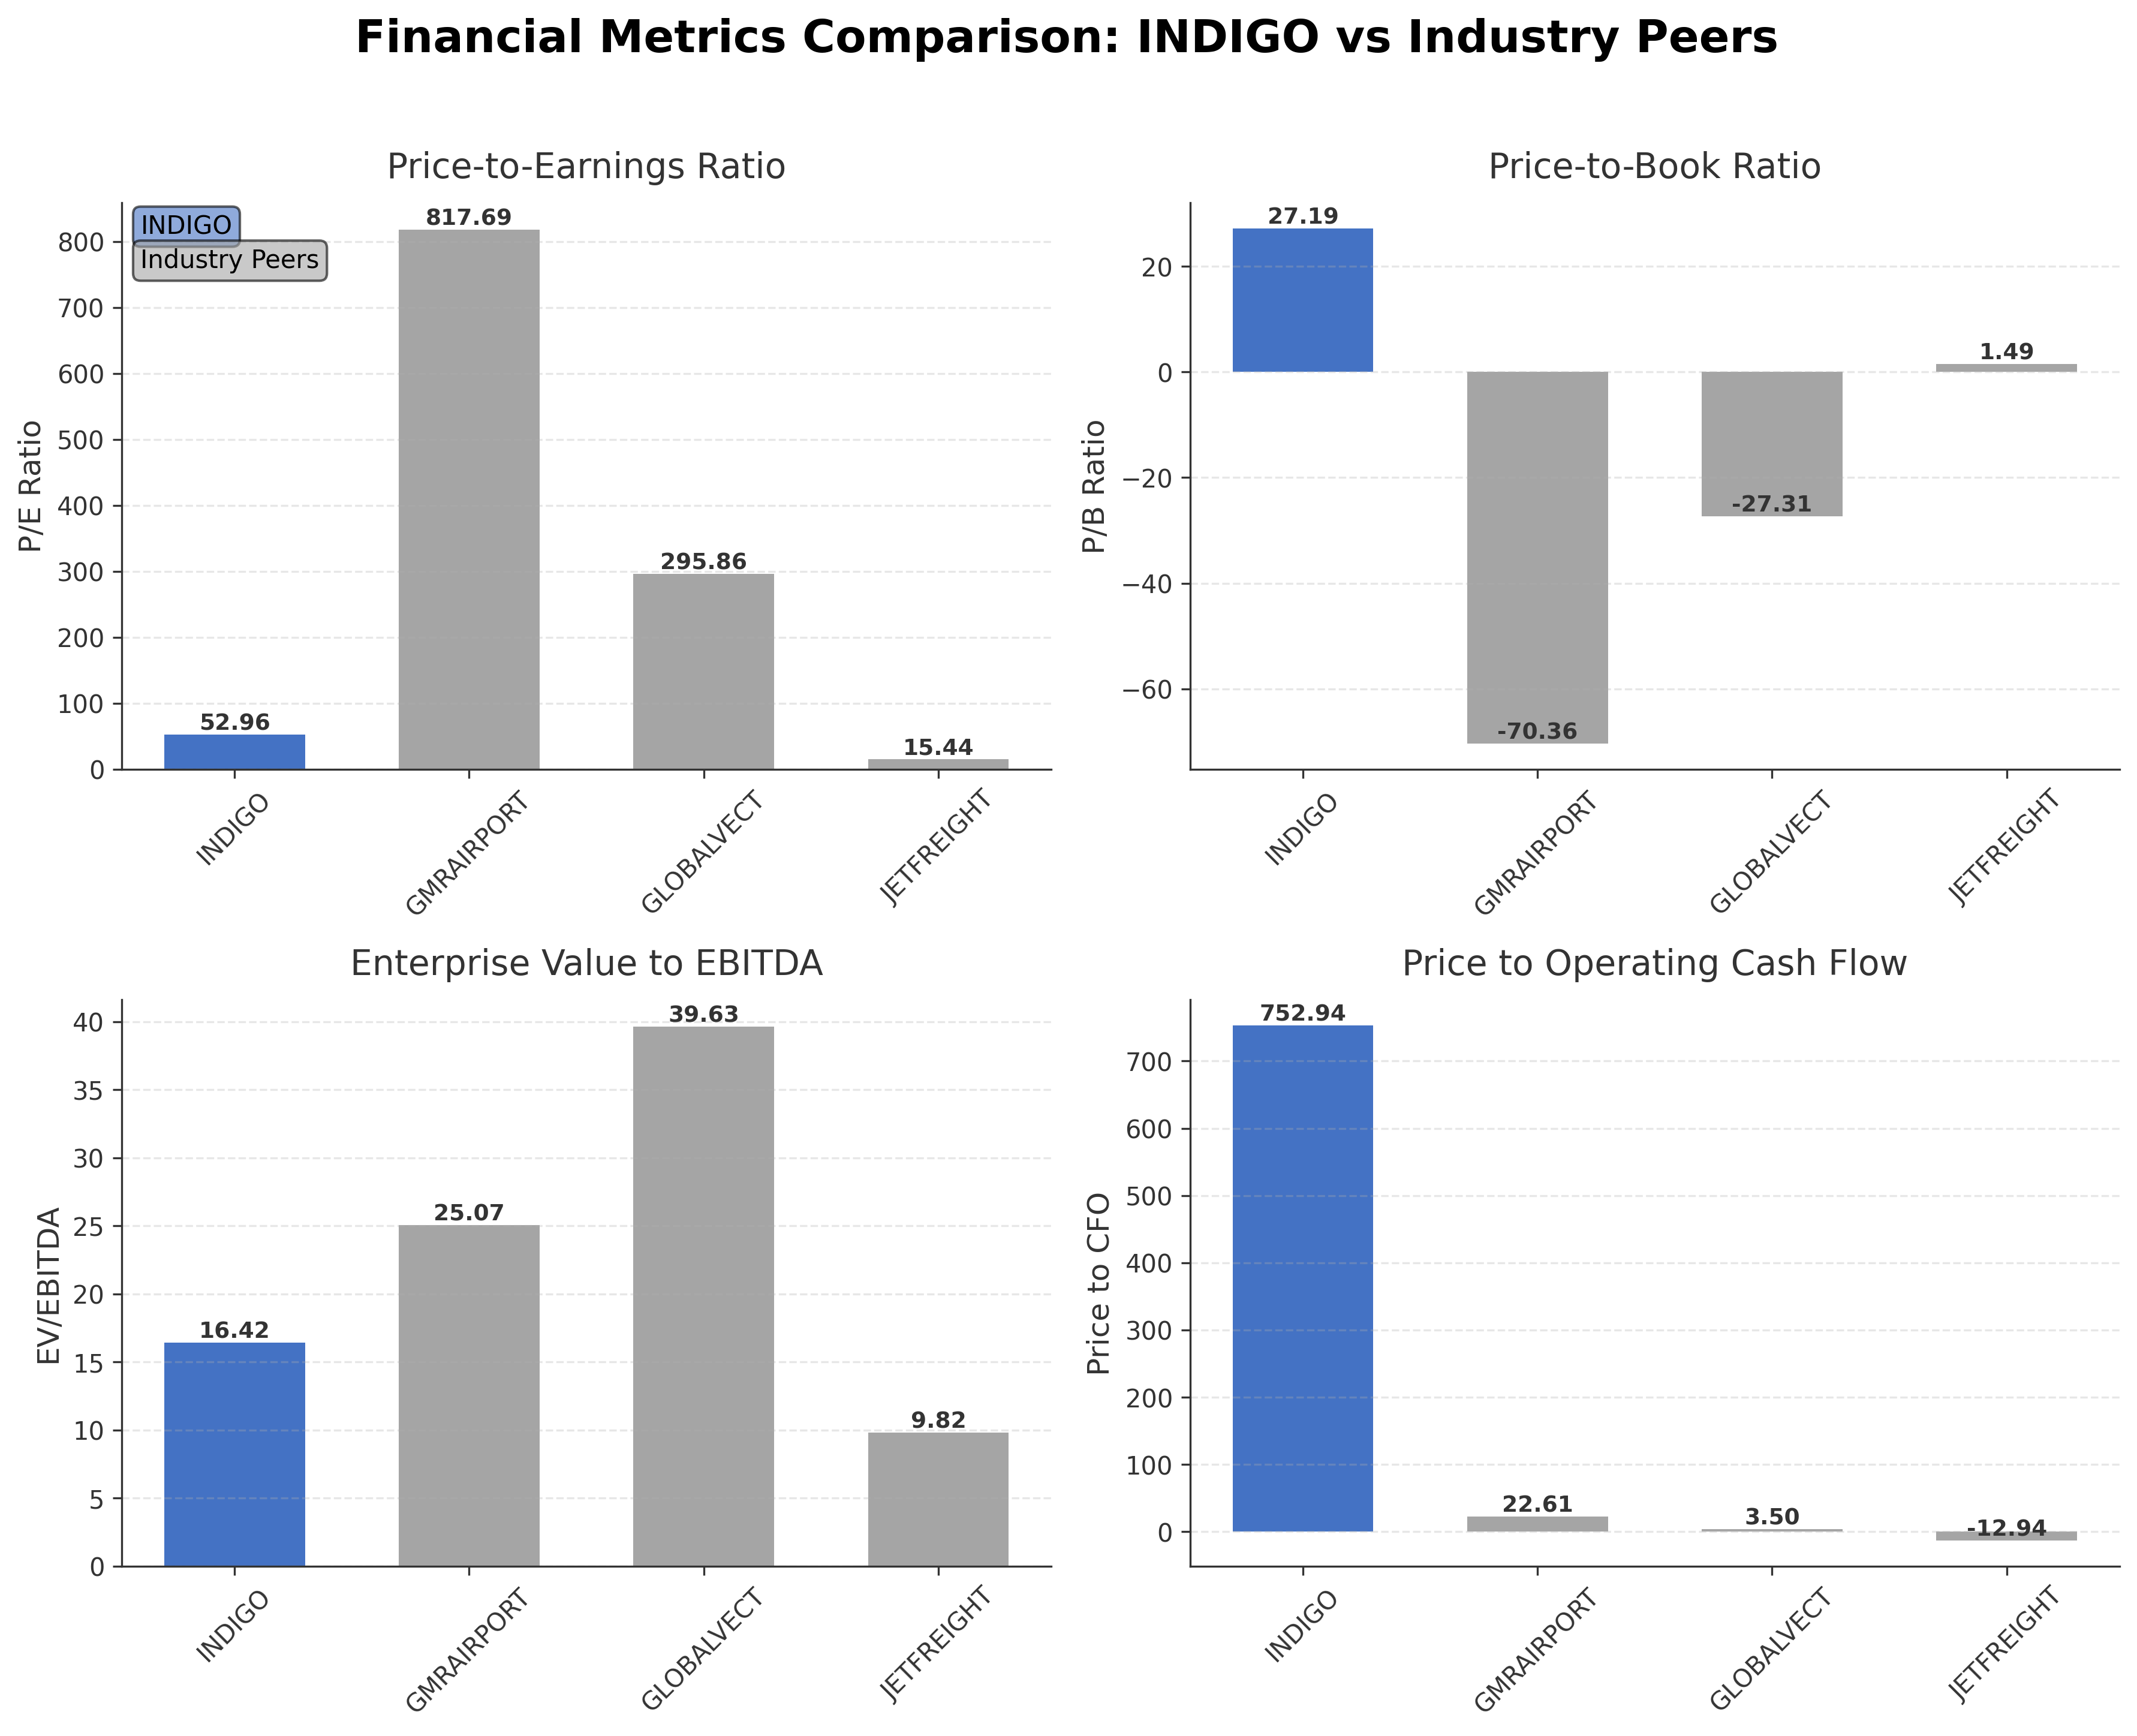
| Company Name | Market Cap | P/E Ratio | P/B Ratio | EV/EBITDA | Price to CFO |
|---|---|---|---|---|---|
| InterGlobe Aviation Ltd. | ₹1.93T | 52.96 | 27.19 | 16.42 | 752.94 |
| GMR Airports Ltd | ₹1.10T | 817.69 | -70.36 | 25.07 | 22.61 |
| Global Vectra Helicorp Ltd. | ₹2.21B | 295.86 | -27.31 | 39.63 | 3.50 |
| Jet Freight Logistics Ltd. | ₹1.05B | 15.44 | 1.49 | 9.82 | -12.94 |
Comparison Analysis: InterGlobe Aviation Ltd. holds the largest market capitalization among its peers at ₹1.93 trillion and exhibits a high trailing P/E ratio of 52.96, reflecting elevated valuation expectations compared to Jet Freight Logistics Ltd.'s more modest P/E of 15.44. The company's P/B ratio of 27.19 is significantly higher than peers, indicating a premium valuation relative to book value. Its EV/EBITDA of 16.42 is lower than GMR Airports Ltd. and Global Vectra Helicorp Ltd., suggesting relatively better operational earnings coverage. However, InterGlobe's return on equity is notably negative at -34.23%, contrasting with Jet Freight's positive 10.07%, highlighting challenges in profitability. The price to cash flow ratio is substantially elevated for InterGlobe, indicating potential cash flow concerns relative to its stock price. Overall, InterGlobe Aviation is valued at a premium but faces profitability headwinds compared to regional industry peers.
Financial Metrics Comparison with Peers
Financial Statements
Comprehensive financial data including income, balance sheet, and cash flow metrics
Income Statement
| fiscal_date | 2026-03-31 | 2025-03-31 | 2024-03-31 | 2023-03-31 | 2022-03-31 |
|---|---|---|---|---|---|
| Sales | 827.09B | 808.03B | 673.87B | 536.08B | 259.31B |
| Cost Of Goods | 685.11B | 627.15B | 540.16B | 467.77B | 270.55B |
| Gross Profit | 141.98B | 180.88B | 133.71B | 68.30B | -11.24B |
| Operating Expense Selling General And Administrative | 7.59B | 5.64B | 4.74B | 4.28B | 3.42B |
| Operating Expense Other Operating Expenses | 49.50B | 70.92B | 33.67B | 25.46B | 24.56B |
| Operating Income | 102.83B | 109.96B | 107.19B | 44.26B | -35.80B |
| Non Operating Interest Income | 19.65B | 16.21B | 11.76B | 4.84B | 2.02B |
| Non Operating Interest Expense | 58.91B | 50.80B | 41.69B | 31.20B | 23.58B |
| Pretax Income | -19.61B | 75.93B | 80.49B | -3.04B | -61.54B |
| Income Tax | 4.33B | 3.35B | -1.23B | 14.04M | 81.61M |
| Net Income | -23.94B | 72.58B | 81.72B | -3.06B | -61.62B |
| Eps Basic | -61.88 | 187.93 | 211.84 | -7.93 | -160.01 |
| Eps Diluted | -61.88 | 187.67 | 211.61 | -7.93 | -160.01 |
| Basic Shares Outstanding | 386.55M | 386.23M | 385.78M | 385.40M | 385.09M |
| Diluted Shares Outstanding | 386.55M | 386.23M | 385.78M | 385.40M | 385.09M |
| Ebit | 39.30B | 126.73B | 122.18B | 28.16B | -37.96B |
| Ebitda | 141.69B | 213.54B | 177.14B | 74.92B | 12.73B |
| Net Income Continuous Operations | -19.61B | 75.93B | 80.49B | -3.04B | -61.54B |
| Minority Interests | 17.00M | 0.00 | 0.00 | 0.00 | 0.00 |
| Preferred Stock Dividends | 0.00 | 0.00 | 0.00 | 0.00 | 0.00 |
Data provided by Twelve Data
Balance Sheet
| fiscal_date | 2026-03-31 | 2025-03-31 | 2024-03-31 | 2023-03-31 | 2022-03-31 |
|---|---|---|---|---|---|
| Cash And Cash Equivalents | 13.24B | 10.73B | 6.95B | 12.68B | 10.15B |
| Accounts Receivable | 6.00B | 7.40B | 6.43B | 5.20B | 3.33B |
| Total Assets | 1360.02B | 1158.43B | 822.25B | 591.70B | 459.63B |
| Total Liabilities | 1290.15B | 1064.75B | 802.28B | 654.16B | 519.51B |
| Long Term Debt | 644.71B | 546.68B | 378.63B | 322.25B | 254.75B |
| Shareholders Equity | 69.87B | 93.68B | 19.96B | -62.47B | -59.88B |
Data provided by Twelve Data
Cash Flow Statement
| fiscal_date | 2026-03-31 | 2025-03-31 | 2024-03-31 | 2023-03-31 | 2022-03-31 |
|---|---|---|---|---|---|
| Operating Activities Net Income | -19.61B | 75.93B | 80.49B | -3.04B | -61.54B |
| Operating Activities Stock Based Compensation | 26.00M | 810.00M | 433.32M | 172.45M | 342.04M |
| Operating Activities Other Non Cash Items | 57.08B | 34.37B | 29.63B | 25.91B | 20.80B |
| Operating Activities Accounts Receivable | 1.24B | -1.06B | -1.20B | -2.05B | -1.20B |
| Operating Activities Other Assets Liabilities | -36.18B | -44.01B | -25.68B | -6.92B | -5.58B |
| Operating Activities Operating Cash Flow | 234.70B | 66.05B | 83.68B | 14.08B | -47.17B |
| Investing Activities Purchase Of Investments | -728.86B | -452.70B | -455.69B | -465.42B | -380.62B |
| Investing Activities Sale Of Investments | 718.46B | 337.82B | 346.12B | 422.18B | 392.13B |
| Investing Activities Other Investing Activity | -5.62B | -8.10B | -9.19B | 6.74B | 6.01B |
| Investing Activities Investing Cash Flow | -16.02B | -138.91B | -123.85B | -35.42B | 14.11B |
| Financing Activities Short Term Debt Issuance | 63.00M | -917.00M | -2.82B | -16.73B | N/A |
| Financing Activities Common Stock Issuance | 216.00M | 418.00M | 417.40M | 223.66M | 276.55M |
| Financing Activities Common Dividends | -3.87B | N/A | N/A | N/A | N/A |
| Financing Activities Financing Cash Flow | -3.59B | -499.00M | -2.40B | -33.23B | 13.99B |
| End Cash Position | 13.24B | 10.73B | 6.95B | 12.68B | 10.15B |
| Free Cash Flow | 217.60B | 225.47B | 201.15B | 121.58B | 17.44B |
| Investing Activities Capital Expenditures | N/A | -15.93B | -5.08B | 1.09B | -3.40B |
| Financing Activities Long Term Debt Issuance | N/A | N/A | N/A | 98.33B | 152.36B |
| Financing Activities Long Term Debt Payments | N/A | N/A | N/A | -115.06B | -138.65B |
| Financing Activities Other Financing Charges | N/A | N/A | N/A | N/A | N/A |
Data provided by Twelve Data
Technical Analysis
Key Insights
- The current trend shows mixed price action with the stock trading near its 50-day moving average at INR 4,887 and 200-day moving average at INR 4,911, indicating consolidation around these key levels.
- Key support is identified near the 52-week low of INR 3,895, while resistance is observed close to the 52-week high of INR 6,232, framing the current trading range.
- The stock is hovering slightly above the 50-day and 200-day moving averages but below the 10-day moving average, suggesting short-term momentum is less robust than medium-term trends.
- Momentum indicators show a moderate Relative Strength Index (RSI) around neutral levels, a MACD with mixed signals, and stochastic oscillators indicating potential volatility without clear directional bias.
- Multi-timeframe analysis reveals that daily charts show consolidation, weekly charts indicate sideways movement, and monthly charts reflect a longer-term uptrend albeit with recent pullbacks.
- Potential market scenarios include continued range-bound trading between support and resistance levels, with possible volatility spikes driven by earnings reports and macroeconomic factors.
Trending News
1. Headline: Interglobe Aviation shares fall 2.02% in early trade- Moneycontrol.com
Summary: With the stock trading at Rs 5,225.50, Interglobe Aviation is currently experiencing a decline in early trade, with overall investor sentiment on the stock identified as Very Bullish. ... Discover the latest Business News, Sensex, and Nifty updates.
Sentiment: negative
2. Headline: IndiGo in Early Talks with Embraer for Large Regional Jet Order - Bloomberg
Summary: InterGlobe Aviation Ltd., the parent company of India’s biggest airline IndiGo, is in talks with Embraer SA over a possible large regional jet order, according to people familiar with the matter. HomeBTV+Market DataOpinionAudioOriginalsMagazineEvents · NewsMarketsEconomicsTechnologyPoliticsGreenCryptoAI...
Sentiment: neutral
Summary: Interglobe Avi Share Price: Find the latest news on Interglobe Avi Stock Price. Get all the information on Interglobe Avi with historic price charts for NSE / BSE. Experts & Broker view also get the Interglobe Avi Ltd. buy/sell tips detailed news, announcements, Forecasts, Analysts, Valuation, ...
Sentiment: neutral
4. Headline: Interglobe Aviation Ltd Technical Momentum Shifts Signal Bullish Outlook Amid Mixed Indicators
Summary: Interglobe Aviation Ltd, a leading player in the airline sector, has exhibited a notable shift in price momentum, moving from a mildly bullish to a bullish technical trend. Despite a mixed bag of technical indicator signals, the stock’s recent performance and underlying metrics suggest a ...
Sentiment: positive
Summary: Indian equity markets closed mixed on August 5, with the Nifty 50 down 0.18% and the Sensex down 0.09%. Weakness in banking and IT stocks outweighed gains in metals and autos. The RBI held the repo rate steady as inflation concerns persist amid geopolitical tensions.
Sentiment: negative
Powered by Brave
Recent Updates
News Summary
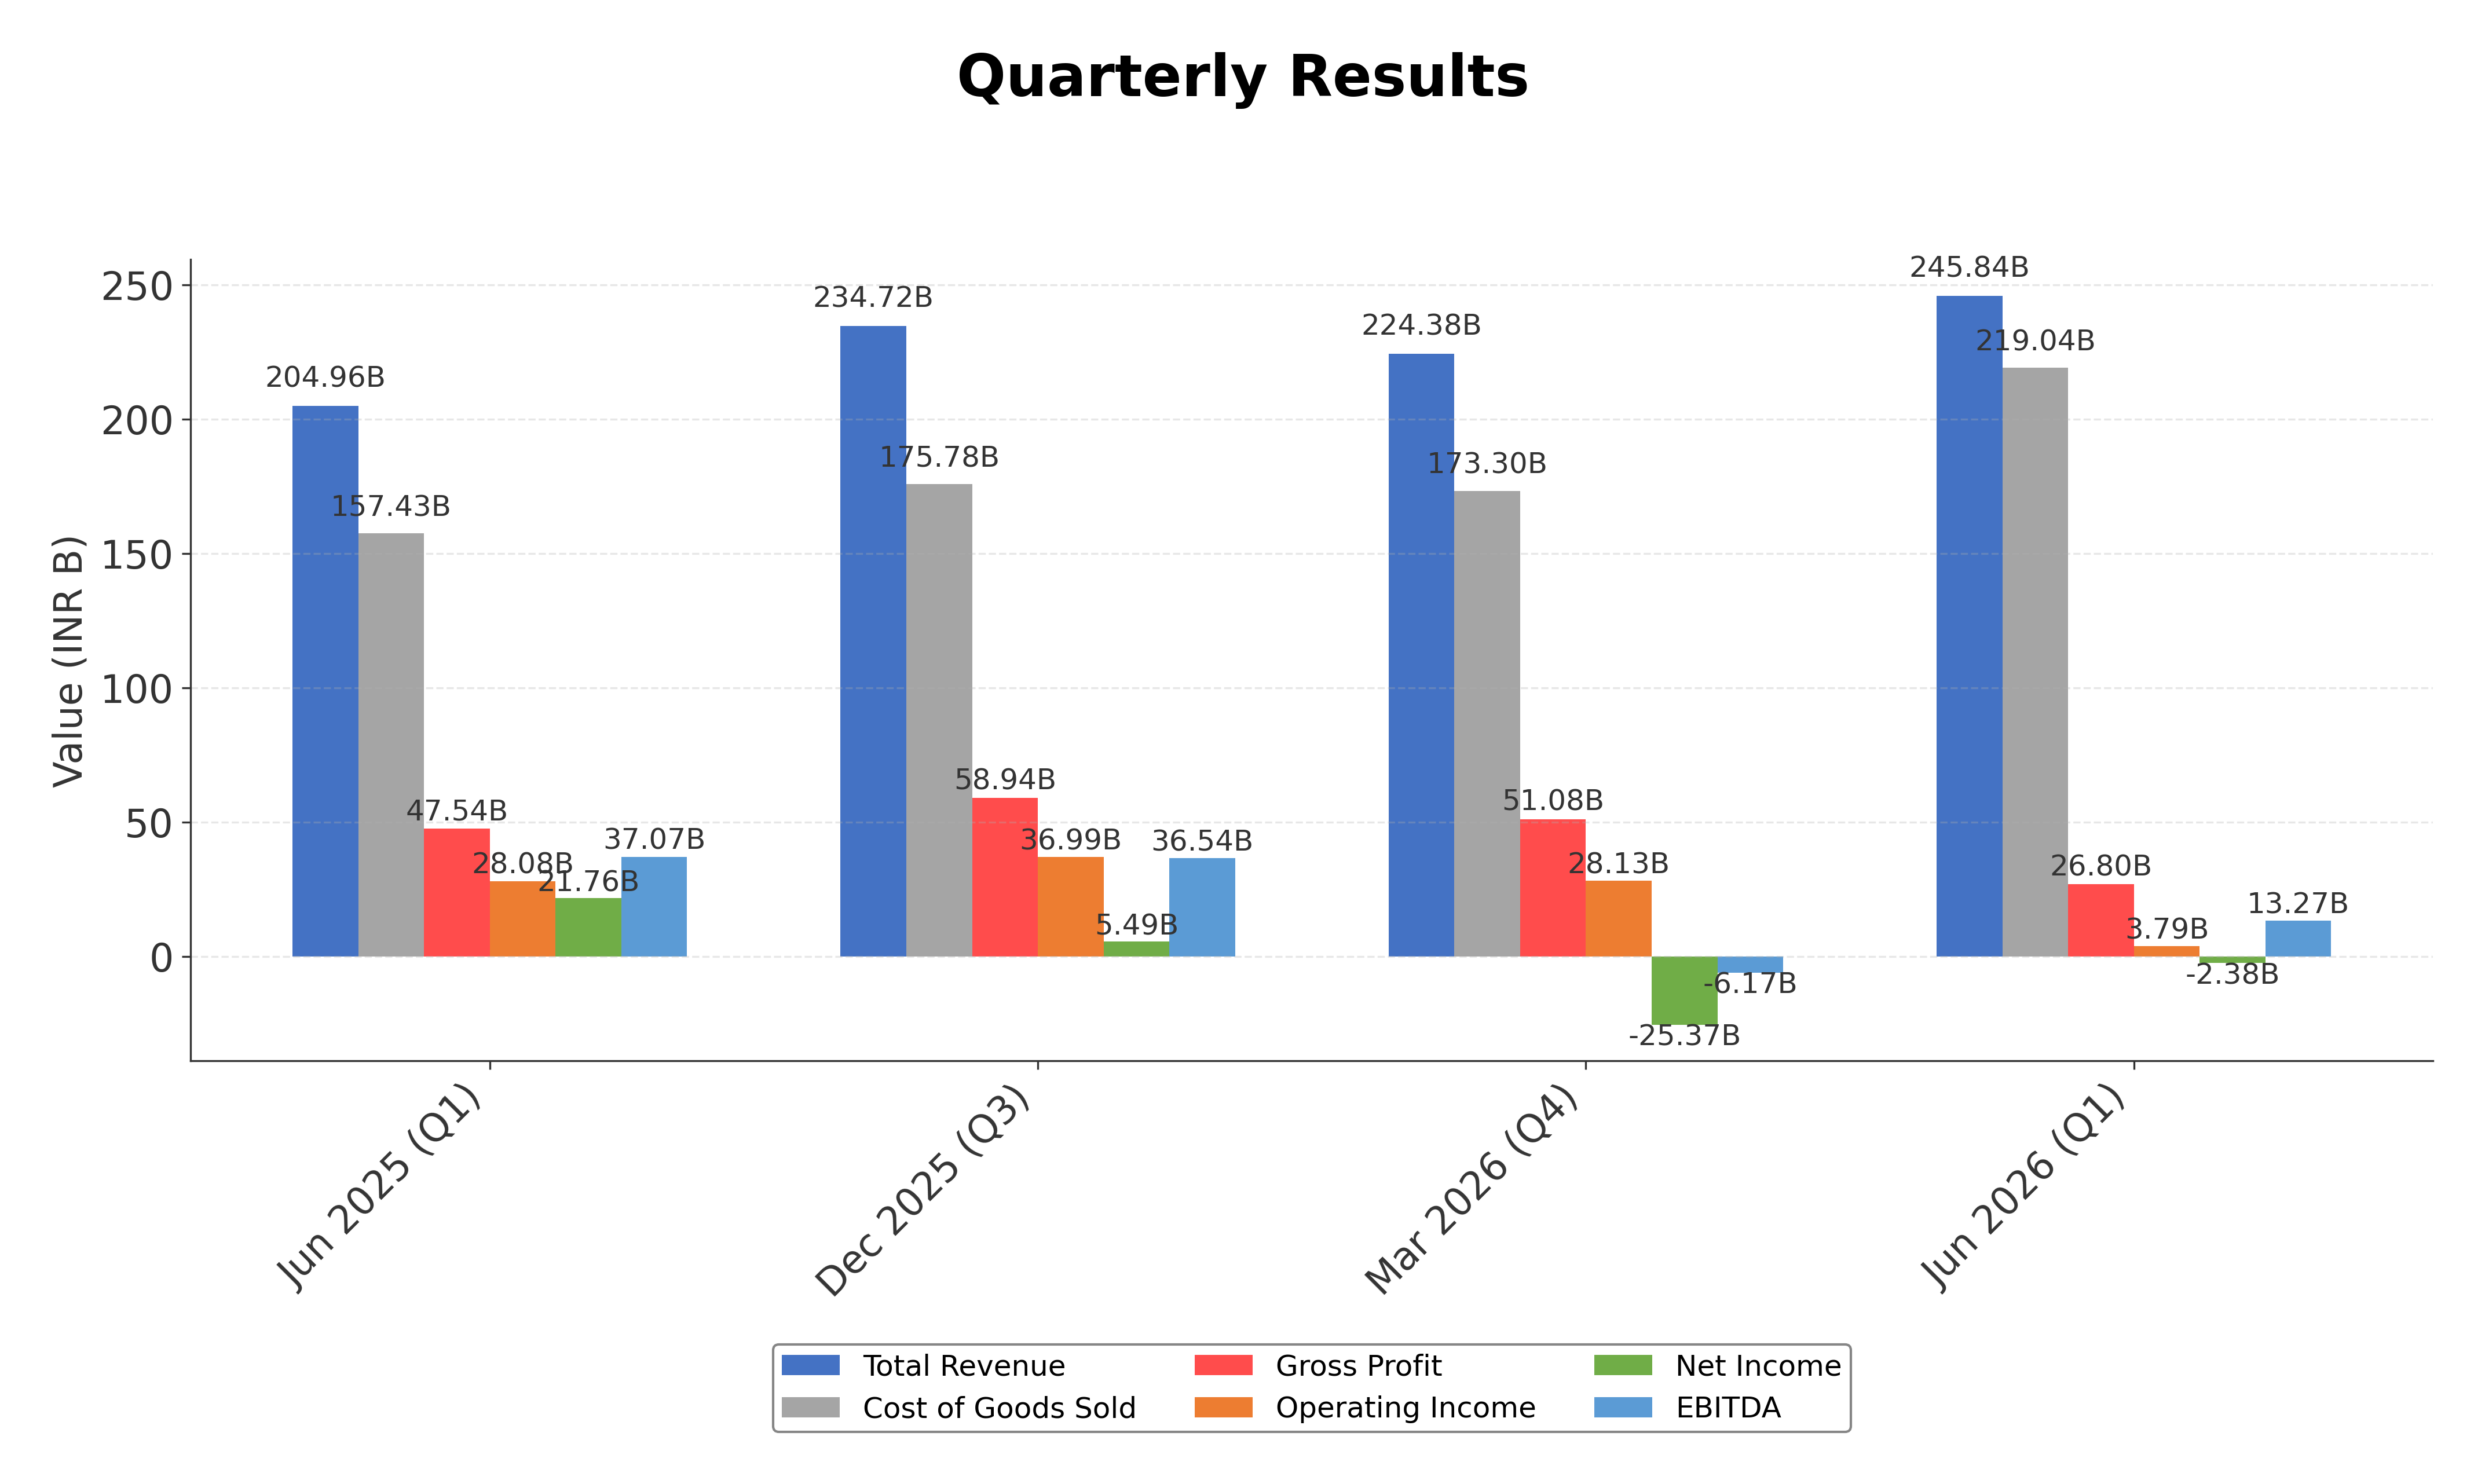
As of July 23, 2026. InterGlobe Aviation Ltd reported its Q1 FY 2027 earnings, highlighting a net loss of INR 2,380 million compared to a profit in the prior year quarter, driven by a challenging cost environment and elevated fuel prices. Total income grew 19% year-over-year to INR 256 billion, supported by a 21.3% yield growth and a 1% increase in passengers served, totaling 31.3 million. The EBITDA margin declined to 15.6% from 28% year-over-year due to a 63% quarter-on-quarter increase in fuel costs amid geopolitical tensions. The company is expanding its network with new flights to Jamnagar and operations from Jewa Airport in Noida, enhancing connectivity. Management expects flat capacity growth in Q2 FY 2027 with continued focus on yield and load factors amid market volatility.
News Sentiment
The overall sentiment from recent updates is mixed to cautiously positive. While the company faces significant headwinds from rising fuel costs and geopolitical disruptions leading to a net loss and margin compression, operational metrics such as passenger growth, yield improvement, and network expansion reflect resilience and strategic adaptation. Institutional investor interest remains steady, and management guidance indicates prudent capacity management. The balance of positive operational developments against cost pressures results in a neutral to slightly optimistic tone regarding near-term performance.
Source List
- https://finance.yahoo.com/markets/stocks/articles/interglobe-aviation-ltd-bom-539448-190242620.html
- https://www.alphaspread.com/security/nse/indigo/investor-relations
- https://quartr.com/companies/interglobe-aviation-limited_15273
- https://www.icicidirect.com/research/equity/rapid-results/interglobe-aviation-ltd
- https://www.sharekhan.com/stock/interglobe-aviation-ltd
Analytical Overview
Analysis Summary
InterGlobe Aviation's valuation metrics show a trailing P/E ratio of 52.96, substantially above the industry average of 52.96, with a forward P/E of 21.42 indicating market expectations of earnings recovery. The high price-to-book ratio of 27.19 suggests the stock is trading at a premium relative to its net asset value. Revenue growth of 6.2% quarterly and a 21.3% yield increase demonstrate a positive growth trajectory, although net income and earnings growth have been negative, reflecting operational challenges. Cash flow trends are mixed, with positive operating cash flow of INR 2.56 billion but negative levered free cash flow of INR -23.9 billion, indicating liquidity pressures. The company's debt-to-equity ratio is elevated at 866.46, highlighting financial leverage concerns. Sector-specific challenges include volatile fuel prices and geopolitical risks impacting capacity deployment, while opportunities arise from network expansion and increasing international market share. Given the Indian market context, regulatory developments such as fuel price stabilization funds and evolving aviation policies will be critical factors.
Overall Business and Market Assessment
Supporting Factors: IndiGo's market leadership in India's low-cost airline sector, robust passenger growth, and strategic network expansions
Risk Factors: the high debt levels, volatile fuel costs, and recent earnings volatility that have pressured profitability
SWOT Analysis
Strengths
- Market leader in India's low-cost airline segment with a large and modern fleet.
- Strong brand recognition and extensive domestic and international network.
- Robust passenger growth and yield improvements in recent quarters.
- Significant cash reserves supporting operational flexibility.
Weaknesses
- Negative return on equity and return on assets indicating profitability challenges.
- High debt-to-equity ratio reflecting elevated financial leverage.
- Negative free cash flow suggesting liquidity constraints.
- Volatile earnings growth with recent net losses reported.
Opportunities
- Expansion into regional jet markets through potential Embraer orders.
- Increasing international capacity share targeting 40% by 2030.
- Potential benefits from regulatory fuel price stabilization mechanisms.
- Growing demand for air travel in India supporting long-term growth.
Threats
- Rising and volatile fuel costs impacting operating margins.
- Geopolitical tensions causing airspace restrictions and capacity disruptions.
- Intense competition in the Indian and regional airline markets.
- Macroeconomic uncertainties affecting passenger demand and pricing power.
Company Description
InterGlobe Aviation Ltd., commonly known as IndiGo, operates as a leading airline company, offering both domestic and international air travel services. As India's largest airline by market share, IndiGo plays a pivotal role in connecting major and minor airports across the country, making air travel accessible to a broader audience. Its primary function is to provide safe, reliable, and efficient air transportation through a fleet of modern, fuel-efficient aircraft primarily consisting of Airbus models. IndiGo is known for its low-cost carrier business model, which emphasizes cost-effectiveness, punctuality, and customer service. This model allows the airline to maintain competitive pricing, attracting a diverse passenger base, including budget-conscious travelers and business professionals. IndiGo significantly impacts the aviation and tourism industries, contributing to increased mobility and economic growth within and beyond India. Its strategic operations and continuous expansion into new routes underpin IndiGo's status as a crucial player in the Asian aviation market, influencing both domestic travel dynamics and regional airline competition.