


Integra Essentia Ltd (ESSENTIA)
Stock Analysis Report
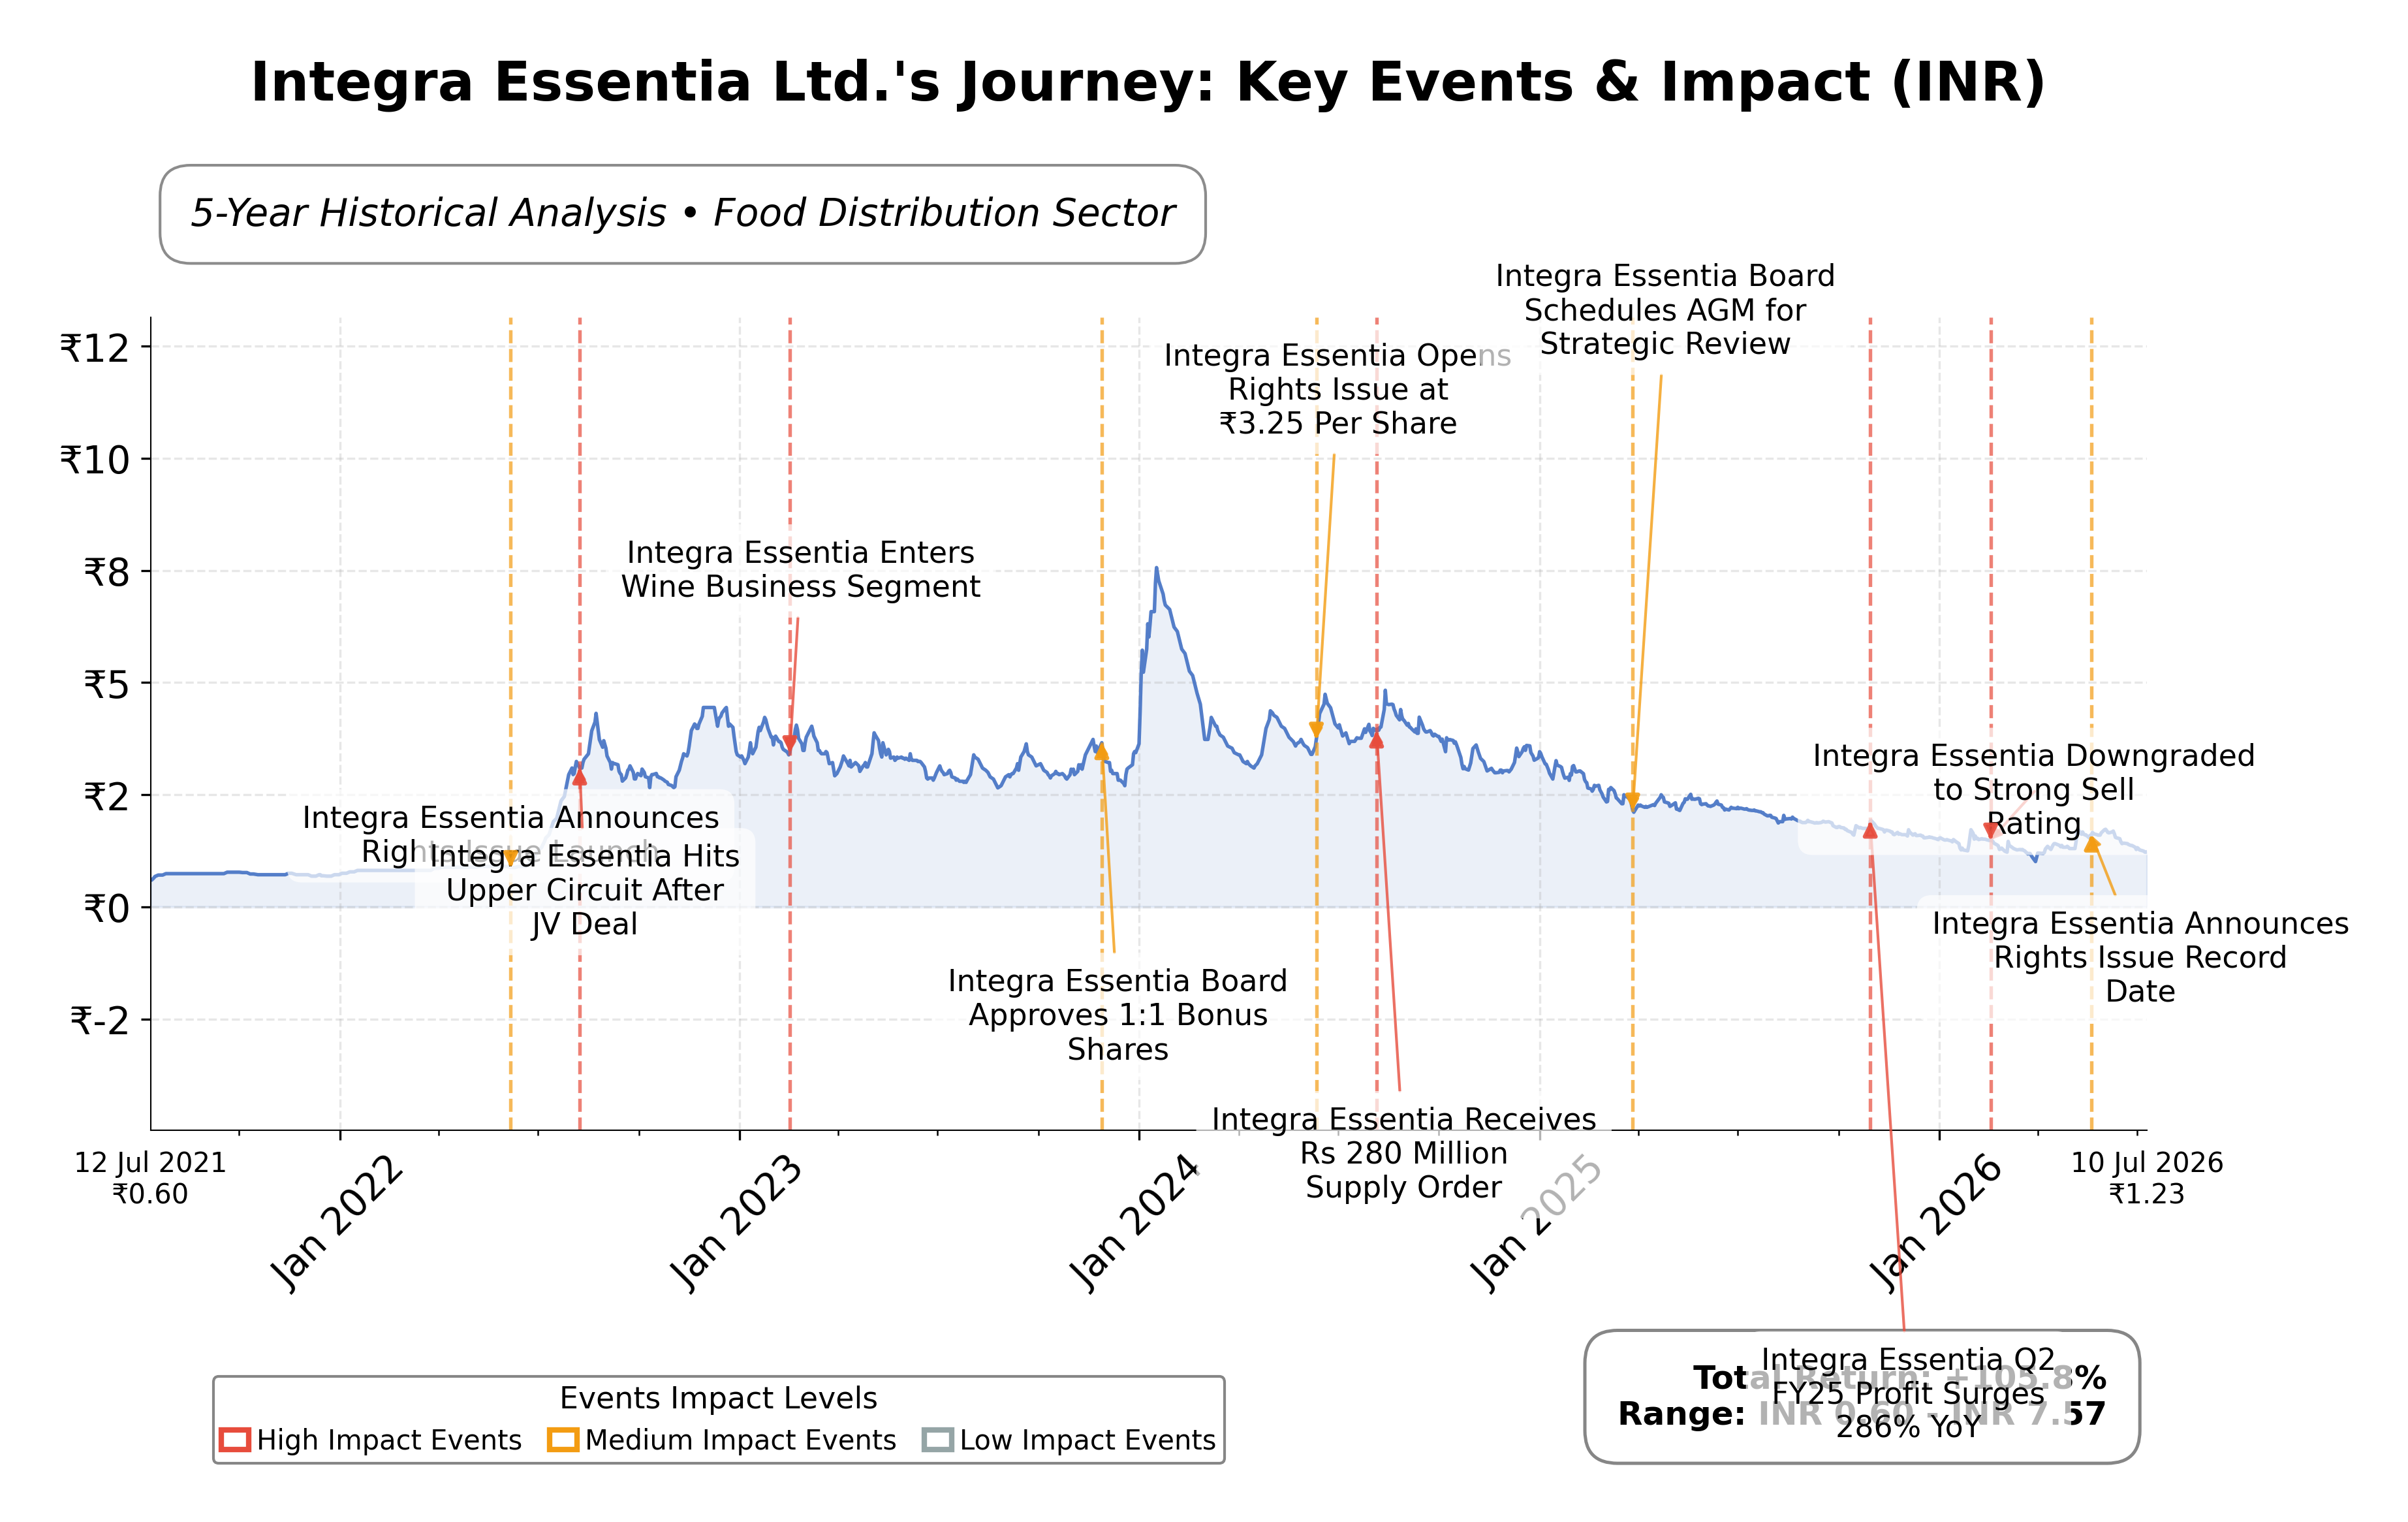
Stock Journey
Key Positives and Key Risks
Pros
- Integra Essentia Ltd. exhibits strong revenue growth of 34.2% year-over-year, indicating expanding business activity.
- The company maintains a solid current ratio of 2.99, reflecting good short-term liquidity to meet obligations.
Cons
- Operating margin is negative at -4.38%, highlighting operational inefficiencies impacting profitability.
- High debt-to-equity ratio of 25.66 indicates significant financial leverage and potential risk.
- Free cash flow is deeply negative at approximately INR -1.06 billion, suggesting cash generation challenges.
Disclosure: This information is for general awareness and does not constitute investment advice
Report Summary
Integra Essentia Ltd. operates primarily in the consumer defensive sector on the NSE exchange in India, focusing on food distribution, agriculture, infrastructure, and lifestyle products. The company acts as a trading intermediary, connecting producers of essential goods with distributors, wholesalers, and retailers. Its diversified business model spans agricultural initiatives, infrastructure development, and lifestyle product distribution, positioning it as a key player in essential goods supply chains within the Indian market.
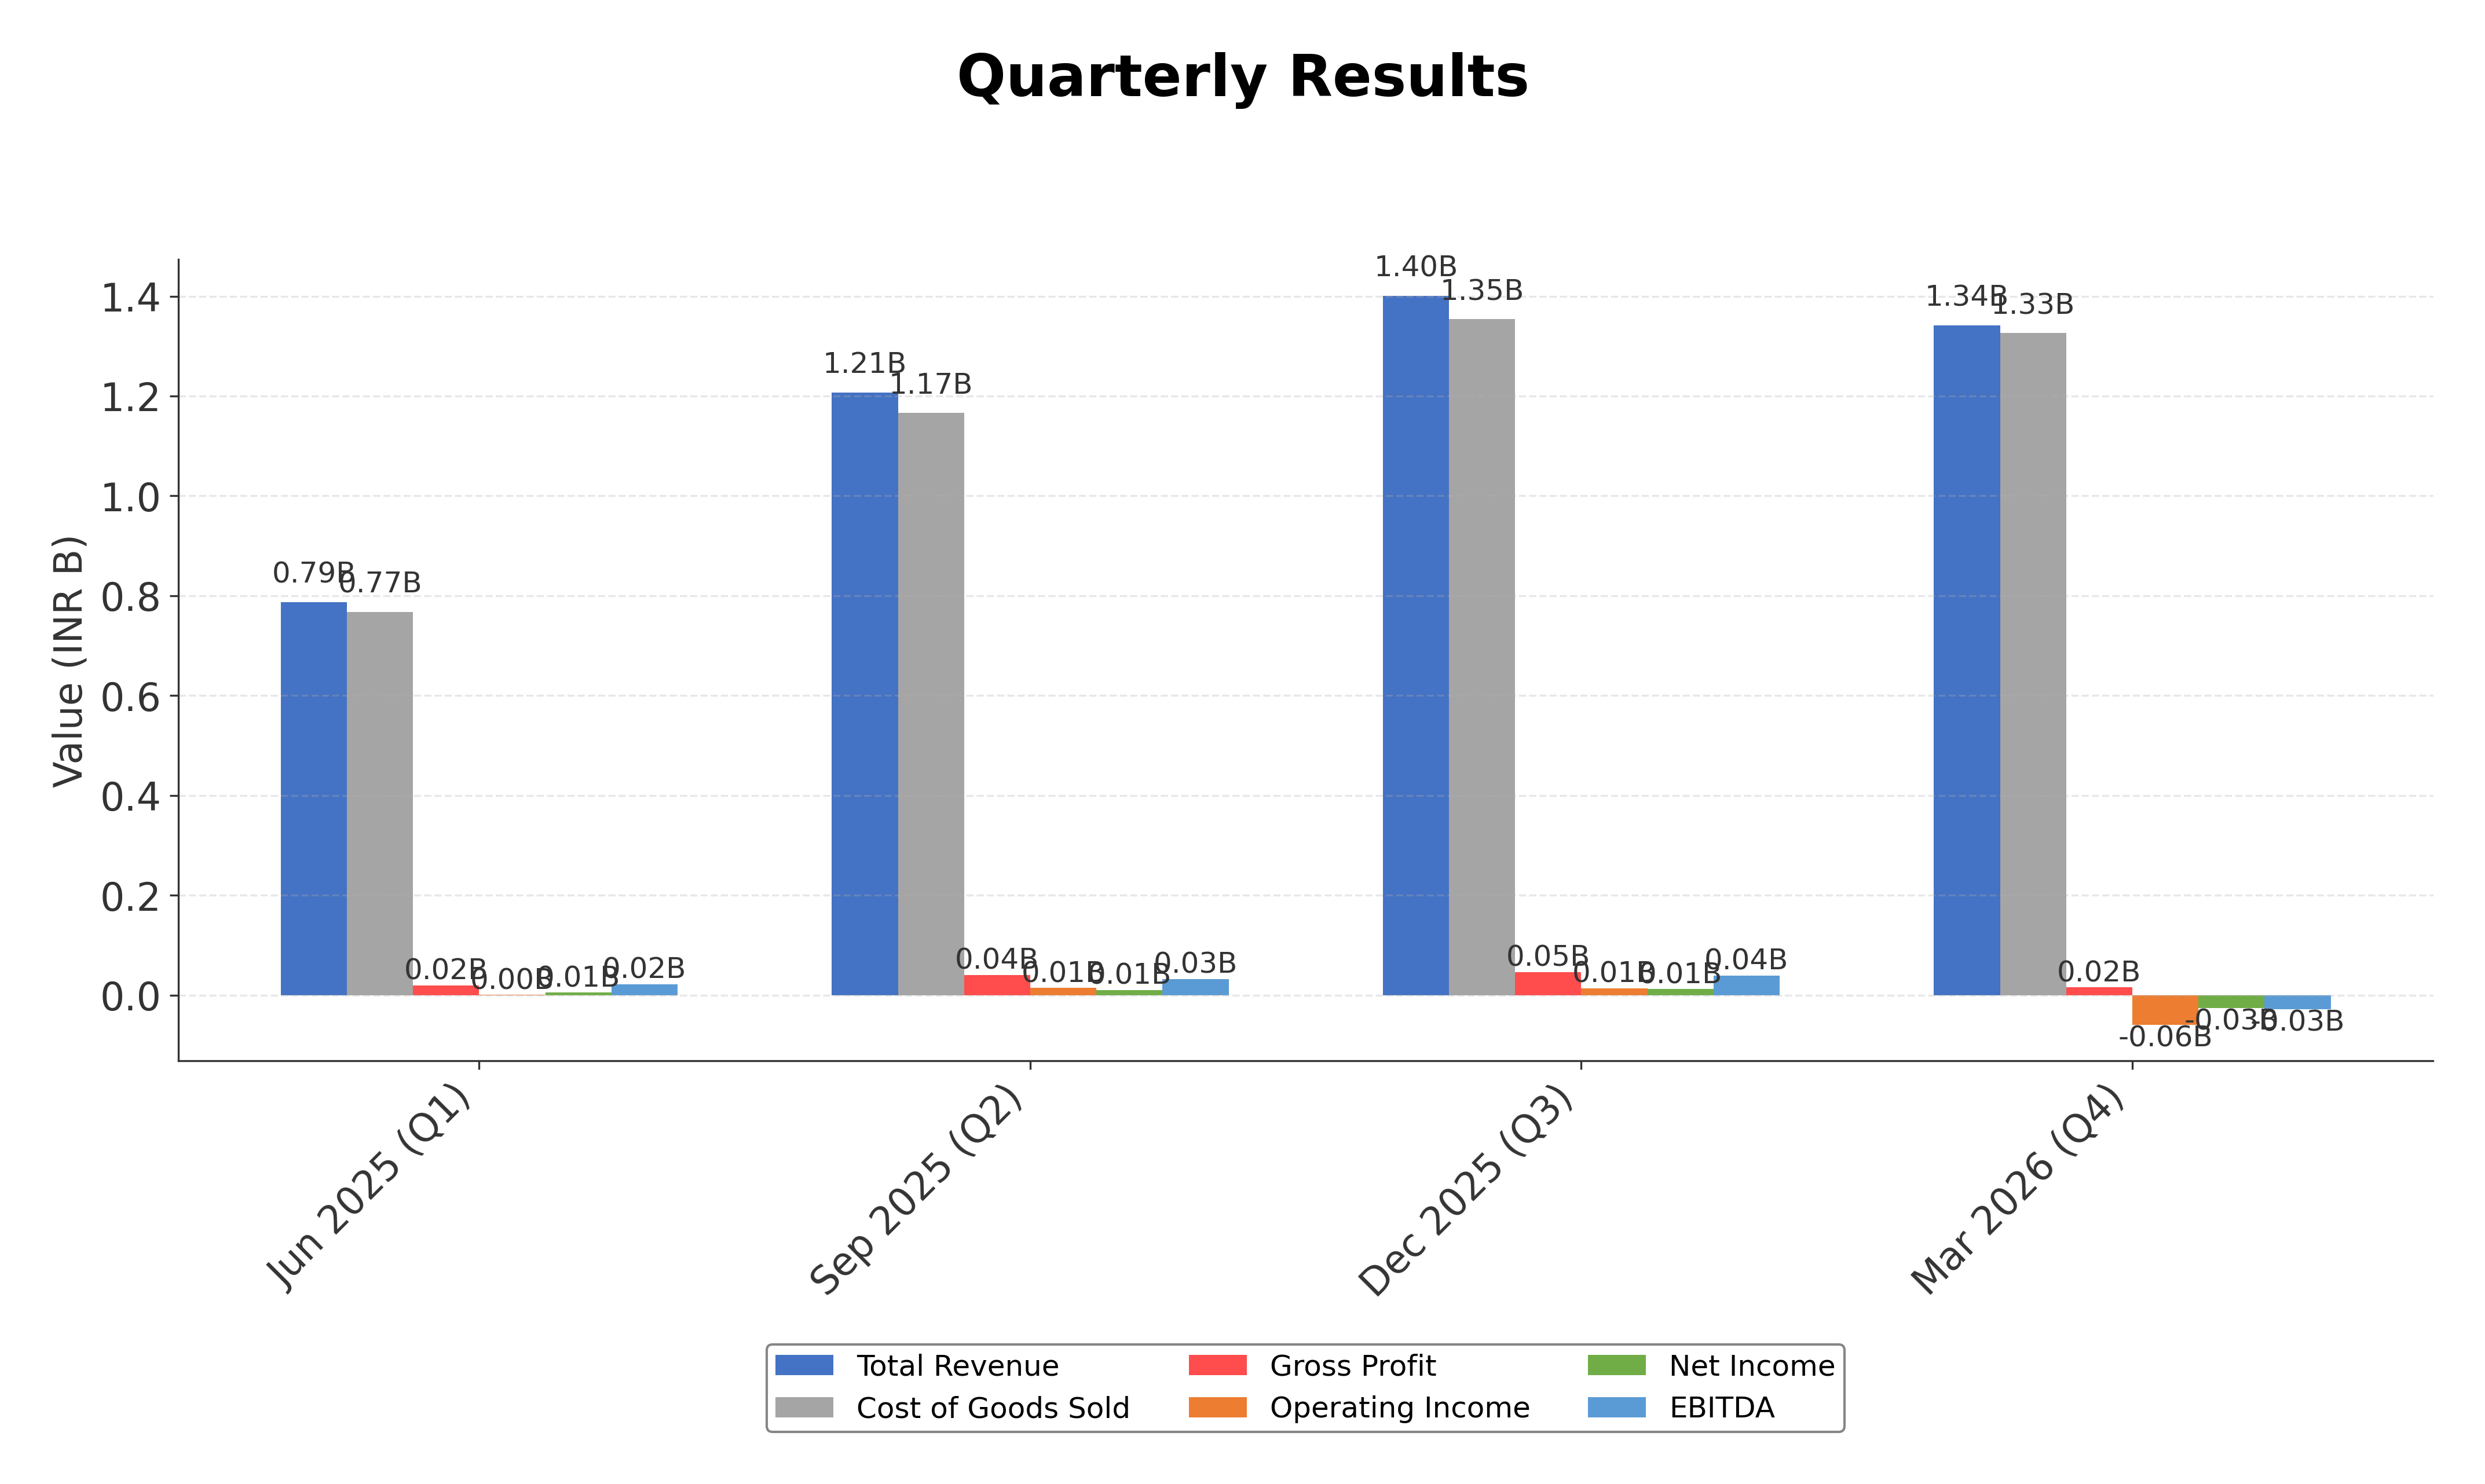
Financially, Integra Essentia reported trailing twelve months (TTM) revenue of approximately INR 4.74 billion, with a gross margin of 1.16%, an operating margin of -4.38%, and a net profit margin of 0.07%. The company’s return on equity (ROE) stands at 0.19%, and return on assets (ROA) is negative at -0.77%, indicating limited profitability and efficiency challenges. The operating cash flow and free cash flow are negative at INR -616.8 million and INR -1.06 billion respectively, reflecting cash generation difficulties despite revenue growth of 34.2% year-over-year.
Valuation metrics reveal a trailing price-to-earnings (P/E) ratio of 56.67, aligning with the industry average, while the price-to-book (P/B) ratio is below 1 at 0.92, suggesting the stock is trading near its book value. The enterprise value to EBITDA ratio is negative due to low profitability. Market capitalization is approximately INR 2.16 billion, with the stock currently priced at INR 1.23, near the lower end of its 52-week range of INR 1.01 to INR 2.19, indicating a significant decline of nearly 75% over the past year.
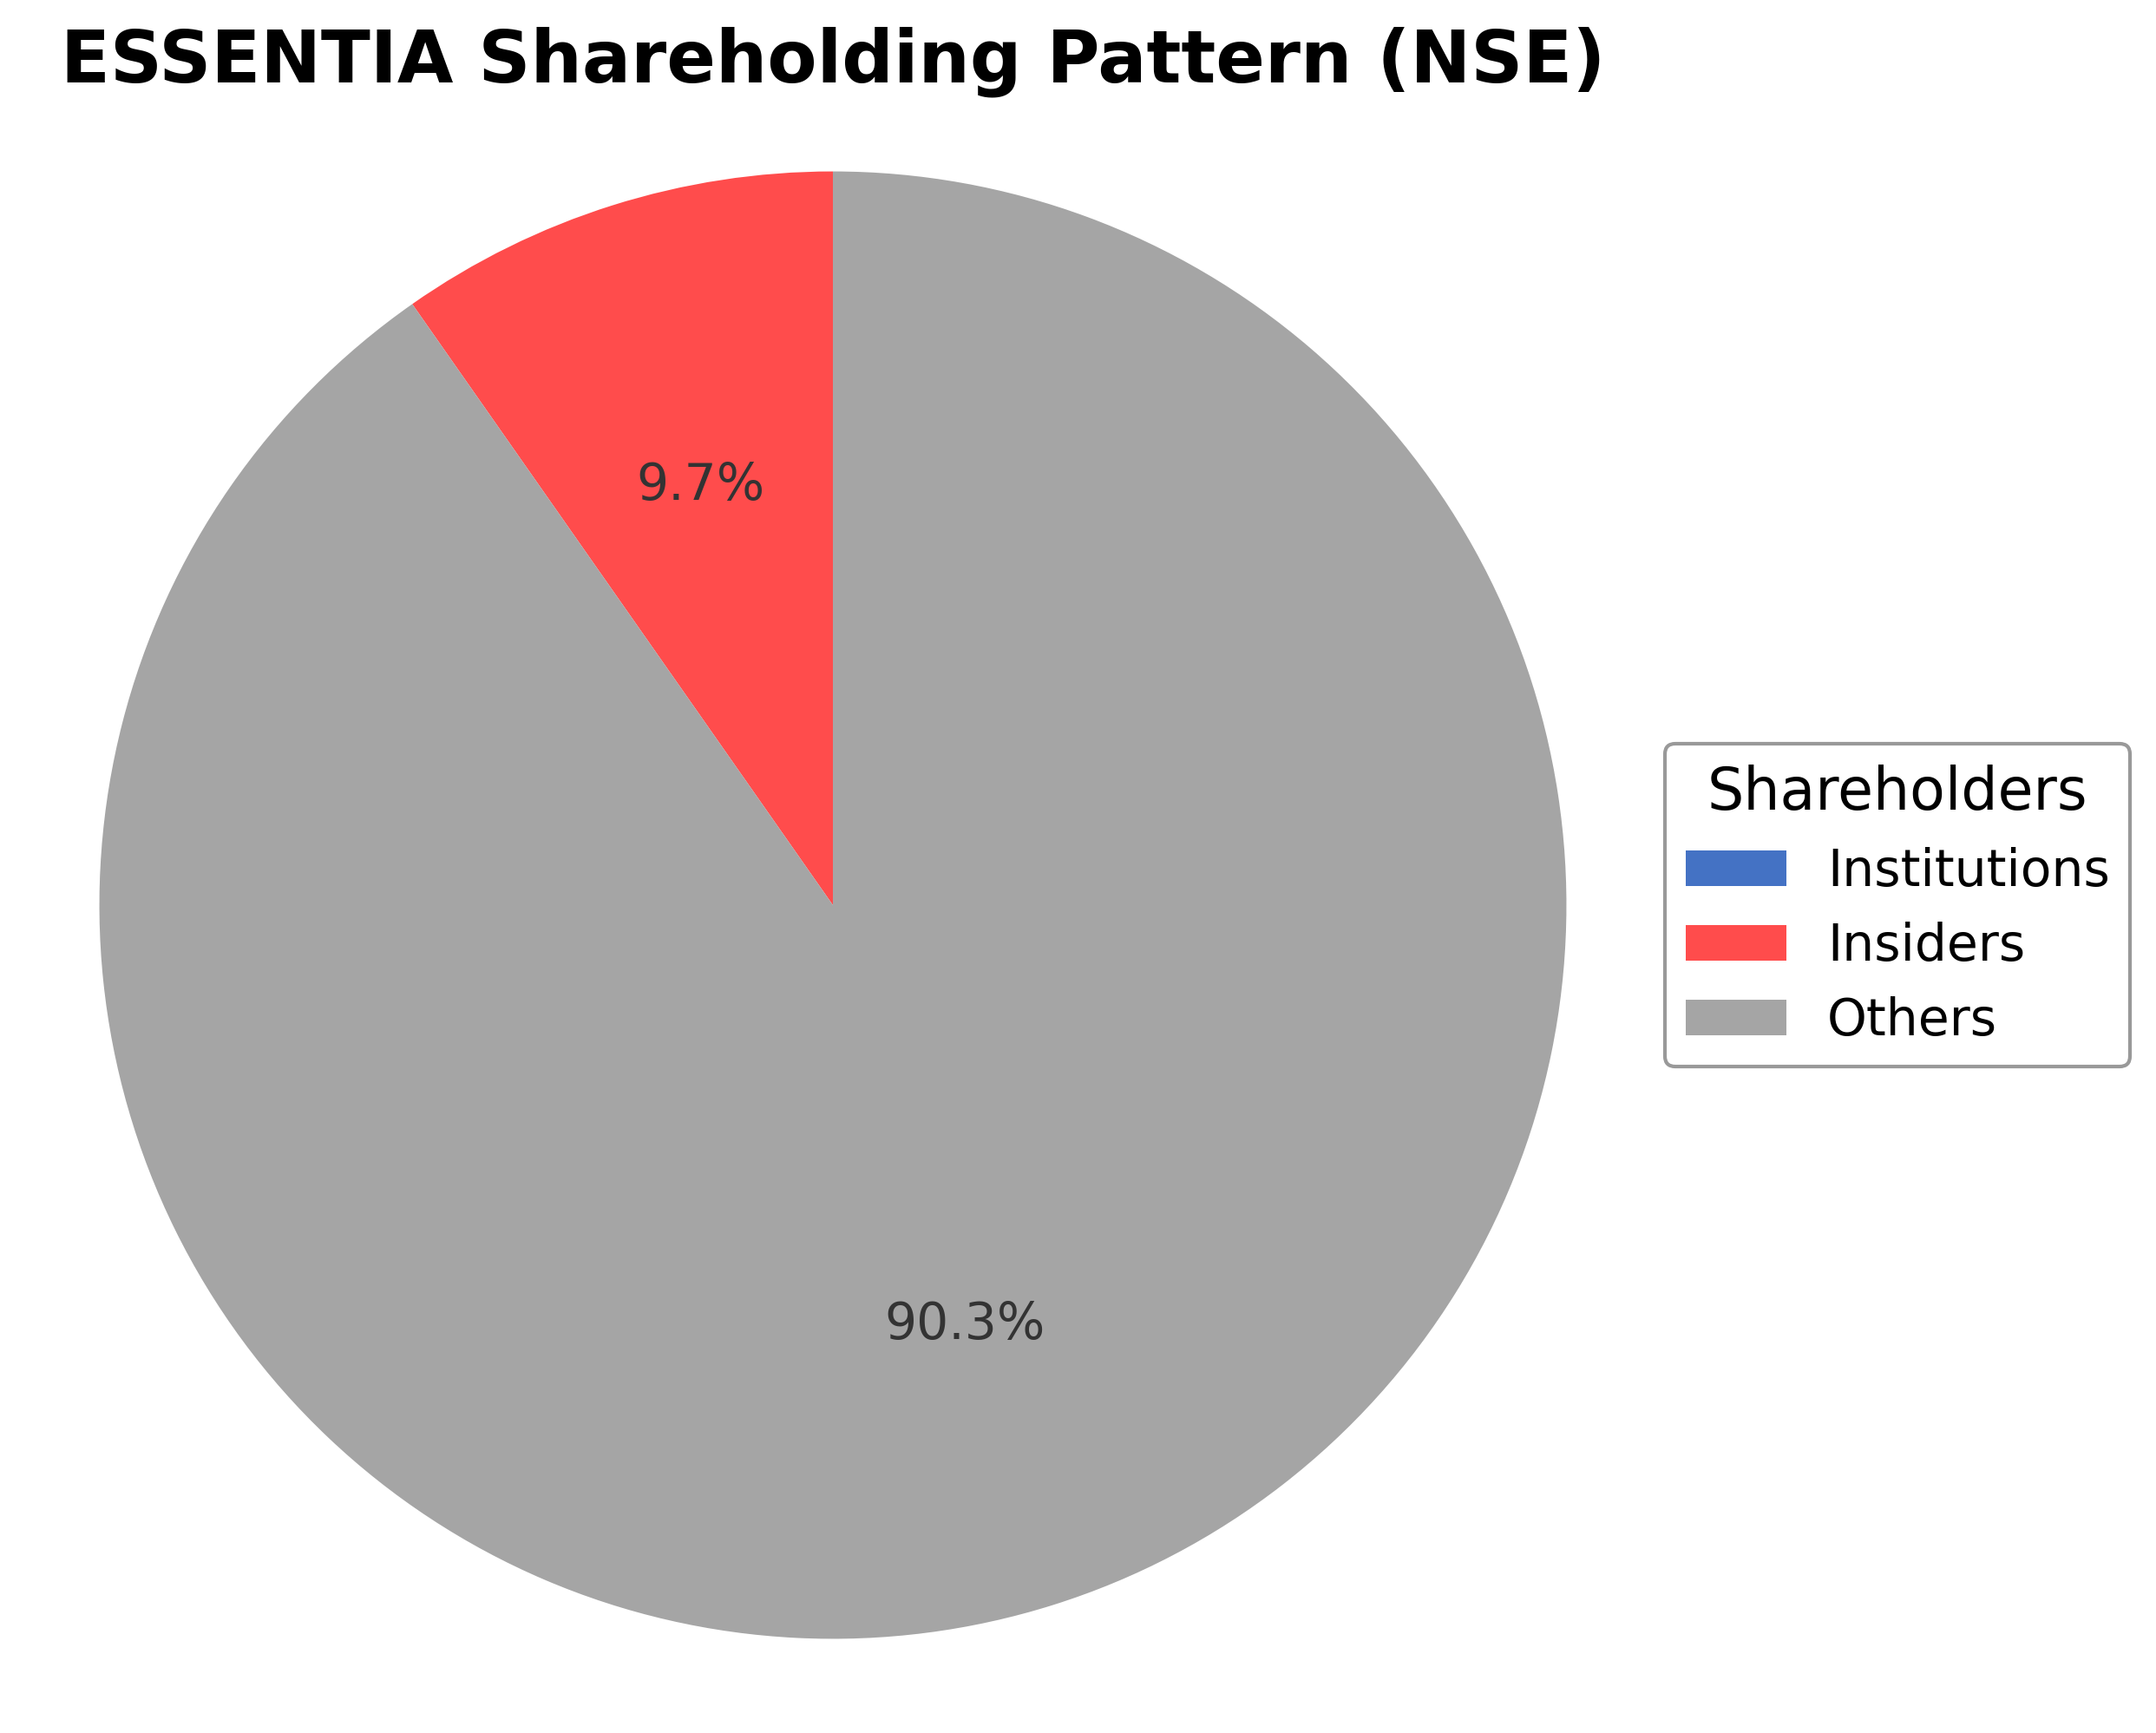
Key strengths include a strong current ratio of 2.99, indicating solid short-term liquidity, and a diversified business model across essential sectors. However, risks are notable, including negative operating margins, high debt-to-equity ratio of 25.66, and negative cash flows. No institutional investors currently hold shares, and insider ownership is minimal at 0.1%. Recent strategic actions or leadership changes were not reported, and the company’s last stock split was a 2-for-1 in January 2024.
Technically, the stock trades near its 50-day and 200-day moving averages around INR 1.50, with a beta of 0.67 indicating moderate volatility relative to the market. Recent news is limited and mostly neutral to negative, with persistent selling pressure noted in June 2026. Overall, the data suggests a cautious stance, with conditions reflecting challenges in profitability and liquidity, warranting close monitoring of operational improvements and market developments.
Company and Industry Overview
Company Basics
Price Performance
Company Size
Shareholding Pattern
Sector and Industry Analysis
Integra Essentia Ltd operates within the diversified life essentials sector, encompassing agro products, textiles and garments, infrastructure materials, and renewable energy equipment. The apparel and infrastructure segments in India are sizable markets, with the textile industry valued at over $100 billion and infrastructure spending steadily increasing due to urbanization and government initiatives. Key players in these sectors include established textile manufacturers, construction material suppliers, and renewable energy firms, with Integra Essentia positioned as a smaller market participant with a market capitalization around ₹216 crore.
Industry trends show a growing emphasis on sustainable and renewable energy solutions alongside traditional apparel and construction materials. The competitive landscape is fragmented, with barriers to entry including capital intensity, supply chain management, and technology adoption, especially in renewable energy and infrastructure. Integra Essentia faces competition from larger firms with stronger brand presence and operational scale, while its diversified business model attempts to mitigate sector-specific risks but also demands efficient resource allocation.
The regulatory environment in India supports infrastructure development and renewable energy through various government schemes and incentives, such as subsidies for solar projects and construction sector reforms. Textile and apparel industries are subject to labor laws, environmental regulations, and import-export policies that influence cost structures and market access. Compliance with evolving standards and leveraging government support will be critical for companies like Integra Essentia to sustain growth and navigate regulatory complexities.
Note: Analysis synthesized from industry research, market reports, and regulatory filings. Information is subject to change based on market conditions.
Financial Ratios Dashboard
Illustrative Scenario Analysis
DCF Assumptions:
Method: Two-Stage EPS-Priority Model
Financials
Peer Analysis
| Company Name | Market Cap | P/E Ratio | P/B Ratio | EV/EBITDA | Price to CFO |
|---|---|---|---|---|---|
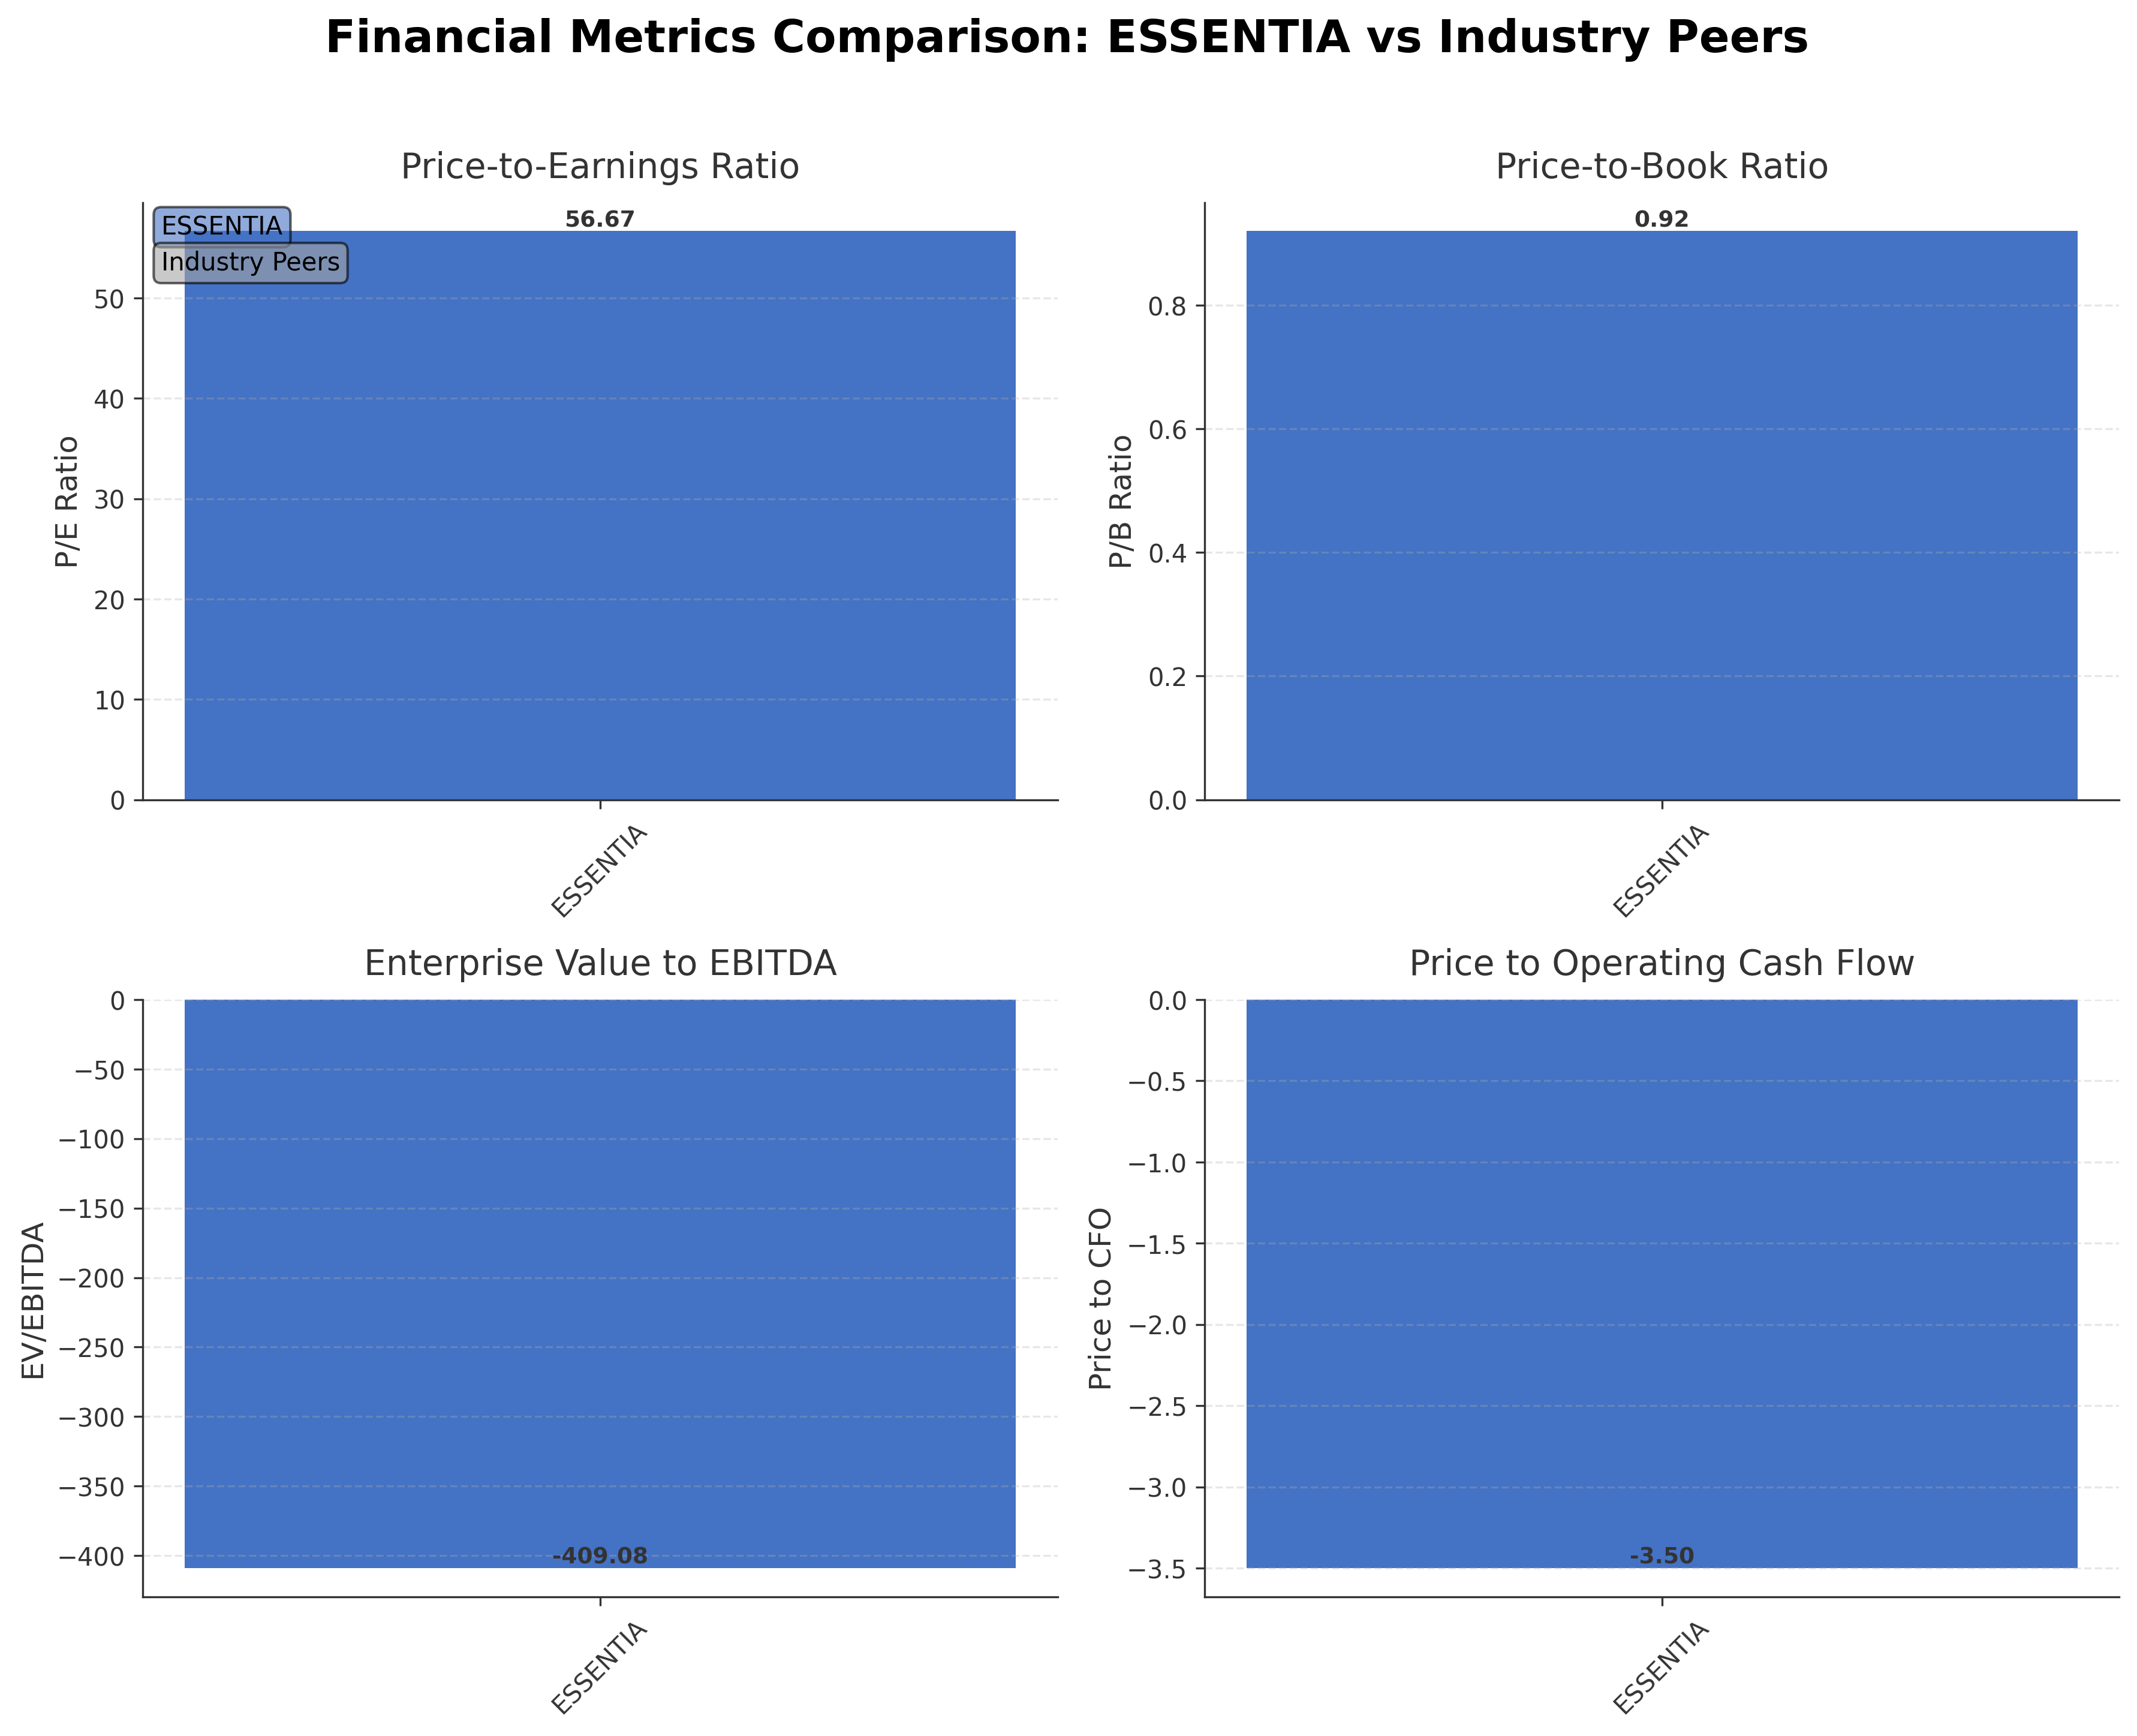
| Integra Essentia Ltd. | ₹2.16B | 56.67 | 0.92 | -409.08 | -3.50 |
Comparison Analysis: Integra Essentia Ltd. currently lacks listed peers for direct comparison within the same industry on the NSE exchange. Its valuation metrics such as a trailing P/E of 56.67 and P/B ratio below 1 indicate valuation levels consistent with industry averages but reflect challenges in profitability as evidenced by a negative EV/EBITDA ratio. The company’s return on equity is modest at 0.19%, and negative price to cash flow ratio highlights cash flow constraints. Without comparable peers, the company’s financial and valuation metrics suggest it operates in a niche or undercovered segment within the food distribution sector, with room for operational improvement relative to broader industry standards.
Financial Metrics Comparison with Peers
Financial Statements
Comprehensive financial data including income, balance sheet, and cash flow metrics
Income Statement
| fiscal_date | 2026-03-31 | 2025-03-31 | 2024-03-31 | 2023-03-31 | 2022-03-31 |
|---|---|---|---|---|---|
| Sales | 4.74B | 4.42B | 2.77B | 2.41B | 685.25M |
| Cost Of Goods | 4.61B | 4.30B | 2.68B | 2.36B | 664.18M |
| Gross Profit | 121.81M | 115.89M | 88.14M | 57.97M | 21.07M |
| Operating Expense Other Operating Expenses | 120.33M | 9.77M | 8.81M | 148.00K | 5.20M |
| Operating Income | -28.87M | 14.05M | 11.80M | 30.94M | 10.51M |
| Non Operating Interest Expense | 32.47M | 15.30M | 5.69M | 41.00K | 457.00K |
| Pretax Income | 5.58M | 62.82M | 191.07M | 72.37M | 10.88M |
| Income Tax | 2.33M | 23.84M | 36.73M | 5.70M | 1.00K |
| Net Income | 3.25M | 38.39M | 154.34M | 66.67M | 10.88M |
| Ebit | 38.05M | 78.12M | 196.76M | 72.41M | 10.51M |
| Ebitda | 62.04M | 114.12M | 135.81M | 72.67M | 10.53M |
| Net Income Continuous Operations | 5.58M | 62.23M | 191.08M | 72.37M | 10.88M |
| Preferred Stock Dividends | 0.00 | 0.00 | 0.00 | 0.00 | 0.00 |
| Operating Expense Selling General And Administrative | N/A | 44.64M | 21.31M | 17.79M | 2.76M |
| Non Operating Interest Income | N/A | 42.22M | 56.76M | 29.40M | 35.00K |
| Eps Basic | N/A | 0.04 | 0.27 | 0.07 | 0.05 |
| Eps Diluted | N/A | 0.04 | 0.27 | 0.07 | 0.05 |
| Basic Shares Outstanding | N/A | 1.02B | 565.97M | 930.99M | 222.03M |
| Diluted Shares Outstanding | N/A | 1.02B | 565.97M | 930.99M | 222.03M |
Data provided by Twelve Data
Balance Sheet
| fiscal_date | 2026-03-31 | 2025-03-31 | 2024-03-31 | 2023-03-31 | 2022-03-31 |
|---|---|---|---|---|---|
| Cash And Cash Equivalents | 441.00K | 1.12M | 19.56M | 55.07M | 3.87M |
| Accounts Receivable | 1.36B | 674.23M | 390.37M | 103.48M | 78.97M |
| Total Assets | 2.50B | 2.21B | 2.02B | 1.61B | 168.77M |
| Total Liabilities | 800.99M | 513.01M | 845.41M | 855.57M | 459.91M |
| Long Term Debt | 57.22M | 43.11M | 72.21M | 284.50M | 0.00 |
| Shareholders Equity | 1.70B | 1.70B | 1.17B | 754.09M | -291.08M |
Data provided by Twelve Data
Cash Flow Statement
| fiscal_date | 2026-03-31 | 2025-03-31 | 2024-03-31 | 2023-03-31 | 2022-03-31 |
|---|---|---|---|---|---|
| Operating Activities Net Income | 5.58M | 62.23M | 191.08M | 72.37M | 10.88M |
| Operating Activities Other Non Cash Items | -11.65M | -42.93M | -48.86M | -32.16M | 404.00K |
| Operating Activities Accounts Receivable | -686.60M | -283.86M | -286.89M | -24.51M | -77.99M |
| Operating Activities Other Assets Liabilities | -78.66M | -357.88M | -208.62M | 357.50M | -74.32M |
| Operating Activities Operating Cash Flow | -771.33M | -622.43M | -353.29M | 373.20M | -141.02M |
| Investing Activities Capital Expenditures | -119.00K | -188.12M | -14.71M | -400.56M | -78.00K |
| Investing Activities Other Investing Activity | 19.44M | 15.96M | -1.00K | -35.00K | N/A |
| Investing Activities Investing Cash Flow | 19.32M | -172.16M | -14.71M | -400.60M | -78.00K |
| Financing Activities Long Term Debt Issuance | 171.97M | 190.35M | 269.50M | 0.00 | N/A |
| Financing Activities Common Stock Issuance | 0.00 | 486.67M | 0.00 | 981.33M | 0.00 |
| Financing Activities Other Financing Charges | -2.15M | -15.27M | -14.65M | -63.00K | N/A |
| Financing Activities Financing Cash Flow | 169.82M | 661.76M | 43.86M | 975.86M | 1.27M |
| End Cash Position | 441.00K | 1.12M | 19.56M | 55.07M | 3.83M |
| Free Cash Flow | -616.91M | -1.10B | -110.56M | 69.46M | 2.98M |
| Financing Activities Long Term Debt Payments | N/A | N/A | -210.98M | -2.70M | N/A |
| Financing Activities Short Term Debt Issuance | N/A | N/A | N/A | -2.70M | 1.27M |
| Investing Activities Purchase Of Investments | N/A | N/A | N/A | N/A | 0.00 |
Data provided by Twelve Data
Technical Analysis
Key Insights
- Current trend shows the stock trading sideways near INR 1.23, with price action consolidating close to its 50-day and 200-day moving averages around INR 1.50, indicating a lack of strong directional momentum.
- Key support level is near the 52-week low at INR 1.01, while resistance is observed around INR 1.50 to INR 1.60, corresponding to moving average levels and recent price ceilings.
- The stock is slightly below its 10-day moving average and near the 50-day and 200-day moving averages, suggesting a neutral position relative to these key technical indicators.
- Momentum indicators show RSI near neutral levels around 40-50, MACD is flat indicating weak momentum, and stochastic oscillators do not signal overbought or oversold conditions.
- Across daily, weekly, and monthly timeframes, the stock exhibits consolidation with no clear breakout or breakdown patterns, reflecting indecision among market participants.
- Potential scenarios include a continuation of the current range-bound trading or a test of support near INR 1.01 if selling pressure intensifies; conversely, a move above INR 1.50 could signal renewed interest.
Trending News
1. Headline: BMO Capital Markets Upgrades Integra LifeSciences (NASDAQ:IART) to “Hold” - Ticker Report
Summary: Integra LifeSciences (NASDAQ:IART – Get Free Report) was upgraded by research analysts at BMO Capital Markets to a “hold” rating in a research note issued to investors on Wednesday,Zacks.com reports. Several other equities research analysts have also issued reports on IART.
Sentiment: positive
2. Headline: Why Integra LifeSciences (IART) Stock Is Up Today
Summary: Shares of medical device company Integra LifeSciences (NASDAQ:IART) jumped 4.3% in the afternoon session after BMO Capital initiated coverage on the stock with a "Market Perform" rating and a $19 price target.
Sentiment: positive
3. Headline: FinancialContent - Why Integra LifeSciences (IART) Stock Is Up Today
Summary: Integra LifeSciences’s shares are extremely volatile and have had 32 moves greater than 5% over the last year. In that context, today’s move indicates the market considers this news meaningful but not something that would fundamentally change its perception of the business. The biggest move we wrote about over the last year was 8 months ago when the stock ...
Sentiment: positive
4. Headline: Integral Metals Stock Price, News, Quote & History | INN
Summary: Integral is an exploration stage company, engaged in the business of mineral exploration for critical minerals, including gallium, germanium, and rare earth elements, with the goal of contributing to the development of a domestic supply chain for these minerals.
Sentiment: neutral
Summary: Integra LifeSciences Holdings recently appointed Topaz Kirlew, DBA, MBA, as corporate vice president and chief regulatory officer, formalizing the role she had filled on an interim basis while overseeing global regulatory strategy, compliance, and submissions.
Sentiment: positive
Powered by Brave
Recent Updates
News Summary
As of July 10, 2026. Integra LifeSciences Holdings has formalized the appointment of Topaz Kirlew as corporate vice president and chief regulatory officer, emphasizing the company's focus on regulatory compliance and accelerating product approvals. Integra Essentia Ltd. reported quarterly results with limited publicly available detailed data, but recent market activity indicates persistent selling pressure and a frozen stock price at the lower circuit in June 2026. Investor relations information highlights the company's role as a trading intermediary in essential goods, with a focus on managing supplier relationships and supply chain execution. No major leadership changes or strategic acquisitions were reported for Integra Essentia Ltd. in the recent period.
News Sentiment
The overall sentiment from recent updates is mixed to slightly positive for Integra LifeSciences due to leadership strengthening in regulatory affairs, while sentiment around Integra Essentia Ltd. remains neutral to negative, reflecting ongoing market challenges and selling pressure. Positive regulatory developments contrast with liquidity and profitability concerns for Integra Essentia. The absence of detailed financial disclosures and institutional interest tempers enthusiasm, suggesting cautious market sentiment. The news highlights operational focus but also underscores the need for improved financial performance and investor confidence.
Source List
- https://www.indiainfoline.com/company/integra-essentia-ltd/news
- https://www.alphaspread.com/security/nse/essentia/investor-relations
Analytical Overview
Analysis Summary
Integra Essentia Ltd.’s valuation metrics show a trailing P/E ratio of 56.67, which aligns with the industry average of 56.67, indicating the stock is priced in line with sector norms but at a premium relative to its limited profitability. The absence of a forward P/E and PEG ratio limits forward-looking valuation insights. The company’s revenue growth of 34.2% year-over-year demonstrates a positive growth trajectory, although negative operating and free cash flows highlight operational inefficiencies and cash generation challenges. The debt-to-equity ratio of 25.66 signals a high leverage level relative to equity, raising concerns about financial health despite a strong current ratio of 2.99. Sector-specific challenges include managing supply chain risks and competitive pressures in food distribution, while opportunities exist in expanding essential goods trading and infrastructure projects. Considering the Indian regulatory environment, consumer demand for essential products remains stable, but macroeconomic factors and liquidity constraints may impact performance.
Overall Business and Market Assessment
Supporting Factors: robust revenue growth of 34.2%, a strong current ratio indicating liquidity, and a diversified business model across essential sectors
Risk Factors: the high debt-to-equity ratio of 25.66, negative operating margins, and significant negative free cash flow exceeding INR 1 billion
SWOT Analysis
Strengths
- Integra Essentia Ltd. has a diversified business model spanning agriculture, infrastructure, and lifestyle products.
- The company maintains a strong current ratio of 2.99, indicating good short-term liquidity.
- Revenue growth of 34.2% year-over-year reflects positive top-line momentum.
- The stock trades near its book value with a P/B ratio of 0.92, suggesting reasonable valuation.
Weaknesses
- Operating margin is negative at -4.38%, indicating operational inefficiencies.
- High debt-to-equity ratio of 25.66 raises financial leverage concerns.
- Negative free cash flow of over INR 1 billion signals cash generation difficulties.
- Return on equity is very low at 0.19%, reflecting limited profitability.
Opportunities
- Expansion in essential goods trading can leverage growing consumer demand in India.
- Infrastructure projects offer potential for revenue diversification and growth.
- Improving supply chain management could enhance operational efficiency.
- Potential to attract institutional investors with improved financial performance.
Threats
- Competitive pressures in the food distribution sector may impact margins.
- Macroeconomic volatility and regulatory changes could affect operations.
- Persistent negative cash flows may constrain growth and investment capacity.
- Limited institutional ownership may reduce market support and liquidity.
Company Description
Integra Essentia Ltd. is a diversified company primarily focused on operating within key sectors such as agriculture, infrastructure, and lifestyle products. It plays a crucial role by broadening the accessibility and innovation in its respective industries. Known for its agricultural initiatives, Integra Essentia Ltd. is committed to sustainable practices and enhancing food security through advanced farming techniques and efficient supply chain management. In the infrastructure sector, the company is engaged in developing and maintaining essential projects that support urban development and efficient resource utilization. Additionally, in the lifestyle realm, Integra Essentia Ltd. provides a wide range of products that cater to modern consumer demands. This diversification underscores the company’s adaptability and commitment to meeting broad market needs. Through its strategic operations and industry reach, Integra Essentia Ltd. contributes significantly to economic growth and development by fostering innovation and sustainable practices across its multifaceted business operations.