
Inox Wind Ltd (INOXWIND)
Stock Analysis Report
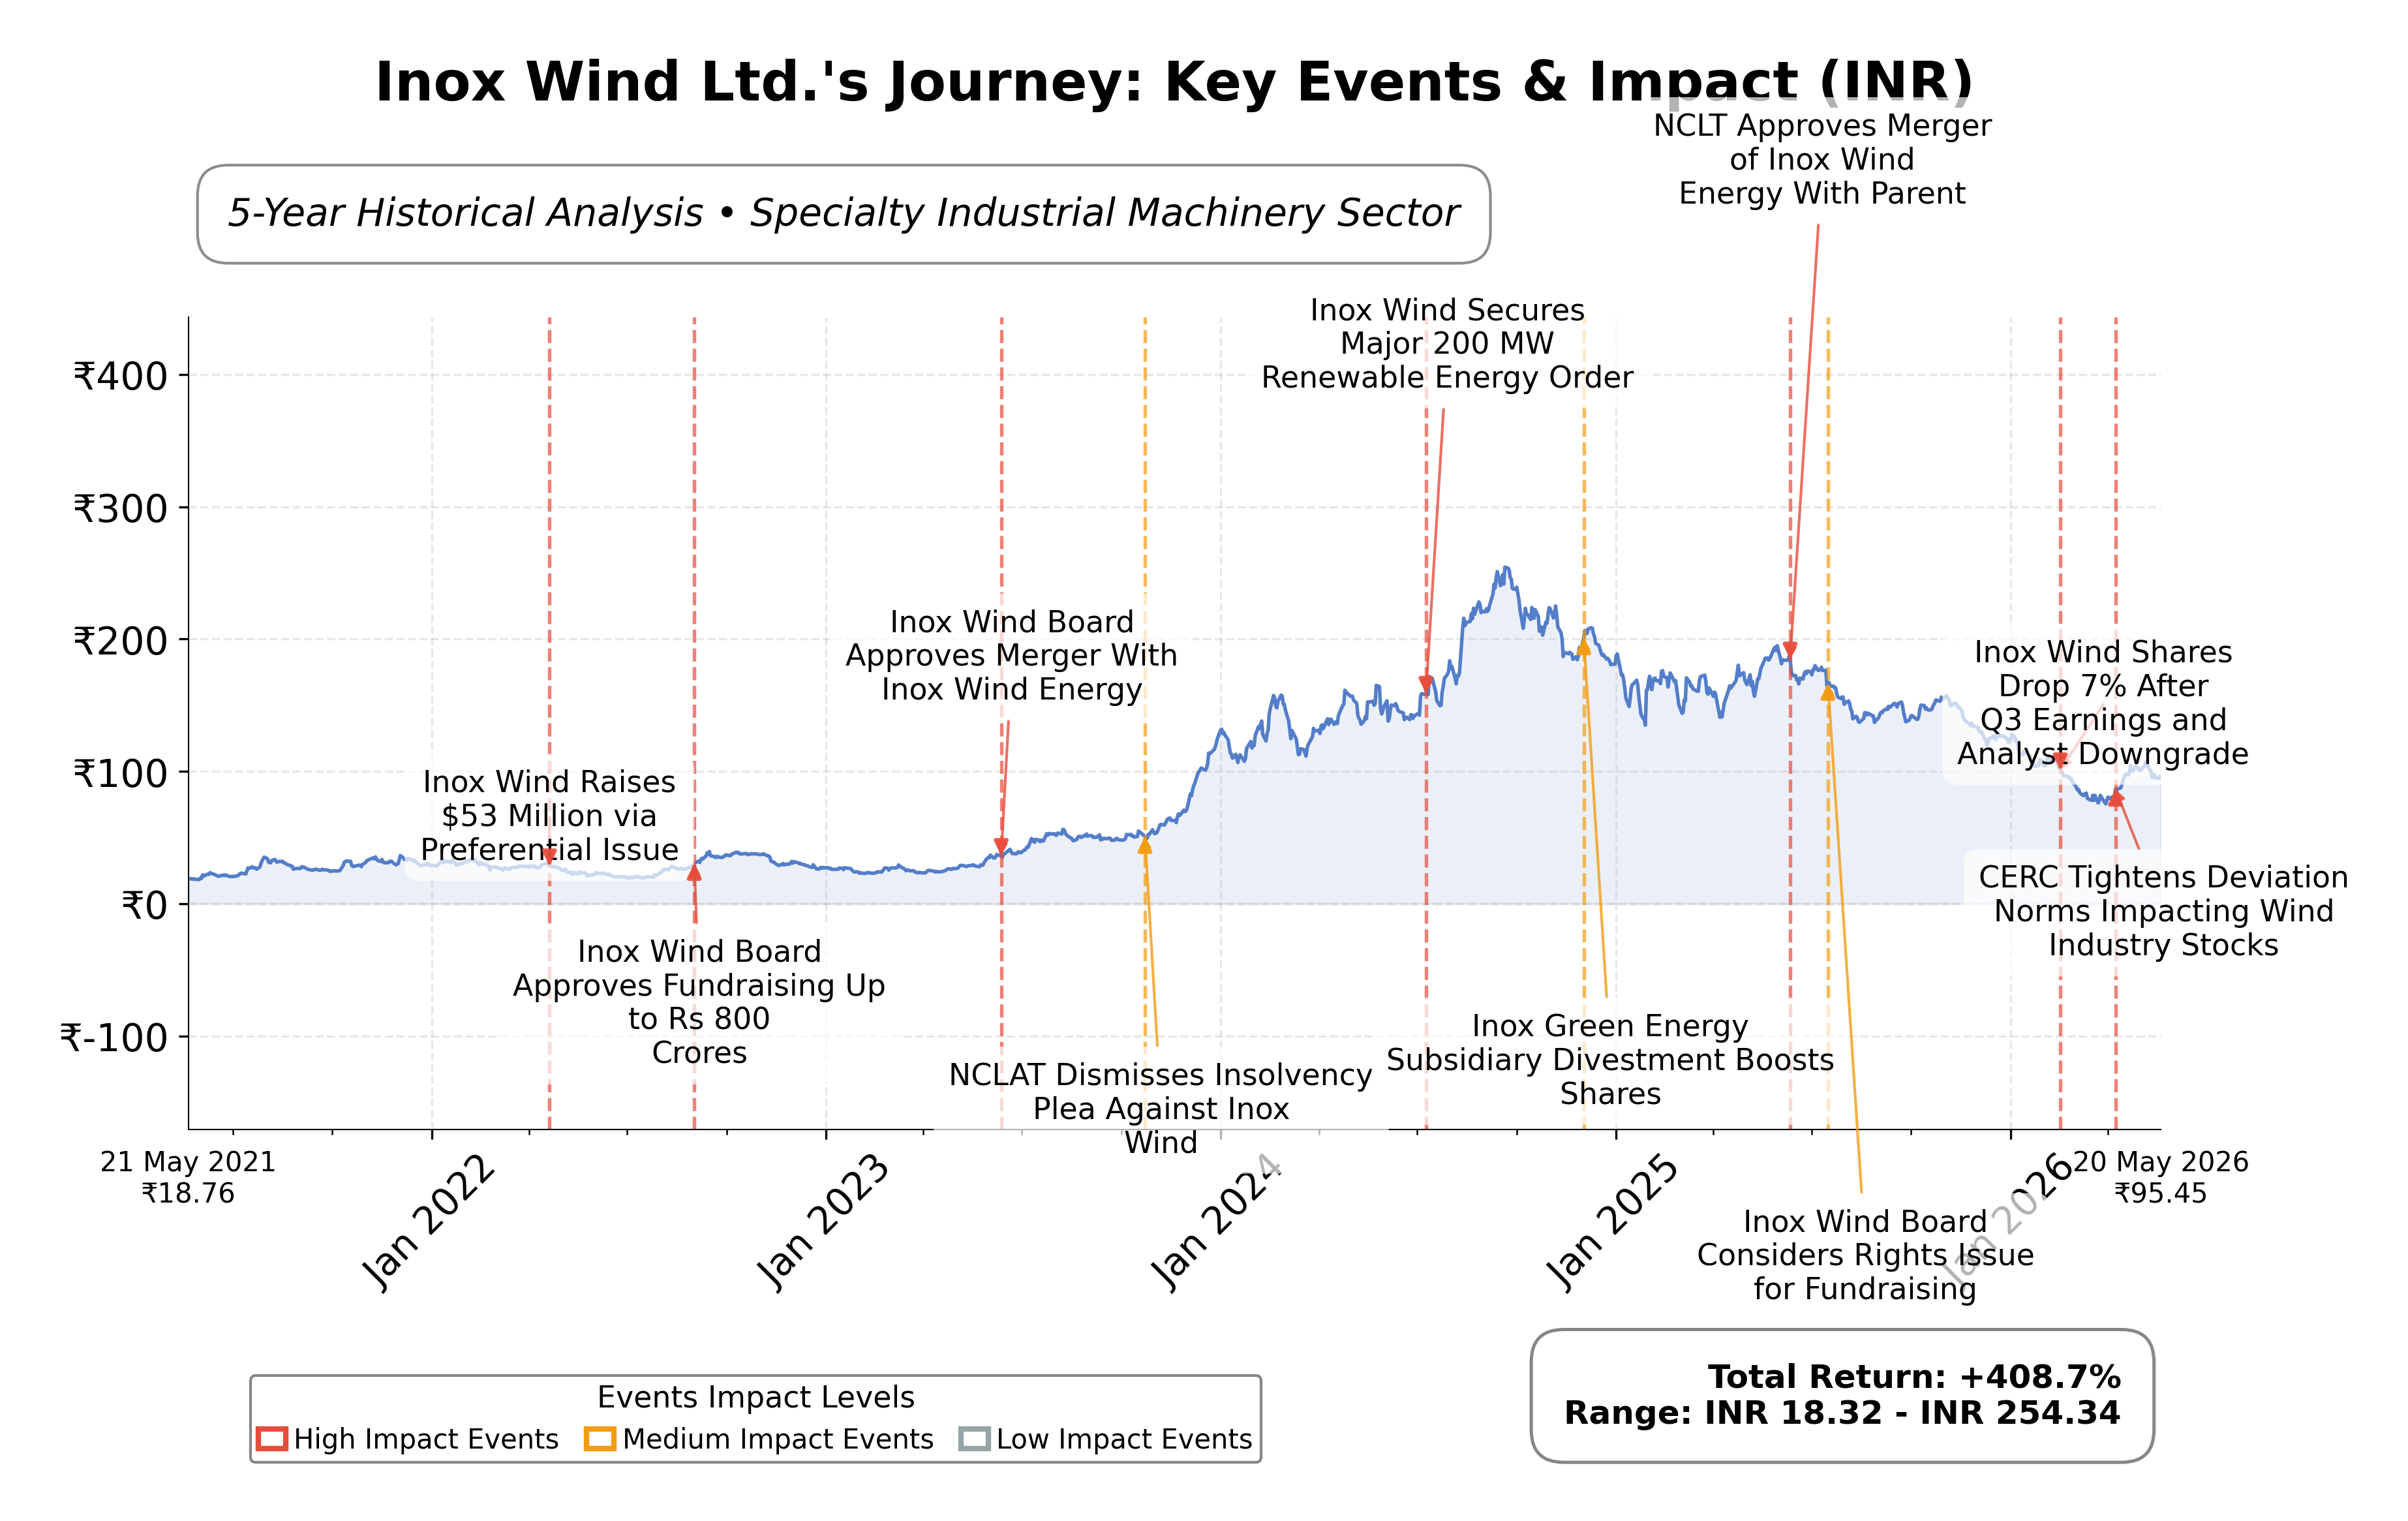
Stock Journey
Key Positives and Key Risks
Pros
- Inox Wind’s revenue growth of 32.5% demonstrates strong top-line expansion supporting business momentum.
- The company generated positive free cash flow of ₹4.48 billion despite negative operating cash flow, indicating improving cash management.
- Inox Wind’s current ratio of 2.34 reflects solid liquidity, reducing short-term financial risk.
Cons
- Operating cash flow is negative at ₹-6.78 billion, highlighting challenges in core cash generation.
- The debt-to-equity ratio of 15.71 indicates high leverage, which may constrain financial flexibility.
- The stock trades at a trailing P/E of 34.86, which is relatively high compared to some peers, potentially limiting valuation upside.
Disclosure: This information is for general awareness and does not constitute investment advice
Report Summary
Inox Wind Ltd. operates primarily in the renewable energy sector, focusing on the manufacturing and sales of wind turbine generators and related equipment. Listed on the NSE under the Industrials sector, the company provides comprehensive wind energy solutions including design, fabrication, project execution, and maintenance services. Its strategic manufacturing presence in India supports both domestic and international markets, positioning it as a key player in the specialty industrial machinery industry with a strong emphasis on sustainable energy infrastructure.
Financially, Inox Wind reported trailing twelve months (TTM) revenue of approximately ₹44.28 billion with a gross margin of 38.2%, operating margin of 18.9%, and a net profit margin of 11.3%. The company’s return on equity (ROE) stands at 7.99% and return on assets (ROA) at 5.10%, reflecting moderate profitability and asset efficiency. Its return on invested capital (ROIC) is consistent with these metrics, indicating effective capital utilization despite challenges in operating cash flow, which was negative at ₹-6.78 billion TTM, offset by positive free cash flow of ₹4.48 billion.
Valuation metrics show a trailing price-to-earnings (P/E) ratio of 34.86 and a forward P/E of 15.41, suggesting the market anticipates improved earnings growth. The price-to-book (P/B) ratio is 1.88, and the enterprise value to EBITDA (EV/EBITDA) ratio is 17.25, indicating a premium valuation relative to book value and earnings. The stock trades at ₹95.69, well below its 52-week high of ₹201 but above the low of ₹75.05, reflecting significant volatility and a current price closer to the lower end of its annual range.
Inox Wind’s strengths include a robust market capitalization of ₹165.1 billion, a strong current ratio of 2.34 indicating liquidity, and a diversified business model integrating manufacturing and services. Key risks involve its relatively high debt-to-equity ratio of 15.71, negative operating cash flow, and exposure to regulatory and competitive pressures in the renewable energy sector. Recent strategic moves such as the acquisition of US-based Boviet Solar and multiple asset purchases across continents underscore its growth ambitions and geographic expansion.
Technically, the stock is trading below its 200-day moving average of ₹120.11 but above the 50-day average of ₹89.87, with a low beta of 0.14 indicating limited volatility relative to the market. Momentum indicators show mixed signals across timeframes, and recent news reflects both positive developments in acquisitions and cautious market sentiment. Overall, the data suggests a nuanced outlook where conditions may favor monitoring for potential entry points or consolidation rather than immediate action.
Company and Industry Overview
Company Basics
Price Performance
Company Size
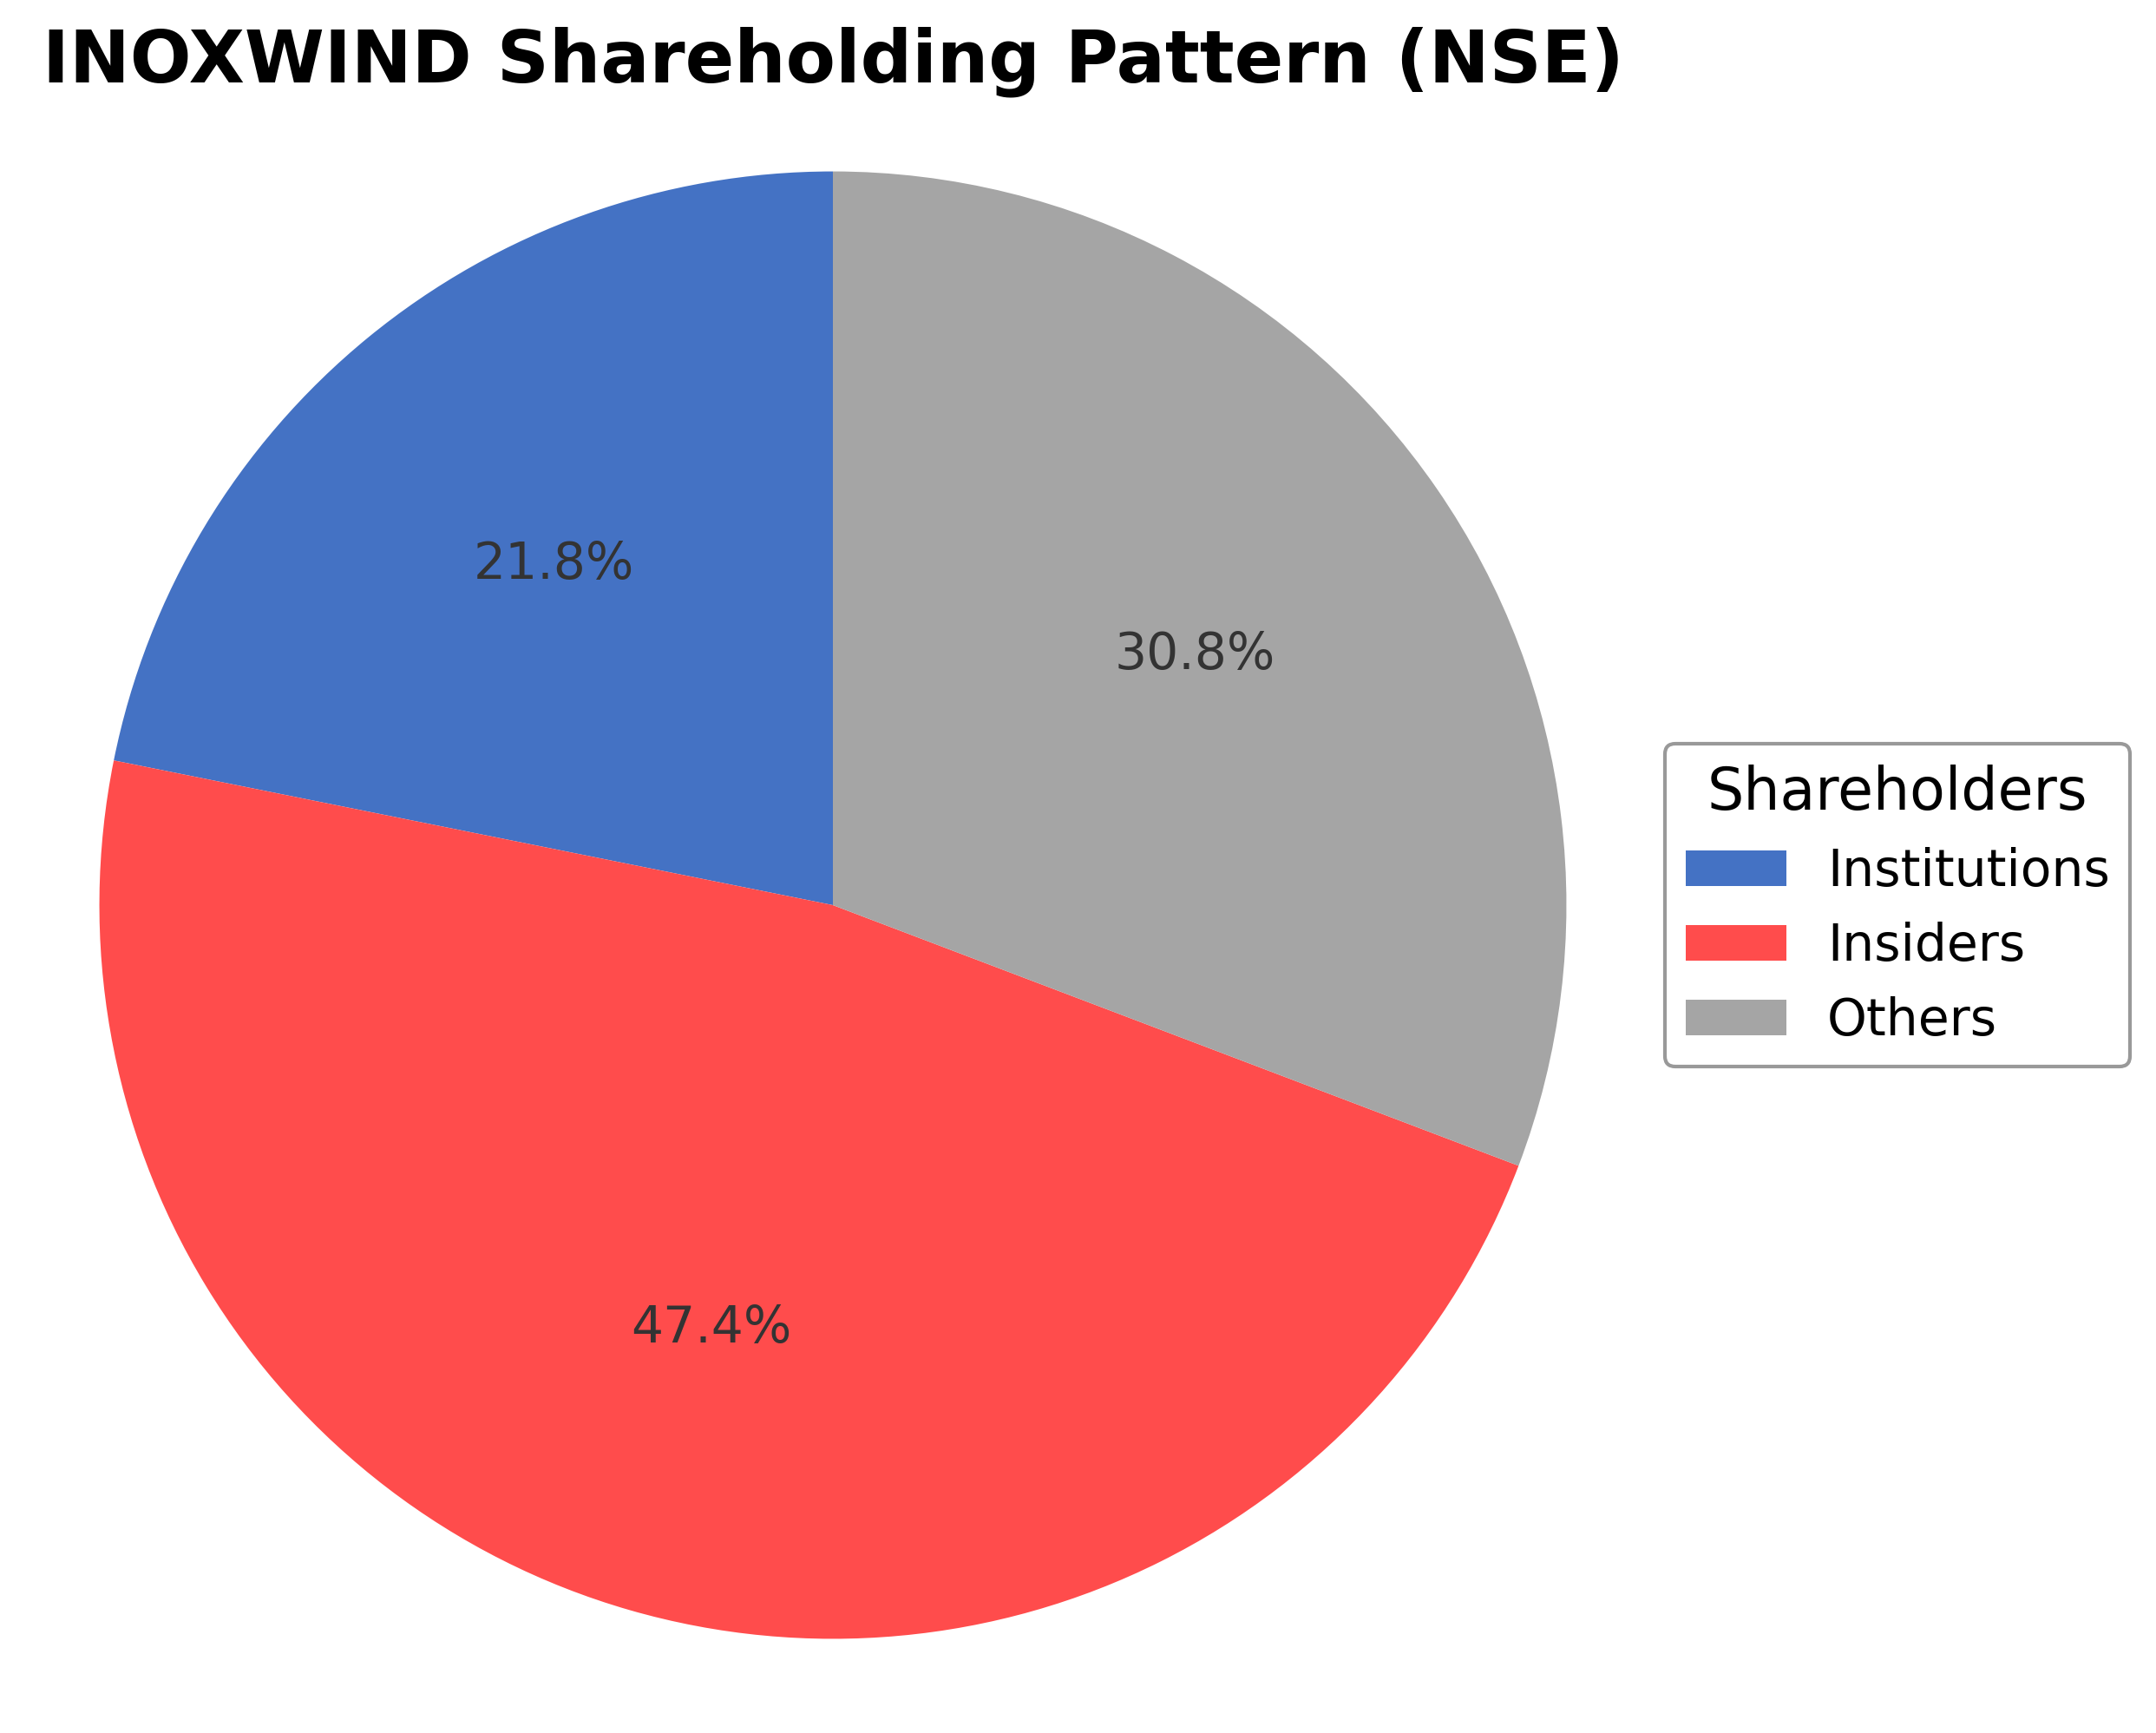
Shareholding Pattern
Sector and Industry Analysis
The renewable energy sector in India, particularly wind energy, has witnessed robust growth driven by the country's commitment to expanding clean energy capacity. The market size has expanded significantly, with wind power contributing a substantial portion of India's renewable energy mix. Key players include Suzlon Energy, Vestas India, and Inox Wind Ltd, which compete to capture market share in both onshore and emerging offshore segments.
Industry trends highlight increasing adoption of advanced turbine technologies and a shift towards higher capacity installations to improve efficiency and reduce costs. Competitive dynamics are shaped by technological innovation, project execution capabilities, and access to capital. Barriers to entry remain high due to significant upfront capital requirements, technical expertise, and established relationships with government bodies and utilities.
The regulatory landscape is characterized by supportive policies such as accelerated depreciation benefits, renewable purchase obligations, and competitive bidding frameworks. Recent amendments aim to streamline project approvals and enhance grid integration, although challenges persist with tariff rationalization and payment delays from distribution companies. Overall, regulatory measures continue to foster sector growth while emphasizing sustainability and grid stability.
Note: Analysis synthesized from industry research, market reports, and regulatory filings. Information is subject to change based on market conditions.
Financial Ratios Dashboard
Illustrative Scenario Analysis
DCF Assumptions:
Method: Two-Stage EPS-Priority Model
Financials
Peer Analysis
| Company Name | Market Cap | P/E Ratio | P/B Ratio | EV/EBITDA | Price to CFO |
|---|---|---|---|---|---|
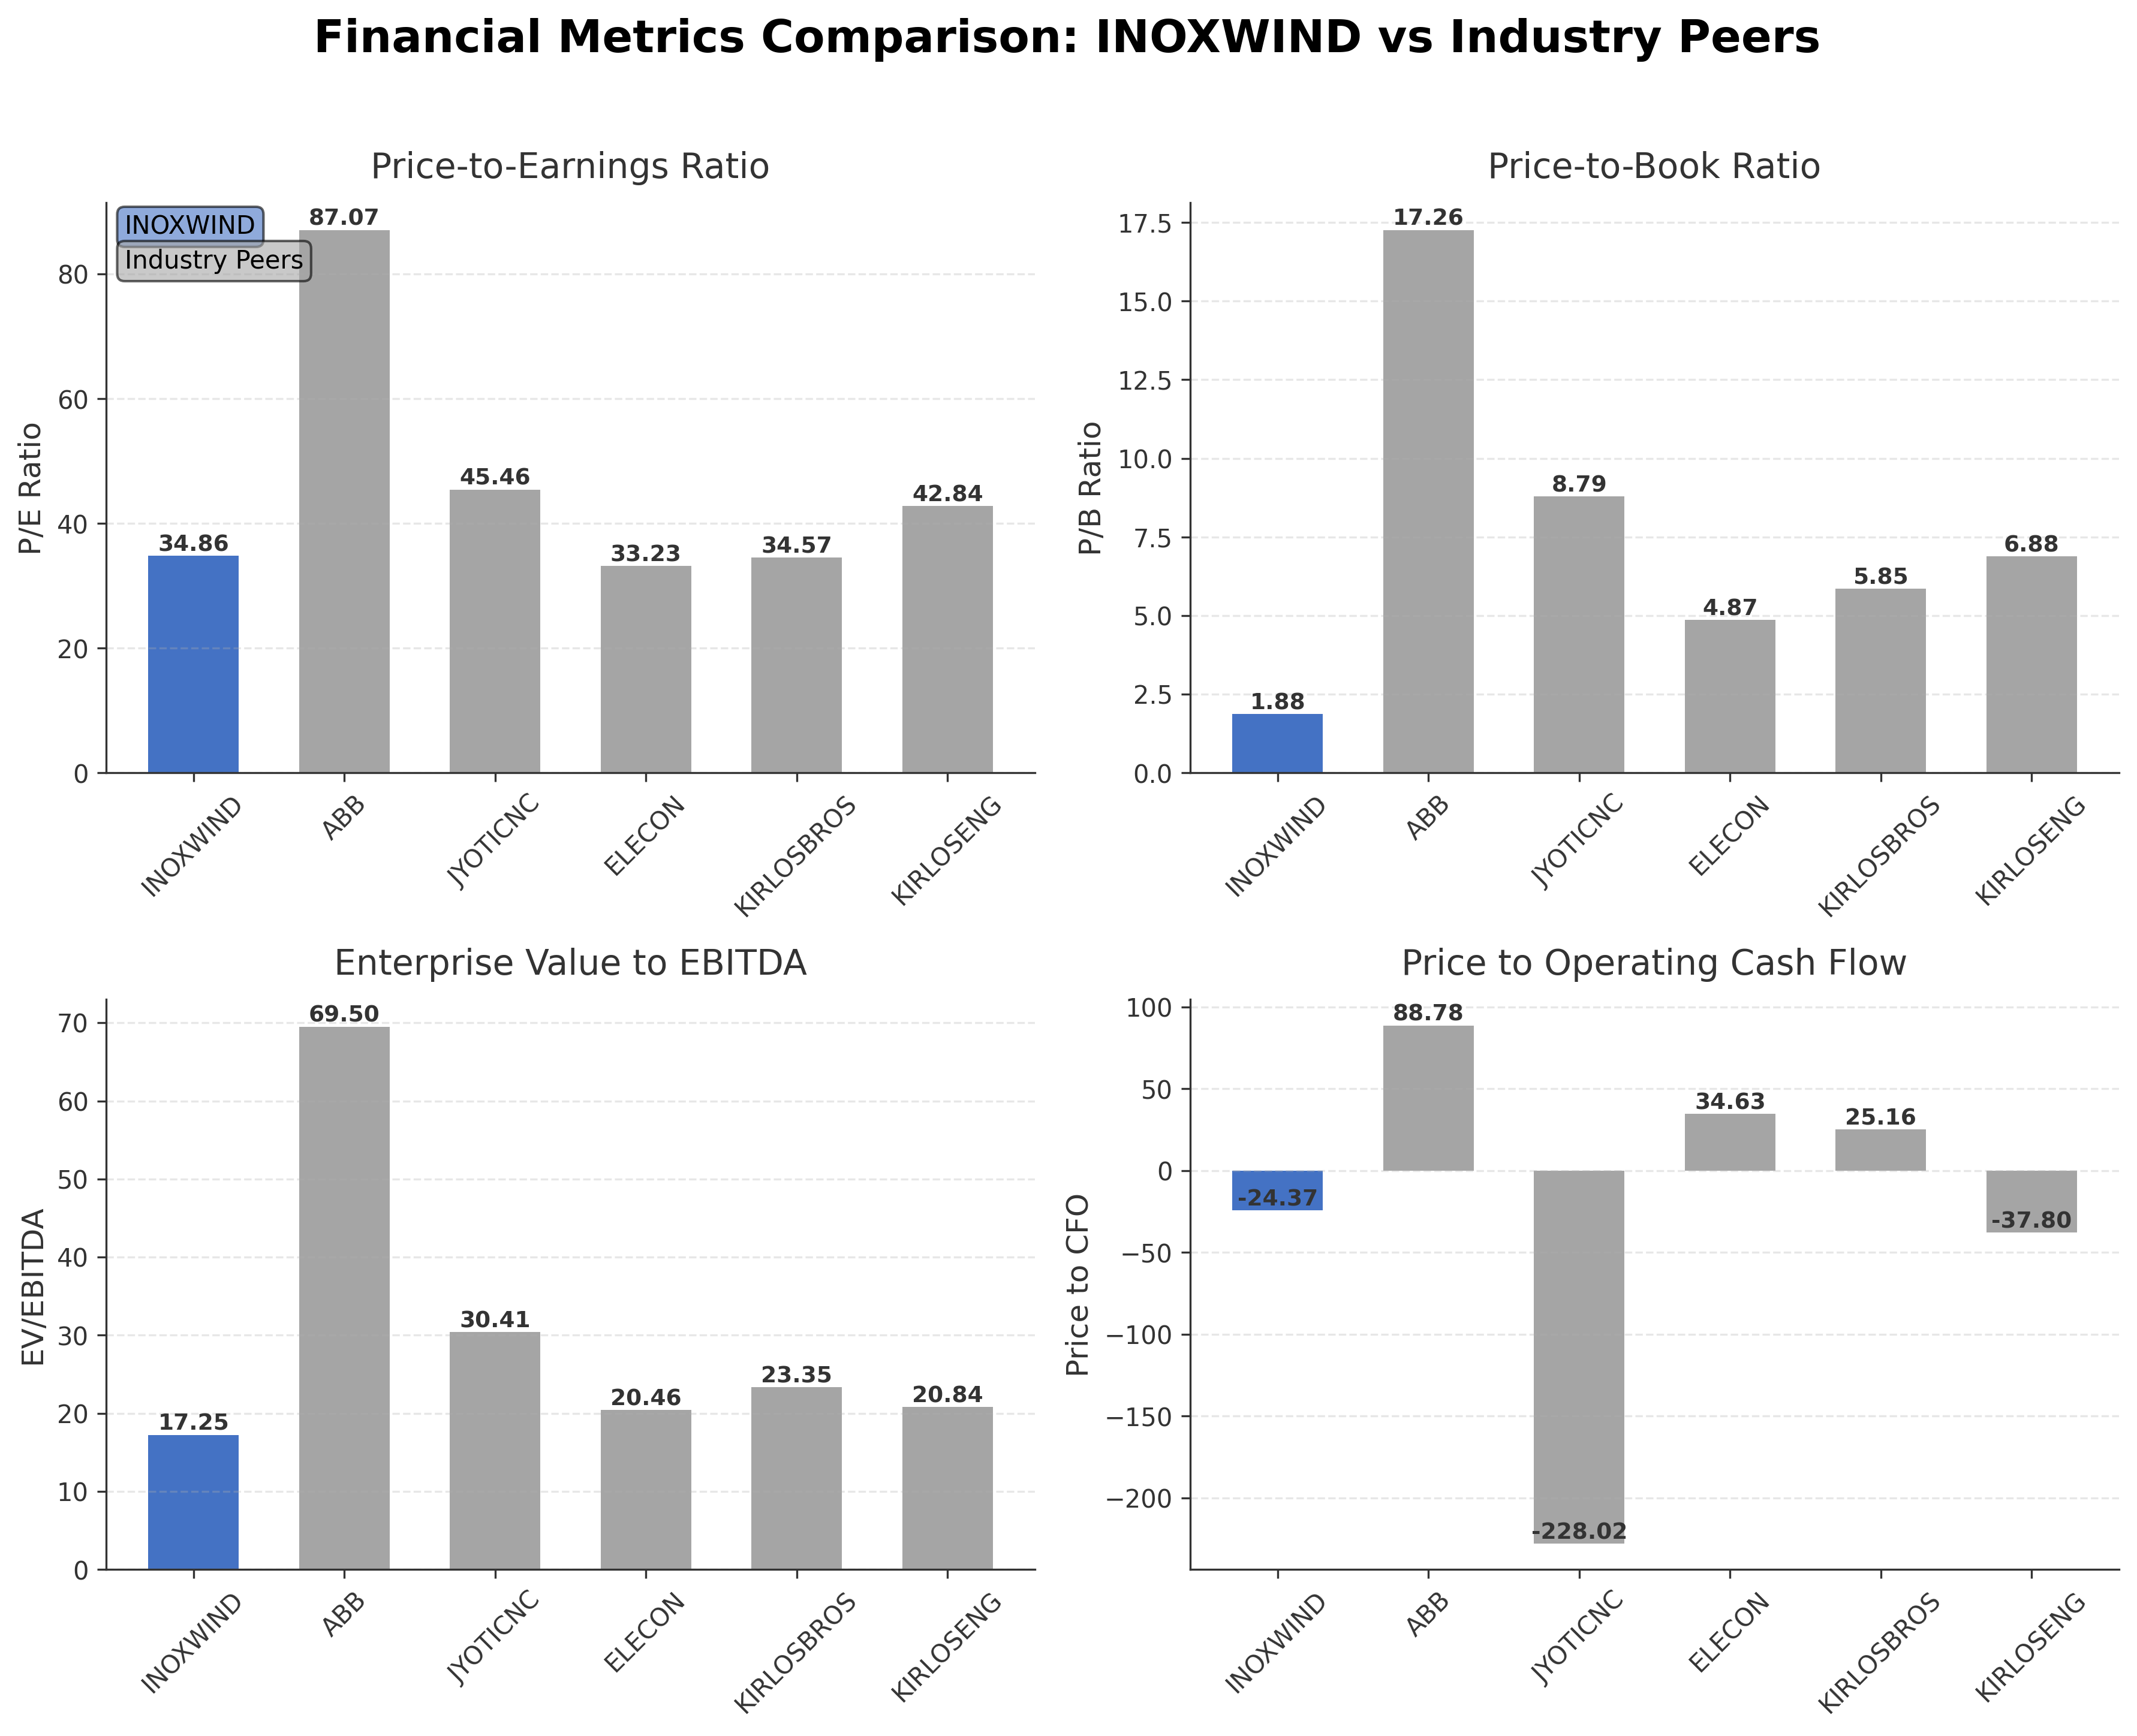
| Inox Wind Ltd. | ₹165.10B | 34.86 | 1.88 | 17.25 | -24.37 |
| ABB India Ltd. | ₹1.35T | 87.07 | 17.26 | 69.5 | 88.78 |
| Jyoti CNC Automation Ltd. | ₹160.87B | 45.46 | 8.79 | 30.41 | -228.02 |
| Elecon Engineering Co. Ltd. | ₹108.80B | 33.23 | 4.87 | 20.46 | 34.63 |
| Kirloskar Brothers Limited | ₹127.64B | 34.57 | 5.85 | 23.35 | 25.16 |
| Kirloskar Oil Engines Ltd. | ₹252.97B | 42.84 | 6.88 | 20.84 | -37.8 |
Comparison Analysis: Inox Wind Ltd. trades at a moderate market capitalization of ₹165.10 billion, with a trailing P/E ratio of 34.86 and P/B ratio of 1.88, which is significantly lower than peers such as ABB India Ltd. and Jyoti CNC Automation Ltd. Its EV/EBITDA of 17.25 is also below the higher multiples seen in ABB and Jyoti CNC, indicating relatively more attractive valuation metrics. However, Inox Wind's price to CFO is negative at -24.37, contrasting with positive cash flow multiples for most peers, signaling challenges in operating cash flow. The company’s return on equity of 8% is modest compared to peer averages, suggesting room for improvement in profitability. Overall, Inox Wind presents a valuation profile that is less expensive on a book value basis but faces operational cash flow constraints relative to its industry counterparts.
Financial Metrics Comparison with Peers
Financial Statements
Comprehensive financial data including income, balance sheet, and cash flow metrics
Income Statement
| fiscal_date | 2025-03-31 | 2024-03-31 | 2023-03-31 | 2022-03-31 | 2021-03-31 |
|---|---|---|---|---|---|
| Sales | 35.07B | 17.43B | 7.33B | 6.25B | 7.11B |
| Cost Of Goods | 22.73B | 12.31B | 6.19B | 4.65B | 5.86B |
| Gross Profit | 12.34B | 5.12B | 1.14B | 1.60B | 1.25B |
| Operating Expense Selling General And Administrative | 999.25M | 458.05M | 406.30M | 403.51M | 302.42M |
| Operating Expense Other Operating Expenses | 2.47B | 854.87M | 1.45B | 3.85B | 1.52B |
| Operating Income | 5.75B | 1.59B | -2.61B | -3.99B | -2.39B |
| Non Operating Interest Income | 213.54M | 159.35M | 105.35M | 74.92M | 136.33M |
| Non Operating Interest Expense | 957.43M | 1.92B | 2.55B | 2.83B | 2.13B |
| Pretax Income | 5.37B | -471.80M | -6.69B | -6.53B | -4.59B |
| Income Tax | 1.02B | 36.05M | 283.12M | -1.70B | -1.52B |
| Net Income | 4.38B | -529.14M | -7.12B | -4.83B | -3.07B |
| Eps Basic | 2.71 | -0.31 | -5.11 | -5.44 | -3.44 |
| Eps Diluted | 2.71 | -0.31 | -5.11 | -5.44 | -3.44 |
| Basic Shares Outstanding | 1.65B | 1.30B | 1.30B | 883.13M | 887.67M |
| Diluted Shares Outstanding | 1.65B | 1.30B | 1.30B | 883.13M | 887.67M |
| Ebit | 6.33B | 1.45B | -4.13B | -3.70B | -2.46B |
| Ebitda | 8.08B | 2.64B | -2.09B | -2.82B | -1.62B |
| Net Income Continuous Operations | 4.38B | -529.14M | -7.12B | -4.83B | -3.07B |
| Minority Interests | 105.88M | 124.93M | 38.24M | 24.20M | 15.59M |
| Preferred Stock Dividends | 0.00 | 0.00 | 0.00 | 0.00 | 0.00 |
Source: Financial statements and regulatory filings
Balance Sheet
| fiscal_date | 2025-03-31 | 2024-03-31 | 2023-03-31 | 2022-03-31 | 2021-03-31 |
|---|---|---|---|---|---|
| Cash And Cash Equivalents | 210.10M | 119.93M | 214.39M | 668.19M | 1.29B |
| Accounts Receivable | 26.88B | 11.37B | 8.27B | 10.73B | 10.48B |
| Total Assets | 87.95B | 67.95B | 60.41B | 59.65B | 54.64B |
| Total Liabilities | 31.89B | 46.03B | 38.21B | 40.95B | 41.48B |
| Long Term Debt | 308.15M | 1.94B | 8.97B | 4.39B | 4.50B |
| Shareholders Equity | 56.06B | 21.92B | 22.20B | 18.69B | 13.16B |
Source: Financial statements and regulatory filings
Cash Flow Statement
| fiscal_date | 2025-03-31 | 2024-03-31 | 2023-03-31 | 2022-03-31 | 2021-03-31 |
|---|---|---|---|---|---|
| Operating Activities Net Income | 4.38B | -529.14M | -7.12B | -4.83B | -3.07B |
| Operating Activities Stock Based Compensation | 247.62M | N/A | N/A | N/A | N/A |
| Operating Activities Other Non Cash Items | 1.47B | 198.31M | 3.30B | 2.75B | 2.43B |
| Operating Activities Accounts Receivable | -16.46B | -4.79B | 978.82M | 1.62B | 1.74B |
| Operating Activities Other Assets Liabilities | 3.59B | -130.77M | -9.53B | 1.05B | -2.71B |
| Operating Activities Operating Cash Flow | -6.78B | -5.25B | -12.38B | 598.10M | -1.61B |
| Investing Activities Capital Expenditures | -6.20B | -5.14B | -3.88B | -1.79B | -1.20B |
| Investing Activities Net Acquisitions | 452.49M | -1.10B | 325.10M | 556.10M | -73.53M |
| Investing Activities Purchase Of Investments | -15.31B | -27.92M | -2.75B | -466.60M | 0.00 |
| Investing Activities Sale Of Investments | 16.28B | 502.92M | 2.47B | 91.40M | 627.88M |
| Investing Activities Other Investing Activity | 737.35M | 100.00K | 6.00B | 853.30M | 40.25M |
| Investing Activities Investing Cash Flow | -4.05B | -5.77B | 2.17B | -760.40M | -603.64M |
| Financing Activities Long Term Debt Payments | -2.13B | -3.28B | -1.67B | -1.35B | -3.38B |
| Financing Activities Short Term Debt Issuance | -1.82B | 5.15B | -2.78B | 4.85B | 2.75B |
| Financing Activities Common Stock Issuance | 9.43B | 10.10B | 10.39B | 0.00 | N/A |
| Financing Activities Common Stock Repurchase | 0.00 | N/A | N/A | N/A | N/A |
| Financing Activities Other Financing Charges | 8.86M | 1.09M | 150.00K | N/A | N/A |
| Financing Activities Financing Cash Flow | 5.49B | 11.97B | 11.03B | 6.79B | 4.44B |
| End Cash Position | 210.10M | 119.93M | 214.39M | 668.20M | 1.29B |
| Free Cash Flow | -4.83B | -8.98B | -14.88B | -6.54B | -2.32B |
| Financing Activities Long Term Debt Issuance | N/A | N/A | 5.09B | 3.29B | 5.07B |
Source: Financial statements and regulatory filings
Technical Analysis
Key Insights
- Inox Wind’s current trend shows consolidation with price trading below the 200-day moving average at ₹120.11 but above the 50-day moving average at ₹89.87, indicating mixed medium-term momentum.
- Key support levels are near ₹75.05, the 52-week low, while resistance is observed around ₹100 and the 200-day moving average at ₹120.11.
- The stock is positioned below the 200-day moving average, suggesting longer-term bearishness, but remains above the 10-day and 50-day moving averages, reflecting some short-term strength.
- Momentum indicators show the RSI near neutral levels, MACD indicates a potential weakening of bullish momentum, and Stochastic oscillators suggest the stock is neither overbought nor oversold.
- Daily and weekly timeframes reveal sideways price action with low volatility, while monthly charts confirm a longer-term downtrend from the 52-week high.
- Current technical setup suggests a range-bound market scenario with potential for short-term rallies but constrained by longer-term resistance near ₹120.
Trending News
Summary: INOXGFL Group is poised to acquire Vena Energy's Indian renewable energy business. The deal is valued between ₹4,500-5,000 crore. This move signifies INOXGFL's aggressive expansion in India's clean energy sector. The conglomerate has recently made several strategic acquisitions, bolstering ...
Sentiment: positive
2. Headline: Inox Clean Energy completes US$750 million acquisition of Boviet Solar - PV Tech
Summary: Inox Clean Energy has completed the acquisition of US solar manufacturer Boviet Solar Technology in a deal valued at around US$750 million.
Sentiment: positive
3. Headline: Top stocks in news: IOCL, Lupin, Eicher Motors, Afcons, Puravankara, DOMS, Adani stocks - BusinessToday
Summary: Stocks like Indian Oil, Lupin, Eicher Motors, Afcons, Puravankara, DOMS Industries, GNFC, Adani stocks and more will be in the spotlight on Tuesday, May 19.
Sentiment: neutral
4. Headline: Inox Clean Energy powers into top three with Rs 25k-cr buys, says company official - The Economic Times
Summary: "We have made nine acquisitions in the past nine months. These investments are worth Rs 25,000 crore," said Devansh Jain, executive director of INOXGFL, an umbrella entity that houses varied businesses across industrial chemicals, renewable energy generation, solar and wind equipment manufacturing ...
Sentiment: neutral
5. Headline: Tata Power, Inox Wind, CG Power shares: Should you enter at current levels? - BusinessToday
Summary: Offering a stock-specific view on Inox Wind Ltd in Business Today Television's (BTTV's) Daily Calls segment on Monday, the market expert stated that the stock's trend continues to remain weak.
Sentiment: negative
Recent Updates
News Summary
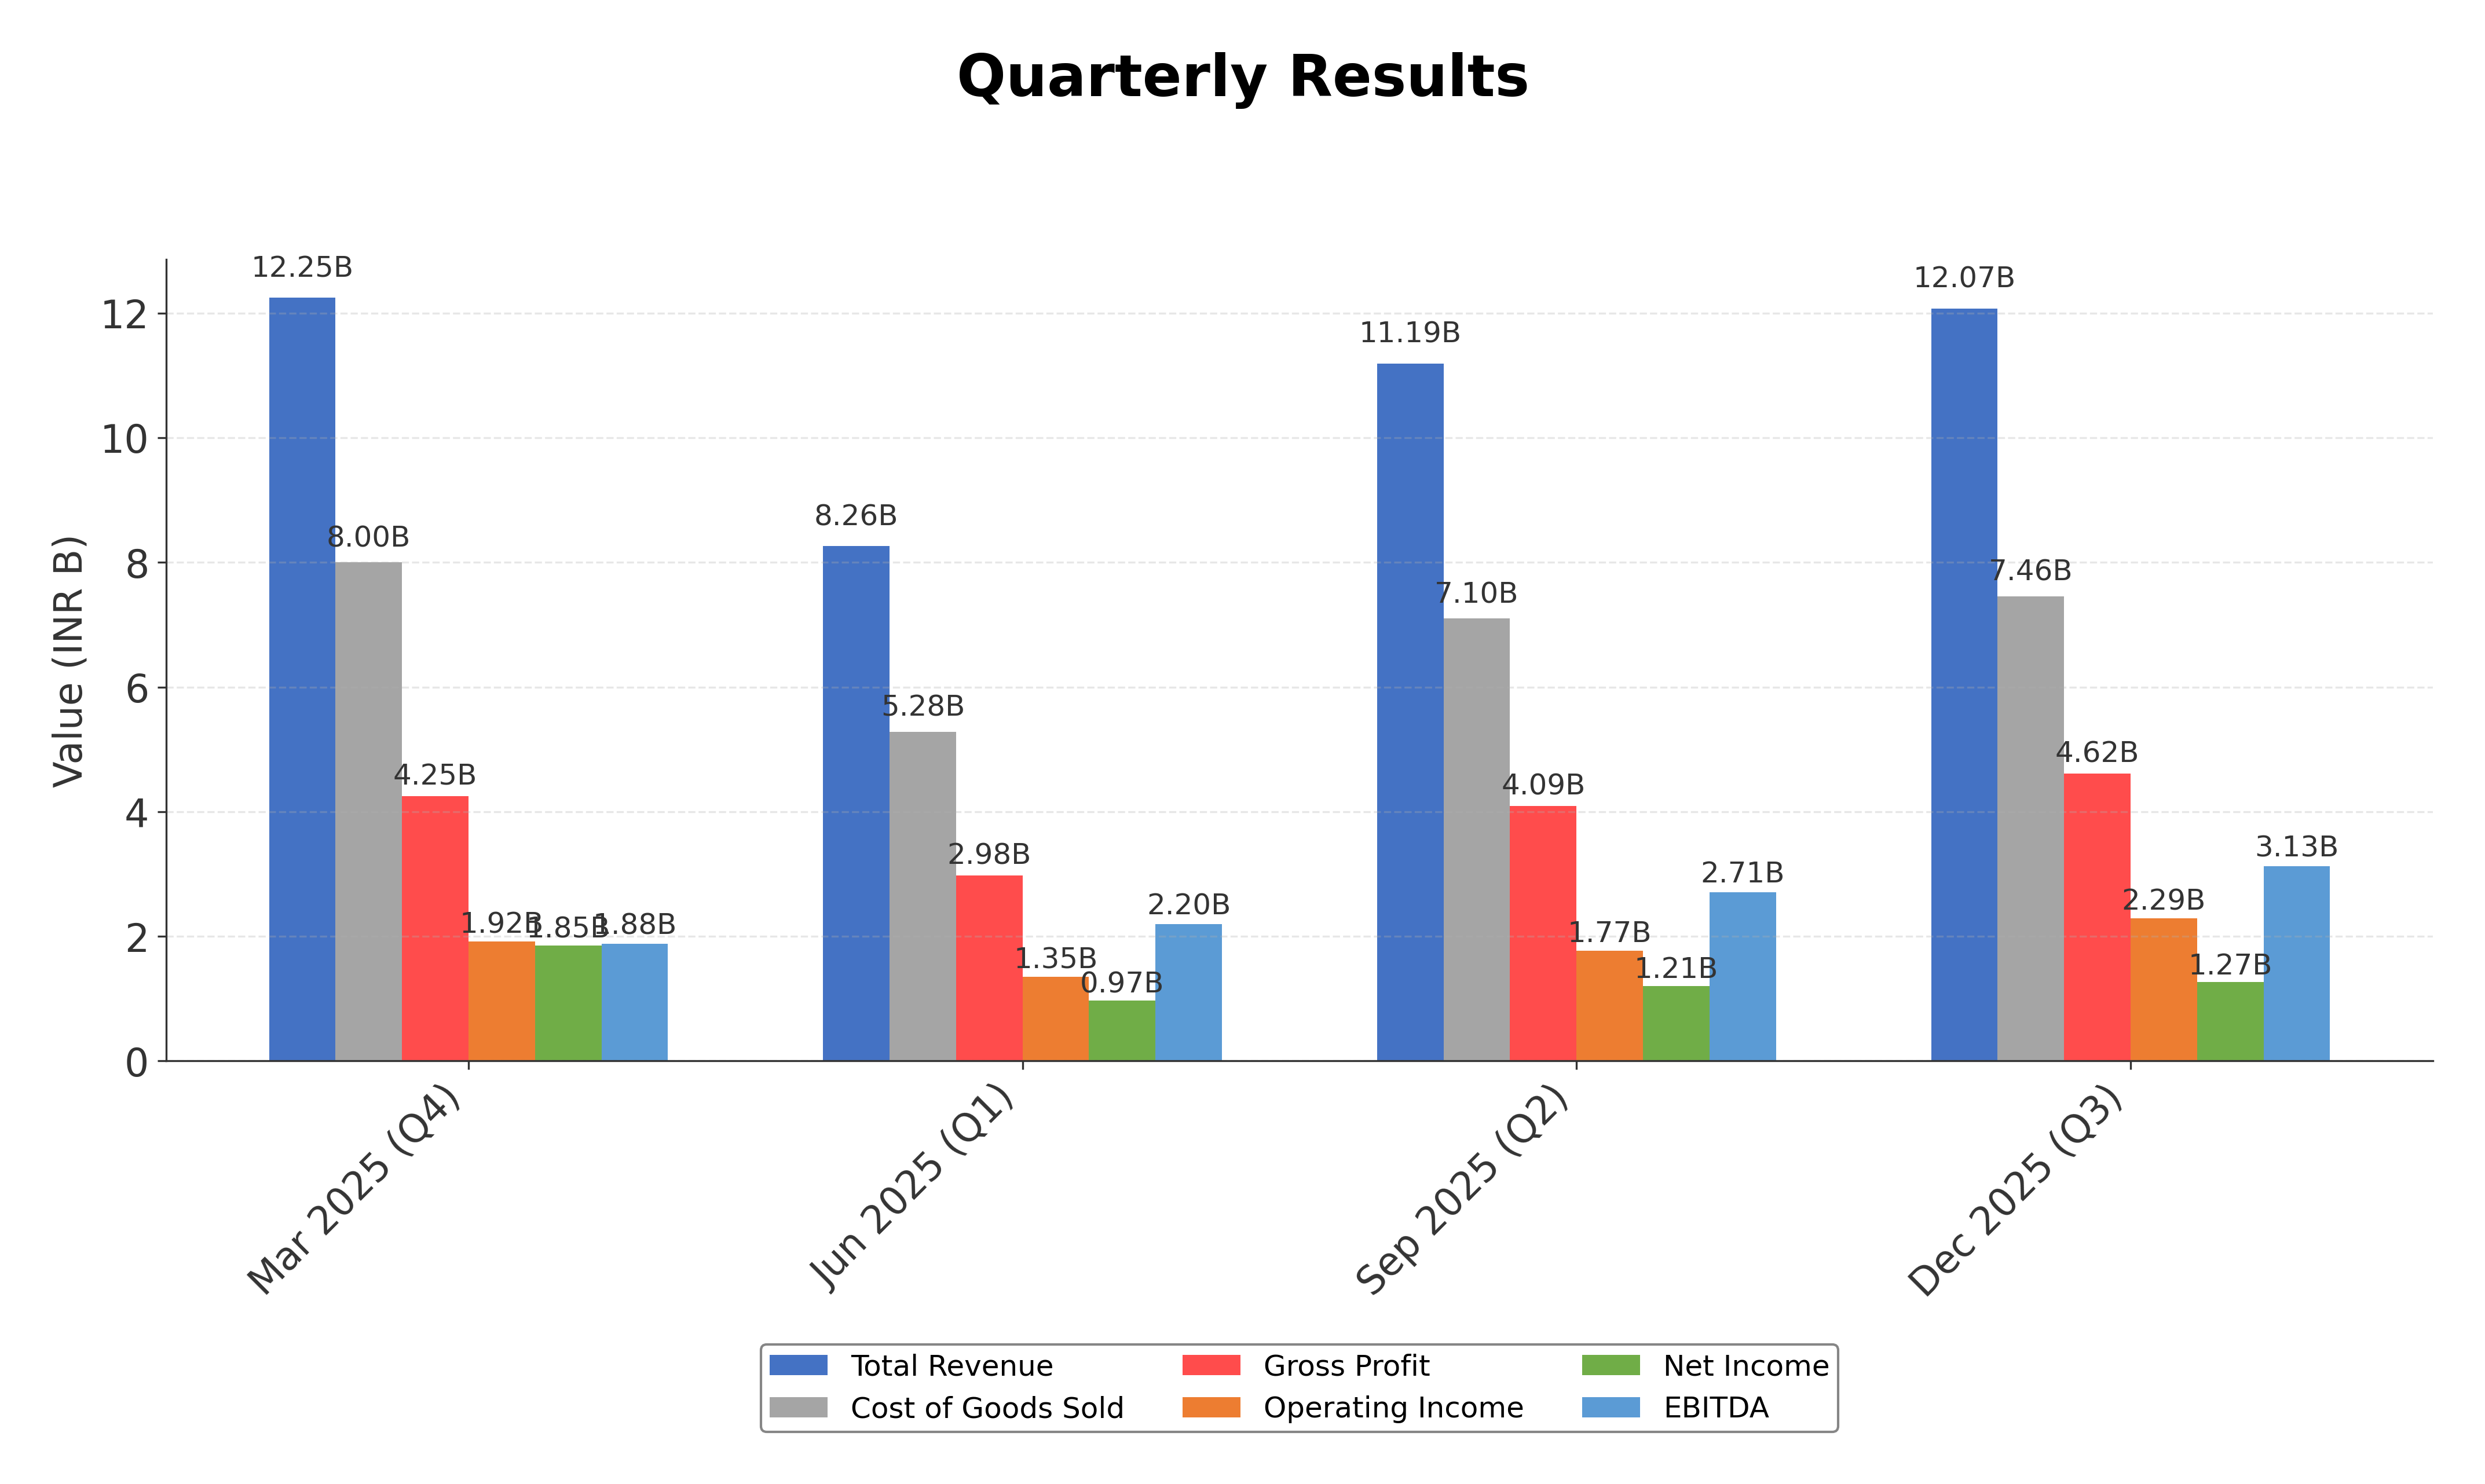
As of May 19, 2026. Inox Clean Energy, an affiliate of Inox Wind Ltd., has made significant strides with nine acquisitions valued at approximately Rs 25,000 crore over the past nine months, including the recent $750 million acquisition of US-based Boviet Solar. These acquisitions span India, America, and Africa, reflecting a strategic focus on building a diversified, multi-continent renewable energy portfolio. The company has raised Rs 5,500 crore in equity and plans further fundraising to support growth. Inox Wind continues to report strong quarterly results, including its highest ever quarterly profit, supported by increased revenue and operational efficiencies. The company’s integrated business model, combining manufacturing and services, positions it well within the evolving renewable energy market.
News Sentiment
The overall sentiment from recent updates is predominantly positive, driven by strategic acquisitions, robust financial performance, and expansion into new markets. Positive news around the Boviet Solar acquisition and multiple asset purchases underscores confidence in growth prospects. However, some caution is noted in market commentary regarding stock price trends and volatility. The balance of positive operational developments and cautious market reactions suggests a measured optimism about the company’s trajectory.
Source List
- https://www.alphaspread.com/security/nse/inoxwind/investor-relations
Analytical Overview
Analysis Summary
Inox Wind’s valuation metrics show a trailing P/E of 34.86 and a forward P/E of 15.41, which is lower than some industry peers, indicating a potentially more attractive price relative to expected earnings growth. The company’s revenue growth rate of 32.5% and positive free cash flow of ₹4.48 billion demonstrate a solid growth trajectory and improving cash generation despite negative operating cash flow. Financial health is mixed, with a high debt-to-equity ratio of 15.71, which may raise leverage concerns, but a strong current ratio of 2.34 indicates good short-term liquidity. Sector-specific opportunities include increasing demand for renewable energy infrastructure and government incentives in India, while challenges involve regulatory risks and competitive pressures from both domestic and international players. Considering the Indian market environment, regulatory support for clean energy and evolving consumer trends favor companies like Inox Wind, though economic volatility remains a factor.
Overall Business and Market Assessment
Supporting Factors: strong revenue growth of 32.5%, strategic acquisitions expanding geographic reach, and positive free cash flow generation
Risk Factors: No data
SWOT Analysis
Strengths
- Inox Wind has a diversified business model integrating manufacturing and services in the renewable energy sector.
- The company demonstrates strong revenue growth of 32.5% and positive free cash flow generation.
- Robust liquidity is indicated by a current ratio of 2.34, supporting operational stability.
- Strategic acquisitions expand its geographic footprint across multiple continents.
Weaknesses
- Operating cash flow remains negative at ₹-6.78 billion, indicating cash generation challenges.
- High debt-to-equity ratio of 15.71 suggests elevated financial leverage.
- Return on equity is modest at 7.99%, reflecting limited profitability efficiency.
- Stock price volatility with a 52-week range from ₹75.05 to ₹201 indicates market uncertainty.
Opportunities
- Growing demand for renewable energy infrastructure driven by government incentives.
- Expansion into new markets through acquisitions enhances growth prospects.
- Increasing focus on local manufacturing reduces supply chain risks.
- Potential to capitalize on global trends toward sustainable energy solutions.
Threats
- Regulatory changes could impact project approvals and operational costs.
- Intense competition from domestic and international renewable energy firms.
- Macroeconomic volatility may affect capital availability and project financing.
- Technological advancements by competitors could erode market share.
Company Description
Inox Wind Ltd. is a prominent name in the renewable energy sector, specializing in the manufacturing and sales of wind turbine generators. The company's primary purpose is to harness wind energy efficiently and contribute to sustainable power generation solutions. Inox Wind operates across multiple facets of the wind energy industry, including the design and fabrication of windmill components, optimization of wind farm sites, and offering complete project execution services from conceptualization to commissioning. Its manufacturing facilities are strategically located in India, enabling them to cater to both domestic and international markets. Inox Wind plays a crucial role in the growing shift towards green energy solutions and supports the global endeavor to reduce carbon footprints. The company's comprehensive approach to wind energy helps in bolstering the renewable energy infrastructure, thus solidifying its importance and influence in the financial markets around the globe.