

Infosys Ltd (INFY)
Stock Analysis Report
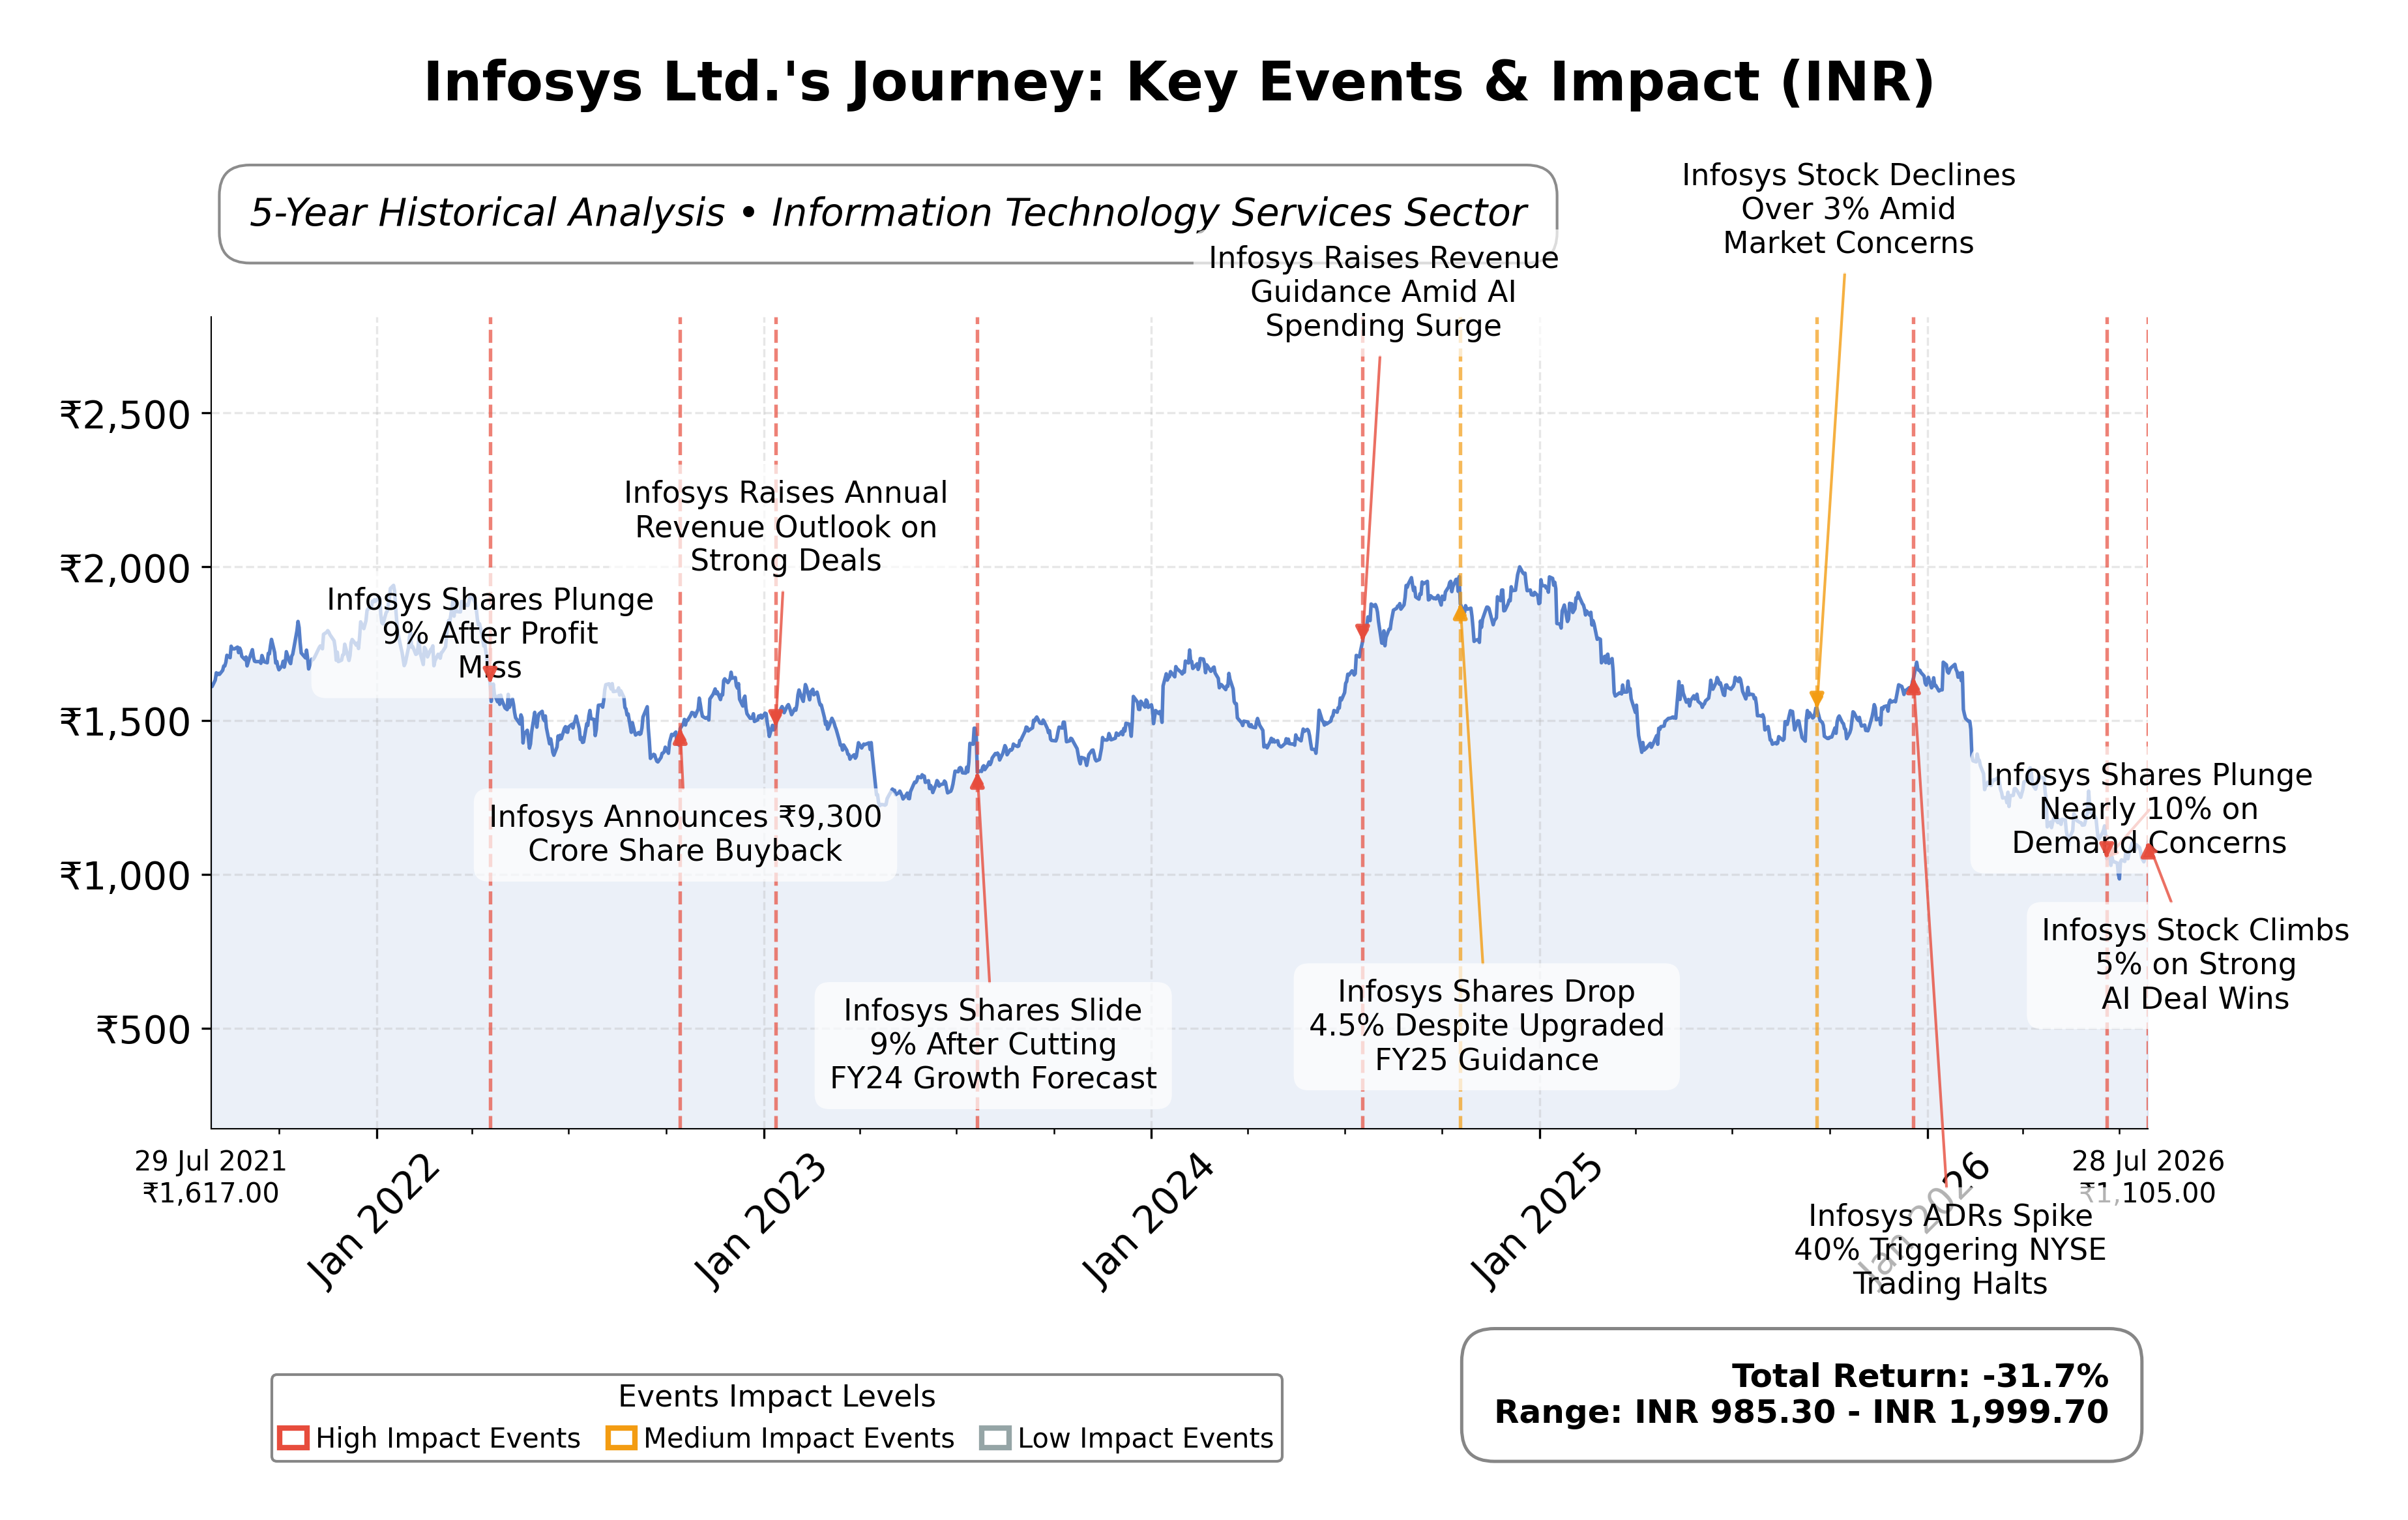
Stock Journey
Key Positives and Key Risks
Pros
- Strong return on equity of 32% indicating efficient use of shareholder capital.
- Robust operating margin of approximately 21% reflecting operational efficiency.
- Healthy free cash flow of INR 306.4 billion supporting financial flexibility.
Cons
- High EV/EBITDA ratio at 942.53 suggests potential valuation premium or accounting anomalies.
- Moderate revenue growth rate of 2.9% quarter-over-quarter may limit upside momentum.
- Significant downside risk of 45.6% from 52-week high to current price indicating recent price weakness.
Disclosure: This information is for general awareness and does not constitute investment advice
Report Summary
Infosys Ltd. is a leading Indian multinational technology and consulting company listed on the National Stock Exchange (NSE) under the symbol INFY. Operating within the Information Technology Services sector, Infosys provides a broad range of IT services including application development, cloud transformation, AI, cybersecurity, and business process management. The company serves a global clientele across multiple industries such as financial services, retail, manufacturing, and healthcare, positioning itself as a key partner in digital transformation for large enterprises worldwide.
Financially, Infosys reported trailing twelve months (TTM) revenue of approximately INR 1.96 trillion with a gross margin of 31.48%, operating margin of 21.09%, and a net profit margin of 16.37%. The company demonstrates strong profitability and operational efficiency, reflected in a return on equity (ROE) of 32% and return on assets (ROA) of 15.28%. Its return on invested capital (ROIC) remains robust, supported by solid operating cash flow of INR 395.9 billion and free cash flow of INR 306.4 billion, underscoring effective capital utilization.
From a valuation perspective, Infosys trades at a trailing price-to-earnings (P/E) ratio of 13.42 and a forward P/E of 13.01, which are in line with the industry average of 13.42. The price-to-book (P/B) ratio stands at 4.46, while the enterprise value to EBITDA (EV/EBITDA) ratio is notably high at 942.53, suggesting some market premium or accounting nuances. The current market capitalization is approximately INR 4.21 trillion. The stock price is INR 1105, situated well below its 52-week high of INR 1728 and above the 52-week low of INR 982.4, indicating a significant price range over the past year.
Infosys’s strengths include strong cash flow generation, a low debt-to-equity ratio of 0.095, and market leadership in IT services with a diversified global client base. Key risks involve regulatory compliance in multiple jurisdictions, intense competition within the IT sector, and macroeconomic factors affecting client spending. Recent strategic actions include sustained digital deal wins and stock incentives for key managerial personnel, reflecting ongoing investment in talent and growth initiatives.
Technically, the stock shows mixed signals with current price below the 200-day moving average but above the 50-day average, indicating some consolidation. Momentum indicators suggest moderate strength, supported by recent positive news flow around AI-driven services and solid earnings. Overall, the data points to a cautious yet constructive environment where market participants may consider monitoring developments closely for further clarity on trend direction.
Company and Industry Overview
Company Basics
Price Performance
Company Size
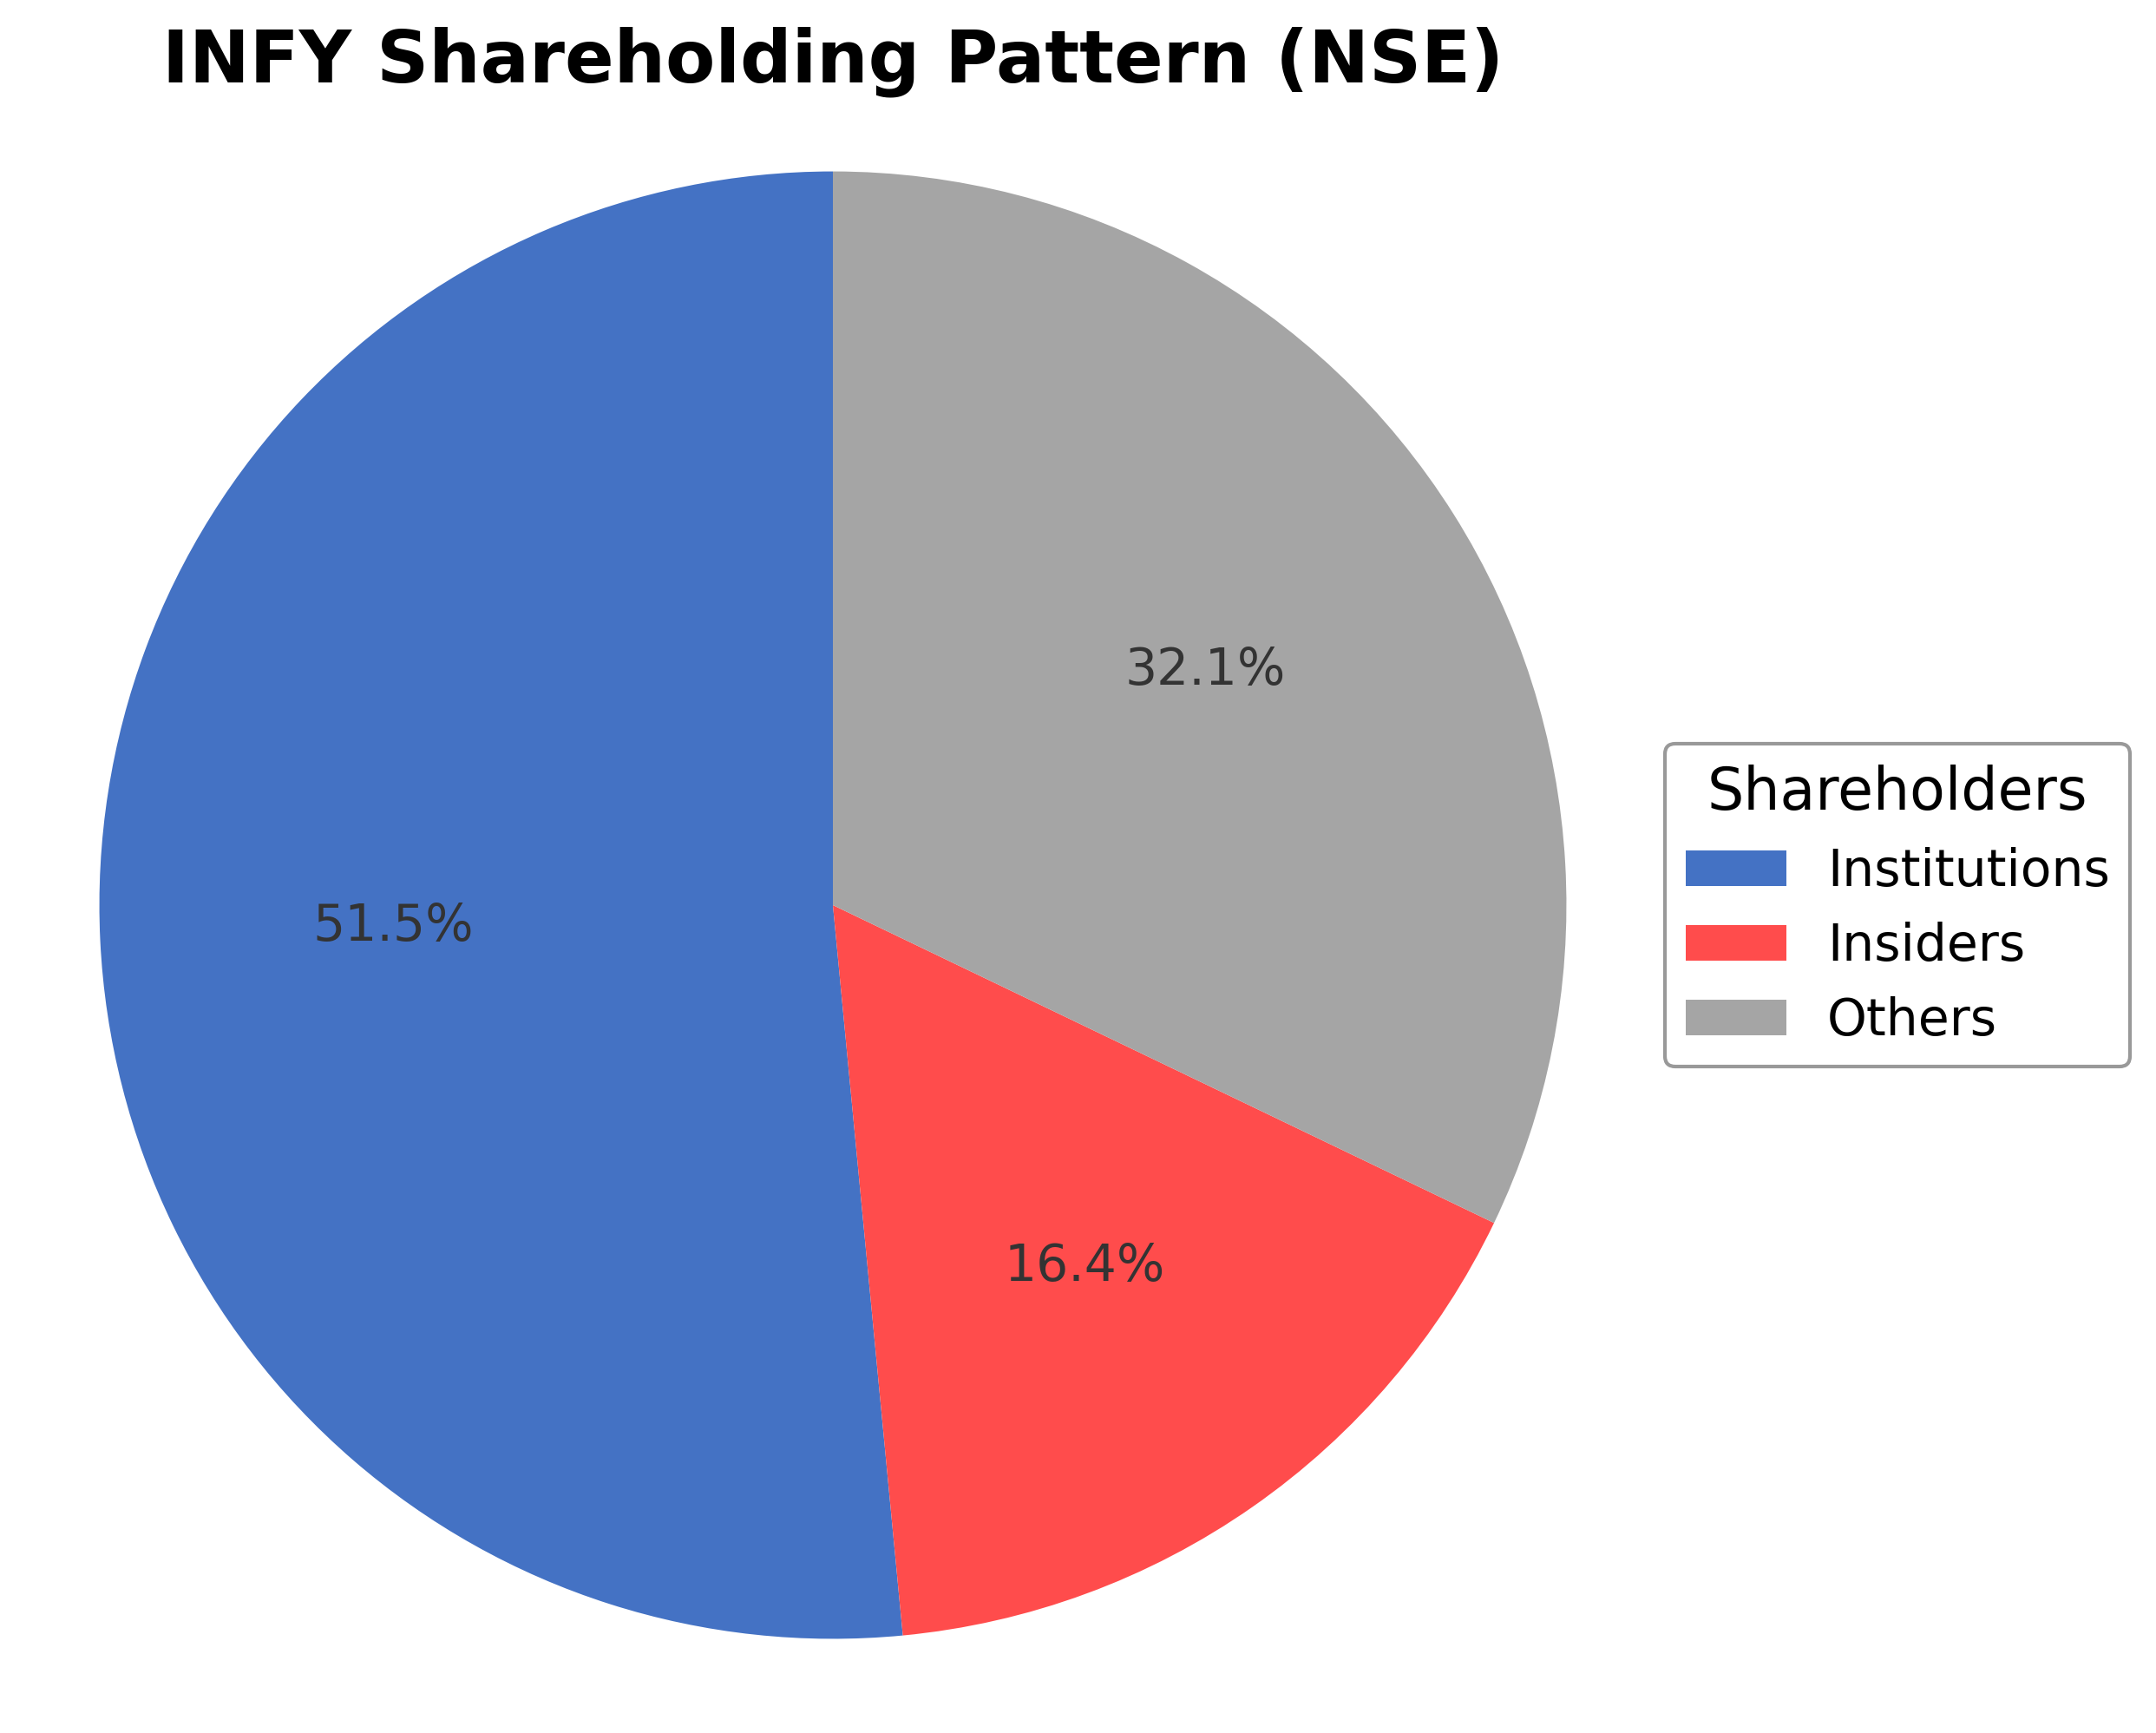
Shareholding Pattern
Sector and Industry Analysis
The global information technology (IT) services sector is a substantial and rapidly expanding market, driven by increasing digital transformation initiatives across industries. Valued in the trillions of dollars, the sector encompasses software development, consulting, cloud services, and business process outsourcing. Major players include multinational corporations such as Infosys, TCS, Accenture, and IBM, which compete for market share by offering comprehensive technology solutions worldwide.
Industry trends highlight a strong shift toward cloud computing, artificial intelligence, machine learning, and cybersecurity services as organizations seek to enhance operational efficiency and innovation. The competitive landscape is marked by high barriers to entry due to the need for specialized talent, technological expertise, and established client relationships. Companies like Infosys maintain a competitive edge through diversified service portfolios, global delivery models, and investments in emerging technologies.
The regulatory environment for the IT services industry involves data protection laws, intellectual property rights, and cross-border data flow regulations that vary by country. Compliance with frameworks such as GDPR in Europe and evolving cybersecurity standards is critical for maintaining client trust and operational continuity. The outlook suggests increasing regulatory scrutiny, particularly around data privacy and security, which will shape service delivery and governance practices in the sector.
Note: Analysis synthesized from industry research, market reports, and regulatory filings. Information is subject to change based on market conditions.
Financial Ratios Dashboard
Illustrative Scenario Analysis
DCF Assumptions:
Method: Two-Stage EPS-Priority Model
Financials
Peer Analysis
| Company Name | Market Cap | P/E Ratio | P/B Ratio | EV/EBITDA | Price to CFO |
|---|---|---|---|---|---|
| Infosys Ltd. | ₹4.21T | 13.42 | 4.46 | 942.53 | 10.65 |
| Tata Consultancy Services Ltd. | ₹8.16T | 16.3 | 7.4 | 10.81 | 15.58 |
| Wipro Ltd. | ₹1.75T | 13.89 | 2.26 | 8.99 | 12.42 |
| HCL Technologies Limited | ₹3.44T | 19.79 | 4.59 | 1230.17 | 16.65 |
| Tech Mahindra Ltd. | ₹1.38T | 26.87 | 4.65 | 14.25 | 28.45 |
| LTIMindtree Limited | N/A | N/A | N/A | N/A | N/A |
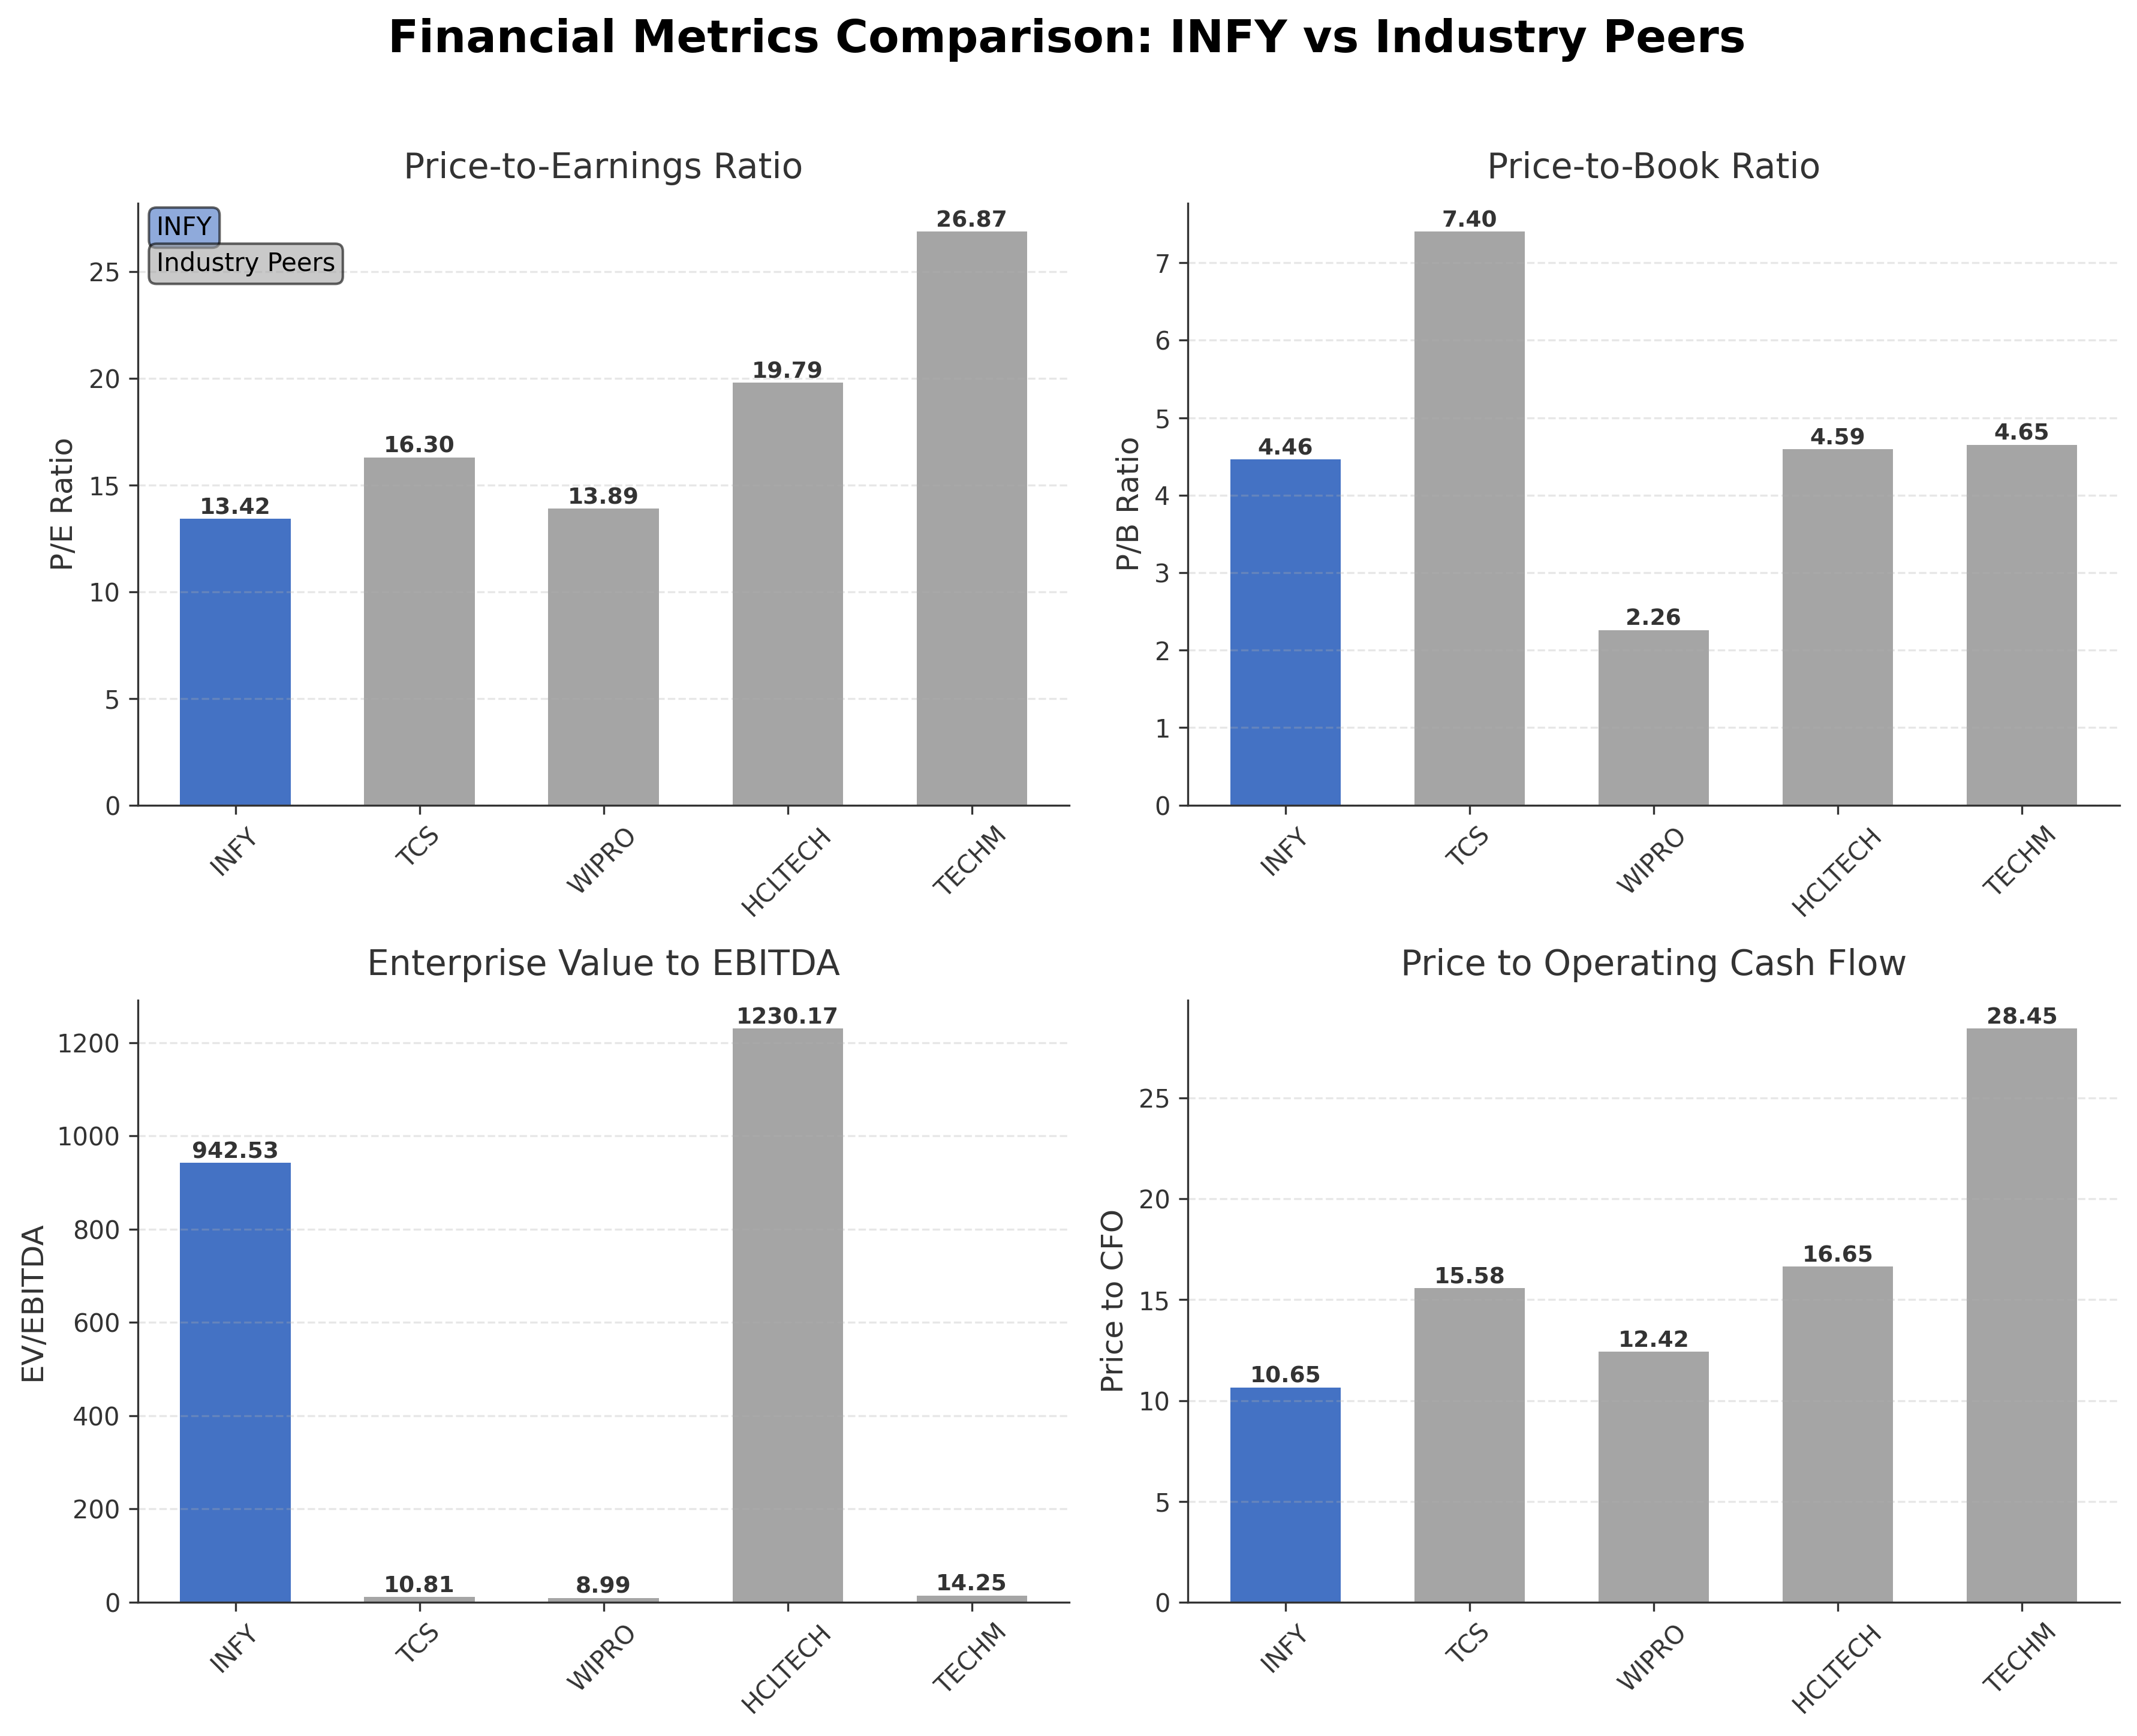
Comparison Analysis: Infosys Ltd. exhibits a competitive valuation profile relative to its Indian IT sector peers, with a trailing P/E ratio of 13.42 below TCS and HCL Technologies but comparable to Wipro. Its P/B ratio at 4.46 is moderate, lower than TCS but higher than Wipro, reflecting balanced market valuation. The EV/EBITDA ratio is an outlier at 942.53, significantly exceeding peers, which may indicate accounting or reporting differences. Infosys’s return on equity of 32% is strong, second only to TCS’s 47.74%, highlighting effective capital utilization. Price to CFO is lower than most peers, suggesting relatively efficient cash flow generation. Overall, Infosys holds a solid position among its regional competitors with strengths in profitability and valuation metrics.
Financial Metrics Comparison with Peers
Financial Statements
Comprehensive financial data including income, balance sheet, and cash flow metrics
Income Statement
| fiscal_date | 2026-03-31 | 2025-03-31 | 2024-03-31 | 2023-03-31 | 2022-03-31 |
|---|---|---|---|---|---|
| Sales | 20.16B | 19.28B | 18.56B | 18.21B | 16.31B |
| Cost Of Goods | 14.08B | 13.40B | 12.97B | 12.71B | 11.00B |
| Gross Profit | 6.08B | 5.87B | 5.59B | 5.50B | 5.32B |
| Operating Expense Selling General And Administrative | 1.83B | 1.63B | 1.58B | 1.49B | 1.56B |
| Operating Expense Other Operating Expenses | 129.00M | 123.00M | 121.00M | 116.00M | 110.00M |
| Operating Income | 4.09B | 4.08B | 3.85B | 3.86B | 3.75B |
| Non Operating Interest Income | 351.00M | 345.00M | 487.00M | 226.00M | 221.00M |
| Non Operating Interest Expense | 47.00M | 49.00M | 56.00M | 35.00M | 27.00M |
| Other Income Expense | 113.00M | 74.00M | 66.00M | 74.00M | 87.00M |
| Pretax Income | 4.51B | 4.45B | 4.35B | 4.12B | 4.04B |
| Income Tax | 1.19B | 1.28B | 1.18B | 1.14B | 1.07B |
| Net Income | 3.32B | 3.16B | 3.17B | 2.98B | 2.97B |
| Eps Basic | 0.81 | 0.76 | 0.77 | 0.71 | 0.70 |
| Eps Diluted | 0.80 | 0.76 | 0.76 | 0.71 | 0.70 |
| Basic Shares Outstanding | 4.11B | 4.16B | 4.14B | 48.22M | 48.55M |
| Diluted Shares Outstanding | 4.11B | 4.16B | 4.14B | 48.22M | 48.55M |
| Ebit | 4.55B | 4.50B | 4.40B | 4.16B | 4.06B |
| Ebitda | 5.01B | 5.01B | 4.92B | 4.65B | 4.47B |
| Net Income Continuous Operations | 3.32B | 3.16B | 3.17B | 2.98B | 2.97B |
| Minority Interests | -3.00M | -4.00M | -2.00M | -2.00M | -5.00M |
Data provided by Twelve Data
Balance Sheet
| fiscal_date | 2026-03-31 | 2025-03-31 | 2024-03-31 | 2023-03-31 | 2022-03-31 |
|---|---|---|---|---|---|
| Cash And Cash Equivalents | 2.34B | 2.86B | 1.77B | 1.48B | 2.31B |
| Accounts Receivable | 3.71B | 3.65B | 3.62B | 3.09B | 3.00B |
| Total Assets | 16.45B | 17.42B | 16.52B | 15.31B | 15.55B |
| Total Liabilities | 6.61B | 6.16B | 5.92B | 6.09B | 5.56B |
| Long Term Debt | 634.00M | 675.00M | 767.00M | 859.00M | 607.00M |
| Shareholders Equity | 9.84B | 11.26B | 10.61B | 9.22B | 9.99B |
Data provided by Twelve Data
Cash Flow Statement
| fiscal_date | 2026-03-31 | 2025-03-31 | 2024-03-31 | 2023-03-31 | 2022-03-31 |
|---|---|---|---|---|---|
| Operating Activities Net Income | 3.32B | 3.16B | 3.17B | 2.98B | 2.97B |
| Operating Activities Depreciation | 552.00M | 569.00M | 565.00M | 524.00M | 466.00M |
| Operating Activities Deferred Taxes | 1.19B | 1.28B | 1.18B | 1.14B | 1.07B |
| Operating Activities Stock Based Compensation | 108.00M | 95.00M | 79.00M | 64.00M | 56.00M |
| Operating Activities Other Non Cash Items | 14.00M | -30.00M | -140.00M | -39.00M | -73.00M |
| Operating Activities Accounts Receivable | -583.00M | -209.00M | -322.00M | -875.00M | -1.06B |
| Operating Activities Accounts Payable | -3.00M | 21.00M | 11.00M | -35.00M | 200.00M |
| Operating Activities Other Assets Liabilities | 587.00M | 275.00M | -161.00M | 510.00M | 931.00M |
| Operating Activities Operating Cash Flow | 5.18B | 5.17B | 4.38B | 4.27B | 4.55B |
| Investing Activities Net Acquisitions | -77.00M | -377.00M | 0.00 | -113.00M | 0.00 |
| Investing Activities Purchase Of Investments | -10.88B | -10.61B | -10.46B | -10.67B | -8.59B |
| Investing Activities Sale Of Investments | 11.19B | 10.83B | 9.92B | 10.79B | 7.79B |
| Investing Activities Other Investing Activity | -23.00M | -52.00M | -12.00M | -28.00M | -21.00M |
| Investing Activities Investing Cash Flow | 218.00M | -211.00M | -552.00M | -19.00M | -824.00M |
| Financing Activities Long Term Debt Payments | -318.00M | -396.00M | -245.00M | -151.00M | -125.00M |
| Financing Activities Common Stock Repurchase | -2.01B | 0.00 | 0.00 | -1.40B | -1.50B |
| Financing Activities Common Dividends | -2.13B | -2.42B | -1.78B | -1.70B | -1.70B |
| Financing Activities Other Financing Charges | -28.00M | -64.00M | -95.00M | -46.00M | 4.00M |
| Financing Activities Financing Cash Flow | -4.49B | -2.88B | -2.12B | -3.29B | -3.33B |
| End Cash Position | 2.34B | 2.86B | 1.77B | 1.48B | 2.31B |
| Free Cash Flow | 3.73B | 4.09B | 2.88B | 2.53B | 3.06B |
| Investing Activities Capital Expenditures | N/A | N/A | N/A | N/A | N/A |
Data provided by Twelve Data
Technical Analysis
Key Insights
- Current trend shows consolidation with the stock price trading below the 200-day moving average (₹1357) but above the 50-day moving average (₹1111), indicating mixed momentum.
- Key support is observed near the 52-week low of ₹982.4, while resistance is near the 52-week high of ₹1728, with intermediate resistance around the 200-day moving average.
- The stock is positioned above the 10-day and 50-day moving averages but below the 200-day moving average, suggesting short-term strength amid longer-term caution.
- Momentum indicators such as RSI are moderate, reflecting neither overbought nor oversold conditions; MACD shows a neutral to slightly positive crossover, while stochastic oscillators indicate potential for sideways movement.
- Multi-timeframe analysis reveals daily and weekly charts consolidating with limited directional bias, while monthly charts show a longer-term downtrend from the 52-week high.
- Potential market scenarios include a continuation of range-bound trading between support and resistance levels or a breakout above the 200-day moving average to signal renewed upward momentum.
Trending News
1. Headline: Infosys Stock Grinds Higher As AI And Cash Flow Impress - StocksToTrade
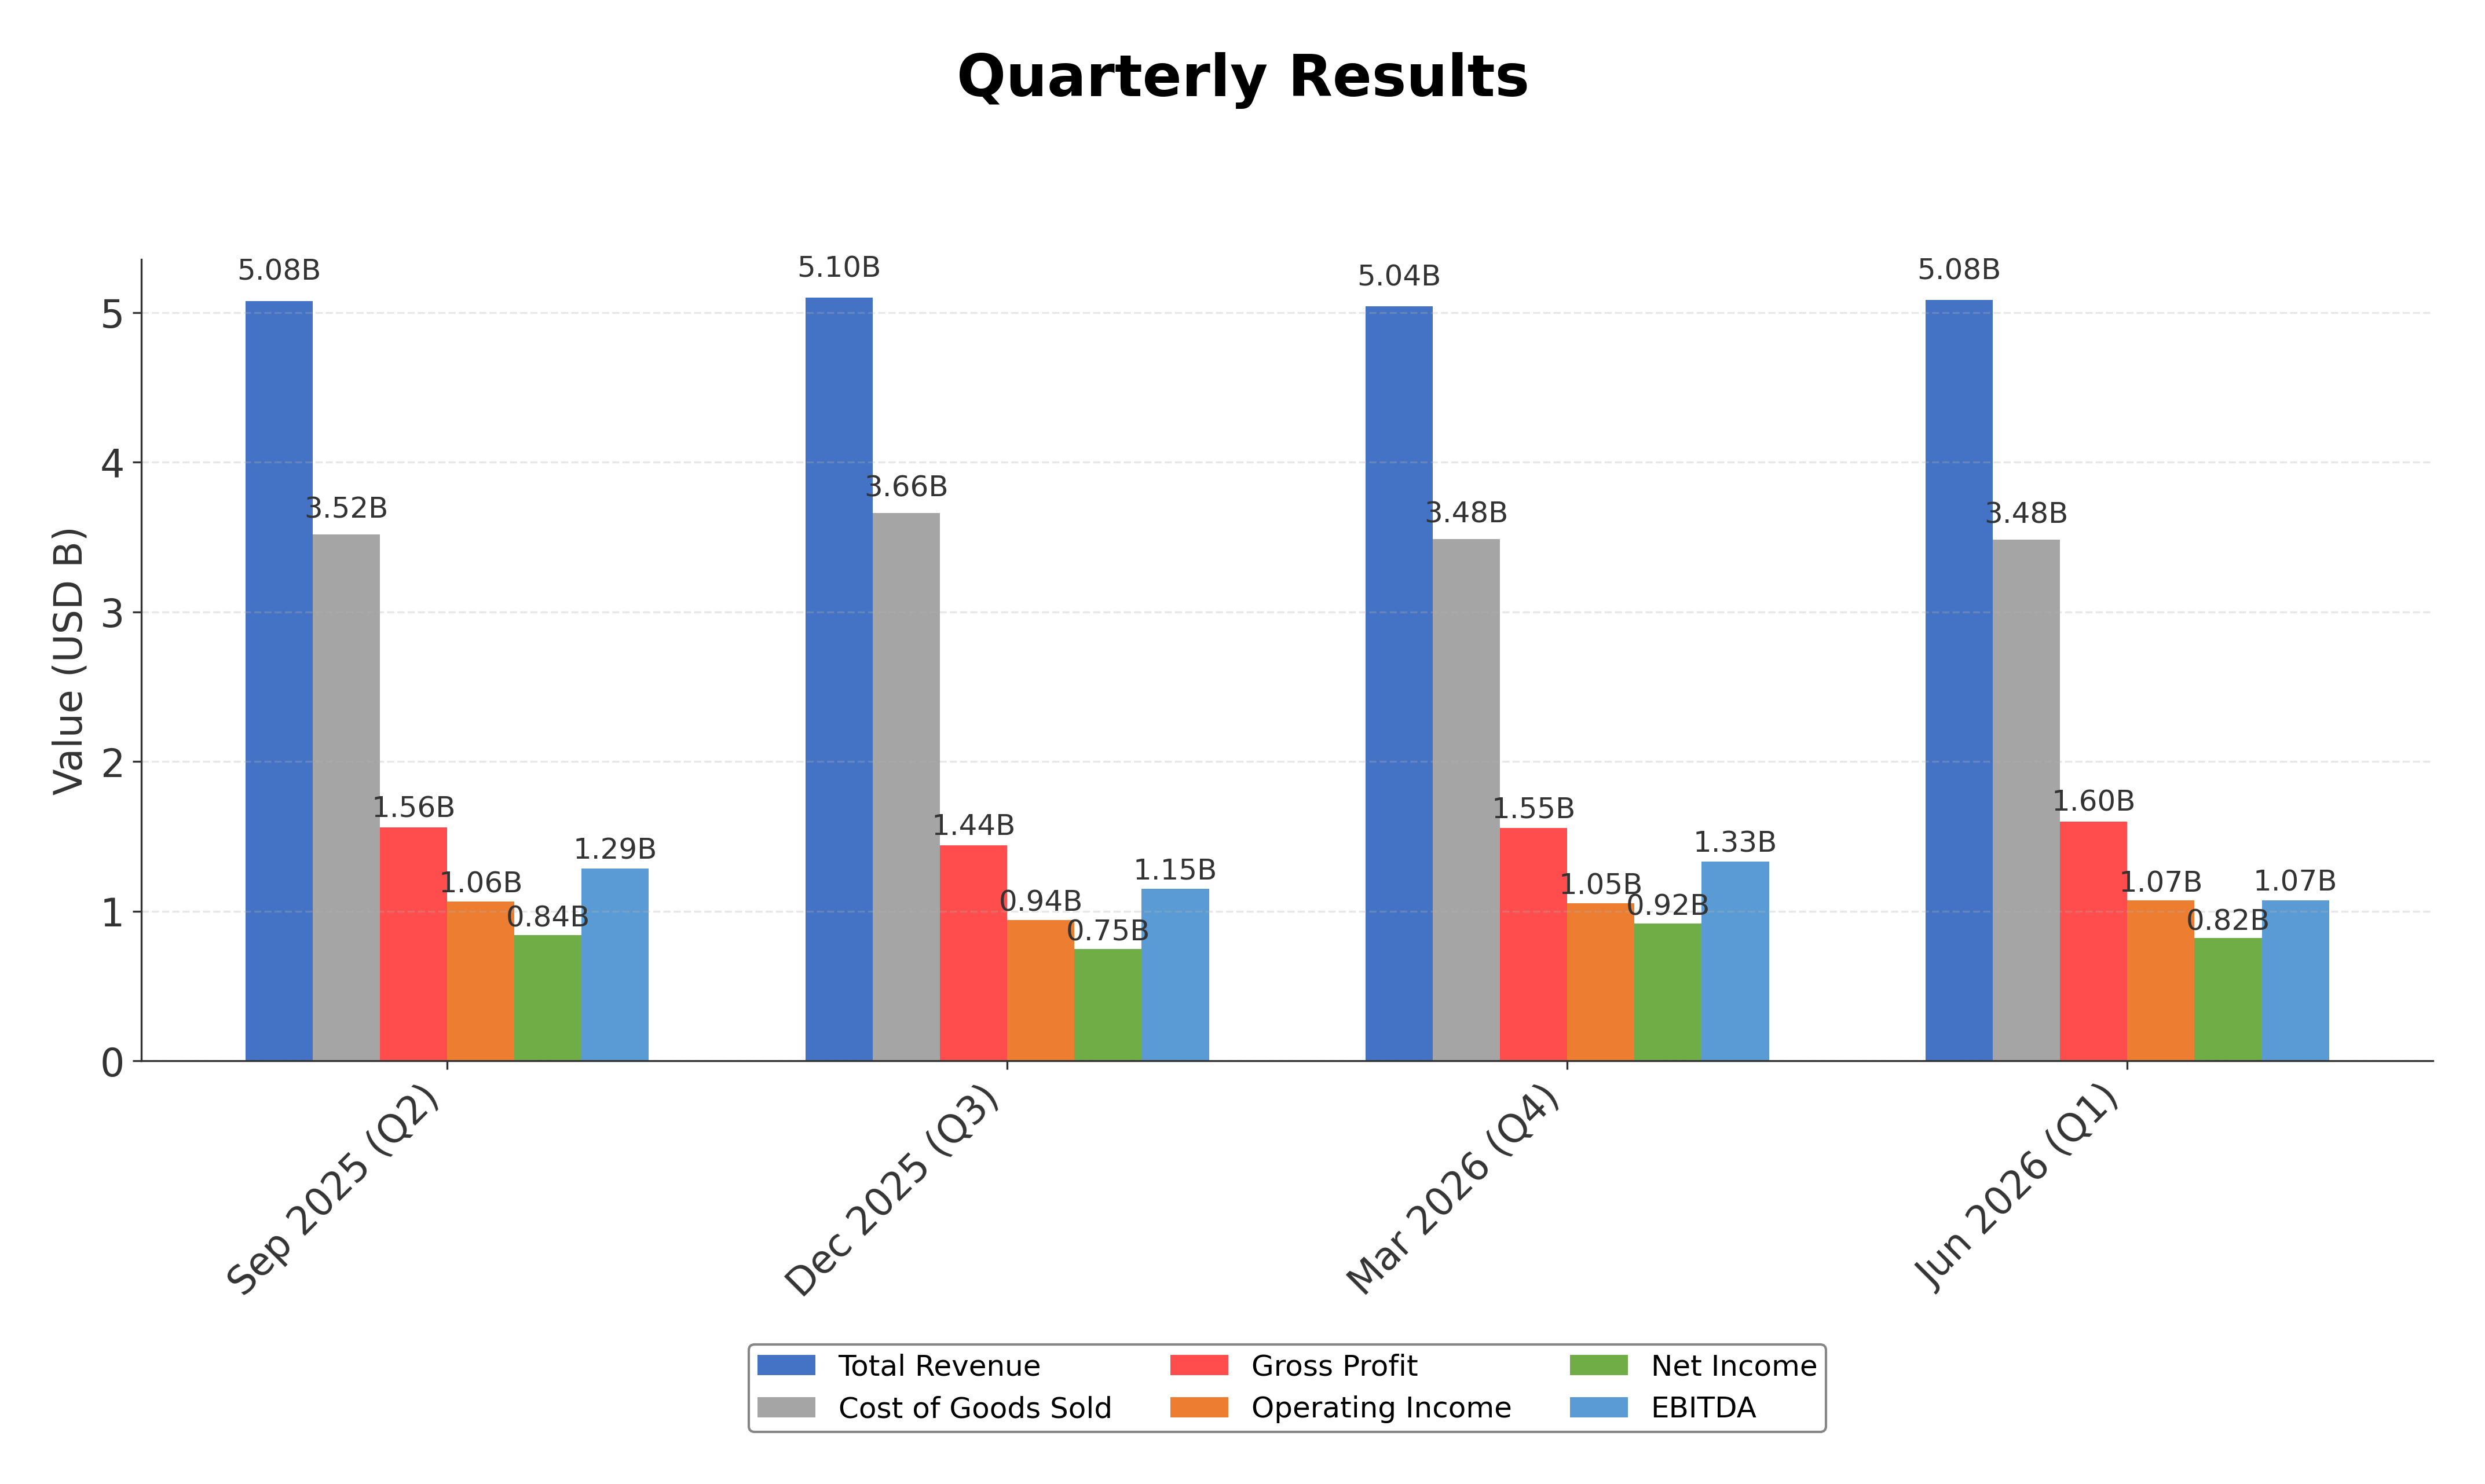
Summary: Infosys Limited stocks have been trading up by 5.38 percent after strong digital deal wins boosted investor confidence. Key Takeaways Q1 FY27 revenue reached $5.08B, up 2.4% year over year and 1.0% quarter over quarter in constant currency, with operating margins holding at a solid 21.1%. ...
Sentiment: positive
2. Headline: Infosys details stock incentives for key managers | INFY SEC Filing - Form 6-K
Summary: Stock incentives acquired by Infosys key managerial personnel under stock option plans, disclosed to NSE and BSE within 2 trading days under SEBI insider trading rules and reported under SEC requirements.
Sentiment: neutral
Summary: Infosys Share Price: Find the latest news on Infosys Stock Price. Get all the information on Infosys with historic price charts for NSE / BSE. Experts & Broker view also get the Infosys Ltd. buy/sell tips detailed news, announcements, Forecasts, Analysts, Valuation, Earning forecasts, Estimates, ...
Sentiment: neutral
4. Headline: Infosys Share Price Highlights: Infosys Stock Price History - The Economic Times
Summary: Discover the Infosys Stock Liveblog, your ultimate resource for real-time updates and insightful analysis on a prominent stock. Keep track of Infosys with the latest details, including: Last traded price 1105.7, Market capitalization: 448646.49, Volume: 28100895, Price-to-earnings ratio 14.81, ...
Sentiment: neutral
5. Headline: Infosys Ltd (INFY) Stock Up 5.3% and Still Undervalued -- GF Score: 86/100
Summary: On July 27, 2026, Infosys Ltd (INFY) shares rose 5.3% to a current price of $11.70. This increase comes amid a volatile year for the stock, which has experience
Sentiment: positive
Powered by Brave
Recent Updates
News Summary
As of 2026-07-28. Infosys Limited reported Q1 FY27 revenue of $5.08 billion, representing a 2.4% year-over-year increase and a 1.0% quarter-over-quarter rise in constant currency. The company maintained a strong operating margin of 21.1%, supported by robust digital deal wins and positive cash flow generation, highlighting resilience in a challenging IT market. Additionally, Infosys disclosed stock incentives granted to key managerial personnel under stock option plans, aligning management interests with shareholders and complying with regulatory requirements. These developments underscore ongoing strategic focus on growth and governance.
News Sentiment
The overall sentiment from recent updates is predominantly positive, driven by steady revenue growth, maintained operating margins, and strong digital deal wins that bolster confidence in Infosys's business model. The disclosure of stock incentives for key managers is neutral but indicates alignment of management with shareholder value creation. The combination of solid financial performance and transparent governance practices contributes to a constructive outlook, tempered by the broader IT sector challenges.
Source List
- https://stockstotrade.com/news/infosys-limited-infy-news-2026_07_28/
- https://www.stocktitan.net/sec-filings/INFY/6-k-infosys-ltd-current-report-foreign-issuer-a6abb389ae73.html
Analytical Overview
Analysis Summary
Infosys’s valuation metrics, including a trailing P/E of 13.42 and forward P/E of 13.01, align closely with the industry average of 13.42, suggesting fair market pricing relative to peers. The company’s revenue growth of 2.9% quarter-over-quarter and positive cash flow trends indicate a stable growth trajectory supported by strong operational performance. Financial health appears robust with a low debt-to-equity ratio of 0.095 and substantial operating cash flow of INR 395.9 billion, reflecting sound liquidity and capital management. Sector-specific opportunities include increasing demand for AI and digital transformation services, while challenges involve regulatory compliance and competitive pressures in the IT services market. Considering India-specific factors, Infosys benefits from a favorable regulatory environment and growing domestic and global IT spending trends.
Overall Business and Market Assessment
Supporting Factors: Infosys’s strong profitability metrics such as a 32% ROE and solid operating margins near 21%, alongside consistent revenue growth and healthy cash flow generation
Risk Factors: No data
SWOT Analysis
Strengths
- Strong market position as a leading Indian IT services provider.
- Robust profitability with a 32% return on equity and 21% operating margin.
- Healthy cash flow generation supporting operational and strategic initiatives.
- Diversified global client base across multiple industries.
Weaknesses
- High EV/EBITDA ratio indicating potential valuation premium or accounting factors.
- Moderate revenue growth rate of approximately 2.9% quarter-over-quarter.
- Relatively low insider ownership at 16.35%, which may impact alignment.
- Dependence on global economic conditions affecting client spending.
Opportunities
- Growing demand for AI and digital transformation services worldwide.
- Expansion into emerging technology platforms and cloud services.
- Increasing institutional investor interest supporting stock liquidity.
- Favorable regulatory environment in India boosting IT sector growth.
Threats
- Intense competition from domestic and international IT service providers.
- Regulatory and compliance risks across multiple jurisdictions.
- Potential macroeconomic headwinds impacting IT budgets globally.
- Currency fluctuations affecting revenue and profitability.
Company Description
Infosys Ltd. is an Indian multinational technology and consulting company that provides information technology services, business consulting, and outsourcing solutions to enterprises worldwide. Headquartered in Bengaluru, India and founded in 1981, Infosys focuses on enabling large organizations to manage and modernize their technology and operations. Its core activities include application development and maintenance, cloud transformation, data and analytics, artificial intelligence, engineering services, cybersecurity, and business process management. Infosys also offers specialized digital platforms and products, such as banking and financial services software, along with automation and AI-driven solutions that support complex, global operations. Serving clients across sectors like financial services, retail, manufacturing, communications, healthcare, and energy, the company plays a significant role in supporting digital transformation and operational efficiency for Global 2000-type businesses. With a broad international presence spanning numerous countries, Infosys operates as a key technology partner for enterprises seeking scalable, integrated IT and business process solutions.