

Infosys Ltd (INFY)
Stock Analysis Report
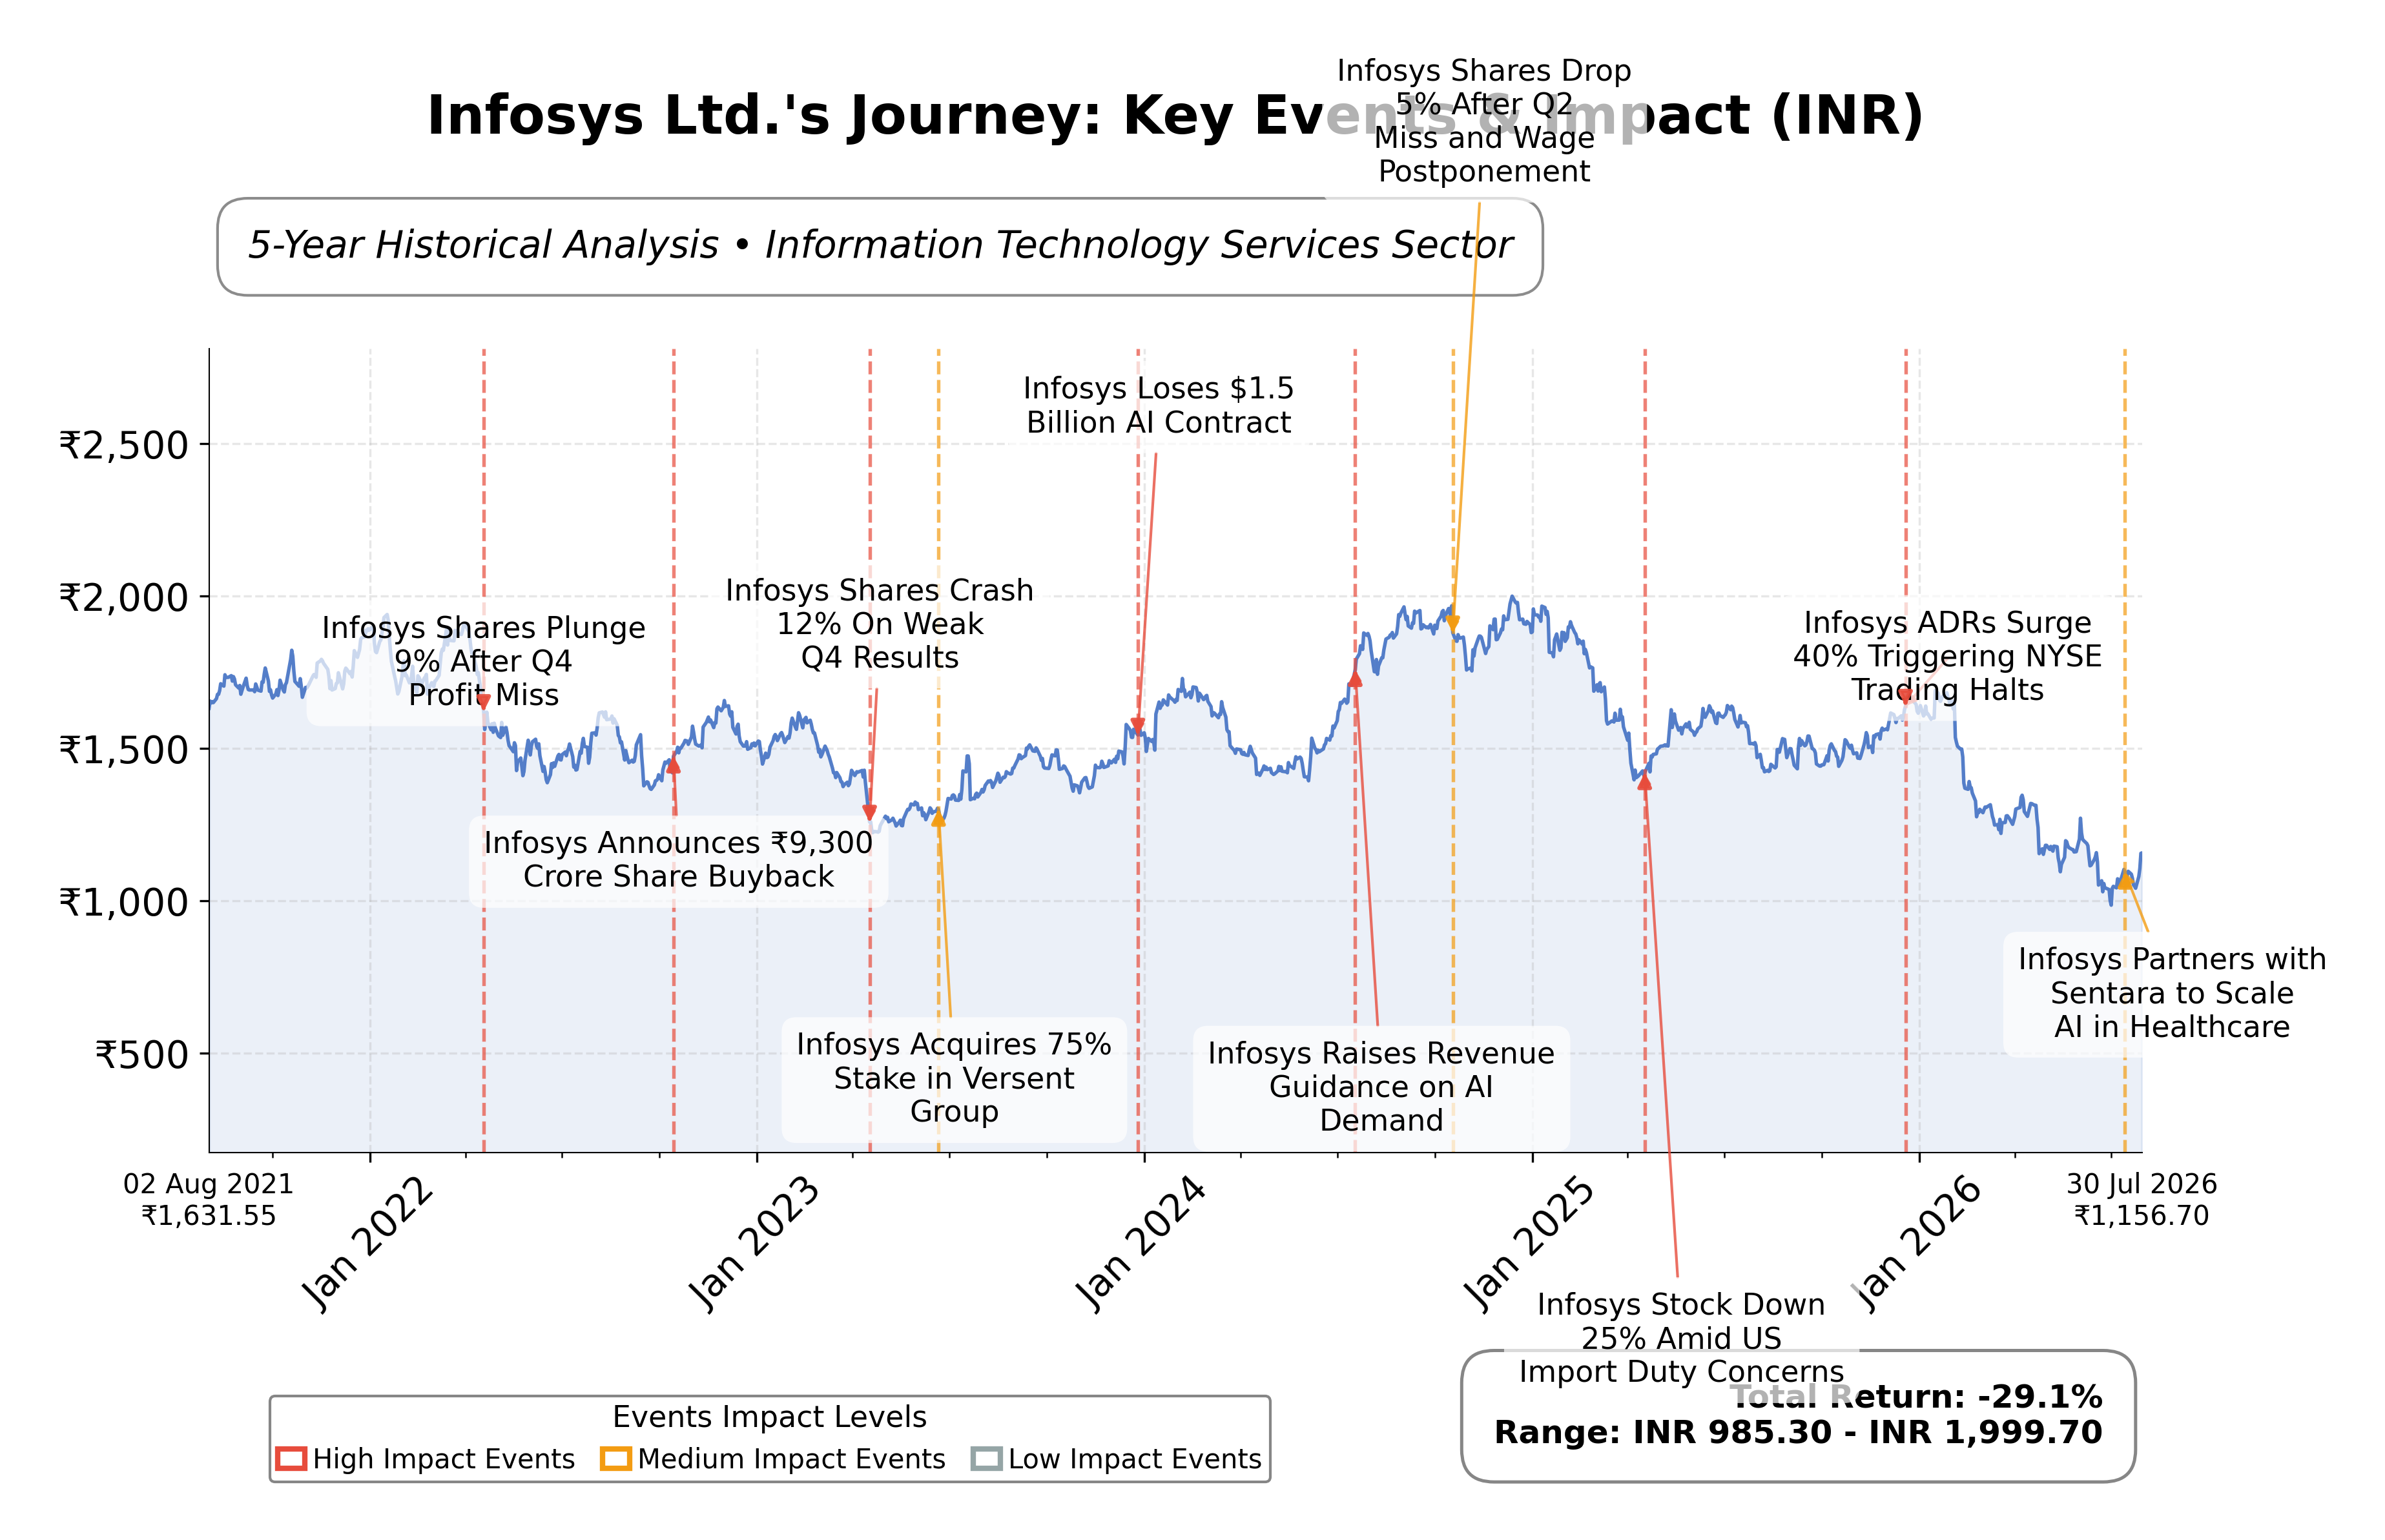
Stock Journey
Key Positives and Key Risks
Pros
- Strong profitability evidenced by a 32% return on equity, indicating effective capital utilization.
- Robust cash flow generation with operating cash flow of INR 395.9 billion and free cash flow of INR 306.4 billion supporting financial flexibility.
- Valuation metrics such as a trailing P/E of 13.42 and forward P/E of 13.01 align with industry averages, suggesting fair market pricing.
Cons
- Extremely high EV/EBITDA ratio of 942.53, which may indicate valuation anomalies or capital structure complexities.
- Stock price has declined approximately 45.6% from its 52-week high, reflecting volatility and potential market concerns.
- Moderate debt-to-equity ratio of 0.095 requires ongoing monitoring to manage leverage risks.
Disclosure: This information is for general awareness and does not constitute investment advice
Report Summary
Infosys Ltd. is a leading Indian multinational technology and consulting company listed on the NSE, operating primarily in the Information Technology Services sector within the Technology industry. The company offers a broad range of IT services including application development, cloud transformation, AI, cybersecurity, and business process management, serving global clients across multiple industries such as financial services, retail, manufacturing, and healthcare. Headquartered in Bengaluru, Infosys holds a strong market position as a key technology partner for large enterprises undergoing digital transformation.
Financially, Infosys reported trailing twelve months (TTM) revenue of approximately INR 1.96 trillion with a gross margin of 31.48%, operating margin of 21.09%, and net profit margin of 16.37%. The company’s return on equity (ROE) stands at a robust 32%, while return on assets (ROA) is 15.28%, indicating efficient use of capital and assets. Operating cash flow for the TTM is INR 395.9 billion, with free cash flow of INR 306.4 billion, reflecting strong cash generation capabilities supporting sustainable operations and shareholder returns.
Valuation metrics show a trailing price-to-earnings (P/E) ratio of 13.42 and a forward P/E of 13.01, which are in line with the industry average of 13.42. The price-to-book (P/B) ratio is 4.46, and the enterprise value to EBITDA (EV/EBITDA) is notably high at 942.53, suggesting market pricing may reflect growth expectations or capital structure nuances. The stock currently trades at INR 1,156.70, within a 52-week range of INR 982.40 to INR 1,728, indicating a significant decline from its peak over the past year.
Infosys benefits from strengths including strong cash flow generation, low debt levels with a debt-to-equity ratio of 0.095, and market leadership in IT services. Key risks include regulatory compliance requirements under SEBI and SEC frameworks, competitive pressures in the global IT sector, and macroeconomic factors impacting client spending. Recent strategic developments include significant AI-related deal wins and stock incentives for key managerial personnel, which underscore ongoing investment in talent and technology.
Technically, the stock shows mixed signals with price currently below the 200-day moving average of INR 1,357 but above the 50-day average of INR 1,111, reflecting some short-term support. Momentum indicators and recent positive news on AI deals have contributed to upward price movements. Overall, the data suggests a cautious stance with potential for accumulation in favorable conditions, balanced by valuation considerations and market volatility.
Company and Industry Overview
Company Basics
Price Performance
Company Size
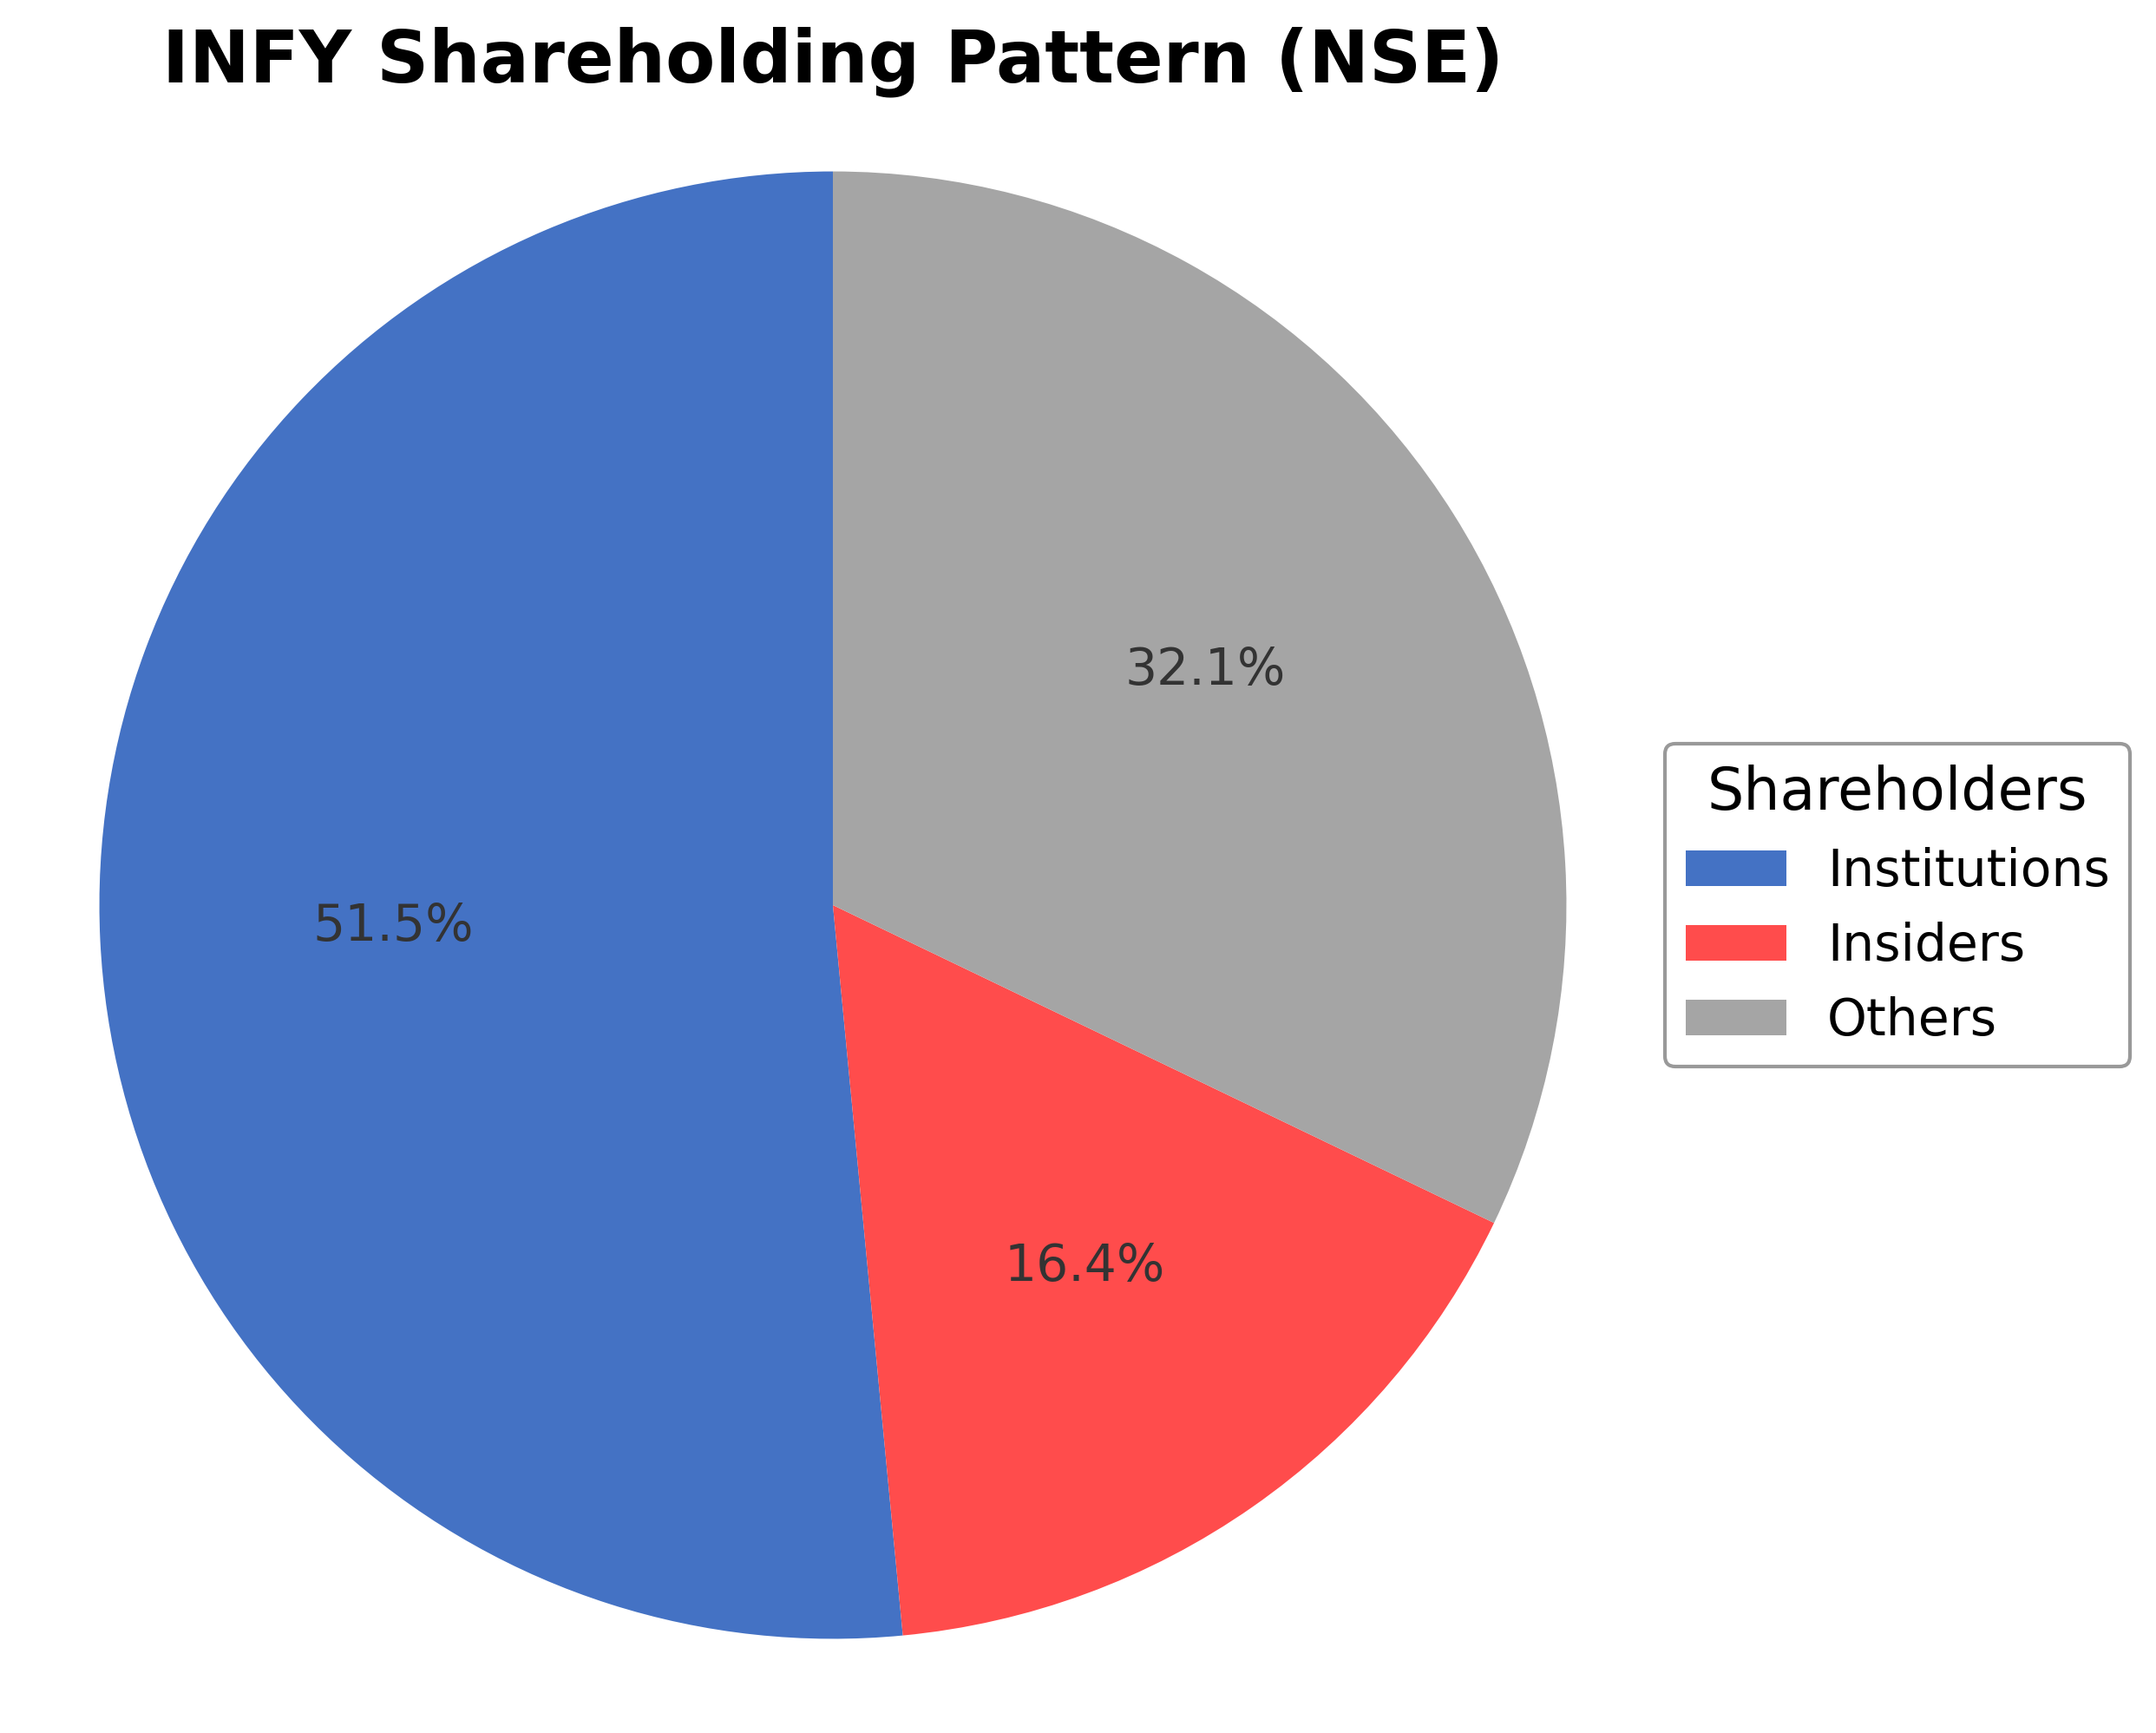
Shareholding Pattern
Sector and Industry Analysis
The global information technology (IT) services sector is a significant contributor to the digital economy, with a market size valued in the trillions of dollars and projected to grow steadily due to increasing digital transformation initiatives across industries. Major players include multinational corporations such as Infosys, TCS, Accenture, and IBM, which dominate through extensive service portfolios and global delivery capabilities. The sector benefits from broad demand in areas like cloud computing, artificial intelligence, and business process outsourcing, driving sustained revenue growth.
Industry trends highlight a shift toward integrated digital solutions encompassing AI, machine learning, cybersecurity, and cloud services, with companies investing heavily in innovation to maintain competitive advantage. Barriers to entry remain high due to the need for specialized technical expertise, established client relationships, and significant capital investment in research and development. Firms like Infosys leverage diversified service offerings and global presence to position themselves as end-to-end technology partners, navigating intense competition by focusing on quality, client customization, and emerging technologies.
The regulatory landscape for IT services is shaped by data protection laws, cross-border data flow restrictions, and compliance standards such as GDPR and industry-specific regulations. These frameworks impact how companies manage client data, cybersecurity protocols, and outsourcing arrangements, requiring robust governance and transparency. Looking ahead, evolving regulations around data privacy and digital security are expected to increase operational complexity but also create opportunities for IT firms to offer compliance and risk management solutions.
Note: Analysis synthesized from industry research, market reports, and regulatory filings. Information is subject to change based on market conditions.
Financial Ratios Dashboard
Illustrative Scenario Analysis
DCF Assumptions:
Method: Two-Stage EPS-Priority Model
Financials
Peer Analysis
| Company Name | Market Cap | P/E Ratio | P/B Ratio | EV/EBITDA | Price to CFO |
|---|---|---|---|---|---|
| Infosys Ltd. | ₹4.21T | 13.42 | 4.46 | 942.53 | 10.65 |
| Tata Consultancy Services Ltd. | ₹8.16T | 16.30 | 7.40 | 10.81 | 15.58 |
| Wipro Ltd. | ₹1.75T | 13.89 | 2.26 | 8.99 | 12.42 |
| HCL Technologies Limited | ₹3.44T | 19.79 | 4.59 | 1230.17 | 16.65 |
| Tech Mahindra Ltd. | ₹1.38T | 26.87 | 4.65 | 14.25 | 28.45 |
| LTIMindtree Limited | N/A | N/A | N/A | N/A | N/A |
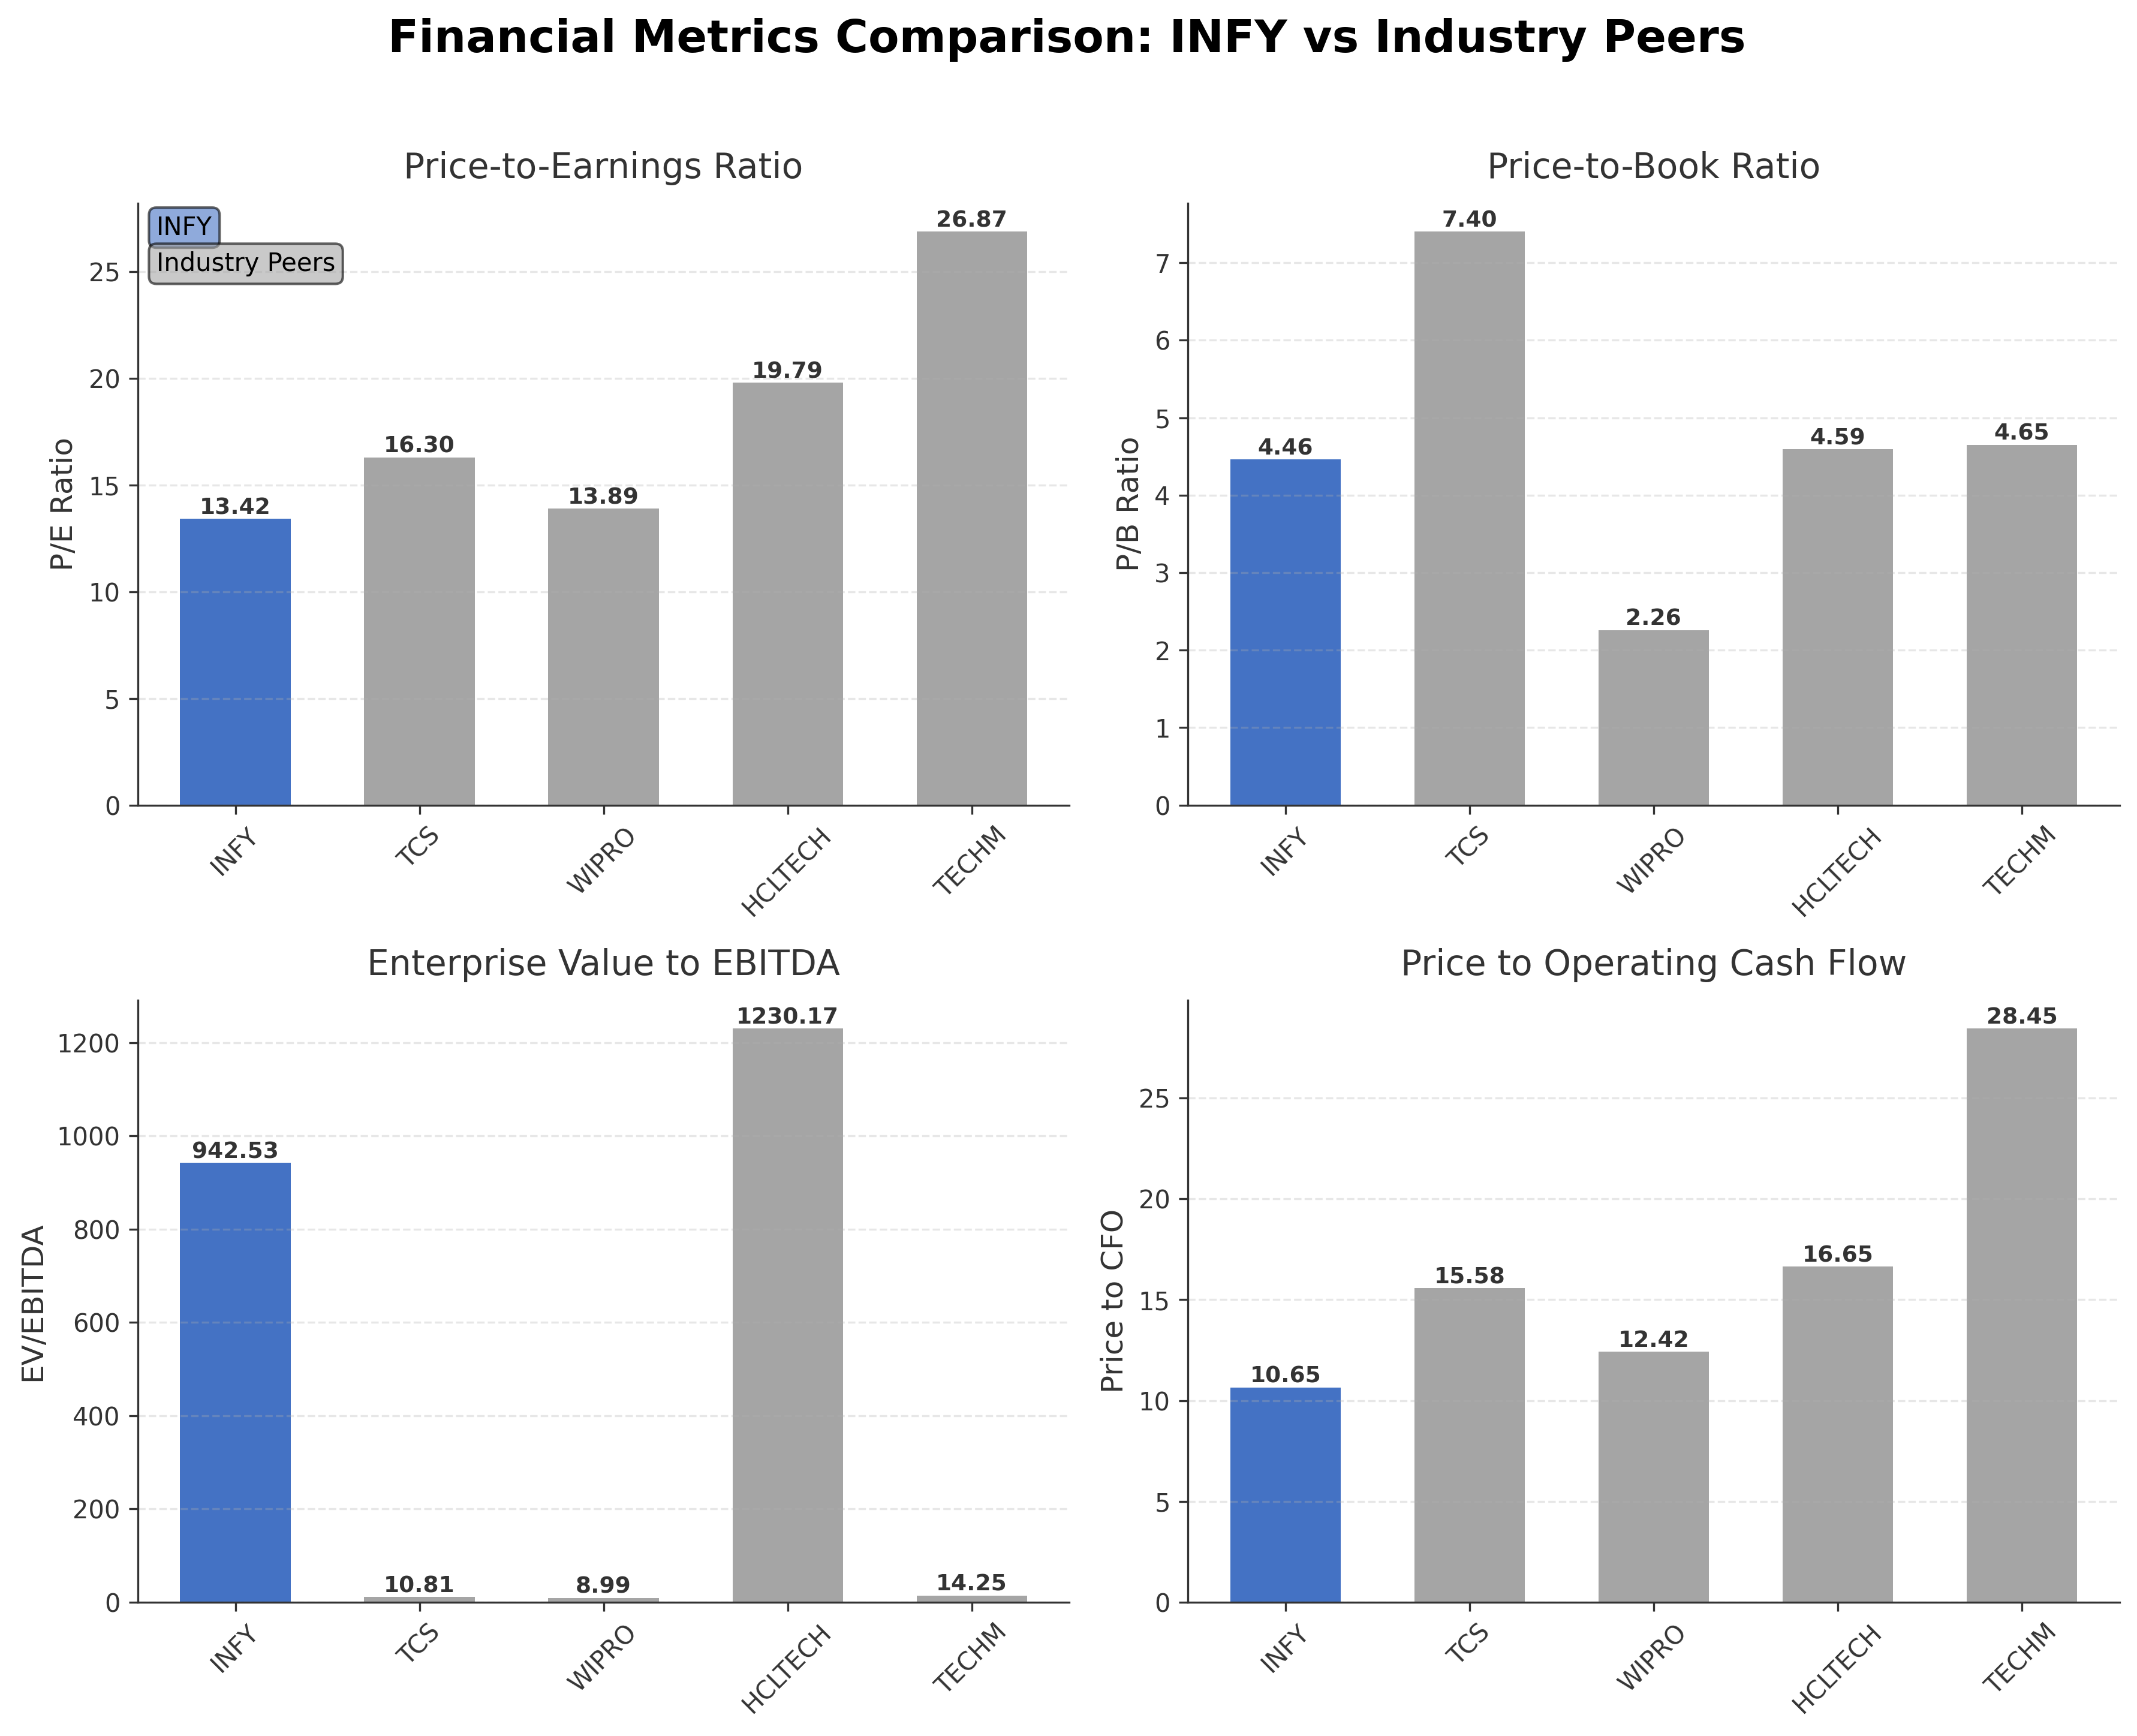
Comparison Analysis: Infosys Ltd. demonstrates a competitive valuation profile relative to its Indian IT sector peers, with a trailing P/E ratio of 13.42 below TCS and HCL Technologies but comparable to Wipro. Its return on equity of 32% is strong, though lower than TCS’s 47.74%, indicating solid profitability. The EV/EBITDA ratio for Infosys is unusually high at 942.53, which contrasts sharply with peers, suggesting possible differences in enterprise value calculations or capital structure. Price to cash flow at 10.65 is more attractive than most peers, reflecting efficient cash generation. Overall, Infosys maintains a balanced position with strengths in profitability and valuation metrics within the competitive landscape.
Financial Metrics Comparison with Peers
Financial Statements
Comprehensive financial data including income, balance sheet, and cash flow metrics
Income Statement
| fiscal_date | 2026-03-31 | 2025-03-31 | 2024-03-31 | 2023-03-31 | 2022-03-31 |
|---|---|---|---|---|---|
| Sales | 20.16B | 19.28B | 18.56B | 18.21B | 16.31B |
| Cost Of Goods | 14.08B | 13.40B | 12.97B | 12.71B | 11.00B |
| Gross Profit | 6.08B | 5.87B | 5.59B | 5.50B | 5.32B |
| Operating Expense Selling General And Administrative | 1.83B | 1.63B | 1.58B | 1.49B | 1.56B |
| Operating Expense Other Operating Expenses | 129.00M | 123.00M | 121.00M | 116.00M | 110.00M |
| Operating Income | 4.09B | 4.08B | 3.85B | 3.86B | 3.75B |
| Non Operating Interest Income | 351.00M | 345.00M | 487.00M | 226.00M | 221.00M |
| Non Operating Interest Expense | 47.00M | 49.00M | 56.00M | 35.00M | 27.00M |
| Other Income Expense | 113.00M | 74.00M | 66.00M | 74.00M | 87.00M |
| Pretax Income | 4.51B | 4.45B | 4.35B | 4.12B | 4.04B |
| Income Tax | 1.19B | 1.28B | 1.18B | 1.14B | 1.07B |
| Net Income | 3.32B | 3.16B | 3.17B | 2.98B | 2.97B |
| Eps Basic | 0.81 | 0.76 | 0.77 | 0.71 | 0.70 |
| Eps Diluted | 0.80 | 0.76 | 0.76 | 0.71 | 0.70 |
| Basic Shares Outstanding | 4.11B | 4.16B | 4.14B | 48.22M | 48.55M |
| Diluted Shares Outstanding | 4.11B | 4.16B | 4.14B | 48.22M | 48.55M |
| Ebit | 4.55B | 4.50B | 4.40B | 4.16B | 4.06B |
| Ebitda | 5.01B | 5.01B | 4.92B | 4.65B | 4.47B |
| Net Income Continuous Operations | 3.32B | 3.16B | 3.17B | 2.98B | 2.97B |
| Minority Interests | -3.00M | -4.00M | -2.00M | -2.00M | -5.00M |
Data provided by Twelve Data
Balance Sheet
| fiscal_date | 2026-03-31 | 2025-03-31 | 2024-03-31 | 2023-03-31 | 2022-03-31 |
|---|---|---|---|---|---|
| Cash And Cash Equivalents | 2.34B | 2.86B | 1.77B | 1.48B | 2.31B |
| Accounts Receivable | 3.71B | 3.65B | 3.62B | 3.09B | 3.00B |
| Total Assets | 16.45B | 17.42B | 16.52B | 15.31B | 15.55B |
| Total Liabilities | 6.61B | 6.16B | 5.92B | 6.09B | 5.56B |
| Long Term Debt | 634.00M | 675.00M | 767.00M | 859.00M | 607.00M |
| Shareholders Equity | 9.84B | 11.26B | 10.61B | 9.22B | 9.99B |
Data provided by Twelve Data
Cash Flow Statement
| fiscal_date | 2026-03-31 | 2025-03-31 | 2024-03-31 | 2023-03-31 | 2022-03-31 |
|---|---|---|---|---|---|
| Operating Activities Net Income | 3.32B | 3.16B | 3.17B | 2.98B | 2.97B |
| Operating Activities Depreciation | 552.00M | 569.00M | 565.00M | 524.00M | 466.00M |
| Operating Activities Deferred Taxes | 1.19B | 1.28B | 1.18B | 1.14B | 1.07B |
| Operating Activities Stock Based Compensation | 108.00M | 95.00M | 79.00M | 64.00M | 56.00M |
| Operating Activities Other Non Cash Items | 14.00M | -30.00M | -140.00M | -39.00M | -73.00M |
| Operating Activities Accounts Receivable | -583.00M | -209.00M | -322.00M | -875.00M | -1.06B |
| Operating Activities Accounts Payable | -3.00M | 21.00M | 11.00M | -35.00M | 200.00M |
| Operating Activities Other Assets Liabilities | 587.00M | 275.00M | -161.00M | 510.00M | 931.00M |
| Operating Activities Operating Cash Flow | 5.18B | 5.17B | 4.38B | 4.27B | 4.55B |
| Investing Activities Net Acquisitions | -77.00M | -377.00M | 0.00 | -113.00M | 0.00 |
| Investing Activities Purchase Of Investments | -10.88B | -10.61B | -10.46B | -10.67B | -8.59B |
| Investing Activities Sale Of Investments | 11.19B | 10.83B | 9.92B | 10.79B | 7.79B |
| Investing Activities Other Investing Activity | -23.00M | -52.00M | -12.00M | -28.00M | -21.00M |
| Investing Activities Investing Cash Flow | 218.00M | -211.00M | -552.00M | -19.00M | -824.00M |
| Financing Activities Long Term Debt Payments | -318.00M | -396.00M | -245.00M | -151.00M | -125.00M |
| Financing Activities Common Stock Repurchase | -2.01B | 0.00 | 0.00 | -1.40B | -1.50B |
| Financing Activities Common Dividends | -2.13B | -2.42B | -1.78B | -1.70B | -1.70B |
| Financing Activities Other Financing Charges | -28.00M | -64.00M | -95.00M | -46.00M | 4.00M |
| Financing Activities Financing Cash Flow | -4.49B | -2.88B | -2.12B | -3.29B | -3.33B |
| End Cash Position | 2.34B | 2.86B | 1.77B | 1.48B | 2.31B |
| Free Cash Flow | 3.73B | 4.09B | 2.88B | 2.53B | 3.06B |
| Investing Activities Capital Expenditures | N/A | N/A | N/A | N/A | N/A |
Data provided by Twelve Data
Technical Analysis
Key Insights
- The current trend shows mixed momentum with the stock price trading below the 200-day moving average (INR 1,357) but above the 50-day moving average (INR 1,111), indicating short-term support amid longer-term resistance.
- Key support levels are identified near INR 982.40 (52-week low) and INR 1,100, while resistance is observed around INR 1,357 and INR 1,728 (52-week high).
- The stock is positioned between its 10-day, 50-day, and 200-day moving averages, reflecting consolidation and potential volatility in the near term.
- Momentum indicators show RSI near neutral levels, MACD suggesting mild bullish crossover, and stochastic oscillators indicating moderate upward momentum.
- Multi-timeframe analysis reveals daily charts with short-term upward moves, weekly charts showing sideways consolidation, and monthly charts indicating a longer-term downtrend from the 52-week high.
- Current technical setup suggests potential for range-bound trading with opportunities for upward movement if resistance levels are breached, balanced by risk of pullbacks near key resistance.
Trending News
Summary: Infosys Share Price: Find the latest news on Infosys Stock Price. Get all the information on Infosys with historic price charts for NSE / BSE. Experts & Broker view also get the Infosys Ltd. buy/sell tips detailed news, announcements, Forecasts, Analysts, Valuation, Earning forecasts, Estimates, ...
Sentiment: neutral
2. Headline: Infosys Share Price Highlights: Infosys Stock Price History - The Economic Times
Summary: Stay informed with the Infosys Stock Liveblog, your comprehensive resource for real-time updates and in-depth analysis of a leading stock. Get the latest details on Infosys, including: Last traded price 1155.1, Market capitalization: 468690.93, Volume: 22630218, Price-to-earnings ratio 15.47, ...
Sentiment: neutral
3. Headline: Stock Traders Purchase High Volume of Infosys Call Options (NYSE:INFY)
Summary: Infosys Ltd. (NYSE:INFY - Get Free Report) was the target of some unusual options trading activity on Wednesday. Stock investors bought 123,237 call options on the stock. This represents an increase of approximately 1,367% compared to the typical volume of 8,399 call options.
Sentiment: positive
4. Headline: Indian IT stocks rally: Why TCS, Infosys, Wipro are rising as global AI stocks plunge - The Times of India
Summary: Indian IT sector stocks after declining for the most part of this year have been rallying strongly over the last few sessions. They extended their rally on Wednesday, with shares of Infosys, TCS, HCLTech, Wipro, Coforge and Tech Mahindra climbing as much as 5%, even as semiconductor stocks ...
Sentiment: positive
5. Headline: Infosys Stock Climbs As AI Deals Offset Cautious Outlook
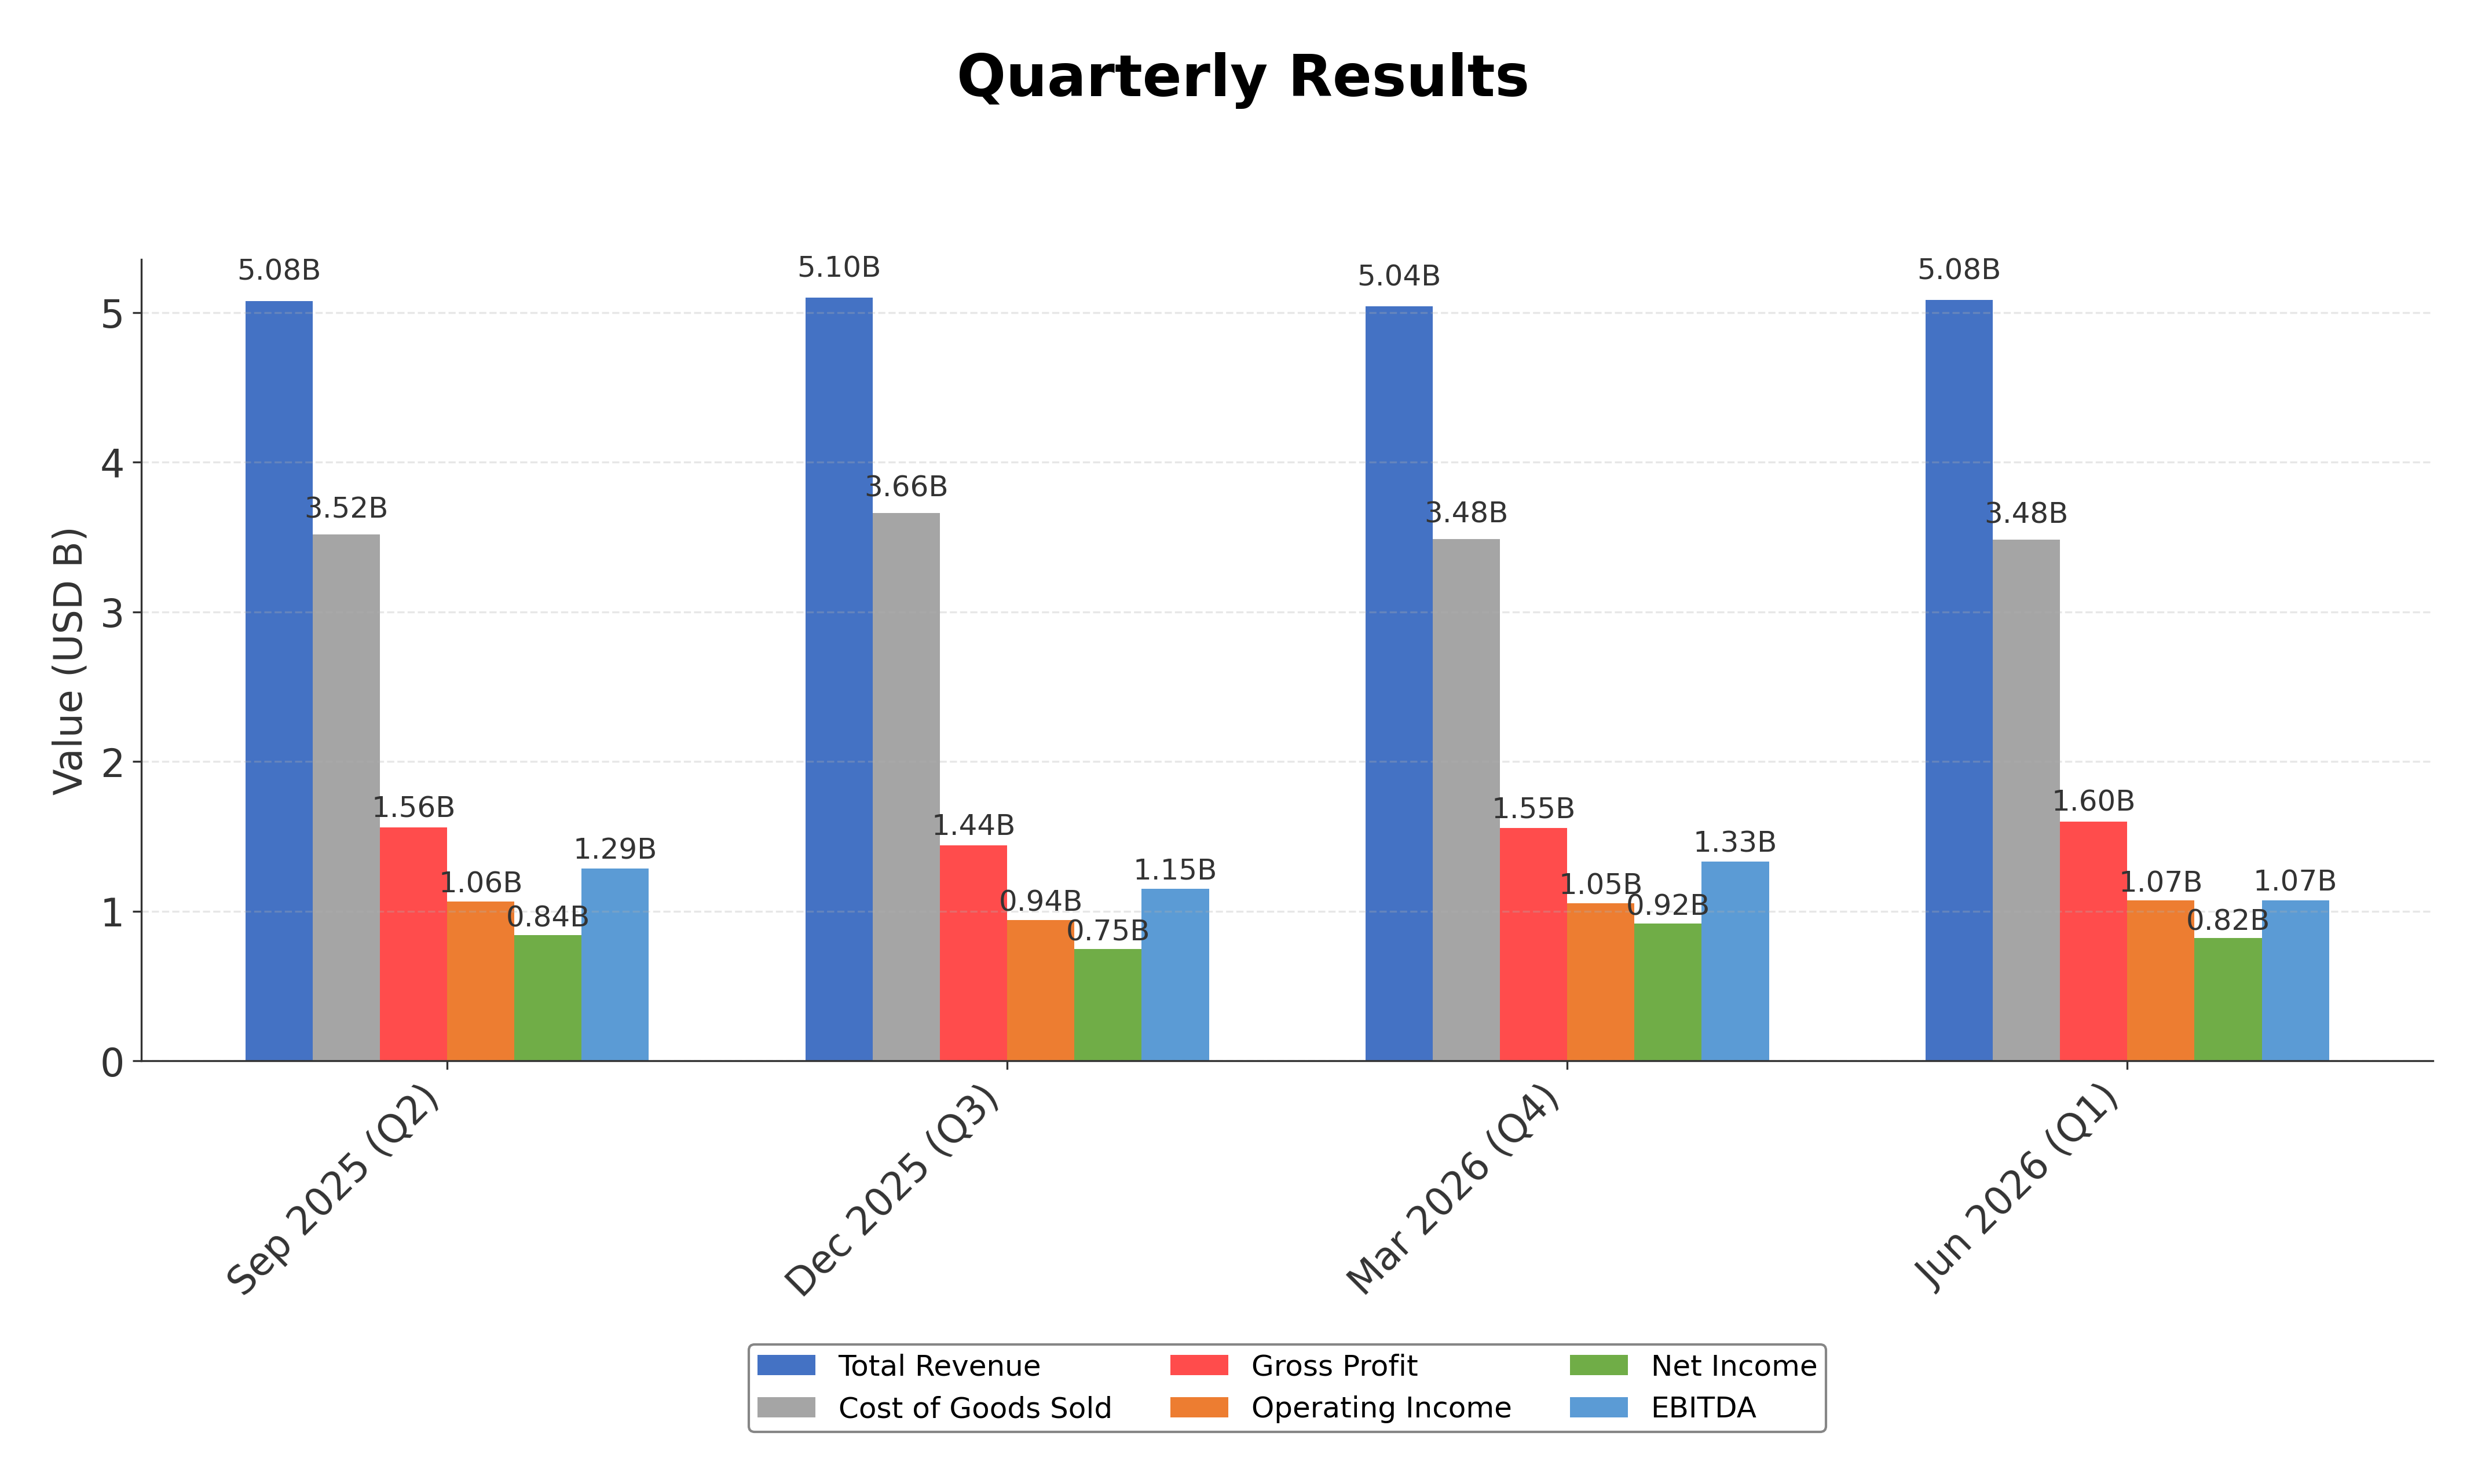
Summary: Infosys Limited stocks have been trading up by 5.38 percent after strong earnings guidance boosted investor confidence. Key Takeaways For INFY Traders Q1 FY27 revenue reached $5.08B, up 2.4% year over year, with a strong 21.1% operating margin that shows INFY still executes well despite slower
Sentiment: positive
Powered by Brave
Recent Updates
News Summary
As of 2026-07-28. Infosys Limited reported Q1 FY27 revenue of $5.08 billion, reflecting a 2.4% year-over-year increase and maintaining a strong operating margin of 21.1%. This solid earnings guidance has bolstered investor confidence despite a cautious broader market environment. The company’s growth is notably supported by significant AI-related deal wins, underscoring its strategic focus on emerging technologies. Additionally, Infosys disclosed stock incentives for key managerial personnel under existing stock option plans, adhering to regulatory requirements in India and the US. These developments highlight ongoing investment in talent and technology to sustain competitive positioning.
News Sentiment
The overall sentiment from recent updates is positive, driven primarily by strong quarterly revenue growth and operating margins, as well as strategic AI deal wins that enhance growth prospects. Institutional investor confidence is reflected in increased holdings by major funds such as Lazard Asset Management. Neutral sentiment arises from routine disclosures of stock incentives for key managers, which are standard governance practices. The combination of robust financial performance and strategic initiatives contributes to a generally optimistic outlook, tempered by cautious market conditions.
Source List
- https://timothysykes.com/news/infosys-limited-infy-news-2026_07_28/
- https://www.stocktitan.net/sec-filings/INFY/6-k-infosys-ltd-current-report-foreign-issuer-a6abb389ae73.html
- https://www.marketbeat.com/instant-alerts/filing-infosys-ltd-infy-stock-holdings-lifted-by-lazard-asset-management-llc-2026-07-27/
Analytical Overview
Analysis Summary
Infosys’ valuation metrics, including a trailing P/E of 13.42 and forward P/E of 13.01, are aligned with the industry average of 13.42, indicating fair valuation relative to peers. The company’s revenue growth of 2.9% quarterly and consistent positive cash flow trends demonstrate a stable growth trajectory supported by strong operating cash flow of INR 395.9 billion and free cash flow of INR 306.4 billion. Financial health appears solid with a low debt-to-equity ratio of 0.095 and a current ratio of 1.86, reflecting manageable leverage and liquidity. Sector-specific opportunities include expanding digital transformation and AI adoption, while challenges include regulatory compliance and competitive pressures in the global IT services market. Considering India-specific factors, Infosys benefits from a favorable regulatory environment and growing domestic and international demand for technology services.
Overall Business and Market Assessment
Supporting Factors: robust profitability with a 32% ROE, strong cash flow generation, and strategic positioning in AI and digital services
Risk Factors: valuation metrics such as the elevated EV/EBITDA ratio and potential macroeconomic headwinds affecting client budgets
SWOT Analysis
Strengths
- Strong market position in the global IT services sector.
- Robust profitability with a 32% return on equity.
- Consistent cash flow generation supporting operational stability.
- Diverse service offerings including AI and digital transformation.
Weaknesses
- High enterprise value to EBITDA ratio indicating potential valuation concerns.
- Moderate debt-to-equity ratio that requires monitoring.
- Stock price volatility with significant decline from 52-week high.
- Relatively lower operating margin compared to some peers.
Opportunities
- Growing demand for AI and cloud-based IT services.
- Expansion in emerging markets and digital platforms.
- Increasing institutional investor interest and share accumulation.
- Potential for strategic partnerships and acquisitions.
Threats
- Intense competition from global and domestic IT firms.
- Regulatory compliance risks in multiple jurisdictions.
- Macroeconomic uncertainties impacting client spending.
- Rapid technological changes requiring continuous innovation.
Company Description
Infosys Ltd. is an Indian multinational technology and consulting company that provides information technology services, business consulting, and outsourcing solutions to enterprises worldwide. Headquartered in Bengaluru, India and founded in 1981, Infosys focuses on enabling large organizations to manage and modernize their technology and operations. Its core activities include application development and maintenance, cloud transformation, data and analytics, artificial intelligence, engineering services, cybersecurity, and business process management. Infosys also offers specialized digital platforms and products, such as banking and financial services software, along with automation and AI-driven solutions that support complex, global operations. Serving clients across sectors like financial services, retail, manufacturing, communications, healthcare, and energy, the company plays a significant role in supporting digital transformation and operational efficiency for Global 2000-type businesses. With a broad international presence spanning numerous countries, Infosys operates as a key technology partner for enterprises seeking scalable, integrated IT and business process solutions.