
Infosys Ltd (INFY)
Stock Analysis Report
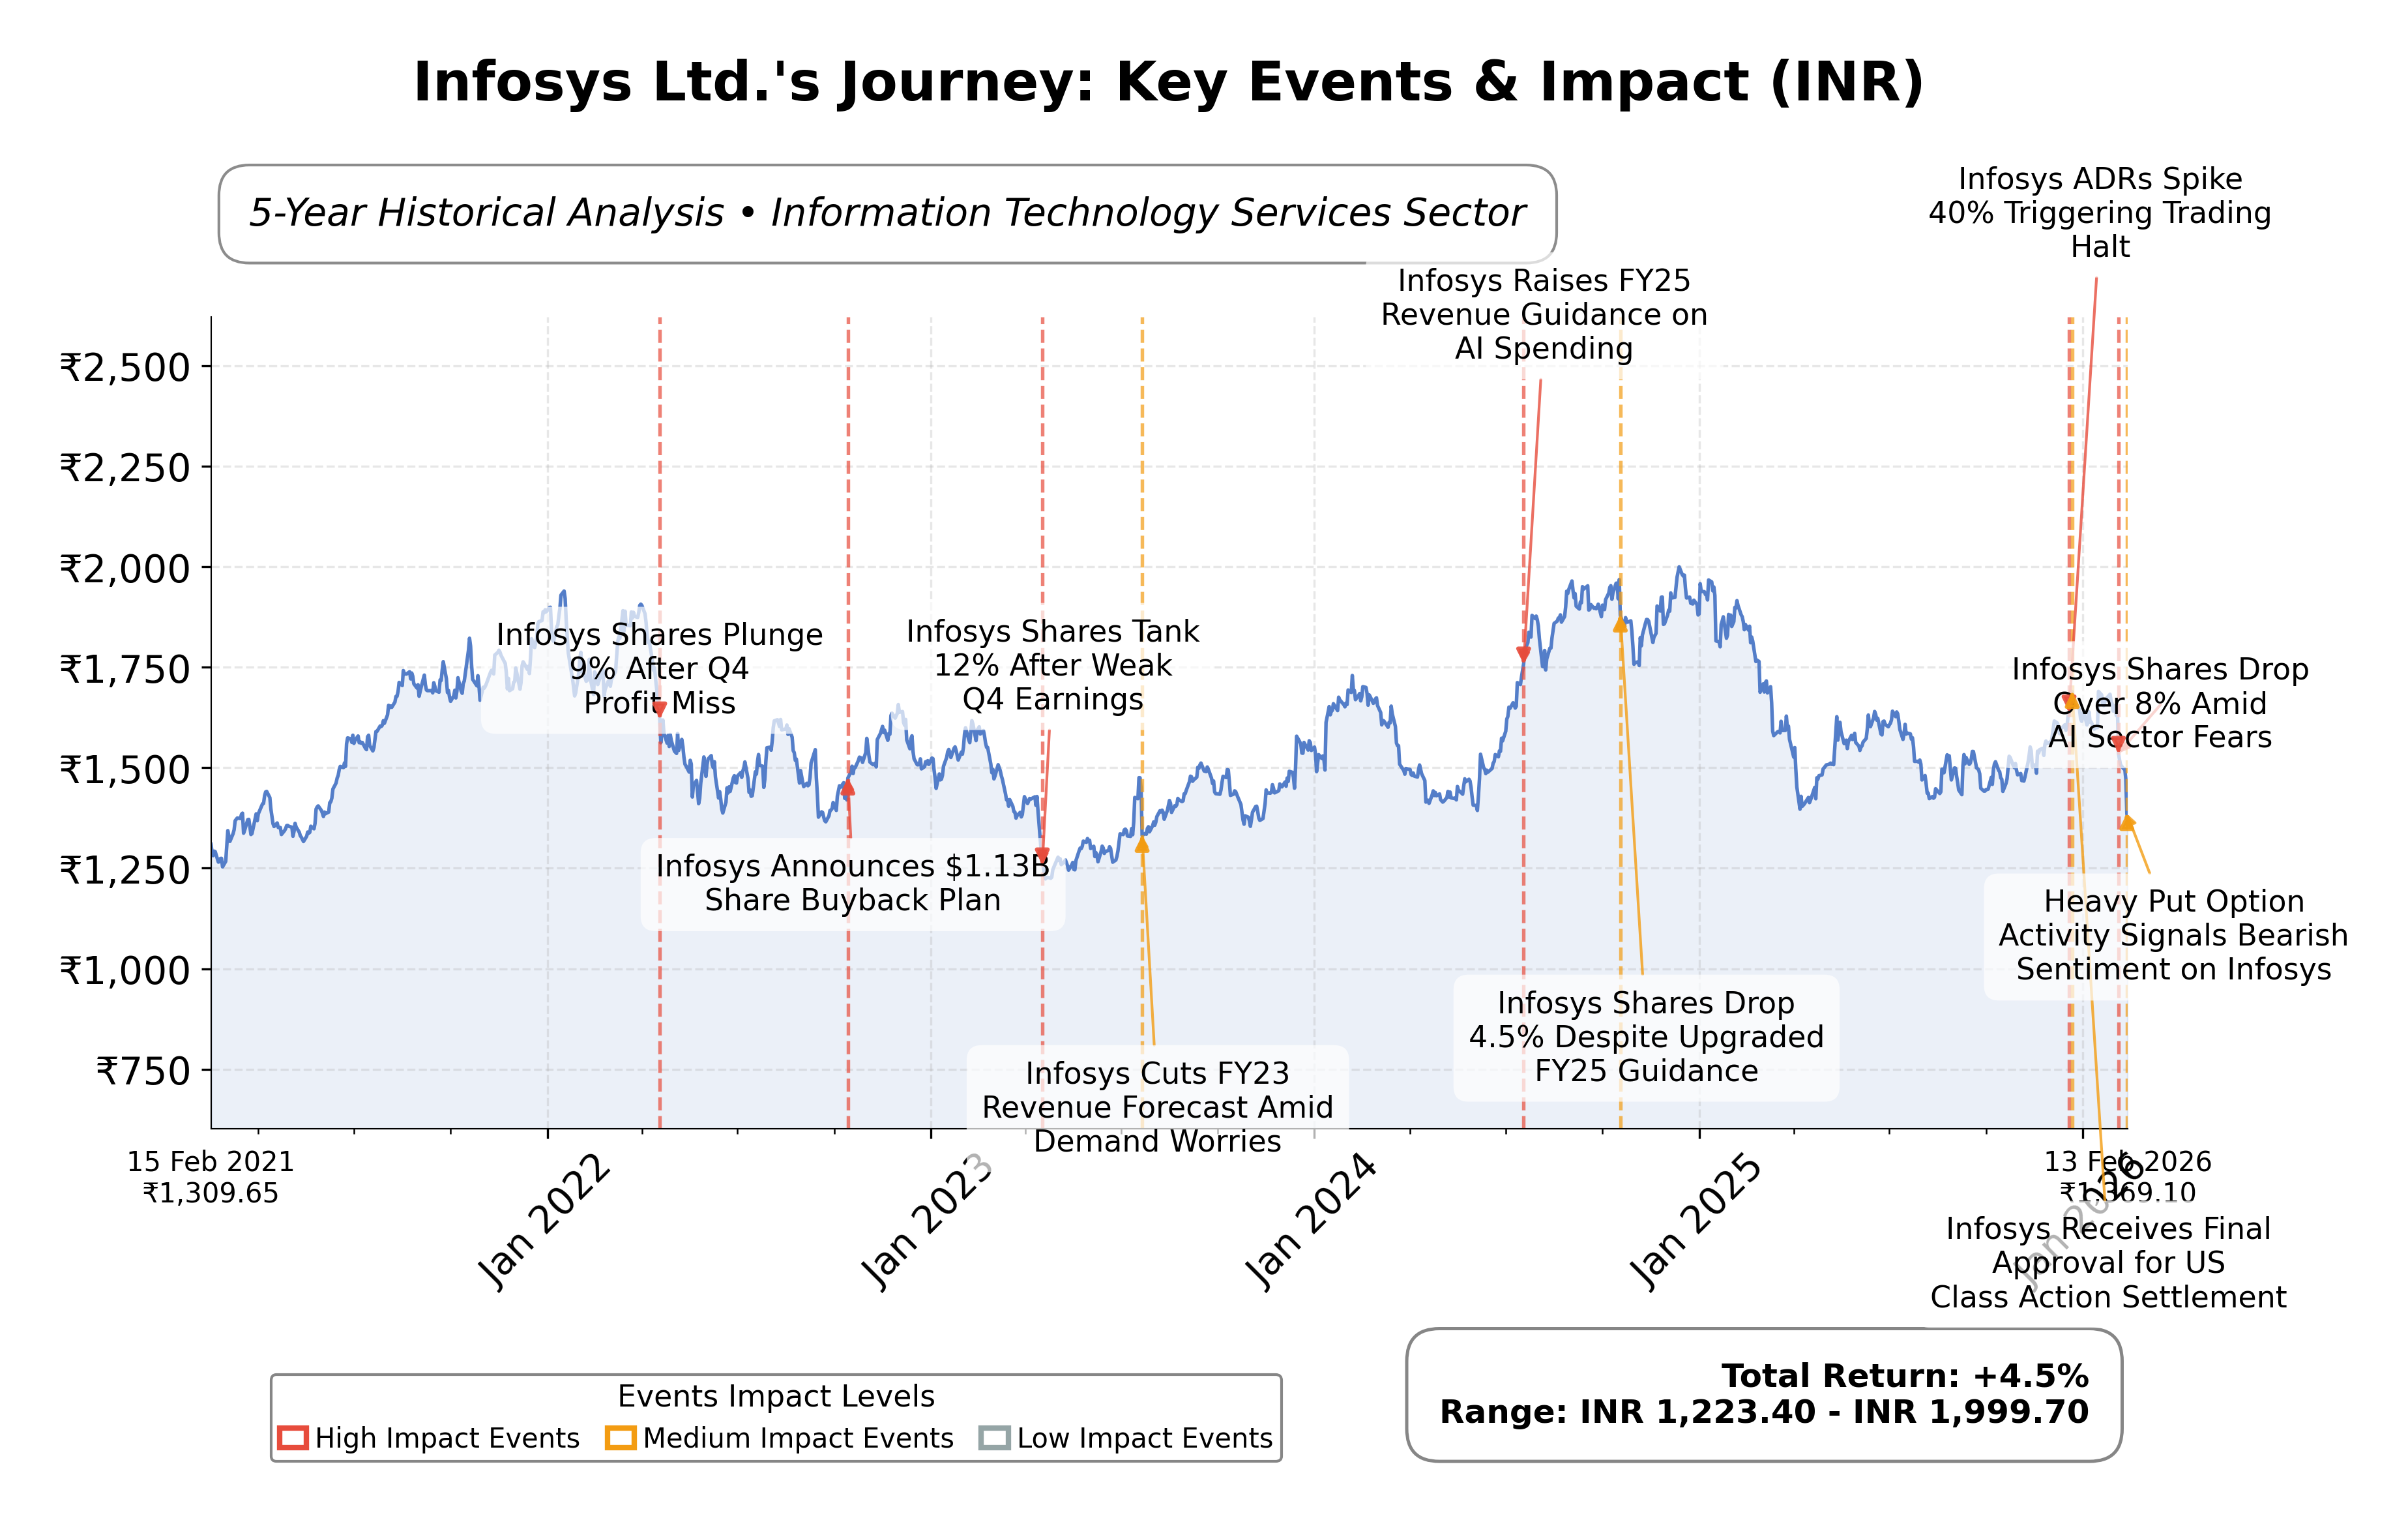
Stock Journey
Key Positives and Key Risks
Pros
- Market capitalization of ₹6.10 trillion positions Infosys as a major player in the Indian IT sector.
- Strong return on equity at 32.68% indicates efficient use of shareholder capital.
- Robust cash reserves of ₹270.37 billion and a low debt-to-equity ratio of 0.85 support financial stability.
Cons
- Stock price near 52-week low of ₹1307 reflects downside risk of 28.5% from current price ₹1369.1.
- Quarterly earnings growth declined by 7.1% year-over-year, indicating recent profitability pressures.
- High EV/EBITDA ratio of 1391.46 suggests premium valuation relative to earnings.
Disclosure: This information is for general awareness and does not constitute investment advice
Report Summary
Infosys Ltd. is a leading global technology services and consulting company headquartered in Bengaluru, India. Operating primarily in the Information Technology Services industry, Infosys offers a wide range of services including business consulting, digital transformation, software engineering, and outsourcing. The company is well-positioned in the market with a strong presence across over 50 countries and a reputation for leveraging emerging technologies such as AI, cloud computing, and big data analytics to serve diverse sectors like finance, healthcare, manufacturing, and retail.
Financially, Infosys reported a trailing P/E ratio of 21.64 and a forward P/E of 19.76, with a market capitalization of approximately â¹6.10 trillion. The company maintains a profit margin of 16.15% and an operating margin of 18.38%, supported by a gross margin of 28.22%. Return on equity stands at 32.68%, indicating efficient use of shareholder capital. The stock is currently priced at â¹1369.1, trading closer to its 52-week low of â¹1307 compared to the high of â¹1905, reflecting a downside risk of 28.5%. Dividend yield is around 3.05%, with semi-annual payouts.
From a strategic perspective, Infosys faces recent headwinds from global technology selloffs and AI-related market fears, impacting its stock performance and valuation multiples. The companyâs leadership continues to focus on digital transformation initiatives and strategic collaborations, such as the alliance with ExxonMobil targeting AI energy efficiency. Institutional ownership is significant at approximately 49.7%, with insiders holding around 16%, suggesting stable governance. Risks include market volatility and competitive pressures in the IT services sector, while strengths lie in its diversified client base and innovation capabilities.
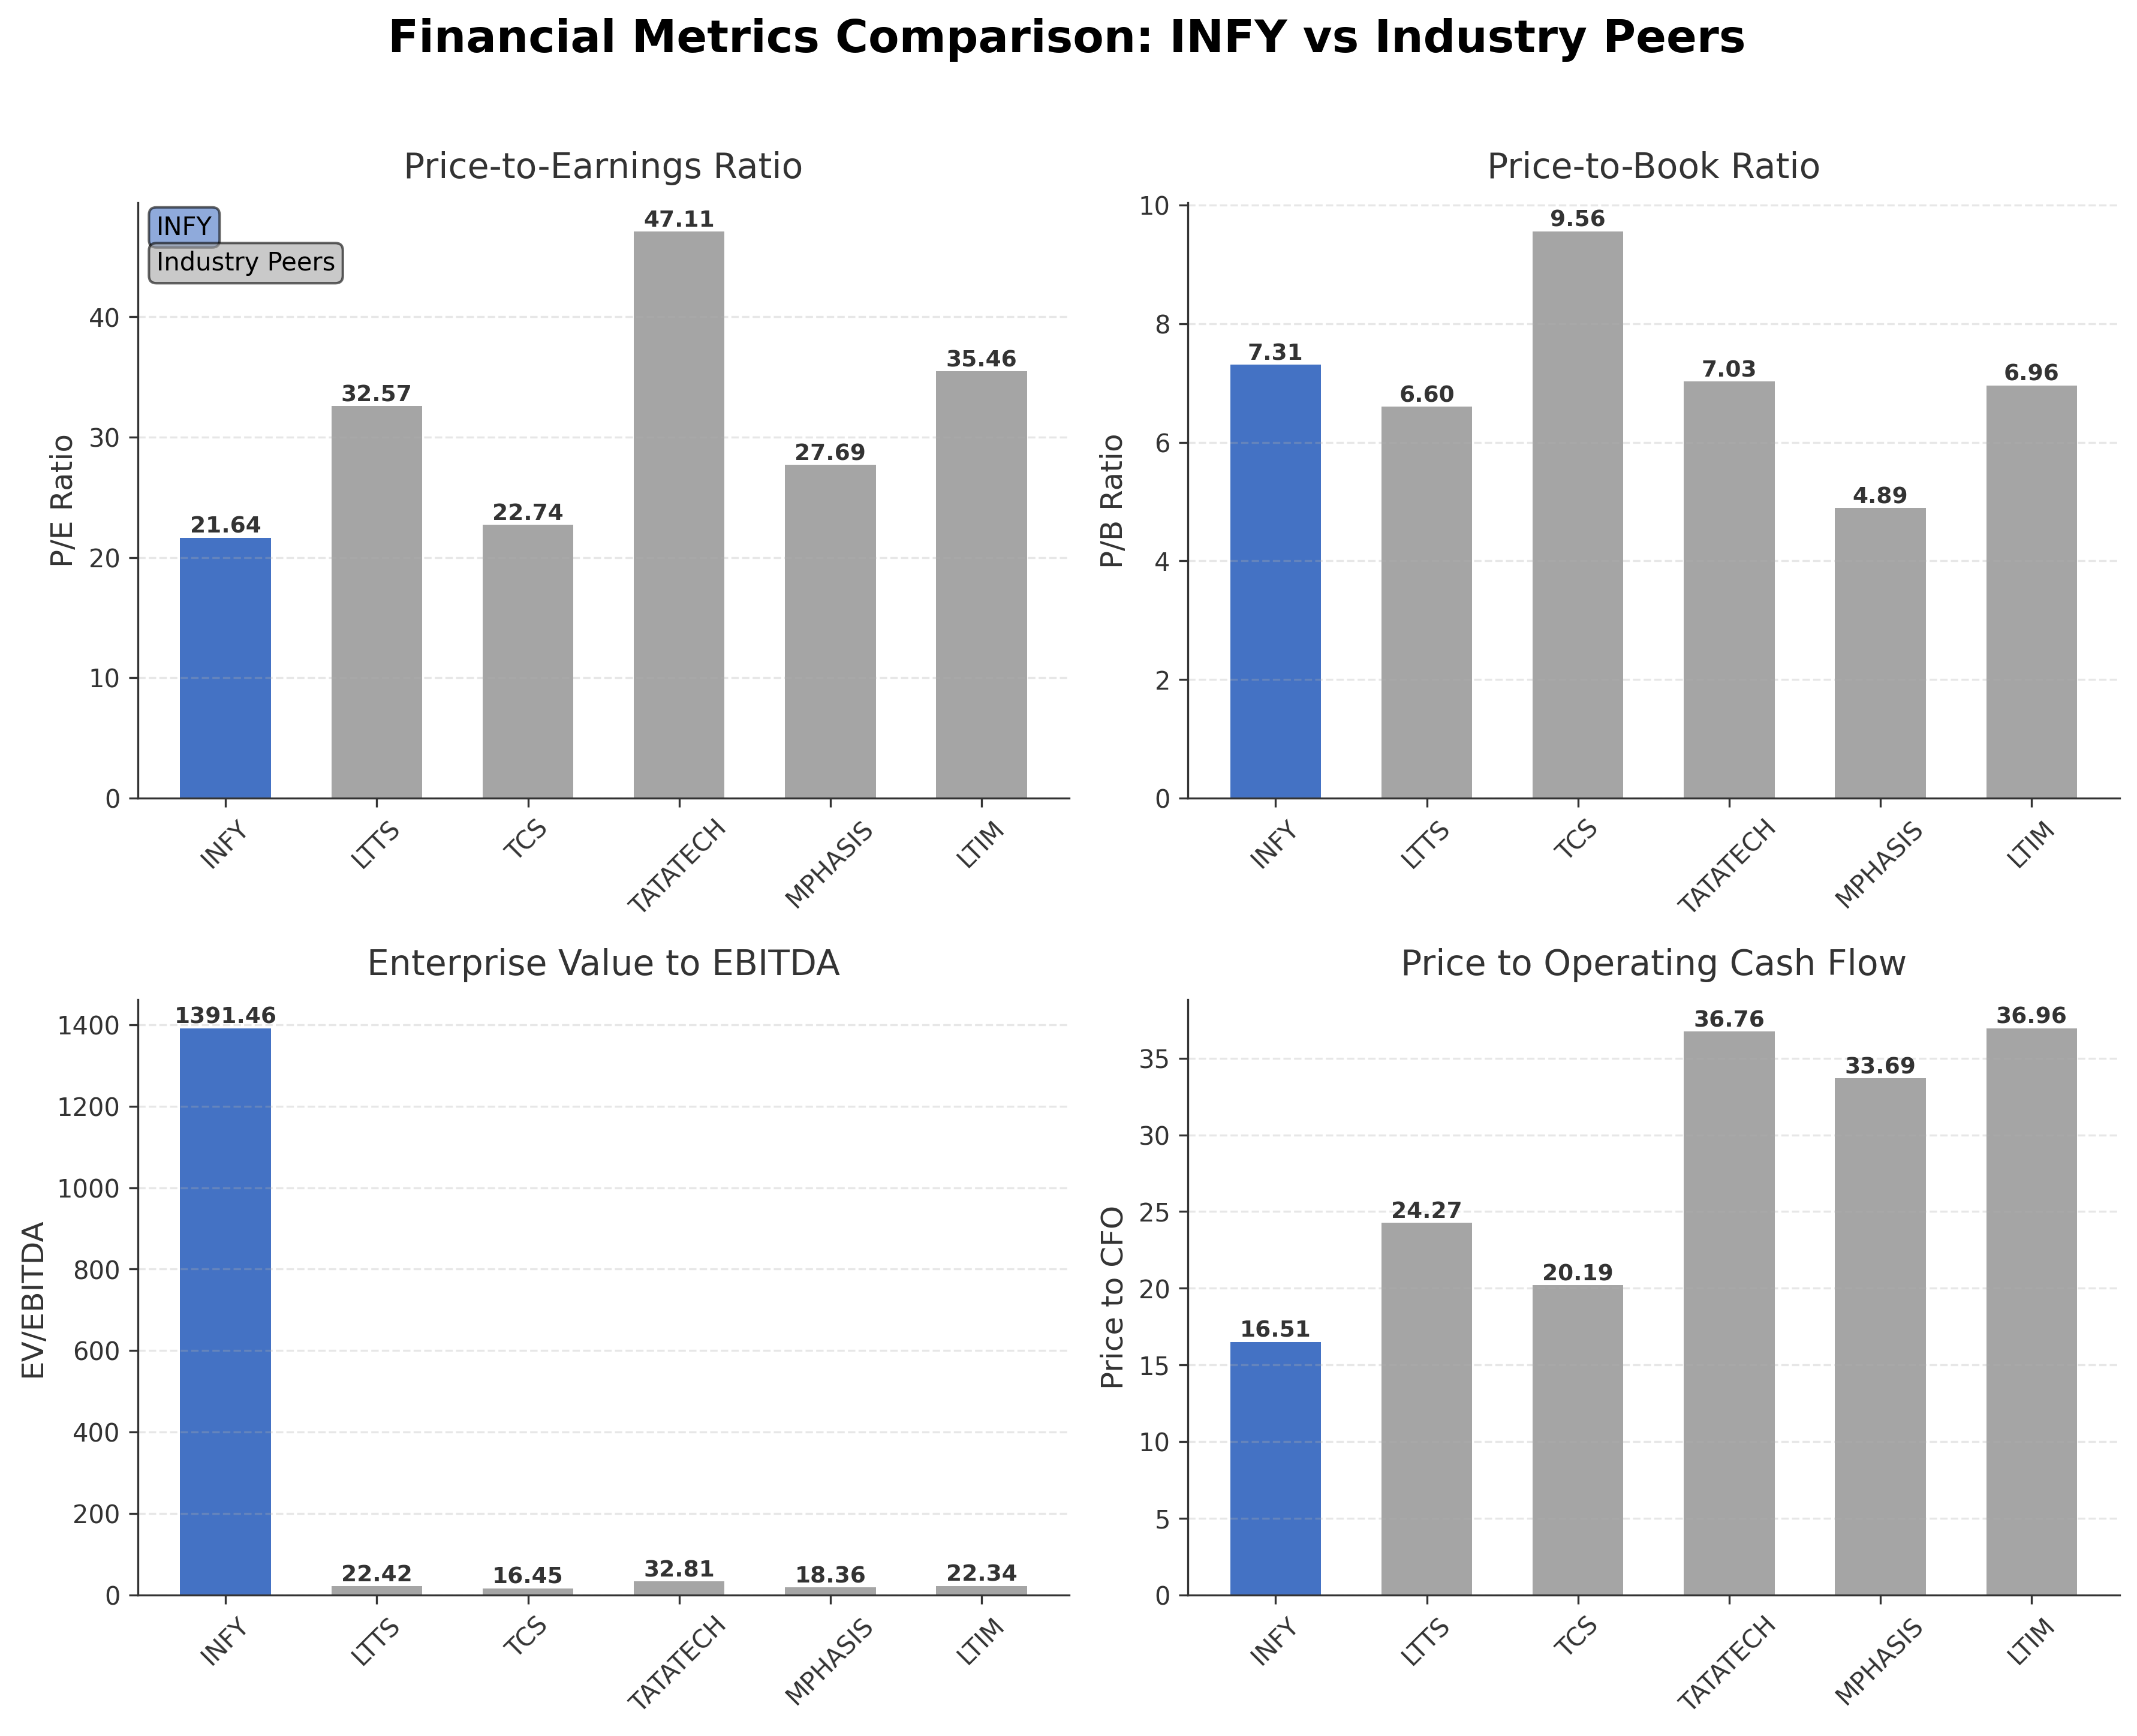
In comparison to its Indian IT peers like Tata Consultancy Services (TCS), L&T Technology Services, Mphasis, Tata Technologies, and LTIMindtree, Infosys holds a strong market capitalization but exhibits a higher EV/EBITDA multiple, indicating premium valuation. Its P/E ratio is moderate relative to peers, with TCS showing a slightly higher P/E and LTTS and LTIMindtree displaying elevated multiples. Infosysâs price-to-cash flow ratio is lower than many peers, reflecting relatively better cash flow generation efficiency.
Infosys navigates a complex industry landscape marked by rapid technological change and global economic uncertainty. Recent declines in stock price and market sentiment highlight challenges from AI disruption fears and global selloffs. However, the companyâs ongoing strategic partnerships and solid financial base position it to capitalize on digital transformation trends. The stakes involve balancing innovation investment with market expectations amid competitive pressures. Given the current data, a measured approach reflecting close observation of market developments and company performance may be appropriate for those assessing the stockâs trajectory.
Company and Industry Overview
Company Basics
Price Performance
Company Size
Shareholding Pattern
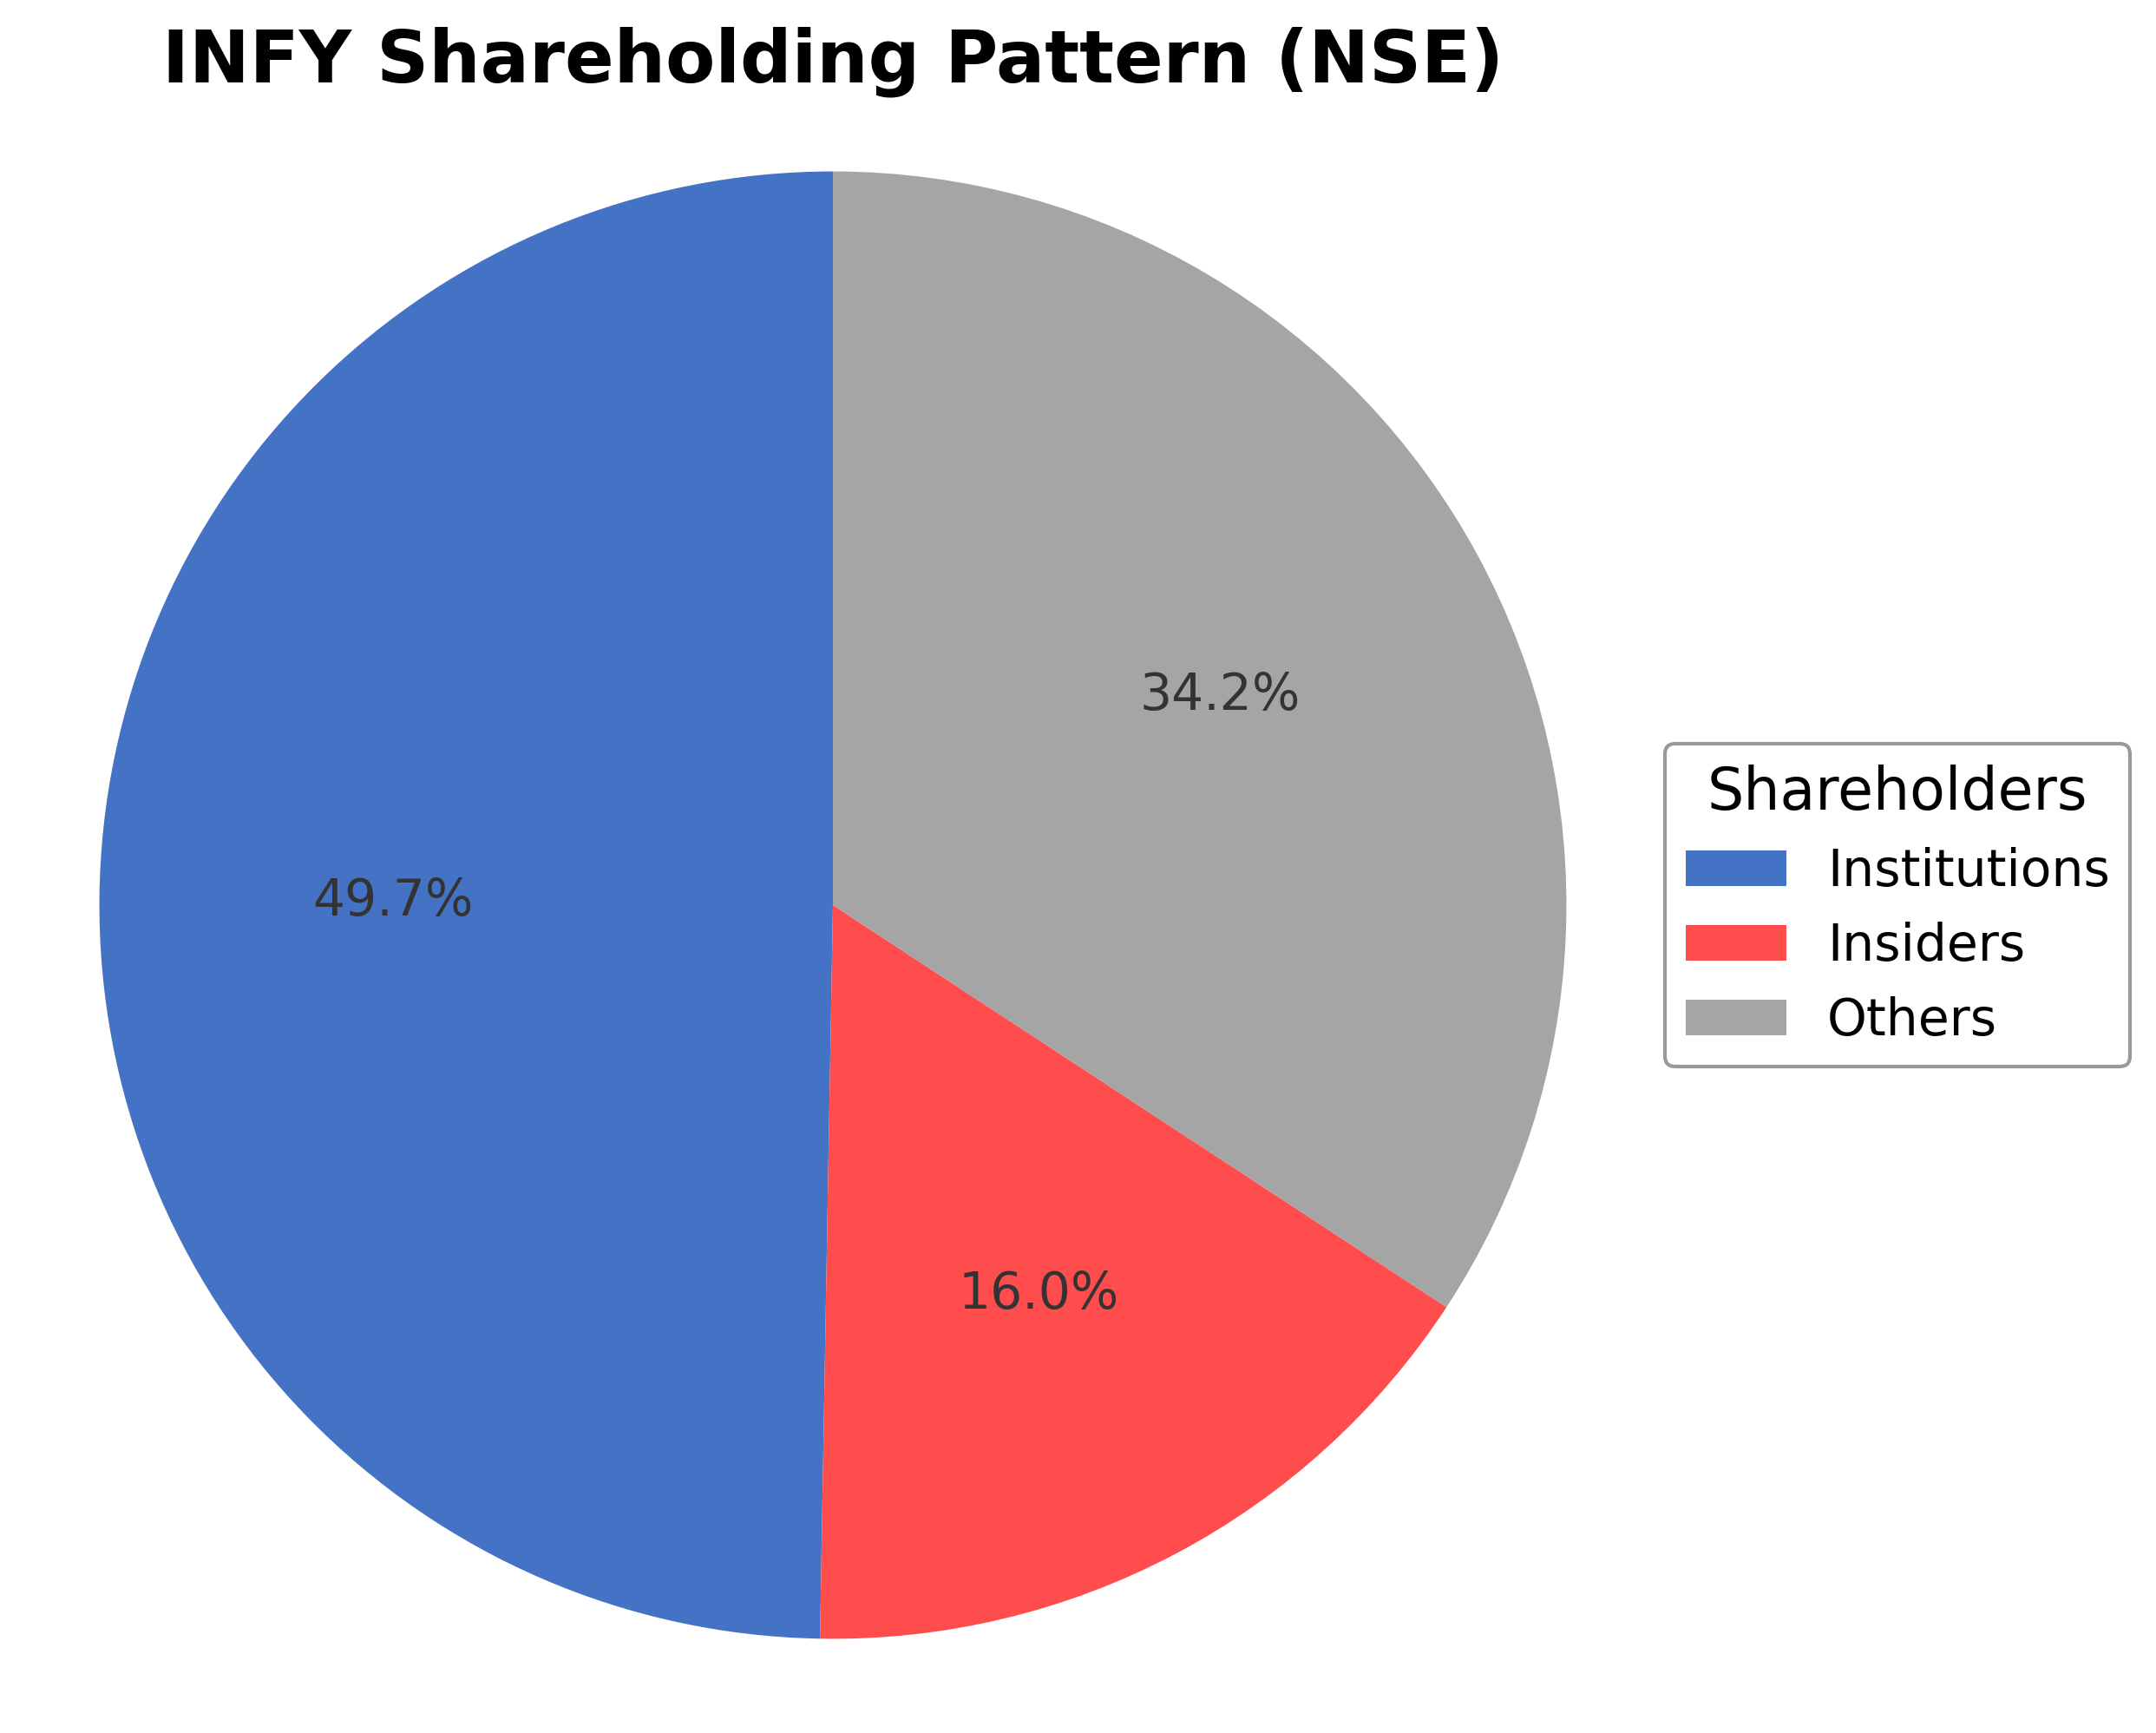
Infosys Ltd. exhibits a shareholding structure with insiders, including executives and board members, holding approximately 16.05% of shares, institutional investors such as mutual funds and asset managers owning around 49.72%, and the remaining 34.23% held by public shareholders including retail investors and employee stock plans. Over the past 12 to 24 months, institutional ownership has remained relatively stable with no significant shifts reported, indicating consistent confidence from major funds. This ownership distribution suggests a balanced governance framework with substantial institutional oversight, potentially influencing strategic decisions and corporate actions. The company's position within the Indian IT services industry is reinforced by its extensive global footprint and diversified client base, aligning with sector trends focused on digital transformation and technology innovation.
Sector and Industry Analysis
Sector and Industry Analysis: Information Technology Services – Focus on Infosys Ltd.
1. Sector Overview: The Information Technology (IT) services sector, particularly the IT consulting and digital services segment, represents a critical component of the global technology ecosystem. As of 2025, the global IT services market is estimated to exceed $1.5 trillion, driven by digital transformation initiatives across industries. India-based IT service providers, led by firms such as Infosys Ltd., Tata Consultancy Services (TCS), and Wipro, command a significant share of this market, benefiting from cost arbitrage, a large skilled workforce, and strong client relationships in North America, Europe, and emerging markets. Infosys, with a market capitalization among the largest in the sector, operates primarily in two segments: digital services and core IT services, positioning itself as a key player in delivering end-to-end technology solutions.
2. Industry Trends: The IT services industry is undergoing rapid evolution fueled by technological shifts such as cloud computing, artificial intelligence (AI), machine learning, automation, and cybersecurity. Enterprises increasingly demand integrated digital transformation services, including cloud migration, data analytics, and enterprise software modernization. Consumer behavior trends emphasize agility, scalability, and innovation, pushing providers to adopt agile delivery models and invest in intellectual property and platforms. Emerging opportunities include expansion into Industry 4.0, Internet of Things (IoT), and blockchain services. Additionally, geographic diversification and nearshoring are gaining traction as clients seek to mitigate geopolitical risks and supply chain disruptions.
3. Regulatory Landscape: The IT services sector operates within a complex regulatory environment encompassing data privacy, cybersecurity, cross-border data flow, labor laws, and intellectual property protection. Key regulations impacting the sector include the European Union’s General Data Protection Regulation (GDPR), India’s Information Technology Act and evolving data protection bills, and compliance mandates from client jurisdictions such as the US and UK. Outsourcing contracts are subject to stringent service-level agreements and audit requirements. Additionally, visa and immigration policies in client countries affect onsite delivery models. Compliance with anti-bribery, anti-corruption laws, and environmental, social, and governance (ESG) standards is increasingly emphasized by institutional investors and clients alike.
4. Competitive Dynamics: The IT services industry is characterized by a highly competitive and fragmented market structure with a mix of large multinational corporations and niche specialized firms. Barriers to entry include the need for substantial human capital investment, domain expertise, established client relationships, and technological capabilities. Infosys competes on the basis of scale, service breadth, innovation, and cost efficiency. The company’s ownership structure, dominated by institutional investors with limited promoter control, reflects a governance model aligned with global best practices. Competitive positioning hinges on continuous upskilling, strategic acquisitions, and expanding digital capabilities to maintain differentiation. Price competition remains intense, but value-added services and intellectual property development offer avenues for margin expansion. Overall, the sector’s growth is underpinned by sustained demand for digital transformation, though macroeconomic uncertainties and inflationary pressures pose near-term challenges.
Note: Analysis synthesized from industry research, market reports, and regulatory filings. Information is subject to change based on market conditions.
Illustrative Scenario Analysis
DCF Assumptions:
Method: Two-Stage EPS-Priority Model
Financials
Peer Analysis
| Company Name | Market Cap | P/E Ratio | P/B Ratio | EV/EBITDA | Price to CFO |
|---|---|---|---|---|---|
| Infosys Ltd. | ₹6.10T | 21.64 | 7.31 | 1391.46 | 16.51 |
| L&T Technology Services Ltd. | ₹408.70B | 32.57 | 6.6 | 22.42 | 24.27 |
| Tata Consultancy Services Ltd. | ₹10.64T | 22.74 | 9.56 | 16.45 | 20.19 |
| Tata Technologies Ltd. | ₹250.66B | 47.11 | 7.03 | 32.81 | 36.76 |
| Mphasis Ltd. | ₹497.50B | 27.69 | 4.89 | 18.36 | 33.69 |
| LTIMindtree Limited | ₹1.65T | 35.46 | 6.96 | 22.34 | 36.96 |
Comparison Analysis: Infosys Ltd. holds a strong market capitalization within the Indian IT services sector, ranking below Tata Consultancy Services but above other peers like LTIMindtree and Mphasis. Its P/E ratio of 21.64 is moderate compared to peers, with Tata Technologies and LTIMindtree exhibiting notably higher valuations. The company’s price-to-book ratio is relatively higher than most peers except TCS, reflecting premium valuation. Infosys’s EV/EBITDA multiple is significantly elevated, suggesting a higher enterprise valuation relative to earnings before interest, taxes, depreciation, and amortization compared to peers. Price to cash flow ratio is comparatively lower, indicating efficient cash flow generation relative to its stock price. Overall, Infosys presents a balanced profile with competitive valuation metrics and strong market presence among regional industry players.
Financial Metrics Comparison with Peers
Financial Statements
Comprehensive financial data including income, balance sheet, and cash flow metrics
Income Statement
| fiscal_date | 2025-03-31 | 2024-03-31 | 2023-03-31 | 2022-03-31 | 2021-03-31 |
|---|---|---|---|---|---|
| Sales | 1744.88B | 18.56B | 18.21B | 16.31B | 13.56B |
| Cost Of Goods | 1213.37B | 12.97B | 12.71B | 11.00B | 8.83B |
| Gross Profit | 531.51B | 5.59B | 5.50B | 5.32B | 4.73B |
| Operating Expense Selling General And Administrative | 147.63B | 1.58B | 1.49B | 1.56B | 1.41B |
| Operating Expense Other Operating Expenses | 11.13B | 121.00M | 116.00M | 110.00M | 125.00M |
| Operating Income | 369.03B | 3.85B | 3.86B | 3.75B | 3.33B |
| Non Operating Interest Income | 31.23B | 487.00M | 226.00M | 221.00M | 216.00M |
| Non Operating Interest Expense | 4.44B | 56.00M | 35.00M | 27.00M | 26.00M |
| Other Income Expense | 6.70B | 66.00M | 74.00M | 87.00M | 81.00M |
| Pretax Income | 402.53B | 4.35B | 4.12B | 4.04B | 3.60B |
| Income Tax | 116.31B | 1.18B | 1.14B | 1.07B | 973.00M |
| Net Income | 286.21B | 3.17B | 2.98B | 2.97B | 2.62B |
| Eps Basic | 0.76 | 0.77 | 0.71 | 0.70 | 0.62 |
| Eps Diluted | 0.76 | 0.76 | 0.71 | 0.70 | 0.61 |
| Basic Shares Outstanding | 376.12B | 4.14B | 48.22M | 48.55M | 48.93M |
| Diluted Shares Outstanding | 376.12B | 4.14B | 48.22M | 48.55M | 48.93M |
| Ebit | 406.96B | 4.40B | 4.16B | 4.06B | 3.62B |
| Ebitda | 453.12B | 4.92B | 4.65B | 4.47B | 4.01B |
| Net Income Continuous Operations | 286.21B | 3.17B | 2.98B | 2.97B | 2.62B |
| Minority Interests | -4.00M | -2.00M | -2.00M | -5.00M | -10.00M |
Data provided by Twelve Data
Balance Sheet
| fiscal_date | 2025-12-31 | 2025-09-30 | 2025-06-30 | 2025-03-31 | 2024-12-31 |
|---|---|---|---|---|---|
| Cash And Cash Equivalents | 200.72B | 320.55B | 290.02B | 259.14B | 235.88B |
| Accounts Receivable | 364.12B | 346.54B | 342.38B | 330.15B | 351.70B |
| Total Assets | 1444.96B | 1636.17B | 1580.28B | 1577.75B | 1470.62B |
| Total Liabilities | 603.78B | 577.60B | 573.08B | 558.31B | 535.76B |
| Long Term Debt | 58.51B | 61.05B | 62.77B | 61.14B | 60.21B |
| Shareholders Equity | 841.18B | 1058.56B | 1007.21B | 1019.43B | 934.85B |
Data provided by Twelve Data
Cash Flow Statement
| fiscal_date | 2025-03-31 | 2024-03-31 | 2023-03-31 | 2022-03-31 | 2021-03-31 |
|---|---|---|---|---|---|
| Operating Activities Net Income | 286.21B | 3.17B | 2.98B | 2.97B | 2.62B |
| Operating Activities Depreciation | 51.50B | 565.00M | 524.00M | 466.00M | 441.00M |
| Operating Activities Deferred Taxes | 116.31B | 1.18B | 1.14B | 1.07B | 973.00M |
| Operating Activities Stock Based Compensation | 8.60B | 79.00M | 64.00M | 56.00M | 45.00M |
| Operating Activities Other Non Cash Items | -2.72B | -140.00M | -39.00M | -73.00M | -64.00M |
| Operating Activities Accounts Receivable | -18.92B | -322.00M | -875.00M | -1.06B | -248.00M |
| Operating Activities Accounts Payable | 1.90B | 11.00M | -35.00M | 200.00M | -33.00M |
| Operating Activities Other Assets Liabilities | 24.89B | -161.00M | 510.00M | 931.00M | 457.00M |
| Operating Activities Operating Cash Flow | 467.79B | 4.38B | 4.27B | 4.55B | 4.19B |
| Investing Activities Net Acquisitions | -34.12B | 0.00 | -113.00M | 0.00 | -165.00M |
| Investing Activities Purchase Of Investments | -960.20B | -10.46B | -10.67B | -8.59B | -6.31B |
| Investing Activities Sale Of Investments | 979.93B | 9.92B | 10.79B | 7.79B | 5.61B |
| Investing Activities Other Investing Activity | -4.71B | -12.00M | -28.00M | -21.00M | -48.00M |
| Investing Activities Investing Cash Flow | -19.10B | -552.00M | -19.00M | -824.00M | -1.20B |
| Financing Activities Long Term Debt Payments | -35.84B | -245.00M | -151.00M | -125.00M | -94.00M |
| Financing Activities Common Stock Repurchase | 0.00 | 0.00 | -1.40B | -1.50B | 0.00 |
| Financing Activities Common Dividends | -218.69B | -1.78B | -1.70B | -1.70B | -1.23B |
| Financing Activities Other Financing Charges | -5.79B | -95.00M | -46.00M | 4.00M | 1.00M |
| Financing Activities Financing Cash Flow | -260.32B | -2.12B | -3.29B | -3.33B | -1.32B |
| End Cash Position | 258.97B | 1.77B | 1.48B | 2.31B | 3.38B |
| Free Cash Flow | 370.03B | 2.88B | 2.53B | 3.06B | 2.97B |
| Investing Activities Capital Expenditures | N/A | N/A | N/A | N/A | -285.00M |
Data provided by Twelve Data
Technical Analysis
Key Insights
- The current trend direction shows a downward movement with the stock price declining towards its 52-week low, indicating bearish price action.
- Key support levels are near ₹1307 (52-week low), while resistance is observed around ₹1624 (50-day moving average) and ₹1905 (52-week high).
- The stock is trading below the 50-day moving average (₹1624.52) but above the 200-day moving average (₹1552.53), suggesting mixed medium-term momentum.
- Momentum indicators show RSI levels indicating oversold conditions, MACD trending downward, and stochastic oscillators reflecting bearish momentum.
- Multi-timeframe analysis reveals consistent weakness in daily and weekly charts, with monthly charts showing longer-term consolidation.
- Potential market scenarios include continued consolidation near support levels or further downside pressure if key support breaks, while recovery would require reclaiming moving averages.
Trending News
1. Headline: Infosys drops 6.11% as global tech selloff, AI fears hit IT stocks
Summary: Infosys Ltd (NSE: INFY) declined 6.11% to ₹1,301.10 at 10:22 am IST on 13 February, down ₹84.70 from its previous close of ₹1,386.00, reflecting market concerns amid a global technology selloff and fears related to AI disruption impacting IT stocks.
Sentiment: Negative
2. Headline: Infosys enters bear territory! NRN family takes hit as IT major exits top 10 most valuable list
Summary: Following a sharp selloff, Infosys Ltd shares exited the list of the 10 most valuable companies on Dalal Street and entered bear territory amid AI disruption fears affecting global markets, impacting the NRN family and broader investor sentiment.
Sentiment: Negative
3. Headline: Infosys, TCS, Wipro — IT Stocks Extend Decline To Third Day, Following Global Selloff
Summary: Top Indian IT stocks including Infosys Ltd., Tata Consultancy Services Ltd., and Wipro Ltd. extended their decline for a third consecutive day, influenced by a global selloff in technology shares and concerns over AI's impact on the sector.
Sentiment: Negative
4. Headline: IT stocks led by TCS, Infosys slump 5.25% as AI threat triggers global software rout
Summary: India's top IT stocks, led by Tata Consultancy Services Ltd. and Infosys Ltd., experienced a 5.25% slump as fears over AI disruption triggered a global rout in software shares, affecting market confidence and sector valuations.
Sentiment: Negative
5. Headline: Infosys–ExxonMobil Alliance Targets Energy-Hungry AI With Next-Gen Cooling
Summary: Infosys Ltd. announced an expansion of its strategic collaboration with ExxonMobil Corp. to develop next-generation cooling technologies aimed at addressing the energy demands of AI computing, highlighting the company's focus on innovation and sustainability.
Sentiment: Positive
Powered by Brave
Recent Updates
News Summary
Recent news coverage of Infosys Ltd. has been dominated by a significant decline in stock price driven by global technology selloffs and concerns regarding AI disruption impacting IT sector valuations. The company has experienced a drop below key market capitalization rankings and entered bear territory, reflecting broader market volatility. Despite these challenges, Infosys continues to pursue strategic initiatives such as its expanded alliance with ExxonMobil focused on innovative cooling solutions for AI workloads, underscoring its commitment to technological advancement and sustainability. The mixed news flow highlights a market environment balancing near-term headwinds with longer-term growth opportunities in digital transformation.
News Sentiment
The overall sentiment from recent news is predominantly negative, reflecting concerns about market volatility and AI-related risks. However, isolated positive developments, such as strategic partnerships, provide some counterbalance. Sentiment trends indicate cautious market perception with potential for recovery contingent on broader technology sector stabilization and successful execution of innovation strategies.
Analytical Overview
Analysis Summary
Infosys’s valuation metrics show a trailing P/E of 21.64 and forward P/E of 19.76, closely aligned with the industry average P/E of 21.64, suggesting valuation in line with sector norms. The PEG ratio is negative, reflecting recent earnings growth challenges.
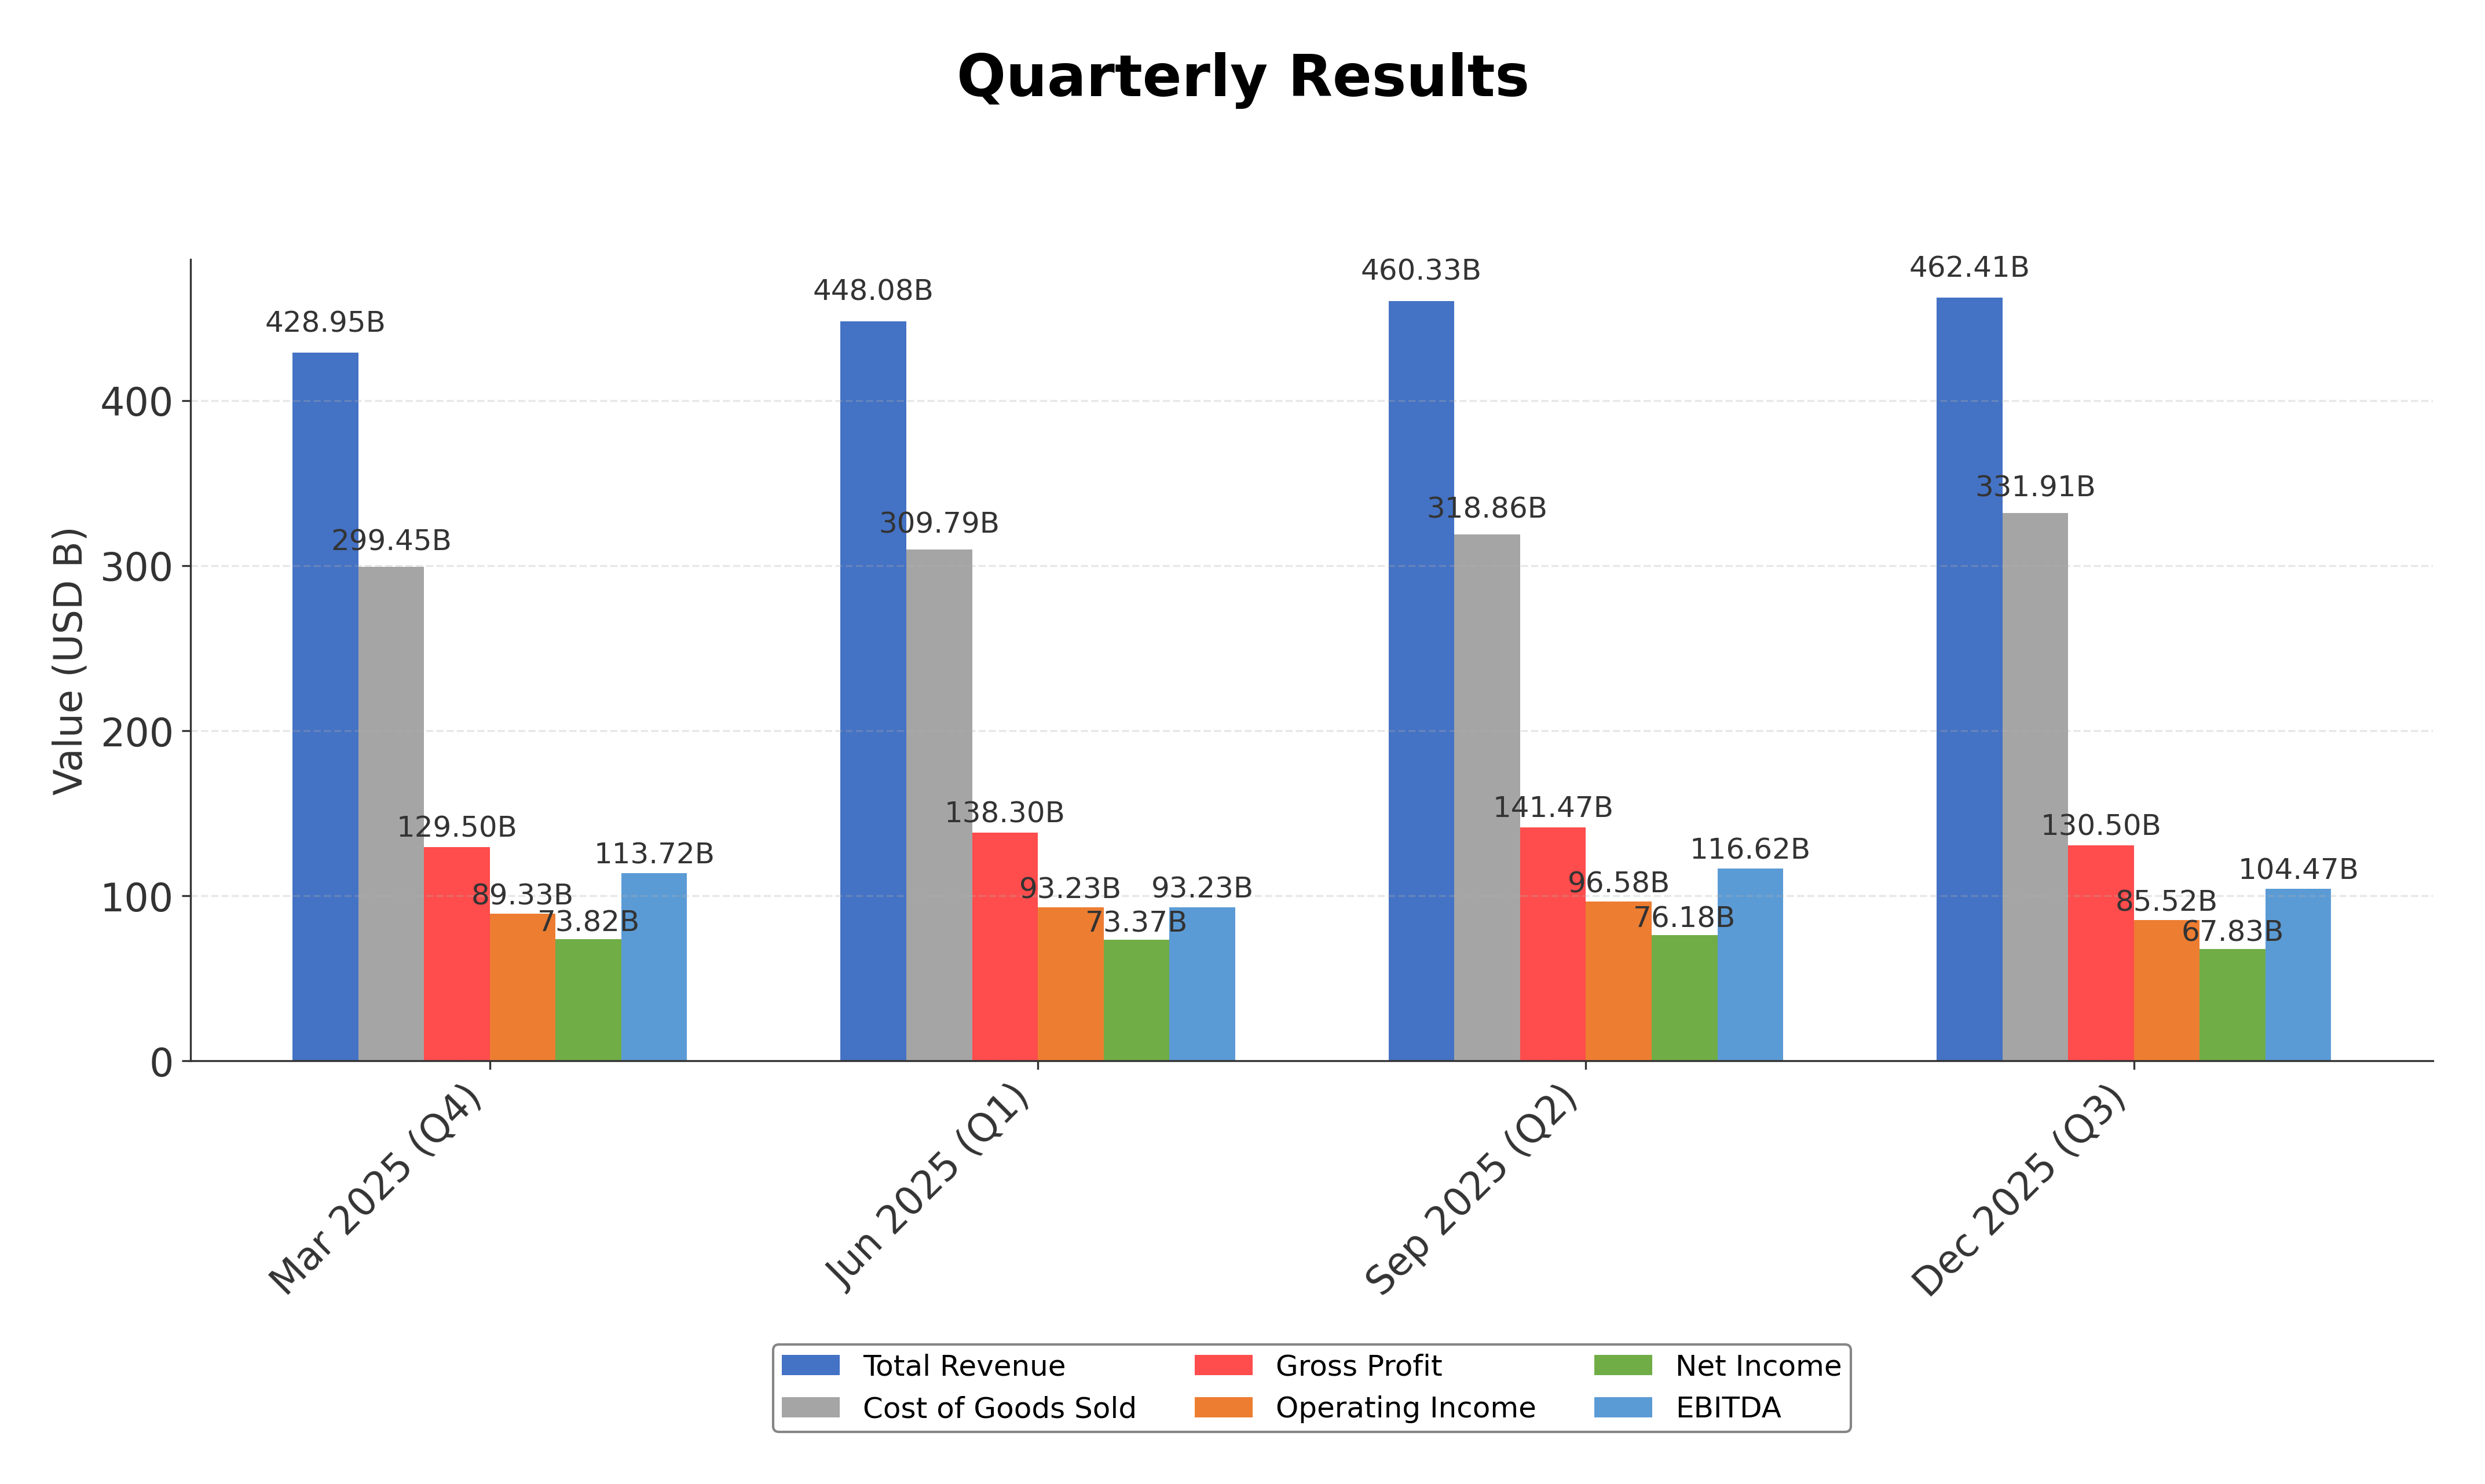
Revenue growth is modest at 3.2% quarterly, with operating cash flow of ₹369.37 billion indicating solid cash generation. However, quarterly earnings growth shows a slight year-over-year decline of 7.1%, suggesting some pressure on profitability.
Financial health appears robust with a debt-to-equity ratio of 0.85 and a current ratio of 1.81, indicating manageable leverage and liquidity. The company holds substantial cash reserves of ₹270.37 billion, supporting operational flexibility.
Sector-specific challenges include global technology selloffs and AI disruption fears impacting market sentiment, while opportunities lie in digital transformation and strategic partnerships such as the ExxonMobil alliance.
Considering India-specific factors, Infosys benefits from a favorable regulatory environment supporting IT exports and digital initiatives, alongside growing domestic demand for technology services.
Investment Conclusion
Supporting Factors: Primary supporting factors include stable valuation metrics relative to peers, strong cash flow generation, and a solid balance sheet with low leverage.
Risk Factors: Main risk factors involve market volatility driven by AI-related fears and modest recent earnings growth decline.
SWOT Analysis
Strengths
- Strong global presence with operations in over 50 countries.
- Robust financial health with low debt-to-equity ratio and strong cash reserves.
- Diverse service offerings including AI, cloud computing, and digital transformation.
- High return on equity indicating efficient capital utilization.
Weaknesses
- Recent decline in quarterly earnings growth year-over-year.
- High price-to-book and EV/EBITDA ratios relative to some peers.
- Stock price near 52-week low reflecting market volatility.
- Negative PEG ratio indicating challenges in earnings growth sustainability.
Opportunities
- Expansion of strategic partnerships such as with ExxonMobil for AI-related solutions.
- Growing demand for digital transformation services globally and in India.
- Potential to leverage emerging technologies to enhance client offerings.
- Favorable regulatory environment supporting IT exports and innovation.
Threats
- Global technology selloff impacting stock performance and valuations.
- Market fears related to AI disruption affecting investor sentiment.
- Intense competition within the Indian and global IT services sector.
- Economic uncertainties and geopolitical risks influencing client spending.
Company Description
Infosys Ltd. is a global leader in technology services and consulting. Founded in 1981 and headquartered in Bengaluru, India, the company provides a broad spectrum of information technology services, including business consulting, digital transformation, software engineering, and outsourcing services. Infosys is renowned for its expertise in harnessing emerging technologies like artificial intelligence, cloud computing, and big data analytics, enabling businesses across diverse sectors, including finance, healthcare, manufacturing, and retail, to adopt innovative solutions for growth and efficiency. As a pioneer in IT service globalization, Infosys plays a critical role in advancing digital transformation agendas worldwide and contributes significantly to India's IT export industry. With a presence in over 50 countries and a reputation for sustainable business practices, Infosys Ltd. commands trust from its extensive client base, which includes some of the most influential companies around the globe. This reflects its position as not only a technological innovator but also a major player in shaping the future of the global IT landscape.