


Indianivesh Ltd (INDIANVSH)
Stock Analysis Report
Stock Journey
Key Positives and Key Risks
Pros
- Trailing P/E ratio of 20.72 aligns with industry average, indicating valuation in line with sector norms.
- Return on equity (ROE) of 18.18% suggests efficient use of shareholder capital despite net losses.
- Positive EBITDA of ₹20.18 million reflects some operational cash generation capability.
Cons
- Negative net income of ₹-90.05 million and negative gross margin highlight ongoing profitability issues.
- Extremely low current ratio of 0.037 indicates significant liquidity constraints and potential solvency risks.
- Negative price-to-book ratio of -0.54 suggests market valuation below book value, reflecting financial distress.
Disclosure: This information is for general awareness and does not constitute investment advice
Report Summary
Indianivesh Ltd. is a diversified financial services company listed on the Bombay Stock Exchange (BSE) under the Financial Services sector, specializing in capital markets. The company offers a broad range of financial solutions including equity broking, wealth management, investment banking, insurance distribution, and financial product distribution. It operates primarily in India, serving both individual and institutional investors, and is recognized for its comprehensive market research and advisory services. Indianivesh holds a notable position within the Indian financial services industry, leveraging its multi-segment presence to facilitate investment opportunities.
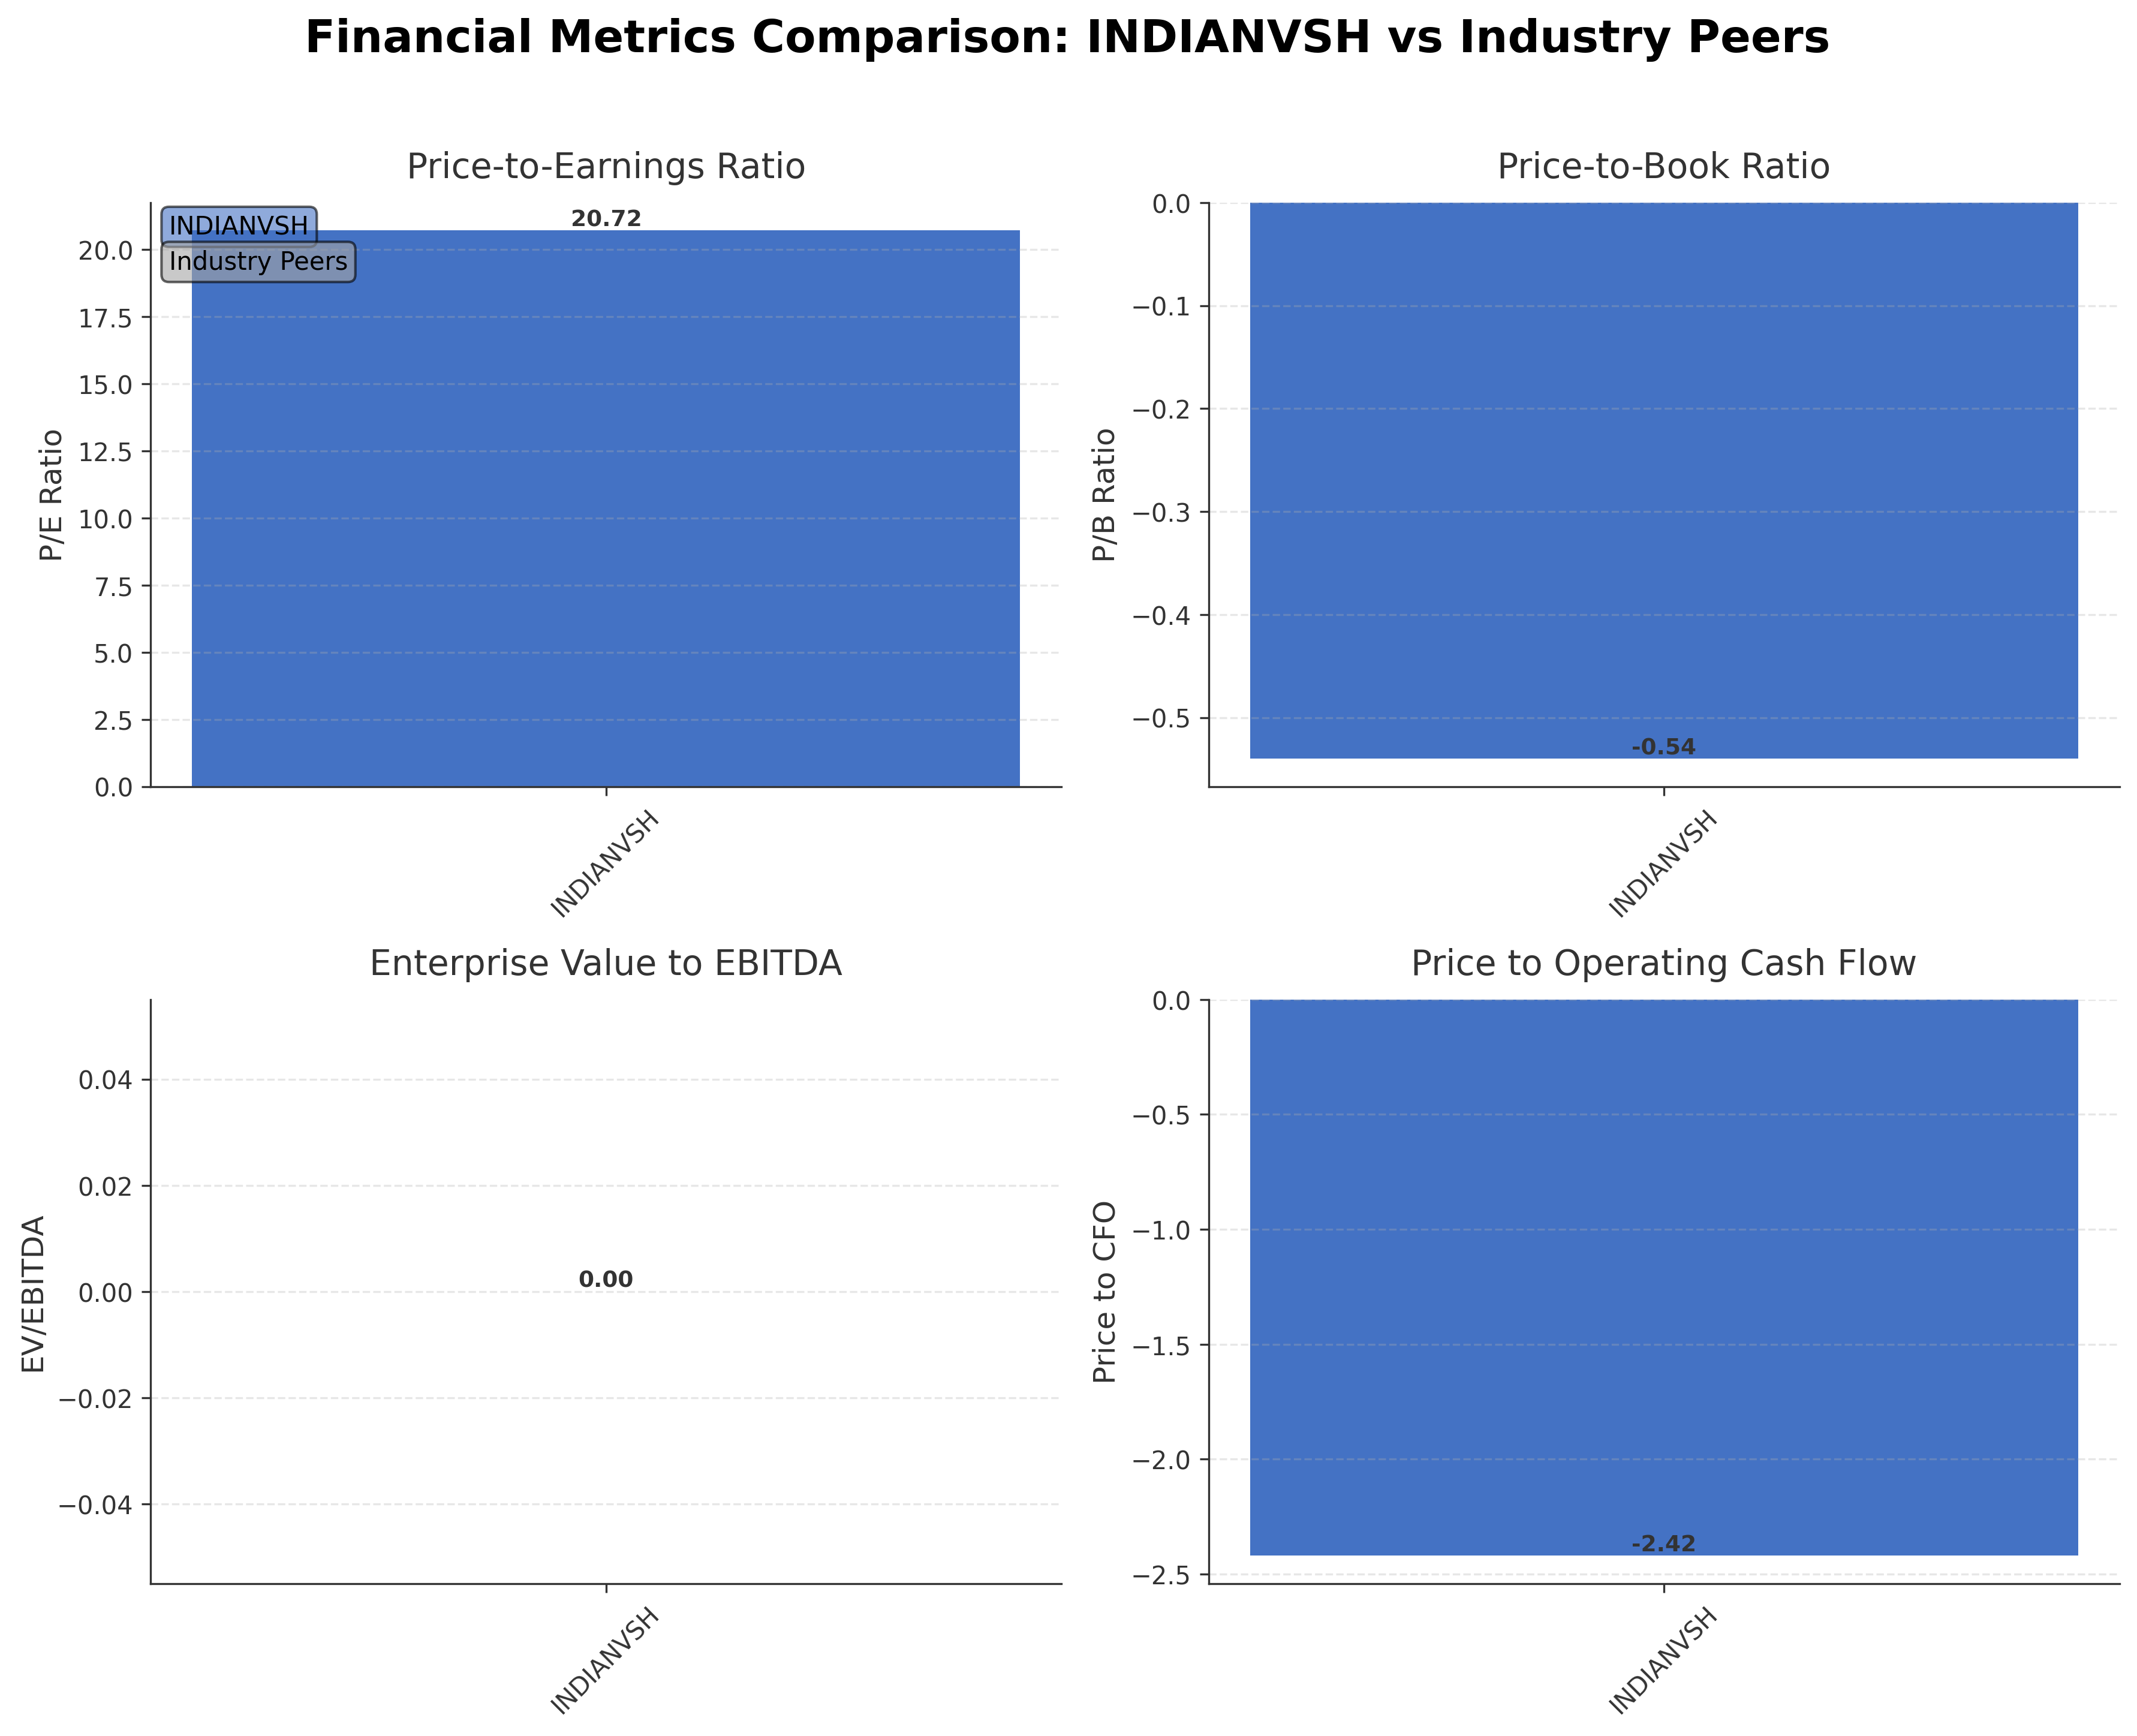
Financially, Indianivesh reported a trailing twelve months (TTM) revenue of negative ₹46.88 million with a gross margin of -1.88% and a net profit margin of -5.41%, indicating operational challenges and losses. The operating margin is marginally positive at 0.96%, while return on equity (ROE) stands at 18.18%, suggesting some efficiency in equity utilization despite net losses. Return on assets (ROA) is negative at -9.65%, reflecting asset inefficiency. The company’s EBITDA is positive at ₹20.18 million, but net income is negative at ₹-90.05 million, highlighting profitability pressures.
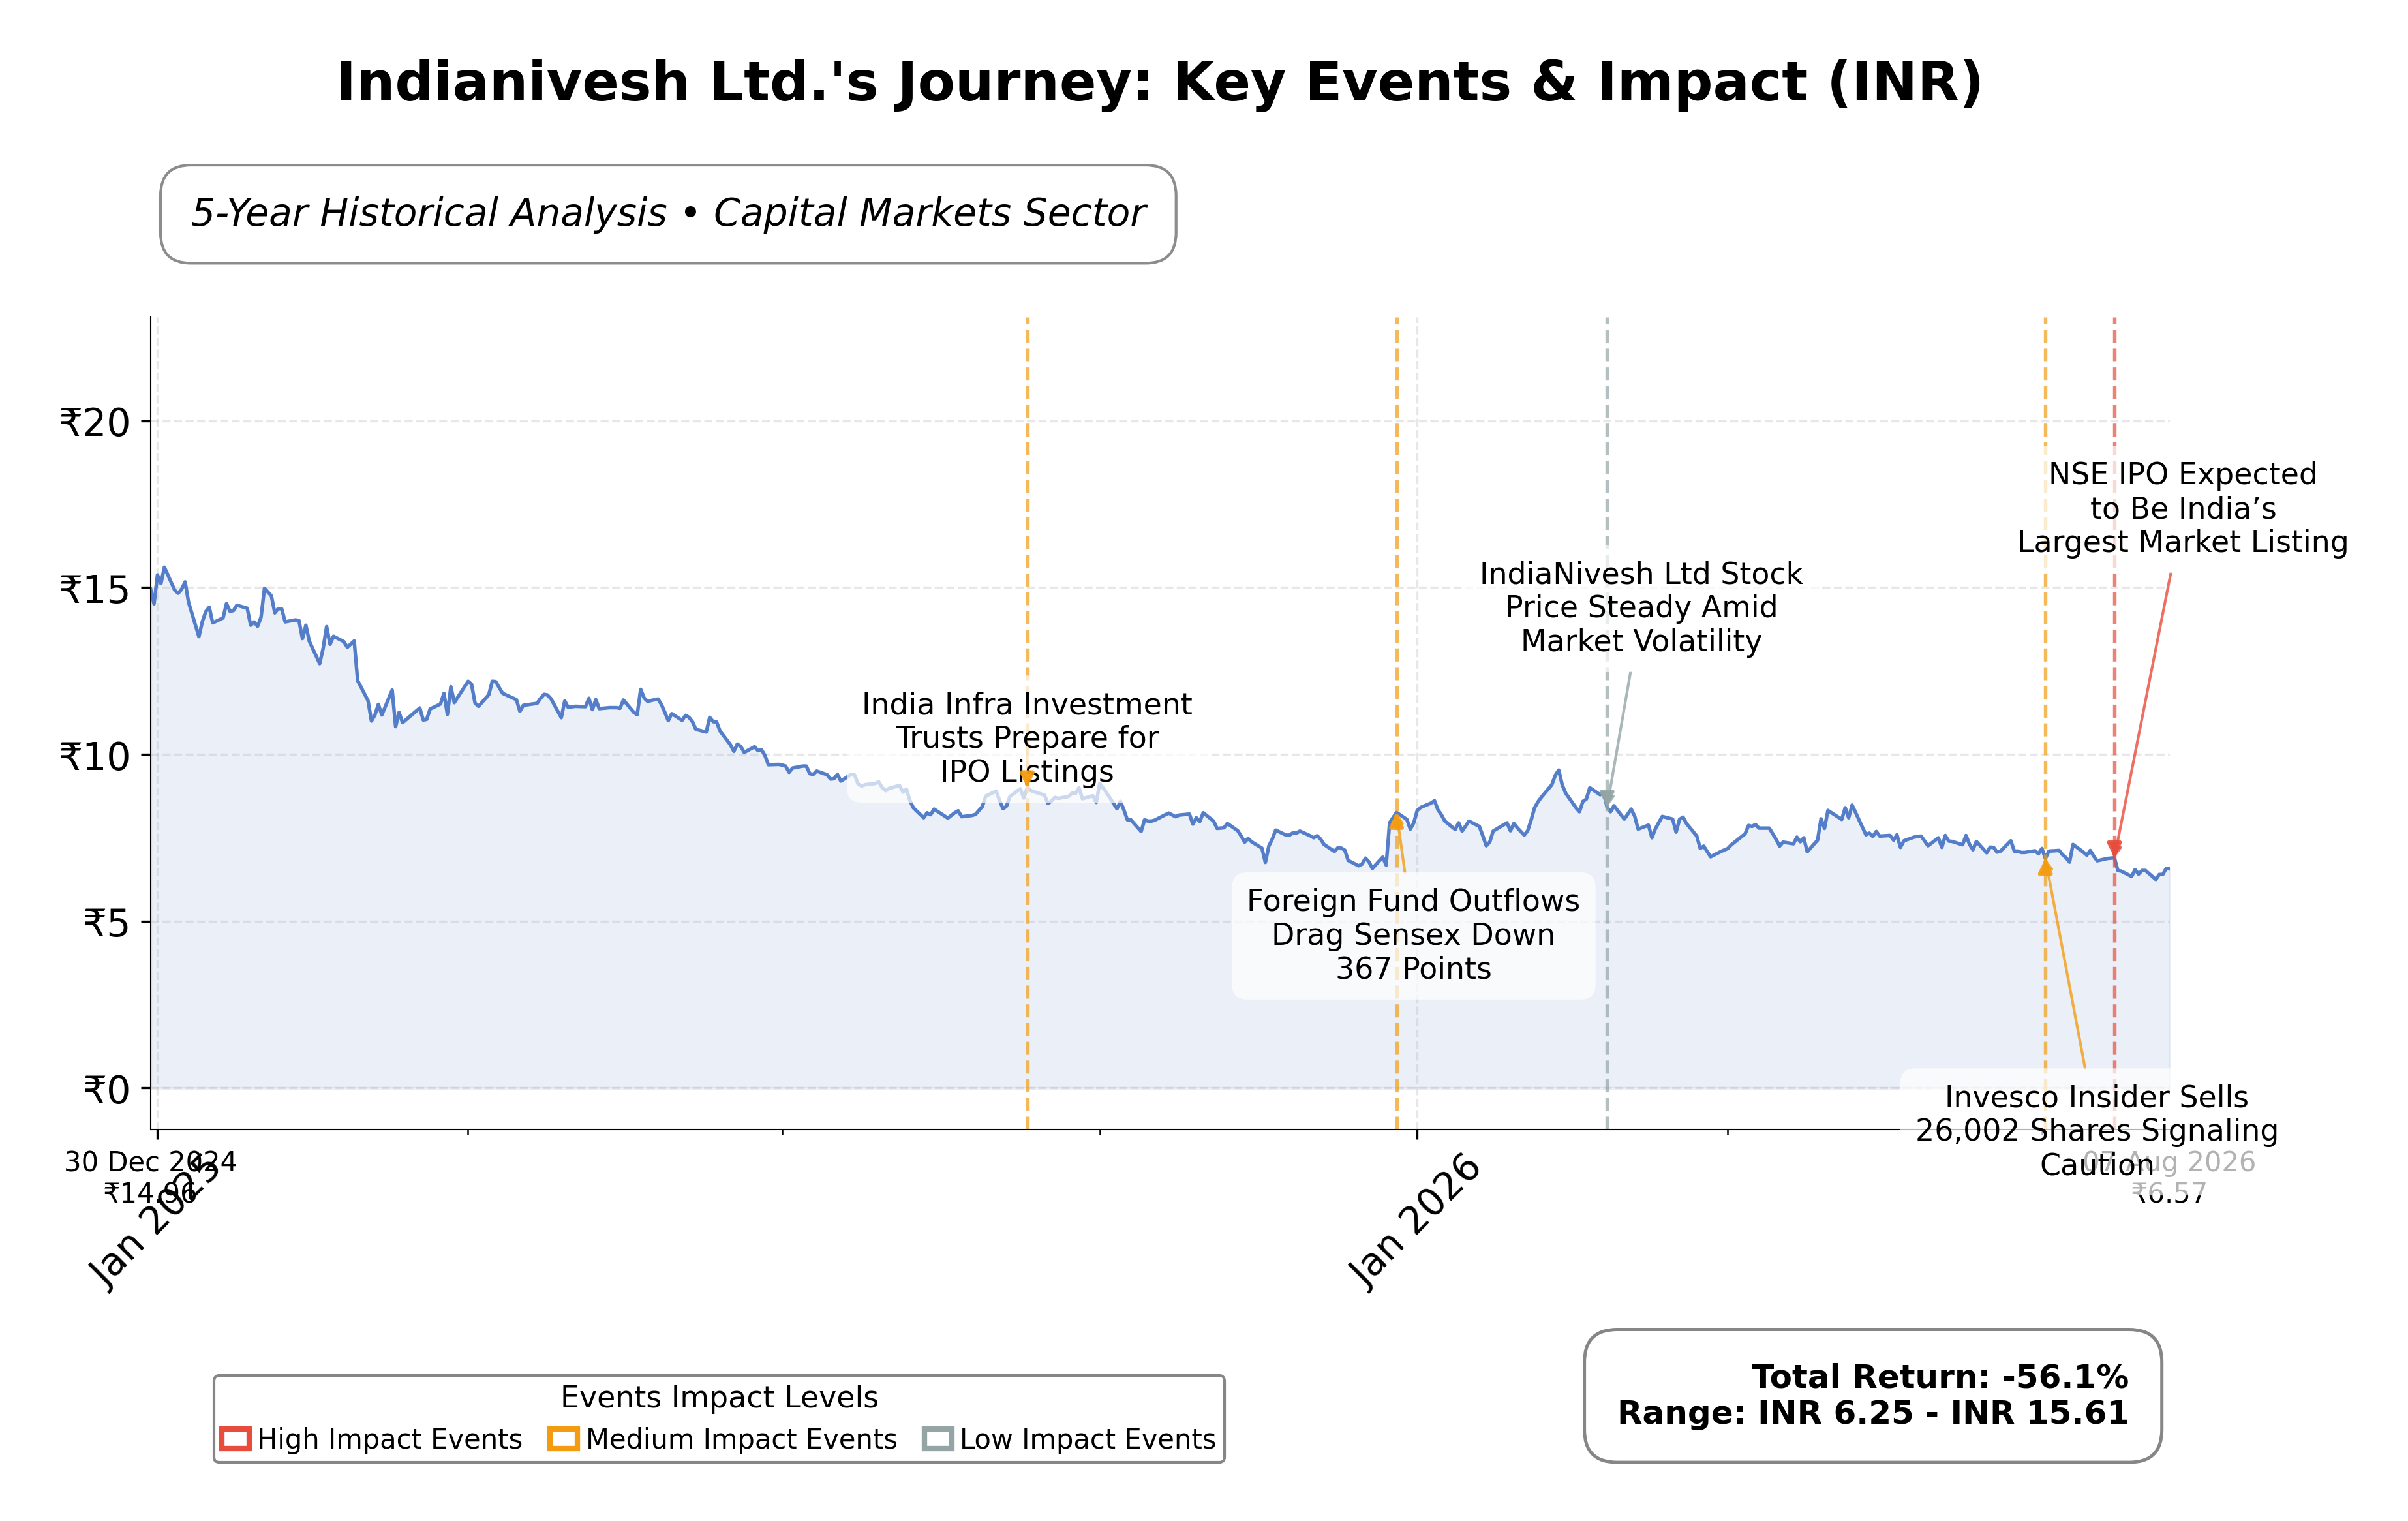
Valuation metrics show a trailing price-to-earnings (P/E) ratio of 20.72, though forward P/E and PEG ratios are unavailable due to negative earnings. The price-to-book (P/B) ratio is negative at -0.54, signaling that the market value is below book value, which may reflect financial distress or asset write-downs. Market capitalization is approximately ₹248.02 million, with the stock trading at ₹6.57 within a 52-week range of ₹5.27 to ₹10.00. The current price is closer to the lower end of this range, indicating a potential downside risk of 52.2% from the 52-week high.
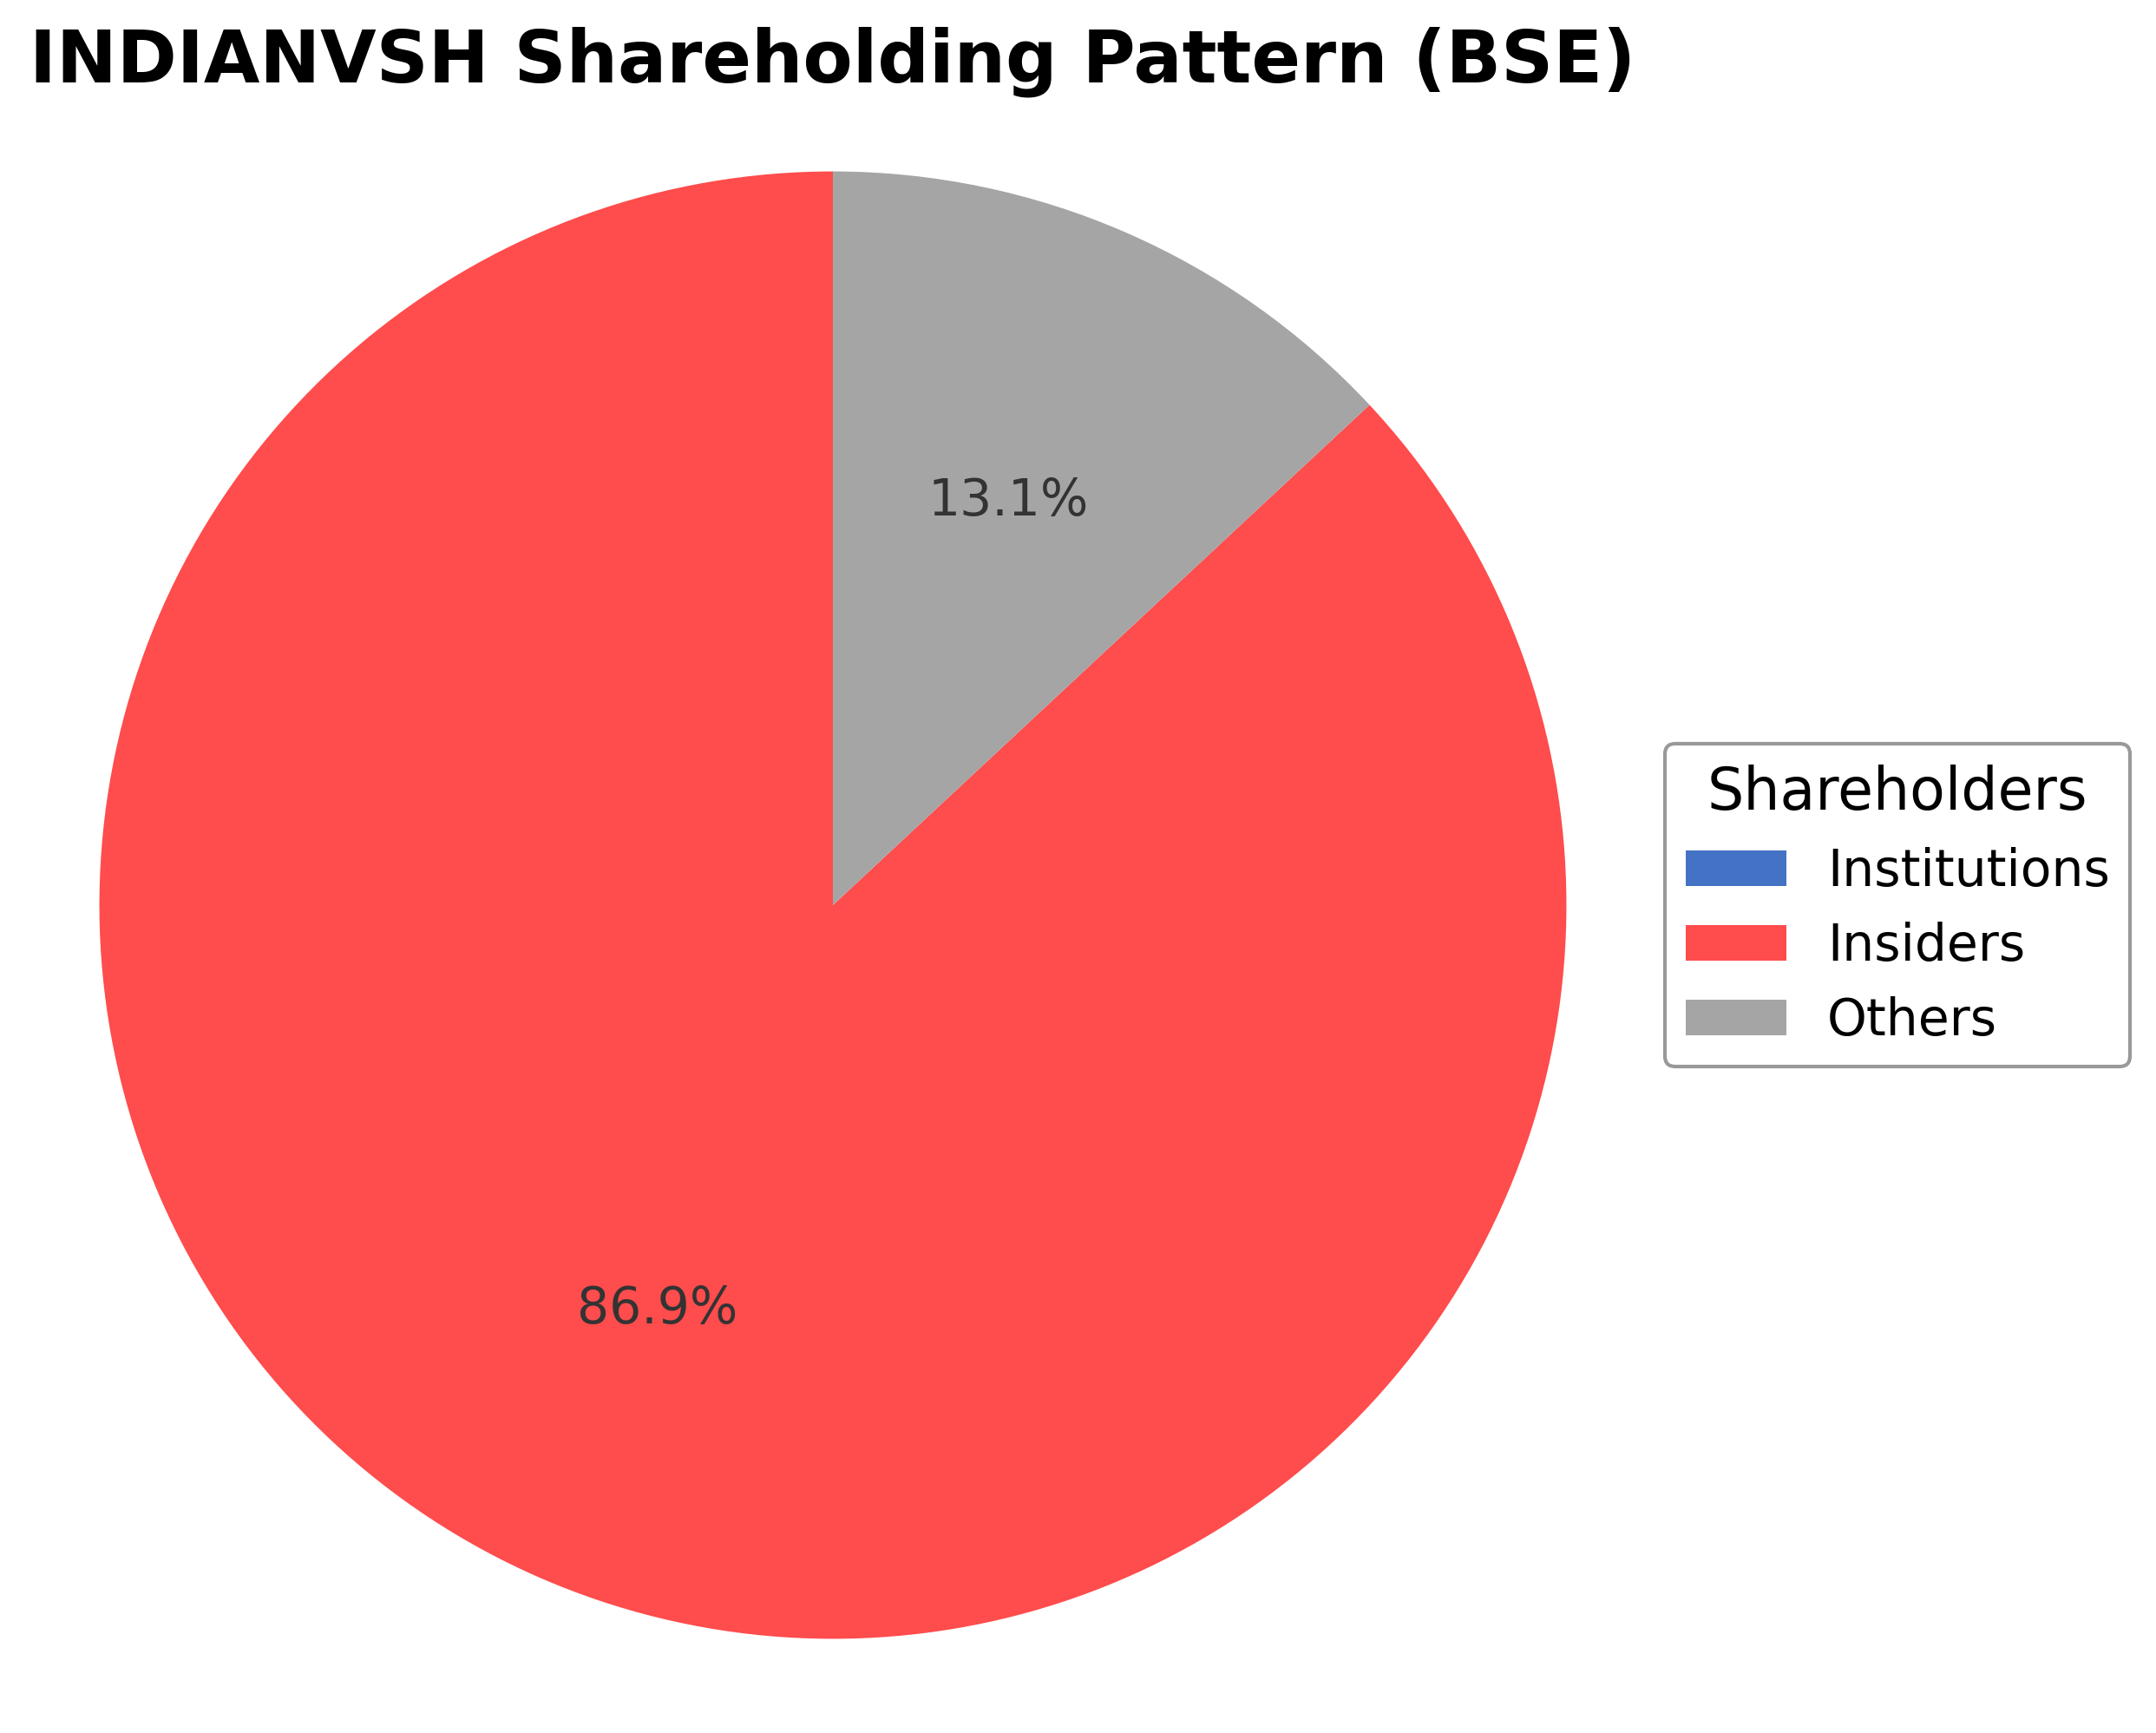
Indianivesh’s strengths include a diversified business model across multiple financial segments and a relatively strong ROE. However, key risks involve persistent net losses, negative cash flows, and a weak current ratio of 0.037, indicating liquidity constraints. The company has no reported debt on the balance sheet but shows significant negative shareholders’ equity, which may pose solvency concerns. Recent strategic actions include scheduled board meetings to review financial results, but no major acquisitions or leadership changes are noted. The shareholding pattern reveals minimal institutional ownership and a small insider holding of 0.87%.
Technically, the stock is trading below its 50-day (₹6.97) and 200-day (₹7.58) moving averages, with a negative beta of -0.52 suggesting low correlation with market movements. Momentum indicators and multi-timeframe analysis suggest cautious price action with support near ₹5.27 and resistance near ₹7.45. Overall, the data presents a mixed outlook with operational challenges and valuation concerns, warranting a watchful stance on the stock’s trajectory.
Company and Industry Overview
Company Basics
Price Performance
Company Size
Shareholding Pattern
Sector and Industry Analysis
The Indian non-banking financial company (NBFC) sector plays a crucial role in supplementing the banking system by providing credit to underserved segments, including small and medium enterprises and retail borrowers. The sector has witnessed steady growth driven by increasing financial inclusion, digital adoption, and diversification of lending products. Major players include Bajaj Finance, Mahindra Finance, and Shriram Transport Finance, which dominate in terms of market capitalization and loan book size.
Industry trends indicate a growing focus on asset quality and risk management, especially in stressed asset acquisition and resolution, where companies like Indianivesh Ltd. have carved a niche. The competitive landscape is marked by consolidation and increased regulatory scrutiny, raising barriers for smaller or less-capitalized firms. Additionally, the rise of fintech and digital lending platforms is reshaping customer acquisition and service delivery, intensifying competition and innovation within the sector.
The regulatory environment for NBFCs in India is overseen by the Reserve Bank of India (RBI), which has implemented stricter norms on capital adequacy, asset classification, and provisioning to enhance sector stability. Recent measures include tighter liquidity requirements and enhanced disclosure norms to improve transparency and protect investors. These regulations aim to mitigate systemic risks while supporting sustainable growth, influencing NBFCs' operational strategies and market behavior.
Note: Analysis synthesized from industry research, market reports, and regulatory filings. Information is subject to change based on market conditions.
Financial Ratios Dashboard
Financials
Peer Analysis
| Company Name | Market Cap | P/E Ratio | P/B Ratio | EV/EBITDA | Price to CFO |
|---|---|---|---|---|---|
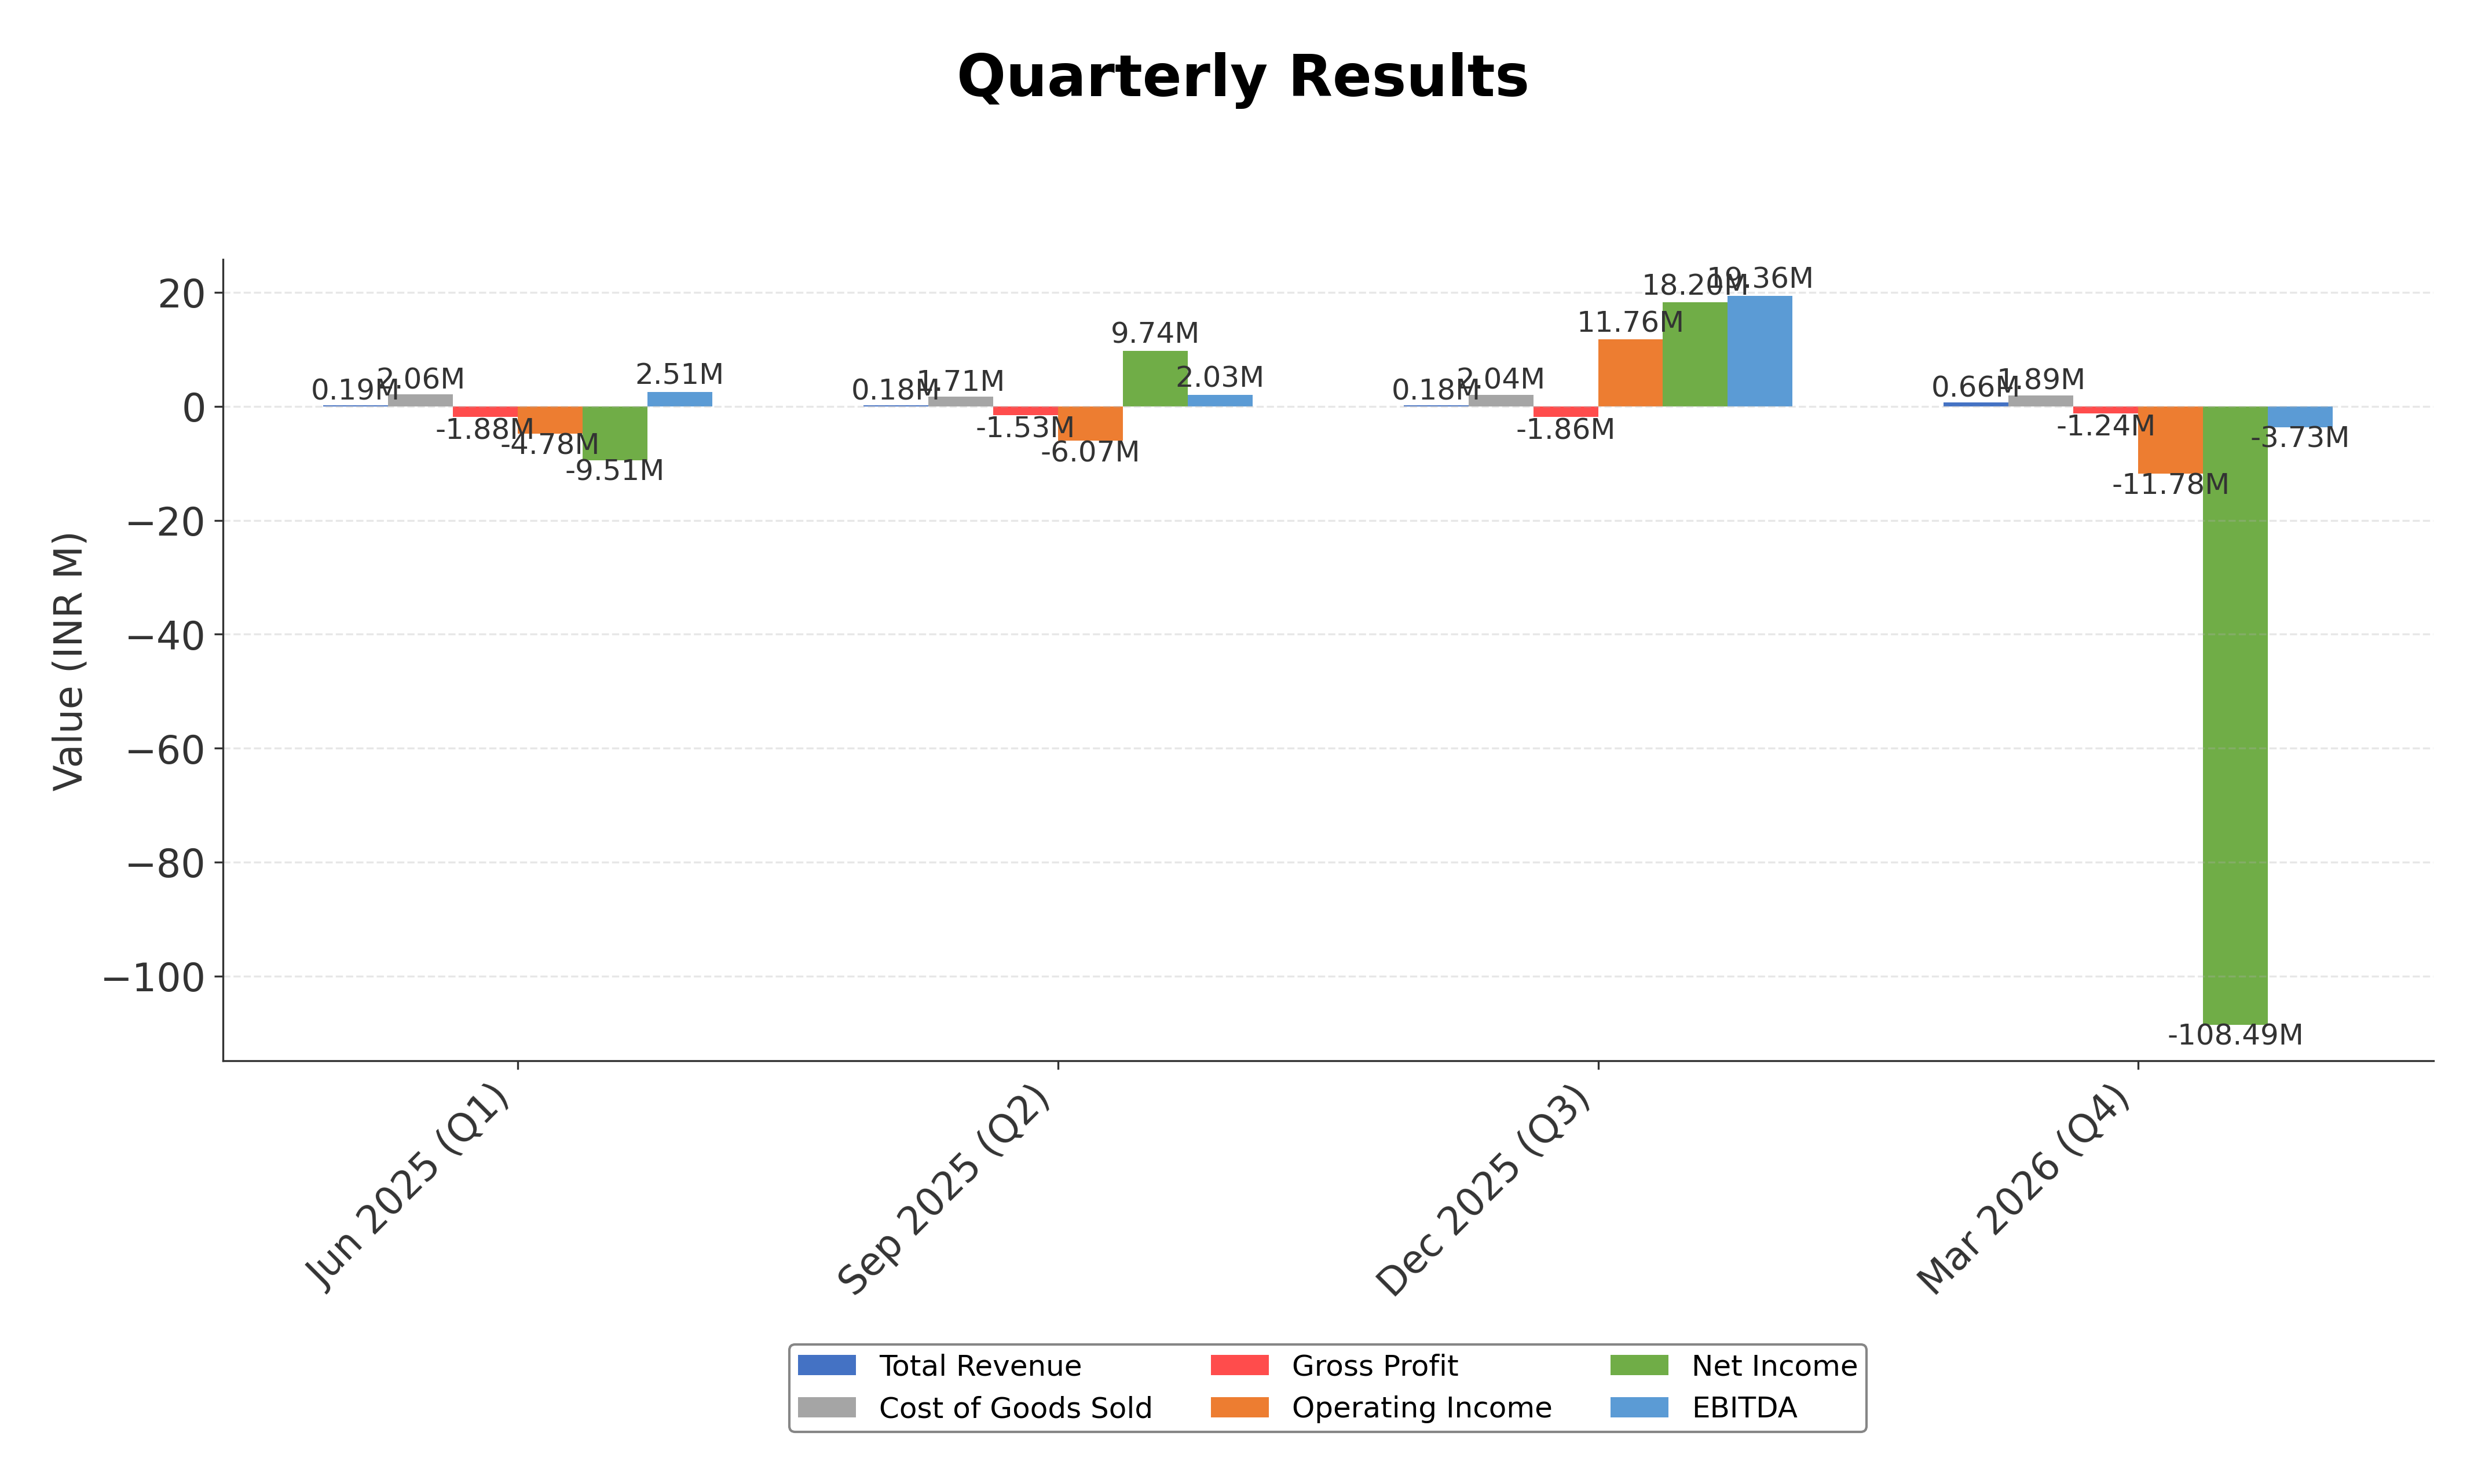
| Indianivesh Ltd. | ₹0.25B | 20.72 | -0.54 | 0.00 | -2.42 |
Comparison Analysis: Indianivesh Ltd. currently lacks direct peer comparison data within the capital markets industry segment. Its trailing P/E ratio of 20.72 aligns with the industry average, but the negative price-to-book ratio of -0.54 and zero EV/EBITDA indicate financial distress relative to typical industry standards. The negative price to cash flow ratio of -2.42 further highlights operational cash flow challenges. The company’s return on equity of 18.18% is a relative strength, suggesting efficient equity use despite profitability issues. Without comparable peers, Indianivesh’s financial metrics suggest a mixed performance profile within its sector.
Financial Metrics Comparison with Peers
Financial Statements
Comprehensive financial data including income, balance sheet, and cash flow metrics
Income Statement
| fiscal_date | 2026-03-31 | 2025-03-31 | 2024-03-31 | 2023-03-31 | 2022-03-31 |
|---|---|---|---|---|---|
| Sales | 1.20M | 23.95M | 15.53M | 2.70M | 56.98M |
| Cost Of Goods | 7.71M | 6.24M | 7.92M | 7.39M | 8.69M |
| Gross Profit | -6.50M | 17.72M | 7.61M | -4.69M | 48.29M |
| Operating Expense Other Operating Expenses | 18.59M | 7.59M | 29.18M | 34.49M | 22.51M |
| Operating Income | -10.87M | 16.80M | 11.91M | -53.82M | 1.96M |
| Non Operating Interest Expense | 93.36M | 99.03M | 9.64M | 142.86K | 98.66M |
| Pretax Income | -77.31M | -57.17M | 24.00M | -33.06M | -78.39M |
| Income Tax | 12.74M | 6.70M | -1.30M | -3.88M | -39.48M |
| Net Income | -90.05M | -63.87M | 25.31M | -29.18M | -38.91M |
| Ebit | 16.05M | 41.86M | 33.65M | -32.92M | 20.26M |
| Ebitda | 20.18M | 47.22M | 41.15M | -23.95M | 32.86M |
| Net Income Continuous Operations | -77.31M | -57.17M | 24.00M | -33.06M | -78.39M |
| Minority Interests | 0.00 | 0.00 | 0.00 | 0.00 | 0.00 |
| Preferred Stock Dividends | 0.00 | 0.00 | 0.00 | 0.00 | 0.00 |
| Operating Expense Selling General And Administrative | N/A | 3.07M | 3.80M | 4.78M | 5.50M |
| Eps Basic | N/A | -1.69 | 0.67 | -0.77 | -1.03 |
| Eps Diluted | N/A | -1.69 | 0.67 | -0.77 | -1.03 |
| Basic Shares Outstanding | N/A | 37.75M | 37.75M | 37.75M | 37.75M |
| Diluted Shares Outstanding | N/A | 37.75M | 37.75M | 37.75M | 37.75M |
| Non Operating Interest Income | N/A | N/A | N/A | N/A | 0.00 |
Data provided by Twelve Data
Balance Sheet
| fiscal_date | 2026-03-31 | 2025-03-31 | 2024-03-31 | 2023-03-31 | 2022-03-31 |
|---|---|---|---|---|---|
| Cash And Cash Equivalents | 2.47M | 2.04M | 1.74M | 27.16M | 9.72M |
| Accounts Receivable | 15.01M | 8.41M | 203.27K | 130.10K | 22.73K |
| Total Assets | 937.45M | 928.74M | 920.64M | 896.83M | 776.31M |
| Total Liabilities | 1.43B | 1.33B | 1.26B | 1.26B | 1.25B |
| Long Term Debt | 1.41B | 1.32B | 1.23B | N/A | 1.21B |
| Shareholders Equity | -495.21M | -405.01M | -341.43M | -367.34M | -337.78M |
Data provided by Twelve Data
Cash Flow Statement
| fiscal_date | 2026-03-31 | 2025-03-31 | 2024-03-31 | 2023-03-31 | 2022-03-31 |
|---|---|---|---|---|---|
| Operating Activities Net Income | -77.31M | -57.17M | 24.00M | -33.06M | -78.39M |
| Operating Activities Other Non Cash Items | -27.67M | -38.16M | -30.59M | -25.41M | -54.80M |
| Operating Activities Accounts Receivable | -26.27M | 146.16M | -74.27M | 118.26M | 756.61M |
| Operating Activities Other Assets Liabilities | 23.05M | -156.37M | 32.26M | -85.44M | -1.08B |
| Operating Activities Operating Cash Flow | -102.57M | -105.54M | -48.60M | -25.64M | -459.14M |
| Investing Activities Sale Of Investments | 0.00 | 1.50M | 8.63K | N/A | 1.01B |
| Investing Activities Investing Cash Flow | 0.00 | 1.52M | -7.03M | 112.61K | 1.01B |
| End Cash Position | 2.47M | 2.04M | 1.74M | 27.16M | 9.72M |
| Free Cash Flow | -102.57M | -104.15M | -36.63M | -12.66M | -657.53M |
| Investing Activities Capital Expenditures | N/A | 18.27K | -7.04M | 2.61M | 21.00 |
| Financing Activities Long Term Debt Issuance | N/A | 85.19M | 0.00 | 27.71M | 0.00 |
| Financing Activities Long Term Debt Payments | N/A | 0.00 | -653.18K | -4.94M | -412.77M |
| Financing Activities Financing Cash Flow | N/A | 85.19M | -653.18K | 22.78M | -412.77M |
| Investing Activities Purchase Of Investments | N/A | N/A | N/A | -2.50M | N/A |
| Investing Activities Other Investing Activity | N/A | N/A | N/A | N/A | -1.00 |
Data provided by Twelve Data
Technical Analysis
Key Insights
- Current trend shows the stock trading below both the 50-day moving average (₹6.97) and 200-day moving average (₹7.58), indicating a bearish short- to medium-term momentum.
- Key support level is identified near the 52-week low of ₹5.27, while resistance is observed around ₹7.45, marking the upper bound of recent daily price ranges.
- The stock price is below the 10-day, 50-day, and 200-day moving averages, suggesting downward pressure and lack of upward momentum.
- Momentum indicators such as RSI and MACD are subdued, reflecting weak buying interest and limited positive momentum in the stock.
- Multi-timeframe analysis across daily, weekly, and monthly charts confirms a consolidative to bearish pattern with no clear breakout signals.
- Potential market scenarios include continued consolidation near support levels or further downside if support at ₹5.27 fails, while a recovery above moving averages would be needed to shift momentum positively.
Trending News
Summary: Explore today's top 20 stocks, featuring Signature Global, IndusInd Bank, pharma, railway, and power sectors updates.
Sentiment: neutral
Summary: IndusInd Bank Share Price: Find the latest news on IndusInd Bank Stock Price. Get all the information on IndusInd Bank with historic price charts for NSE / BSE. Experts & Broker view also get the IndusInd Bank Ltd. buy/sell tips detailed news, announcements, Forecasts, Analysts, Valuation, ...
Sentiment: neutral
3. Headline: Crude, Hormuz & more: What will drive stock market this week - The Times of India
Summary: After ending the previous week in green, Dalal Street is set to take cues from a mix of global geopolitical developments and key domestic economic indicators in the upcoming trading sessions. This week, investors will closely watch crude oil prices, developments around the Strait of Hormuz ...
Sentiment: neutral
4. Headline: NIFTY 50 Indices | Live NIFTY 50 Share/Stock Price Today | NIFTY 50 Index Companies - Moneycontrol
Summary: NIFTY 50 Indices/Index: See the complete information on NIFTY 50 share price live, market quotes & prices, list of companies, % change, volume & more at Moneycontrol.
Sentiment: neutral
5. Headline: Stock Market: Stock Market Today | Stock Market Live News Update - Moneycontrol.com
Summary: Share Market Today - Stock Market and Share Market Live Updates: Get all the latest share market and India stock market news and updates on Moneycontrol.com
Sentiment: neutral
Powered by Brave
Recent Updates
News Summary
As of 10 August 2026. Indianivesh Ltd. recently announced the scheduling of its Board of Directors meeting on 13 August 2026 to consider and approve the unaudited standalone and consolidated financial results for the first quarter ended 30 June 2026. The company has also complied with SEBI regulations concerning trading window closures and secretarial compliance for the fiscal year ended 31 March 2026. No major strategic transactions or leadership changes were disclosed in the recent announcements. The stock price showed an increase to ₹7.12 on 10 August 2026, reflecting some positive market activity. Overall, the updates focus on regulatory compliance and routine financial disclosures without material changes to the business outlook.
News Sentiment
The overall sentiment from recent updates is neutral, driven by routine regulatory filings and scheduled financial result announcements. There are no indications of significant positive catalysts such as acquisitions or leadership changes, nor are there negative developments like regulatory penalties or financial distress beyond existing challenges. The stock price movement on 10 August 2026 suggests modest investor interest but remains within a narrow trading range. This balanced tone reflects a stable but cautious market perception of Indianivesh Ltd. at this time.
Source List
- https://finance.yahoo.com/quote/INDIANVSH.BO/
Analytical Overview
Analysis Summary
Indianivesh Ltd.’s valuation metrics, including a trailing P/E of 20.72, are broadly in line with the industry average of 20.72; however, the negative price-to-book ratio of -0.54 and lack of forward P/E data due to negative earnings suggest valuation concerns. The company’s revenue growth is modest at 2.6% quarterly, but operating and net margins remain negative, reflecting ongoing profitability challenges. Cash flow trends are weak, with operating cash flow and free cash flow both significantly negative at approximately ₹-102.57 million and ₹-90.05 million respectively, indicating financial stress. Debt levels appear minimal on recent reports, but the extremely low current ratio of 0.037 signals liquidity constraints. Sector-specific challenges include intense competition in financial services and regulatory compliance pressures in India, while opportunities may arise from expanding wealth management and brokerage services. The Indian regulatory environment and evolving consumer financial behavior are critical factors influencing the company’s market positioning.
Overall Business and Market Assessment
Supporting Factors: Indianivesh’s diversified financial services offerings and an ROE of 18.18%, which indicates some effective equity utilization
Risk Factors: No data
SWOT Analysis
Strengths
- Indianivesh Ltd. operates across multiple financial services segments, providing diversified revenue streams.
- The company maintains a relatively strong return on equity of 18.18%, indicating efficient use of shareholder capital.
- Positive EBITDA of ₹20.18 million despite net losses shows operational cash generation capability.
- Established presence in the Indian financial services sector with comprehensive market research capabilities.
Weaknesses
- Negative net income of ₹-90.05 million and negative gross margin indicate ongoing profitability challenges.
- Extremely low current ratio of 0.037 reflects significant liquidity constraints.
- Negative price-to-book ratio of -0.54 suggests market valuation below book value and potential financial distress.
- Negative operating and free cash flows highlight cash generation difficulties.
Opportunities
- Growth potential in wealth management and brokerage services amid expanding Indian financial markets.
- Increasing demand for diversified financial products and advisory services in India.
- Potential to leverage market research and advisory expertise to attract institutional clients.
- Regulatory reforms in India’s financial sector could create new business avenues.
Threats
- Intense competition within the Indian financial services industry may pressure margins.
- Regulatory compliance risks and evolving financial regulations could increase operational costs.
- Macroeconomic volatility and market downturns may adversely affect investment and brokerage activities.
- Liquidity risks due to weak current ratio and negative cash flows could constrain operational flexibility.
Company Description
Indianivesh Ltd. is a diversified financial services company based in India. Its primary function is to provide a wide array of financial solutions and investment advisory services, catering to both individual and institutional investors. The firm operates across various segments, including equity broking, wealth management, investment banking, insurance distribution, and financial product distribution, making it a key player in the financial sector. Indianivesh Ltd. is recognized for its comprehensive market research and robust analysis, which guides clients in optimizing their investment portfolios. Its reach extends across multiple financial markets, influencing sectors such as equities, derivatives, commodities, and fixed income. This broad market involvement ensures that Indianivesh Ltd. plays a critical role in facilitating investment opportunities and financial growth for its clients. With a strong emphasis on customer-focused services and innovative financial solutions, Indianivesh Ltd. contributes significantly to the dynamic Indian financial market. It supports economic advancement by enabling clients to navigate market complexities and achieve financial stability.