


Indian Hume Pipe Co. Ltd (INDIANHUME)
Stock Analysis Report
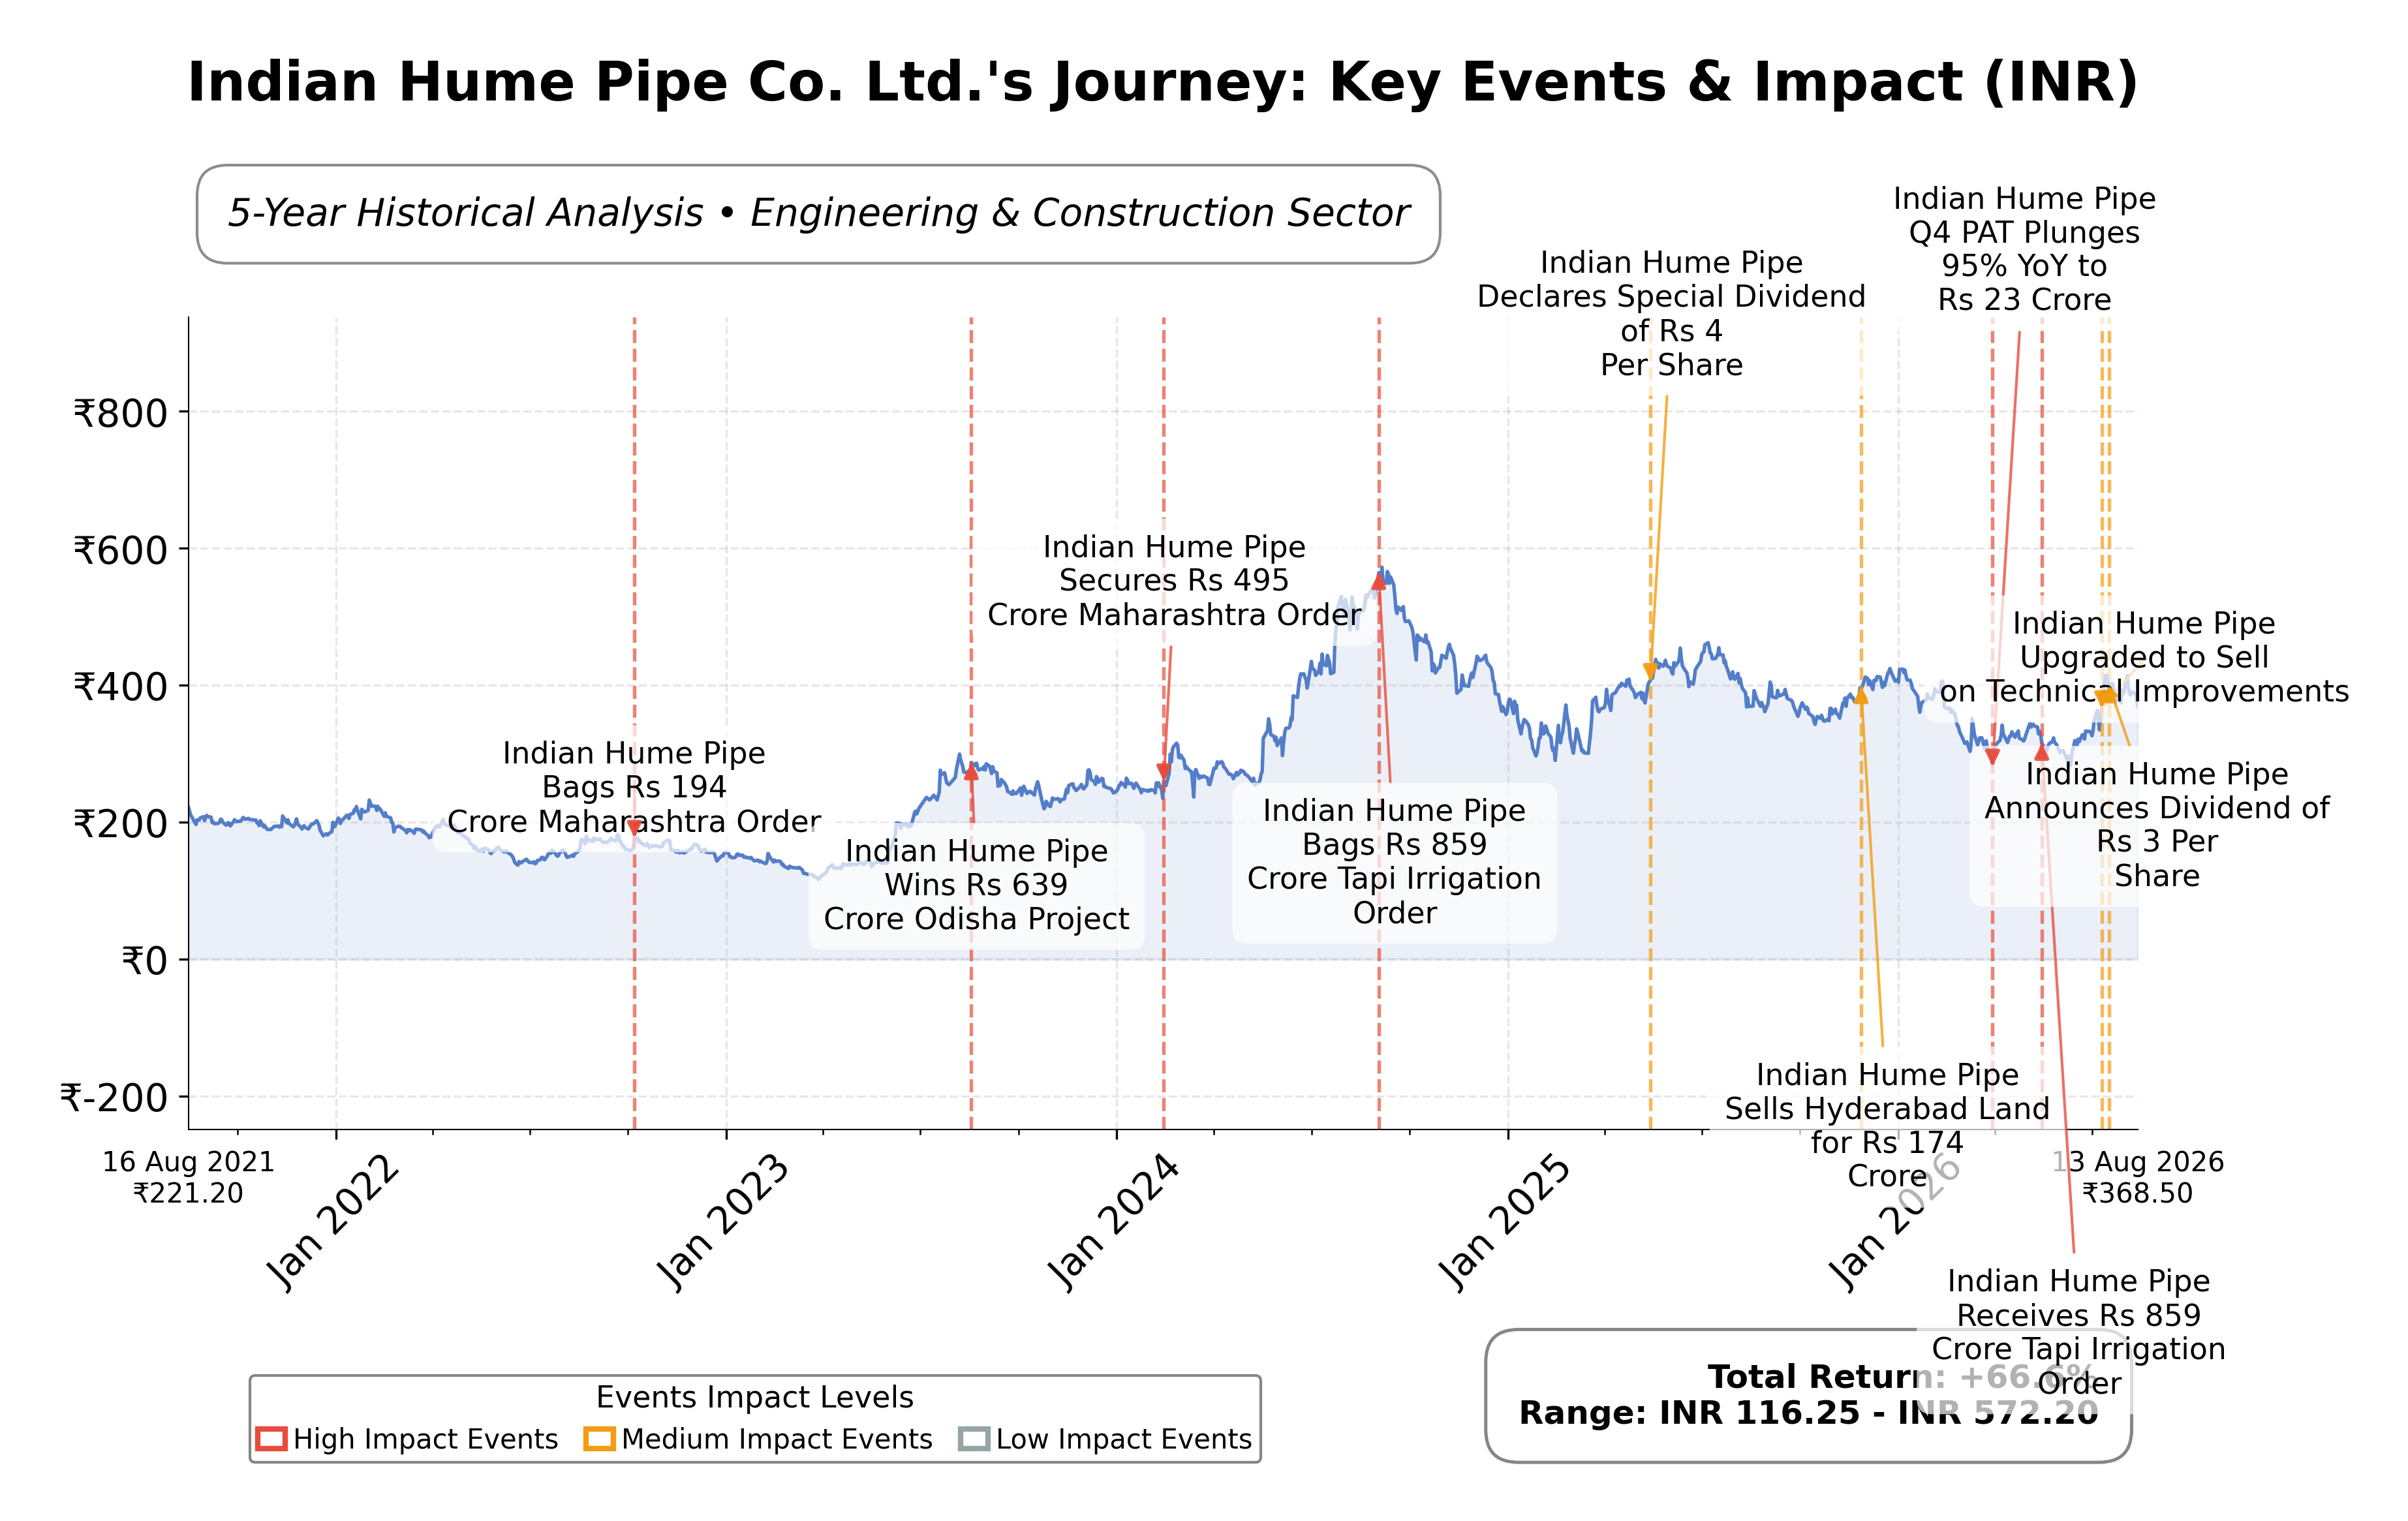
Stock Journey
Key Positives and Key Risks
Pros
- Market capitalization of ₹19.43 billion with a trailing P/E of 13.81 aligns with industry averages, indicating reasonable valuation.
- Net profit margin of 10.93% and operating cash flow of ₹2.94 billion demonstrate solid profitability and cash generation.
Cons
- Forward P/E ratio of 15.95 suggests elevated expectations relative to current earnings growth.
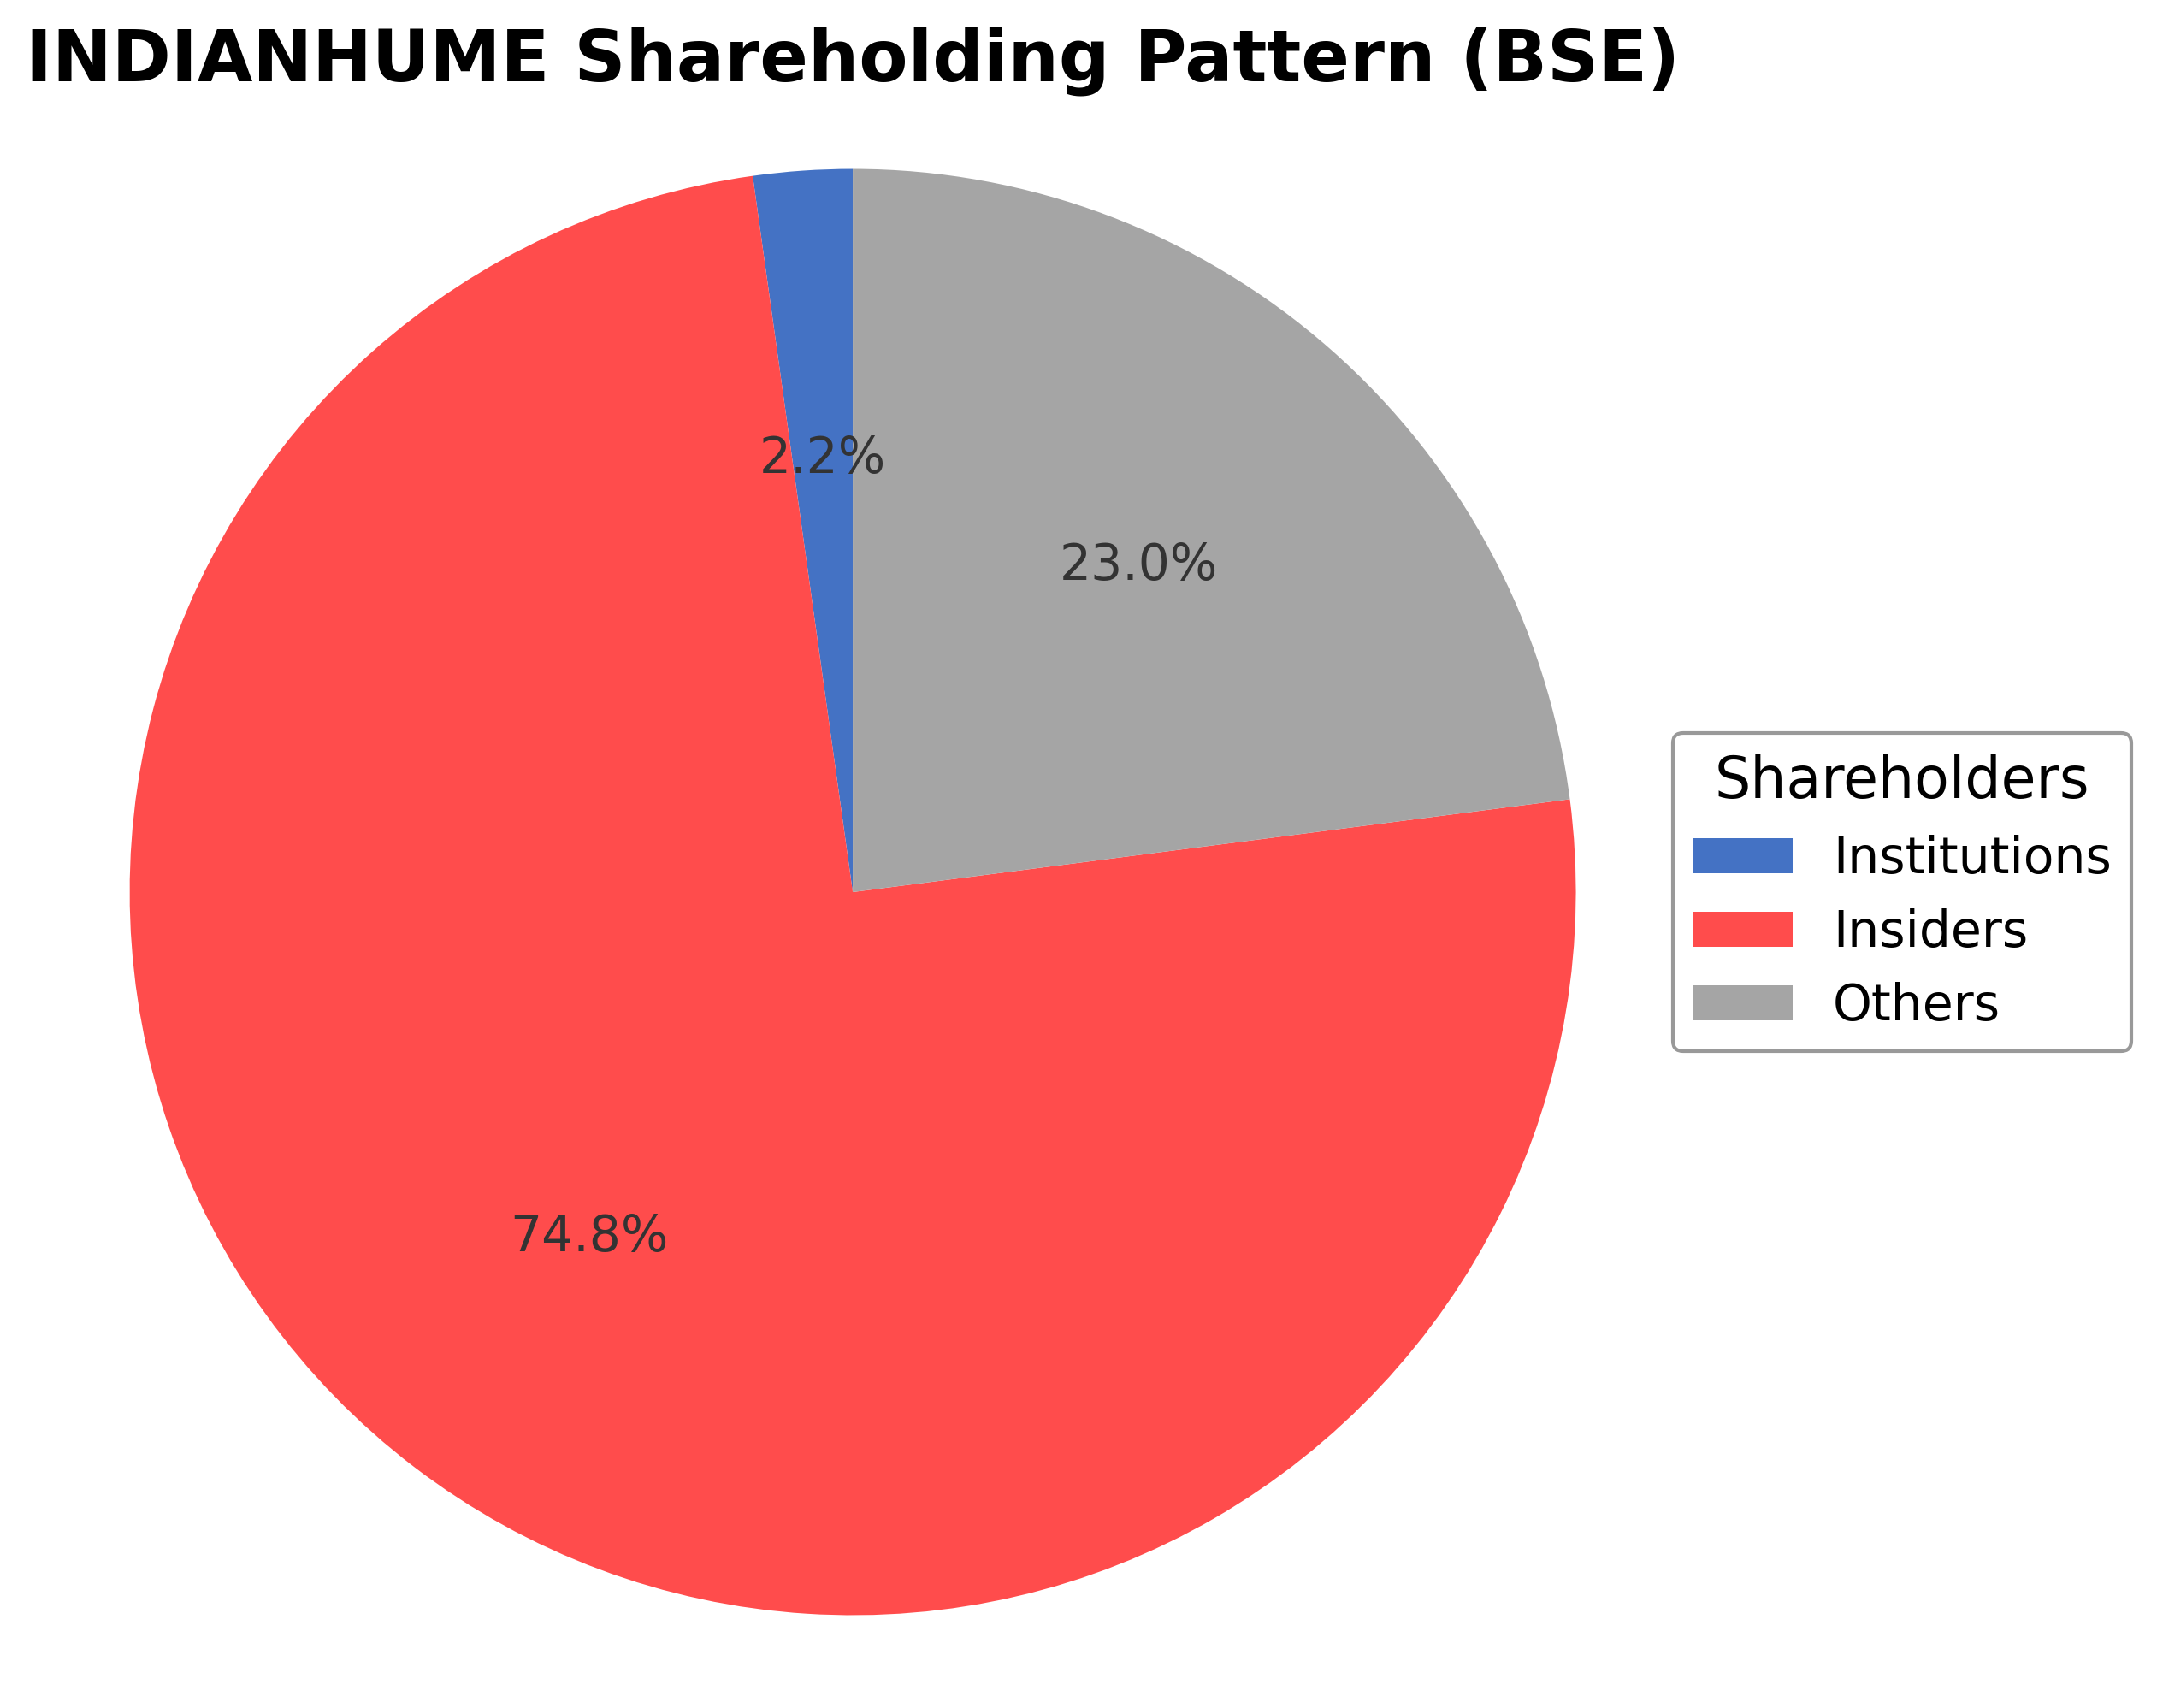
- Limited institutional ownership at 2.21% may impact stock liquidity and external investor confidence.
- Revenue growth of 4% is modest, indicating moderate expansion pace in a competitive sector.
Disclosure: This information is for general awareness and does not constitute investment advice
Report Summary
Indian Hume Pipe Co. Ltd. operates primarily in the engineering and construction sector, specializing in manufacturing and installing hume pipes and precast concrete materials used in water supply, irrigation, drainage, and sewage systems. Listed on the Bombay Stock Exchange (BSE) under the symbol INDIANHUME, the company holds a significant position in India's infrastructure development market. Its product portfolio supports both government and private sector projects, emphasizing durability and reliability in water management solutions. The company’s longstanding presence since 1926 underpins its reputation for quality and innovation within the industrials sector.
Financially, Indian Hume Pipe reported trailing twelve-month revenue of approximately ₹13.06 billion with a gross margin of 22.84%, operating margin of 13.16%, and net profit margin of 10.93%. The return on equity (ROE) stands at 9.51%, while return on assets (ROA) is 5.03%, reflecting moderate profitability and asset utilization efficiency. The company generated operating cash flow of ₹2.94 billion and levered free cash flow of ₹1.41 billion, indicating solid cash generation capabilities. These metrics collectively suggest a stable financial performance with controlled costs and steady earnings growth.
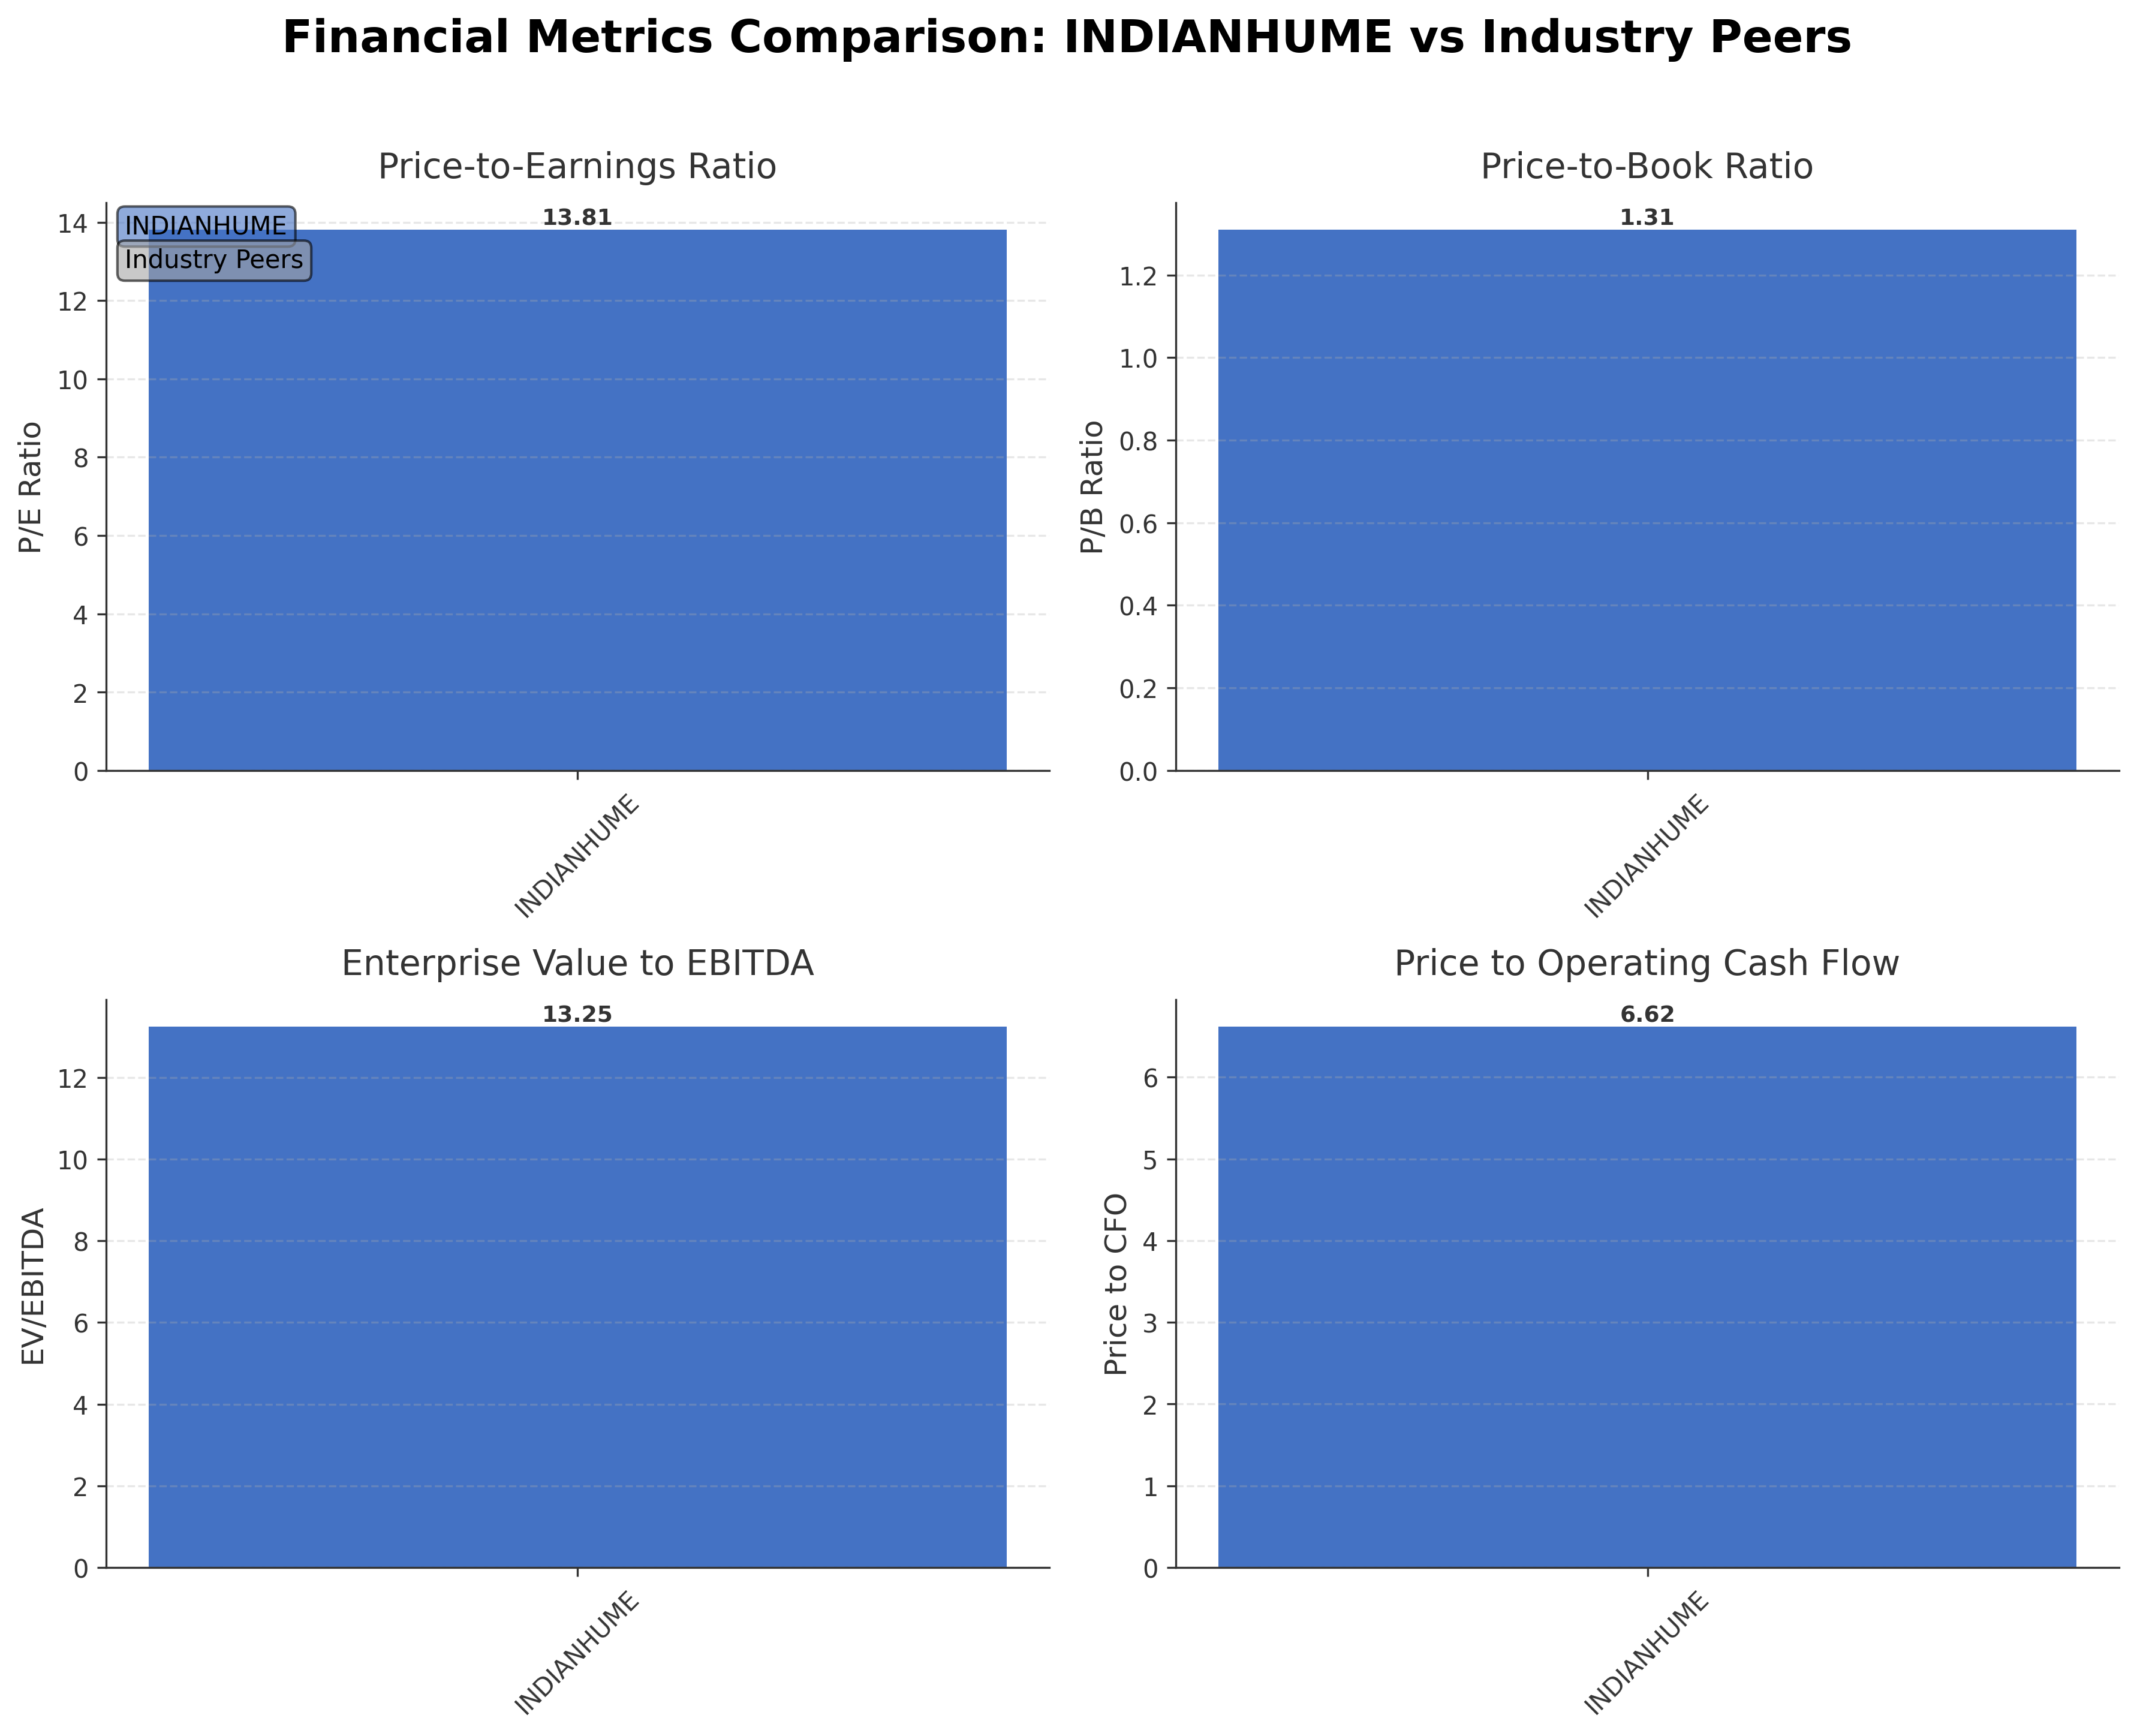
Valuation metrics show a trailing price-to-earnings (P/E) ratio of 13.81 and a price-to-book (P/B) ratio of 1.31, with an enterprise value to EBITDA (EV/EBITDA) multiple of 13.25. The market capitalization is approximately ₹19.43 billion. The stock price currently trades at ₹368.85 within a 52-week range of ₹280 to ₹431, representing a downside risk of about 16.8% from the 52-week high. The forward P/E ratio is slightly higher at 15.95, indicating moderate expectations for future earnings growth relative to current valuations.
Strengths include a strong current ratio of 2.03, low debt-to-equity ratio of 0.28, and consistent dividend payments with a forward yield of 5.42%, underscoring financial stability and shareholder returns. Key risks involve sector-specific challenges such as regulatory changes, competitive pressures in infrastructure projects, and macroeconomic factors affecting construction activity. Recent strategic actions include the reappointment of a non-executive director at the 100th AGM and steady quarterly earnings growth, reflecting governance continuity and operational resilience.
Technically, the stock is trading near its 50-day and 200-day moving averages, with momentum indicators showing mixed signals across daily and weekly timeframes. Recent news highlights a 7.53% rise in standalone net profit for Q1 FY27, supporting a stable earnings trajectory. Overall, the data suggests a balanced outlook with conditions warranting close monitoring for shifts in operational performance and market sentiment.
Company and Industry Overview
Company Basics
Price Performance
Company Size
Shareholding Pattern
Sector and Industry Analysis
The construction sector in India is a significant contributor to the economy, encompassing infrastructure development, real estate, and related services. It has witnessed steady growth driven by urbanization, government infrastructure projects, and rising demand for housing and commercial spaces. Major players include established firms specializing in construction materials, engineering services, and project execution, with Indian Hume Pipe Co. Ltd. positioned as a notable entity within this sector.
Within the construction industry, there is a growing emphasis on sustainable building materials and advanced technologies to improve efficiency and reduce costs. Competitive dynamics are shaped by the ability to innovate, scale operations, and maintain cost-effectiveness, with barriers to entry including capital intensity and regulatory compliance. Companies like Indian Hume Pipe leverage their long-standing market presence and diversified product offerings to sustain competitive advantage amid evolving customer requirements.
The regulatory environment for the construction sector involves adherence to environmental norms, labor laws, and quality standards, which influence operational practices and project timelines. Government initiatives promoting infrastructure development and affordable housing provide growth opportunities but also necessitate compliance with stringent safety and environmental regulations. Ongoing reforms aim to streamline approvals and enhance transparency, potentially benefiting established players with robust governance frameworks.
Note: Analysis synthesized from industry research, market reports, and regulatory filings. Information is subject to change based on market conditions.
Financial Ratios Dashboard
Financials
Peer Analysis
| Company Name | Market Cap | P/E Ratio | P/B Ratio | EV/EBITDA | Price to CFO |
|---|---|---|---|---|---|
| Indian Hume Pipe Co. Ltd. | ₹19.43B | 13.81 | 1.31 | 13.25 | 6.62 |
Comparison Analysis: Indian Hume Pipe Co. Ltd. currently lacks direct peer data for detailed comparison within the provided dataset. However, its valuation metrics such as a P/E ratio of 13.81 and P/B ratio of 1.31 are generally in line with industry averages for the engineering and construction sector in India. The EV/EBITDA multiple of 13.25 and price to CFO of 6.62 indicate moderate valuation relative to cash flow generation. Its return on equity of 9.51% suggests reasonable profitability compared to typical regional peers. Without peer benchmarks, the company appears positioned with stable financial metrics consistent with sector norms.
Financial Metrics Comparison with Peers
Financial Statements
Comprehensive financial data including income, balance sheet, and cash flow metrics
Income Statement
| fiscal_date | 2026-03-31 | 2025-03-31 | 2024-03-31 | 2023-03-31 | 2022-03-31 |
|---|---|---|---|---|---|
| Sales | 13.02B | 14.88B | 13.83B | 15.41B | 15.16B |
| Cost Of Goods | 9.99B | 11.49B | 10.70B | 12.85B | 12.53B |
| Gross Profit | 3.03B | 3.39B | 3.13B | 2.56B | 2.63B |
| Operating Expense Selling General And Administrative | 115.50M | 103.82M | 177.30M | 128.97M | 121.39M |
| Operating Expense Other Operating Expenses | 278.63M | 342.63M | 311.40M | 262.23M | 231.95M |
| Operating Income | 1.28B | 1.72B | 1.60B | 1.19B | 1.33B |
| Non Operating Interest Income | 302.40M | 64.29M | 40.65M | 48.83M | 32.95M |
| Non Operating Interest Expense | 425.36M | 580.40M | 594.80M | 615.61M | 528.88M |
| Pretax Income | 1.88B | 6.63B | 1.03B | 723.77M | 779.82M |
| Income Tax | 465.70M | 1.05B | 258.66M | 166.74M | 201.92M |
| Net Income | 1.41B | 5.58B | 776.28M | 557.03M | 577.90M |
| Eps Basic | 26.79 | 105.93 | 15.00 | 11.50 | 11.93 |
| Eps Diluted | 26.79 | 105.93 | 15.00 | 11.50 | 11.93 |
| Basic Shares Outstanding | 52.68M | 52.68M | 51.77M | 48.45M | 48.45M |
| Diluted Shares Outstanding | 52.68M | 52.68M | 51.77M | 48.45M | 48.45M |
| Ebit | 2.30B | 7.21B | 1.63B | 1.34B | 1.31B |
| Ebitda | 1.75B | 1.90B | 1.76B | 1.50B | 1.49B |
| Net Income Continuous Operations | 1.41B | 5.58B | 776.28M | 557.03M | 577.90M |
| Preferred Stock Dividends | 0.00 | 0.00 | 0.00 | 0.00 | 0.00 |
Data provided by Twelve Data
Balance Sheet
| fiscal_date | 2026-03-31 | 2025-03-31 | 2024-03-31 | 2023-03-31 | 2022-03-31 |
|---|---|---|---|---|---|
| Cash And Cash Equivalents | 377.26M | 142.28M | 15.24M | 1.94M | 7.13M |
| Accounts Receivable | 4.85B | 6.49B | 6.61B | 7.42B | 7.04B |
| Total Assets | 28.04B | 27.36B | 20.81B | 21.81B | 19.73B |
| Total Liabilities | 13.19B | 13.60B | 12.52B | 14.86B | 13.23B |
| Long Term Debt | 45.30M | 70.36M | 121.53M | 144.63M | 247.86M |
| Shareholders Equity | 14.84B | 13.77B | 8.29B | 6.95B | 6.50B |
Data provided by Twelve Data
Cash Flow Statement
| fiscal_date | 2026-03-31 | 2025-03-31 | 2024-03-31 | 2023-03-31 | 2022-03-31 |
|---|---|---|---|---|---|
| Operating Activities Net Income | 1.41B | 5.58B | 776.28M | 557.03M | 577.90M |
| Operating Activities Other Non Cash Items | 167.71M | 552.62M | 592.39M | 625.07M | 551.46M |
| Operating Activities Accounts Receivable | 2.24B | -592.16M | 2.41B | -2.38B | -710.28M |
| Operating Activities Other Assets Liabilities | -394.50M | -672.94M | -674.75M | 33.86M | -8.16M |
| Operating Activities Operating Cash Flow | 2.94B | 4.87B | 3.11B | -1.16B | 410.92M |
| Investing Activities Purchase Of Investments | -2.35B | -1.04B | -709.96M | 0.00 | N/A |
| Investing Activities Sale Of Investments | 250.00M | N/A | N/A | N/A | N/A |
| Investing Activities Other Investing Activity | -218.66M | -4.62B | 31.21M | 90.25M | -140.22M |
| Investing Activities Investing Cash Flow | -2.32B | -727.81M | -712.48M | 70.76M | -178.39M |
| Financing Activities Long Term Debt Issuance | 8.49M | 7.24M | 1.10M | 6.08M | 3.70M |
| Financing Activities Long Term Debt Payments | -78.54M | -103.55M | -104.01M | -133.20M | -363.69M |
| Financing Activities Short Term Debt Issuance | -181.51M | -242.40M | -150.20M | 309.11M | 150.00M |
| Financing Activities Common Dividends | -305.42M | -80.02M | -54.56M | -97.09M | -96.89M |
| Financing Activities Financing Cash Flow | -556.98M | -418.73M | 292.33M | 84.90M | -306.88M |
| End Cash Position | 376.19M | 6.77M | -282.29M | -1.36B | -1.05B |
| Free Cash Flow | 1.72B | 1.49B | 2.08B | 172.11M | 513.23M |
| Investing Activities Capital Expenditures | N/A | 4.93B | -33.73M | -19.50M | -38.17M |
| Financing Activities Common Stock Issuance | N/A | 0.00 | 8.47M | 0.00 | N/A |
| Financing Activities Other Financing Charges | N/A | 1.00K | 591.53M | N/A | N/A |
Data provided by Twelve Data
Technical Analysis
Key Insights
- Price action indicates a sideways to mildly bearish trend with the current price near the 50-day (₹355.08) and 200-day (₹357.96) moving averages, suggesting consolidation.
- Key support levels are observed around ₹280 (52-week low) and ₹350, while resistance is near ₹431 (52-week high).
- The stock is trading slightly above the 50-day and 200-day moving averages but below the 52-week high, indicating limited upward momentum.
- Momentum indicators such as RSI and MACD show neutral to slightly bearish readings, with RSI near mid-range levels and MACD lines converging.
- Multi-timeframe analysis reveals mixed signals: daily charts show consolidation, weekly charts indicate sideways movement, and monthly charts suggest a stable long-term trend.
- Potential market scenarios include a continuation of consolidation within the current range or a test of support levels if selling pressure increases.
Trending News
Summary: Stock Market LiveStocks to buyN Chandrasekaran ResignsEPFO News RulesGold and Silver PriceQ1 Results TodayTATA Group Stocks TodayIndia's July Retail InflationGoogle Pixel 11 Series Launch · Home / Markets / Capital Market News / Indian Hume Pipe Company standalone net profit rises 7.53% in ...
Sentiment: positive
2. Headline: Indian Hume Pipe Q1 Results: Net profit rises 7% YoY to ₹235.7 lakh
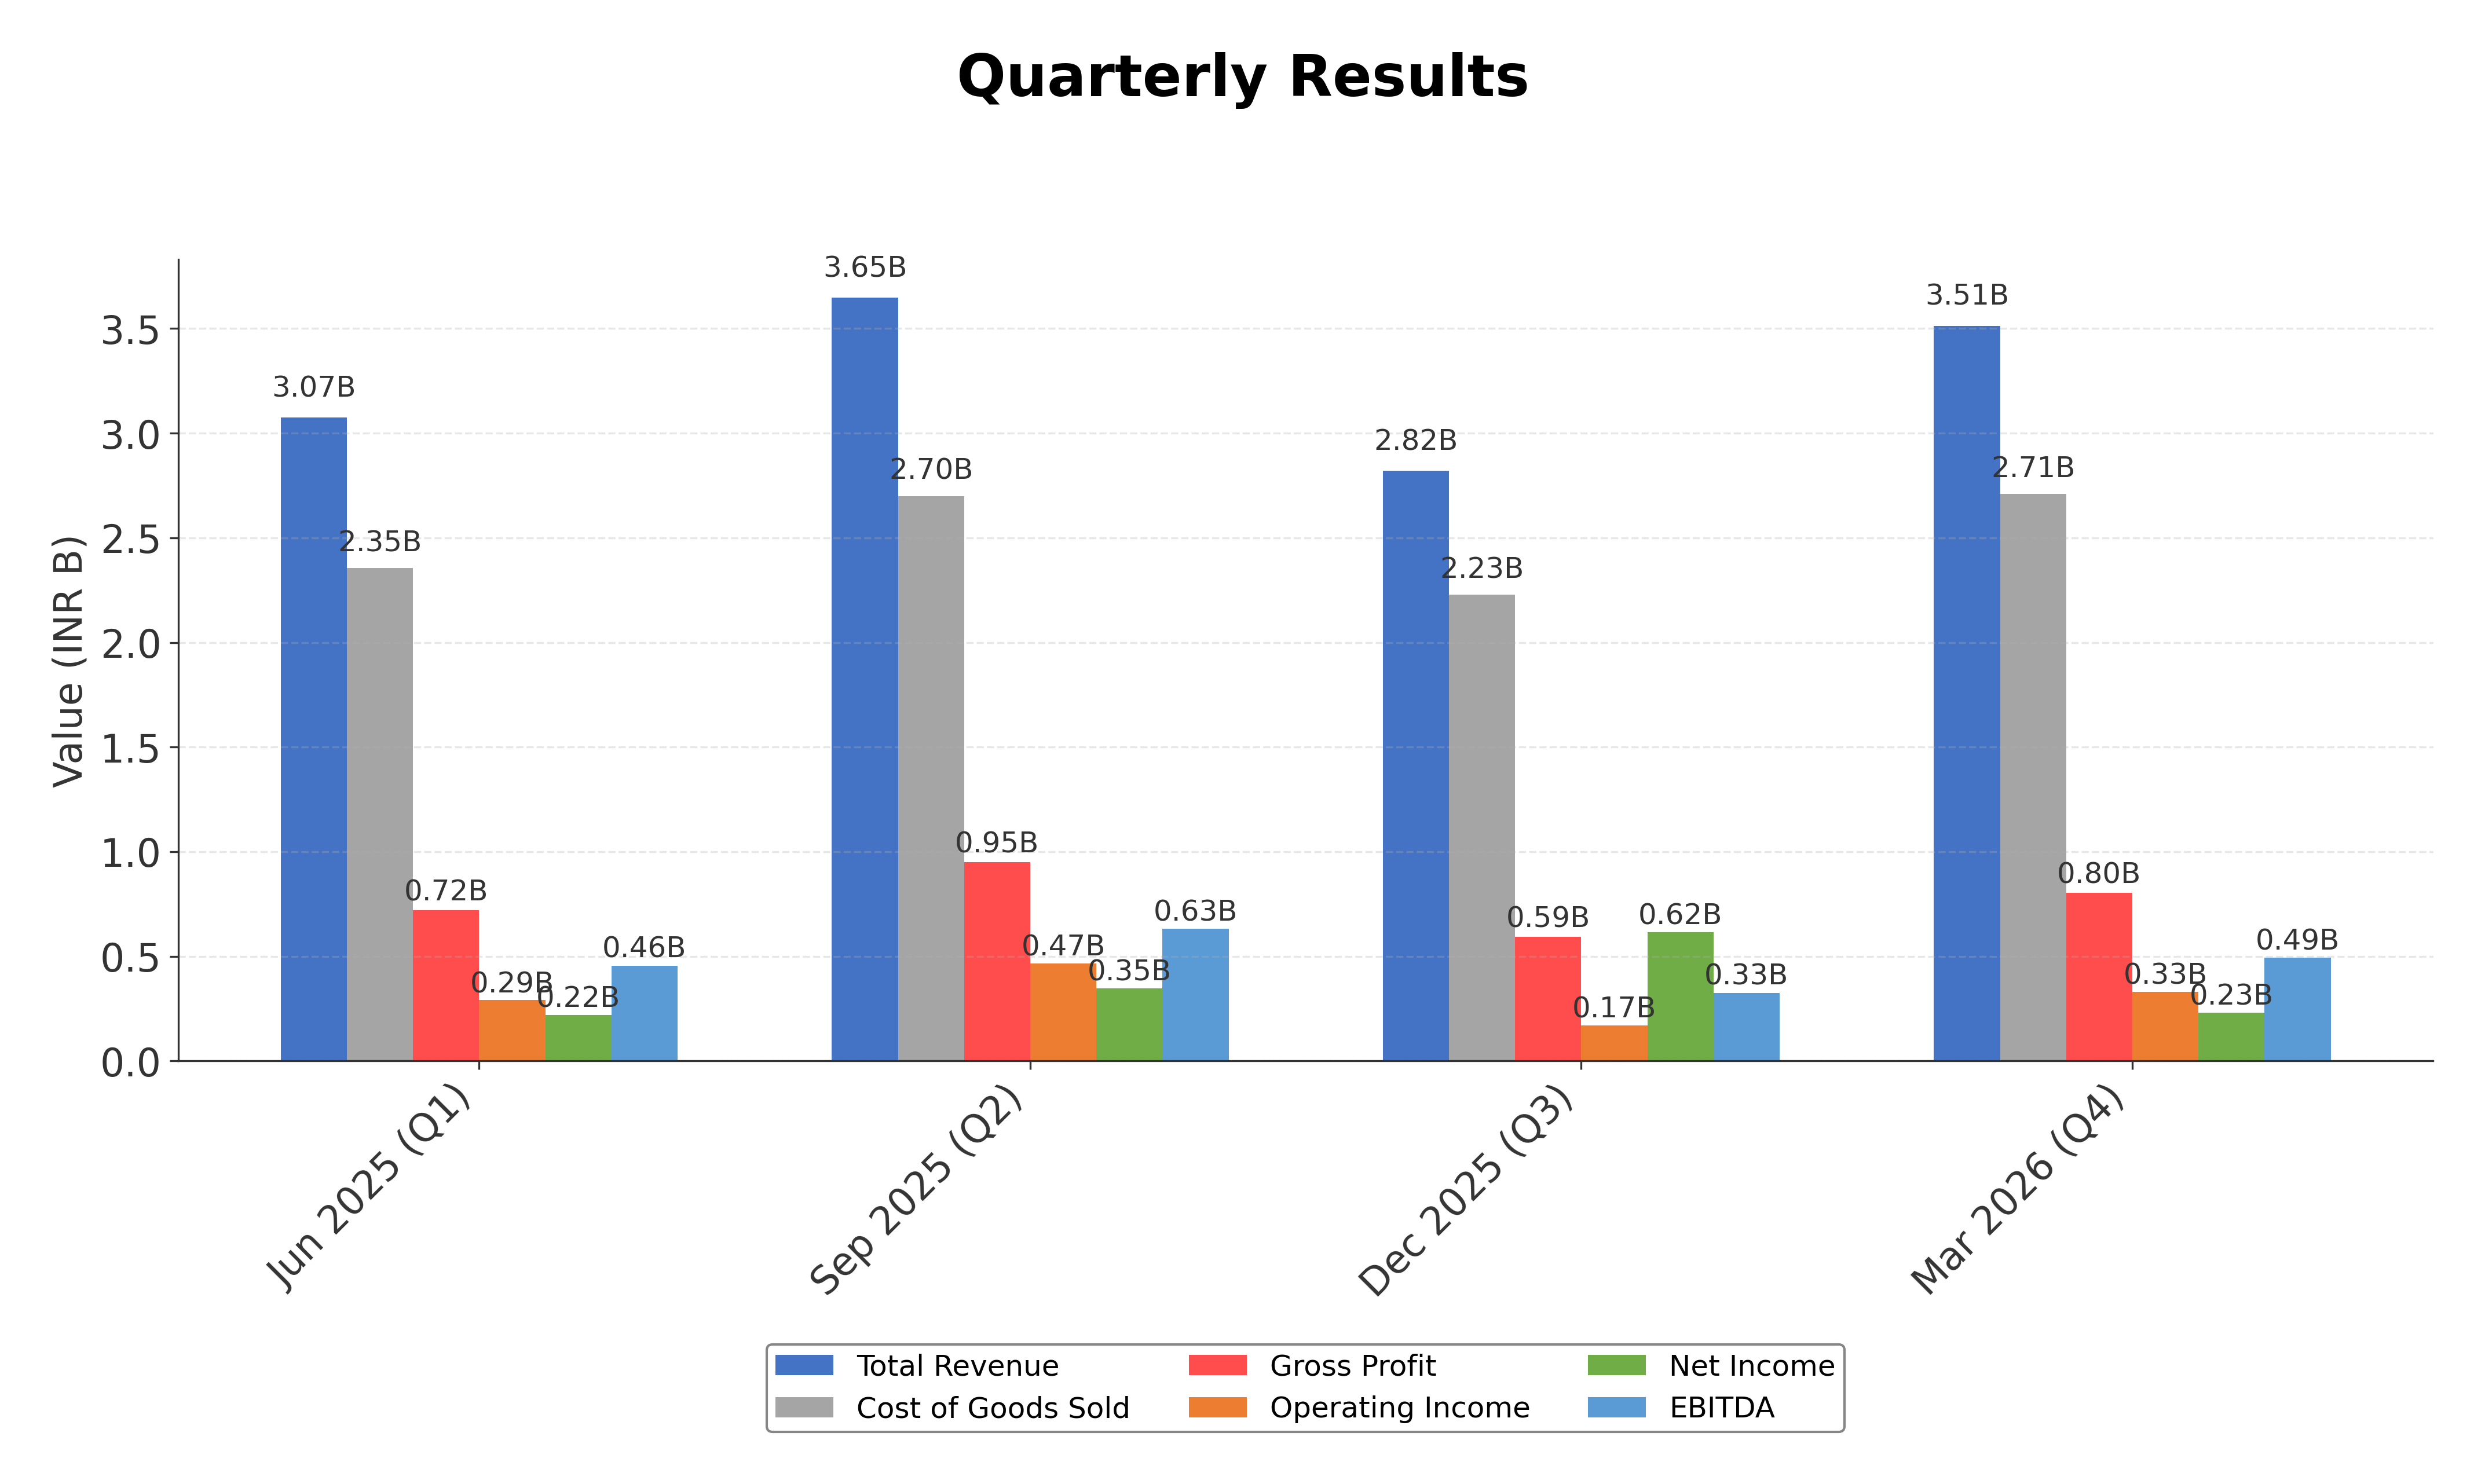
Summary: Indian Hume Pipe posted a 7.1% YoY rise in net profit to ₹235.69 lakh for Q1FY27, driven by higher other income and controlled finance costs. Operating revenue fell 1.5% to ₹3028.05 lakh, with the construction segment delivering steady pre-tax profits of ₹426.27 lakh.
Sentiment: positive
3. Headline: Techno Electric & Engineering Company Ltd. Share Price Falls
Summary: In the same-sector benchmark used ... that the stock is part of a large and diverse listed segment rather than a narrow corner of the market. The peer set supplied alongside the company mainly includes names classified under Engineering – Construction, such as Patel Engineering, Oriana Power, Interarch Building Products, Ramky Infrastructure, EMS and Indian Hume Pipe...
Sentiment: neutral
Summary: Hariom Pipe Share Price: Find the latest news on Hariom Pipe Stock Price. Get all the information on Hariom Pipe with historic price charts for NSE / BSE. Experts & Broker view also get the Hariom Pipe Ltd. buy/sell tips detailed news, announcements, Forecasts, Analysts, Valuation, Earning ...
Sentiment: neutral
Summary: Indo-MIM Share Price: Find the latest news on Indo-MIM Stock Price. Get all the information on Indo-MIM with historic price charts for NSE / BSE. Experts & Broker view also get the Indo-MIM Ltd. buy/sell tips detailed news, announcements, Forecasts, Analysts, Valuation, Earning forecasts, ...
Sentiment: neutral
Powered by Brave
Recent Updates
News Summary
As of August 14, 2026. Indian Hume Pipe Co. Ltd. reported a 7.53% increase in standalone net profit for the June 2026 quarter, underscoring improved profitability and operational efficiency despite a slight decline in operating revenue. The Q1 FY27 results showed net profit rising to ₹235.7 lakh, supported by higher other income and controlled finance costs. The construction segment remained the primary revenue driver, delivering steady pre-tax profits. Total assets expanded to ₹28.35 billion, reflecting growth in construction and real estate segment assets. At the 100th Annual General Meeting held in early August 2026, shareholders approved all resolutions, including the reappointment of a non-executive director and adoption of audited financials, indicating governance stability.
News Sentiment
The overall sentiment from recent updates is moderately positive, driven by steady earnings growth and operational resilience demonstrated in Q1 FY27 results. The increase in net profit and other income, alongside controlled expenses, supports a favorable financial performance narrative. Governance continuity reinforced by the successful AGM resolutions adds to the stable outlook. Neutral tones arise from minor revenue declines and sector-wide competitive pressures, but no significant negative developments were reported. The balanced sentiment reflects confidence in the company’s ongoing business fundamentals and prudent management.
Source List
Analytical Overview
Analysis Summary
Indian Hume Pipe’s trailing P/E of 13.81 is aligned with the industry average of 13.81, while the forward P/E of 15.95 suggests moderate earnings growth expectations relative to peers. The PEG ratio at 15.95 indicates valuation is somewhat elevated when factoring in growth.
Revenue growth of 4% year-over-year and positive quarterly earnings growth of 7.5% demonstrate a stable growth trajectory, supported by strong operating cash flow of ₹2.94 billion and free cash flow of ₹1.41 billion, indicating healthy cash generation.
The company maintains a conservative financial profile with a debt-to-equity ratio of 0.28 and a current ratio above 2.0, reflecting solid liquidity and manageable leverage levels.
Sector challenges include regulatory scrutiny and competitive pressures in infrastructure projects, while opportunities arise from ongoing government investments in water supply and sanitation infrastructure.
Considering the Indian market environment, regulatory frameworks and infrastructure development initiatives provide a supportive backdrop, while consumer demand for sustainable water management solutions drives potential growth.
Overall Business and Market Assessment
Supporting Factors: Key supporting factors include consistent profitability with net margins near 11%, strong cash flow generation, and stable governance evidenced by recent AGM outcomes. Risks to monitor involve potential regulatory changes and competitive dynamics in the engineering and construction sector. The company’s financial health and growth profile suggest suitability for medium to long-term consideration. Overall, the analysis reflects a balanced outlook with steady fundamentals tempered by sector-specific uncertainties.
Risk Factors: No data
SWOT Analysis
Strengths
- Established market presence with nearly a century of operational history.
- Strong balance sheet with low debt-to-equity ratio of 0.28 and current ratio above 2.0.
- Consistent profitability with net profit margin of approximately 10.9%.
- Robust cash flow generation supporting operational and strategic needs.
Weaknesses
- Limited institutional investor participation at 2.21%, potentially affecting liquidity.
- Moderate return on equity at 9.51% indicating room for efficiency improvements.
- Dependence on government infrastructure projects which may be subject to policy changes.
- Relatively high forward P/E ratio of 15.95 compared to trailing P/E.
Opportunities
- Growing demand for water supply and sanitation infrastructure in India.
- Increased government spending on rural and urban infrastructure projects.
- Potential expansion into related precast concrete product lines.
- Technological advancements enhancing product durability and installation efficiency.
Threats
- Regulatory changes impacting construction and environmental compliance.
- Competitive pressures from other engineering and construction firms.
- Macroeconomic factors affecting infrastructure investment cycles.
- Volatility in raw material costs impacting margins.
Company Description
Indian Hume Pipe Co. Ltd. is a leading player in the construction and infrastructure industry in India, specializing in water supply and sanitation. The company's primary function involves the manufacturing and installation of hume pipes, which are used in a variety of applications such as irrigation, drainage, and sewage systems. Notable for its durability and reliability, Indian Hume Pipe Co. Ltd. has been instrumental in supporting government projects and private sector initiatives, contributing significantly to the country's infrastructure development. Its products also include prestressed concrete pipes and other precast concrete materials, facilitating efficient water management solutions across rural and urban landscapes. Established in 1926, Indian Hume Pipe Co. Ltd. has a long-standing reputation, emphasizing innovation and quality in the construction services market. It plays a crucial role in addressing critical infrastructural needs, enhancing public health, and supporting sustainable development in India.