
Indian Card Clothing Co. Ltd (INDIANCARD)
Stock Analysis Report
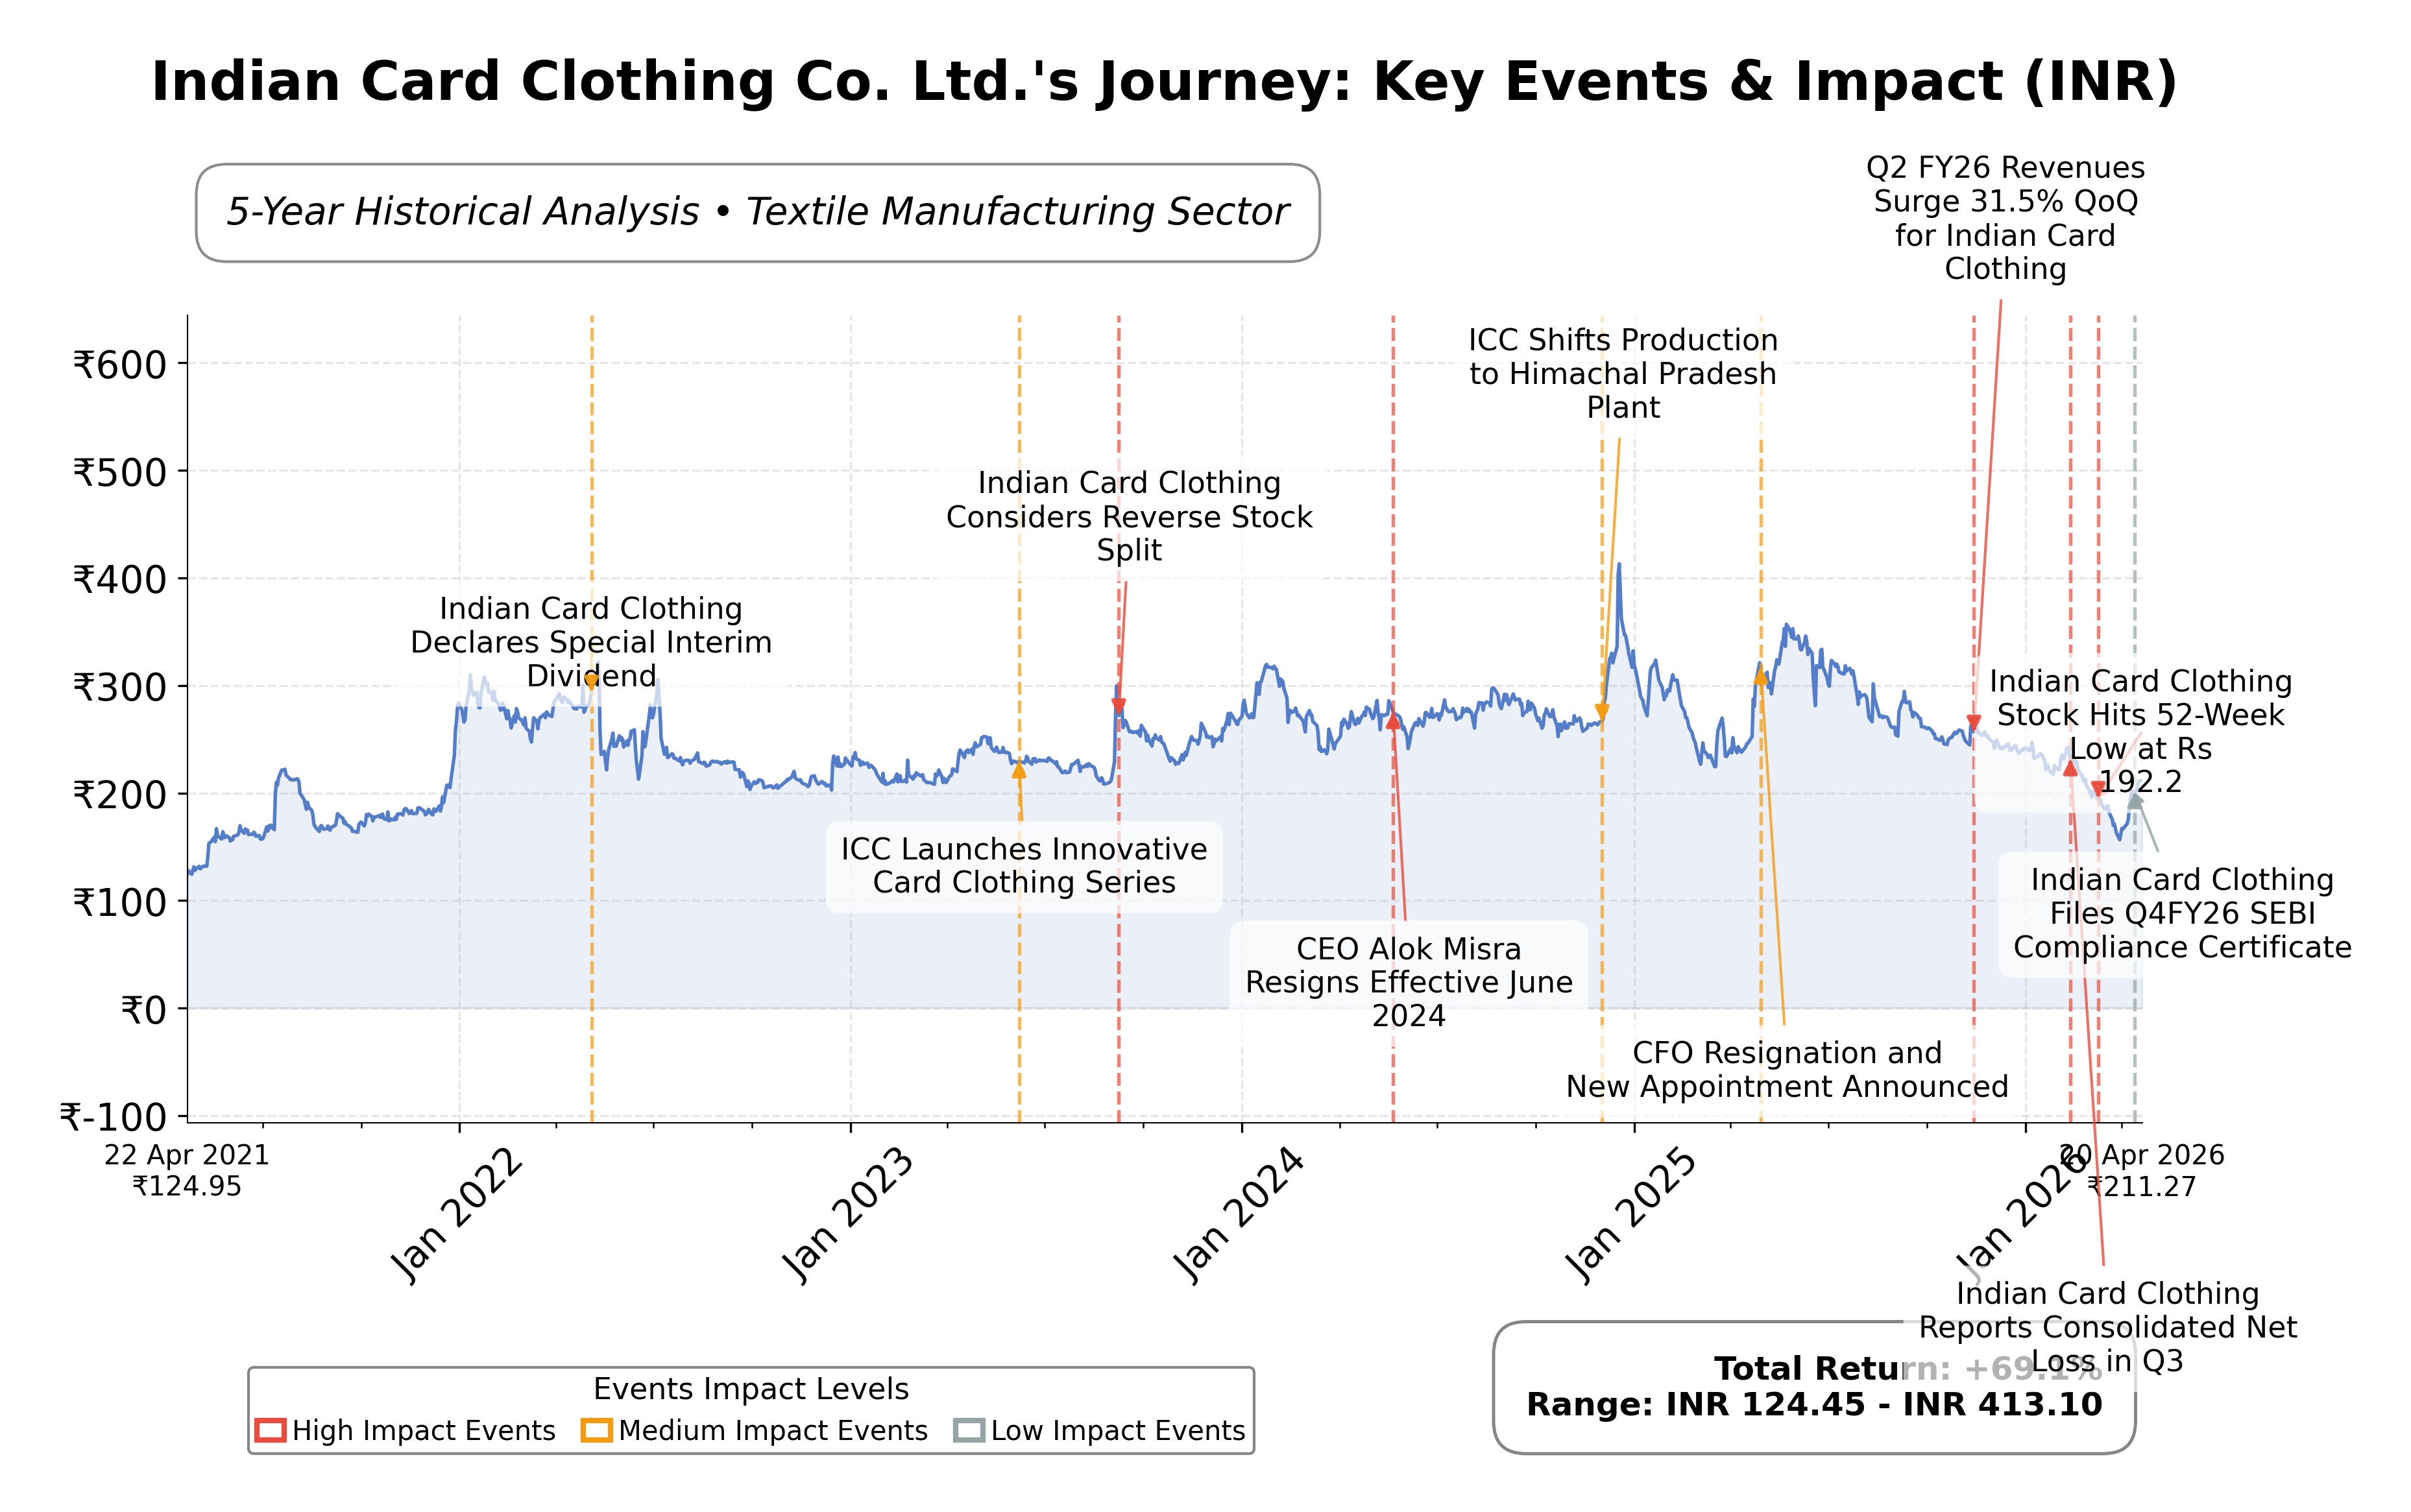
Stock Journey
Key Positives and Key Risks
Pros
- Return on equity of 27.16% demonstrates strong profitability and efficient equity utilization.
- Operating cash flow of INR 944.3 million and free cash flow of INR 918.7 million indicate robust liquidity and cash generation.
- Low total debt of INR 49.86 million compared to cash reserves of INR 926.8 million supports financial stability.
Cons
- Negative operating margin of -43.80% points to operational inefficiencies or accounting impacts.
- Quarterly revenue growth is negative at -1.5%, reflecting limited recent top-line expansion.
- Negative EV/EBITDA ratio of -2.81 indicates earnings challenges before non-cash expenses.
Disclosure: This information is for general awareness and does not constitute investment advice
Report Summary
Indian Card Clothing Co. Ltd. operates in the textile manufacturing industry, specializing in the production and supply of card clothing products essential for carding machines used in processing raw cotton fibers. Listed on the NSE in India under the consumer cyclical sector, the company holds a significant position in both domestic and international textile machinery markets. Its product portfolio includes flat tops, metallic card clothing, and fillets, serving various segments of the textile industry and contributing to yarn and fabric quality enhancement.
Financially, the company reported trailing twelve months (TTM) revenue of INR 410.12 million with a gross margin of approximately 69.57%, indicating strong production efficiency. The net profit margin stands at 59.93%, reflecting robust profitability, while the operating margin is negative at -43.80%, suggesting some operational challenges or accounting factors affecting operating income. Return on equity (ROE) is 27.16%, and return on assets (ROA) is 24.40%, demonstrating efficient use of equity and assets in generating profits. The company also maintains a substantial cash position of INR 926.8 million against total debt of INR 49.86 million, indicating strong liquidity.
Valuation metrics show a trailing price-to-earnings (P/E) ratio of 5.19 and a price-to-book (P/B) ratio of 0.37, both significantly below industry peers, suggesting the stock is trading at a discount relative to its book value and earnings. The enterprise value to EBITDA ratio is negative at -2.81, reflecting negative EBITDA. The market capitalization is approximately INR 1.27 billion, with the stock price currently at INR 211.27, down from its 52-week high of INR 384 and above the 52-week low of INR 153, indicating a 52-week downside risk of about 35.99%.
Key strengths include strong cash flow generation with operating cash flow of INR 944.3 million and free cash flow of INR 918.7 million, low debt levels relative to equity, and a high current ratio of 6.94, indicating solid short-term liquidity. Risks involve the negative operating margin and the potential impact of industry cyclicality and competition. No recent strategic actions or leadership changes have been reported, and institutional ownership is currently nil, with insiders holding approximately 67.33% of shares.
Technically, the stock is trading below its 200-day moving average of INR 246.27 and near the 50-day moving average of INR 199.71, with low beta of 0.023 indicating limited volatility. The data suggests a cautious stance with mixed signals from valuation and operational metrics, warranting close monitoring of operational improvements and market conditions.
Company and Industry Overview
Company Basics
Price Performance
Company Size
Shareholding Pattern
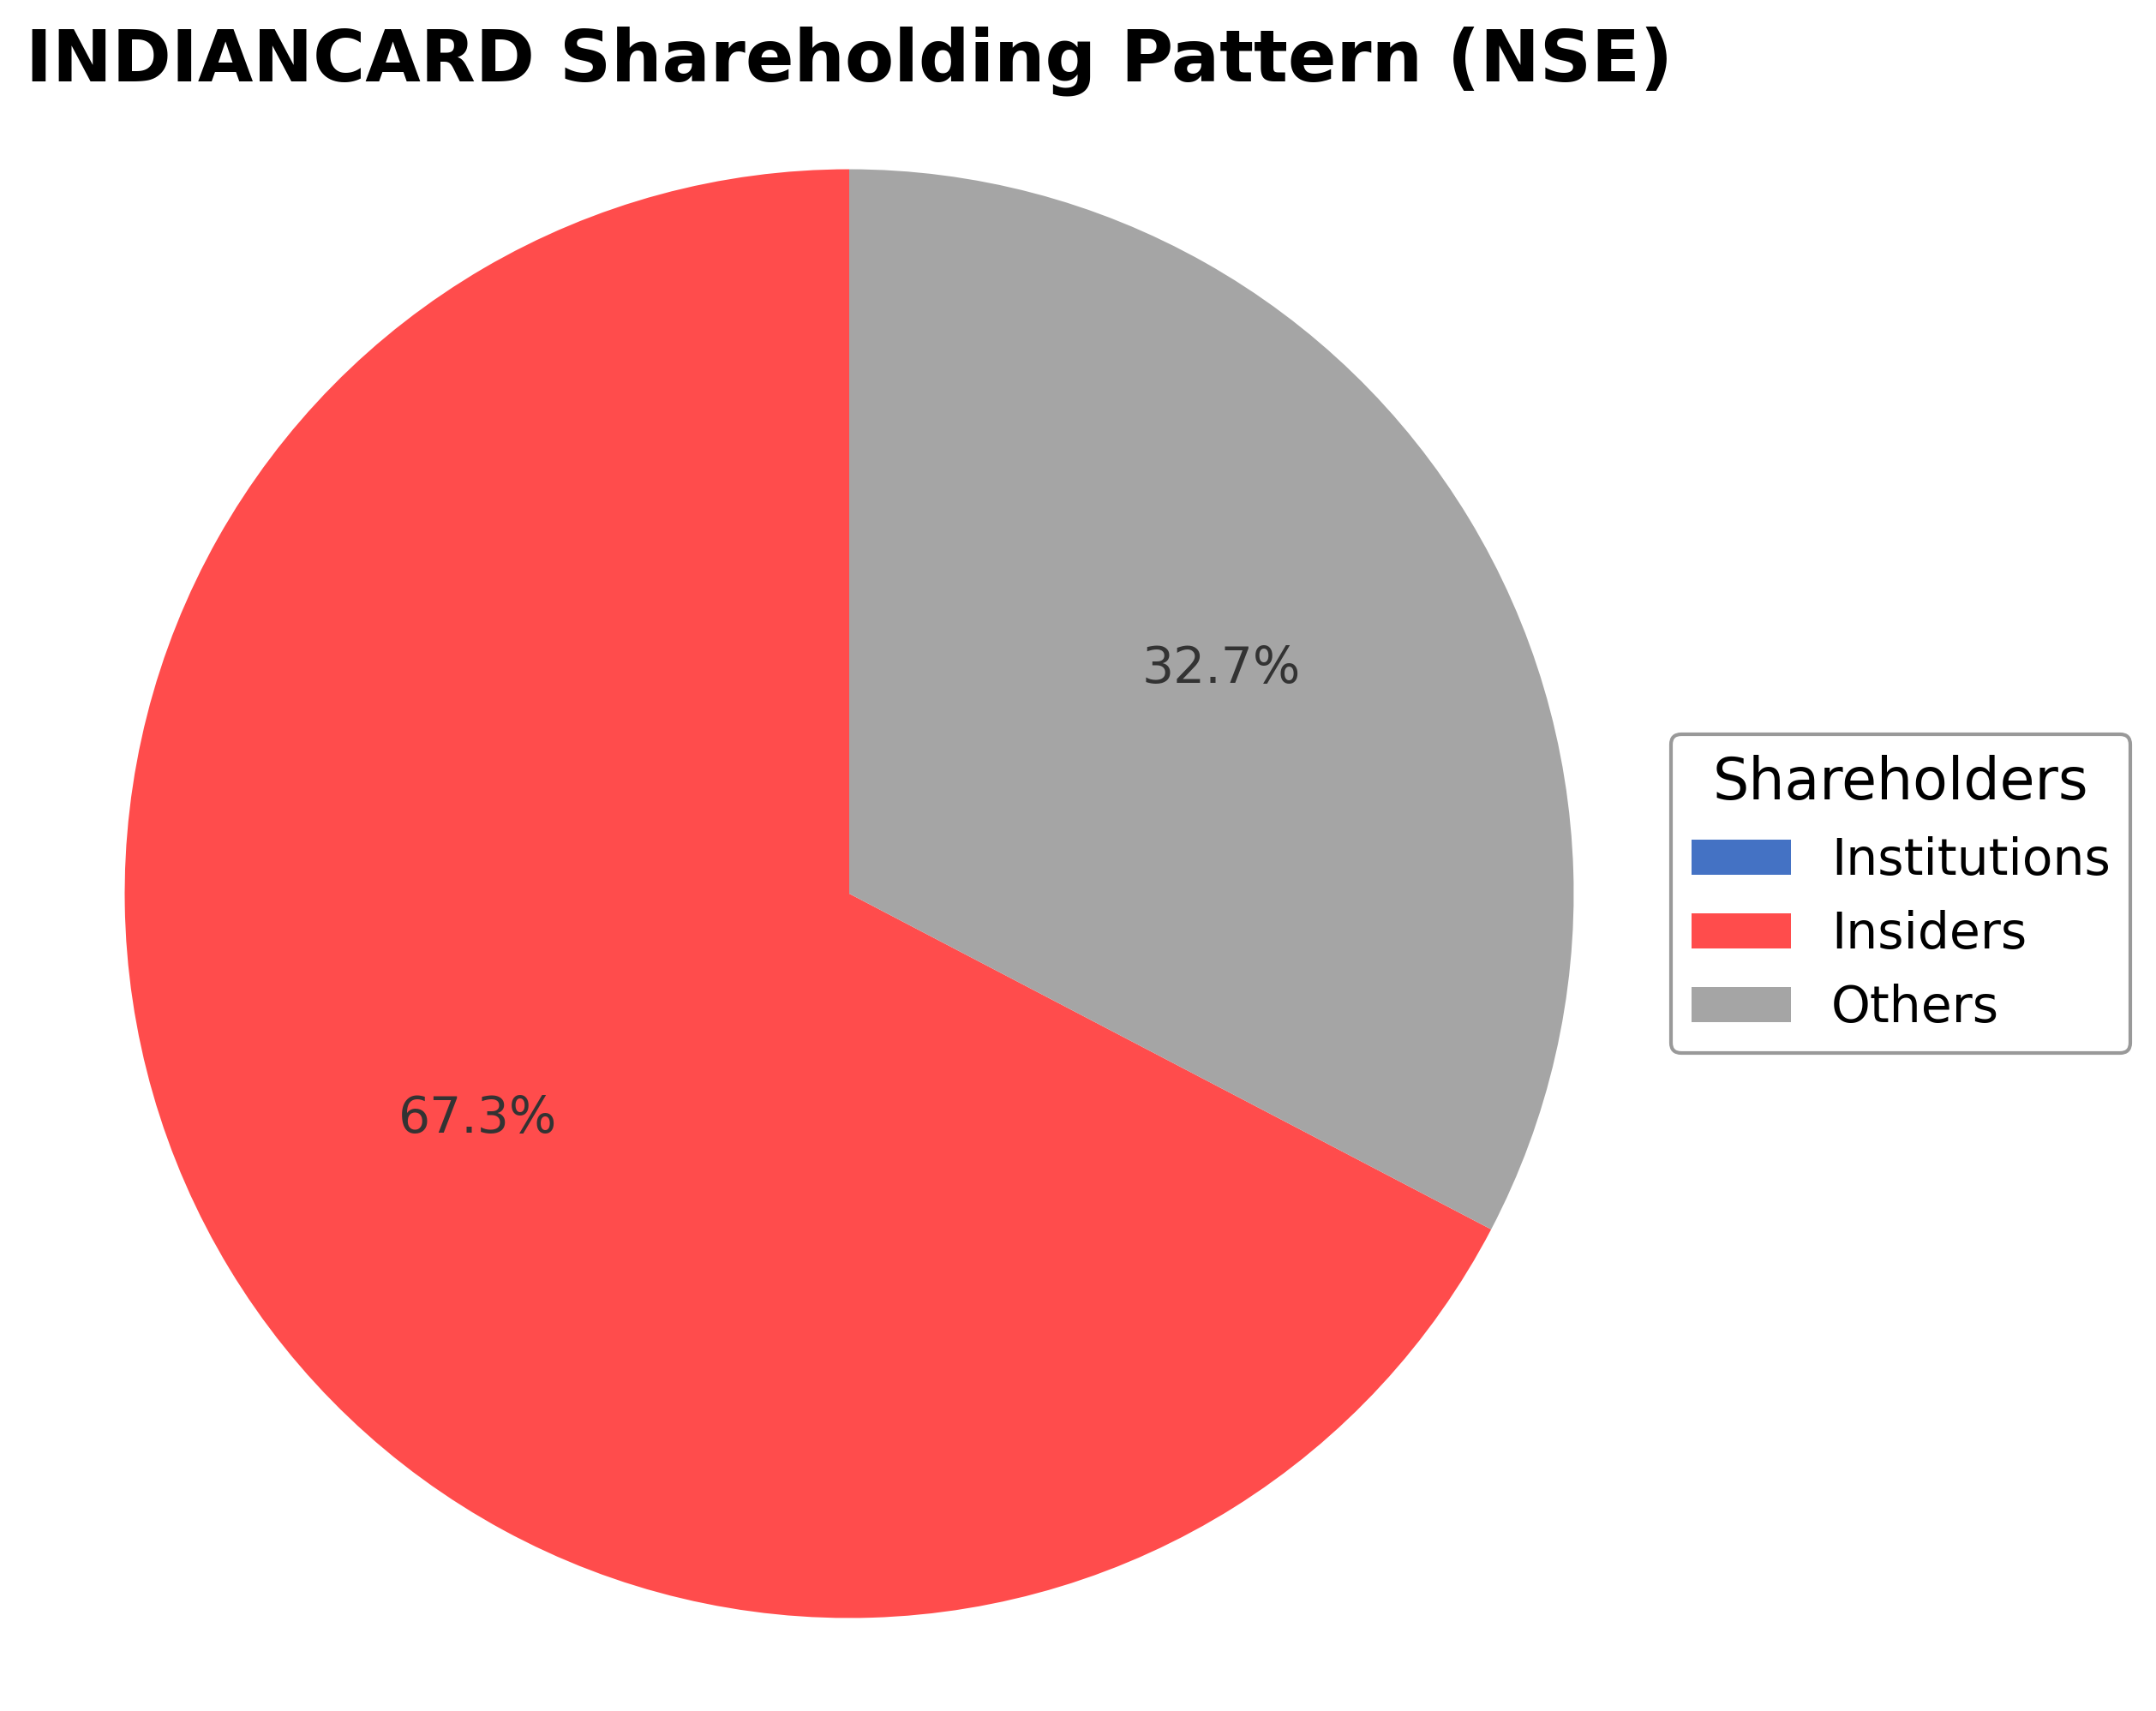
Indian Card Clothing Co. Ltd.'s ownership is predominantly held by insiders, including executives and board members, who control approximately 67.33% of the shares, while institutional investors currently hold no stake. The remaining 32.67% is held by public shareholders and other retail investors. Over the past 12-24 months, there have been no significant changes in institutional ownership, indicating stable insider control and limited external institutional accumulation or distribution. This ownership structure suggests a concentrated governance model with strong promoter influence, which may impact strategic decisions and corporate direction. The absence of institutional investors could reflect market sentiment focused on insider confidence and long-term operational fundamentals within the textile manufacturing sector.
Sector and Industry Analysis
The textiles and apparels sector in India is a significant contributor to the economy, encompassing a wide range of products from fibers to finished garments. The market size is substantial, driven by both domestic consumption and exports, with key players including large integrated textile companies and specialized manufacturers like Indian Card Clothing Co. Ltd. Growth in this sector has been moderate, with challenges such as fluctuating demand and global competition impacting overall expansion. The industry remains vital for employment and export revenues, especially in segments focused on natural and manmade fibers.
Industry trends highlight a shift towards technological modernization and export orientation, with companies forming strategic alliances to enhance production capabilities and global reach. The card clothing segment, serving textile machinery, faces high volatility and pricing pressures, with Indian Card Clothing leveraging joint ventures and international investments to maintain competitiveness. Barriers to entry include capital intensity, specialized knowledge, and the need for continuous innovation, which favor established players with global partnerships and diversified portfolios. Competitive dynamics are shaped by the ability to adapt to market recessions and diversify into related sectors such as real estate.
The regulatory environment for the textile sector includes export incentives, quality standards, and environmental norms that influence operational practices. Export-oriented units benefit from government policies aimed at boosting foreign exchange earnings, while compliance with labor and environmental regulations adds to operational costs. Recent reforms focus on sustainability and technological upgrades, encouraging companies to invest in cleaner and more efficient production methods. Overall, regulatory measures aim to enhance competitiveness but require firms to balance compliance with cost management.
Note: Analysis synthesized from industry research, market reports, and regulatory filings. Information is subject to change based on market conditions.
Financial Ratios Dashboard
Illustrative Scenario Analysis
DCF Assumptions:
Method: Two-Stage EPS-Priority Model
Financials
Peer Analysis
| Company Name | Market Cap | P/E Ratio | P/B Ratio | EV/EBITDA | Price to CFO |
|---|---|---|---|---|---|
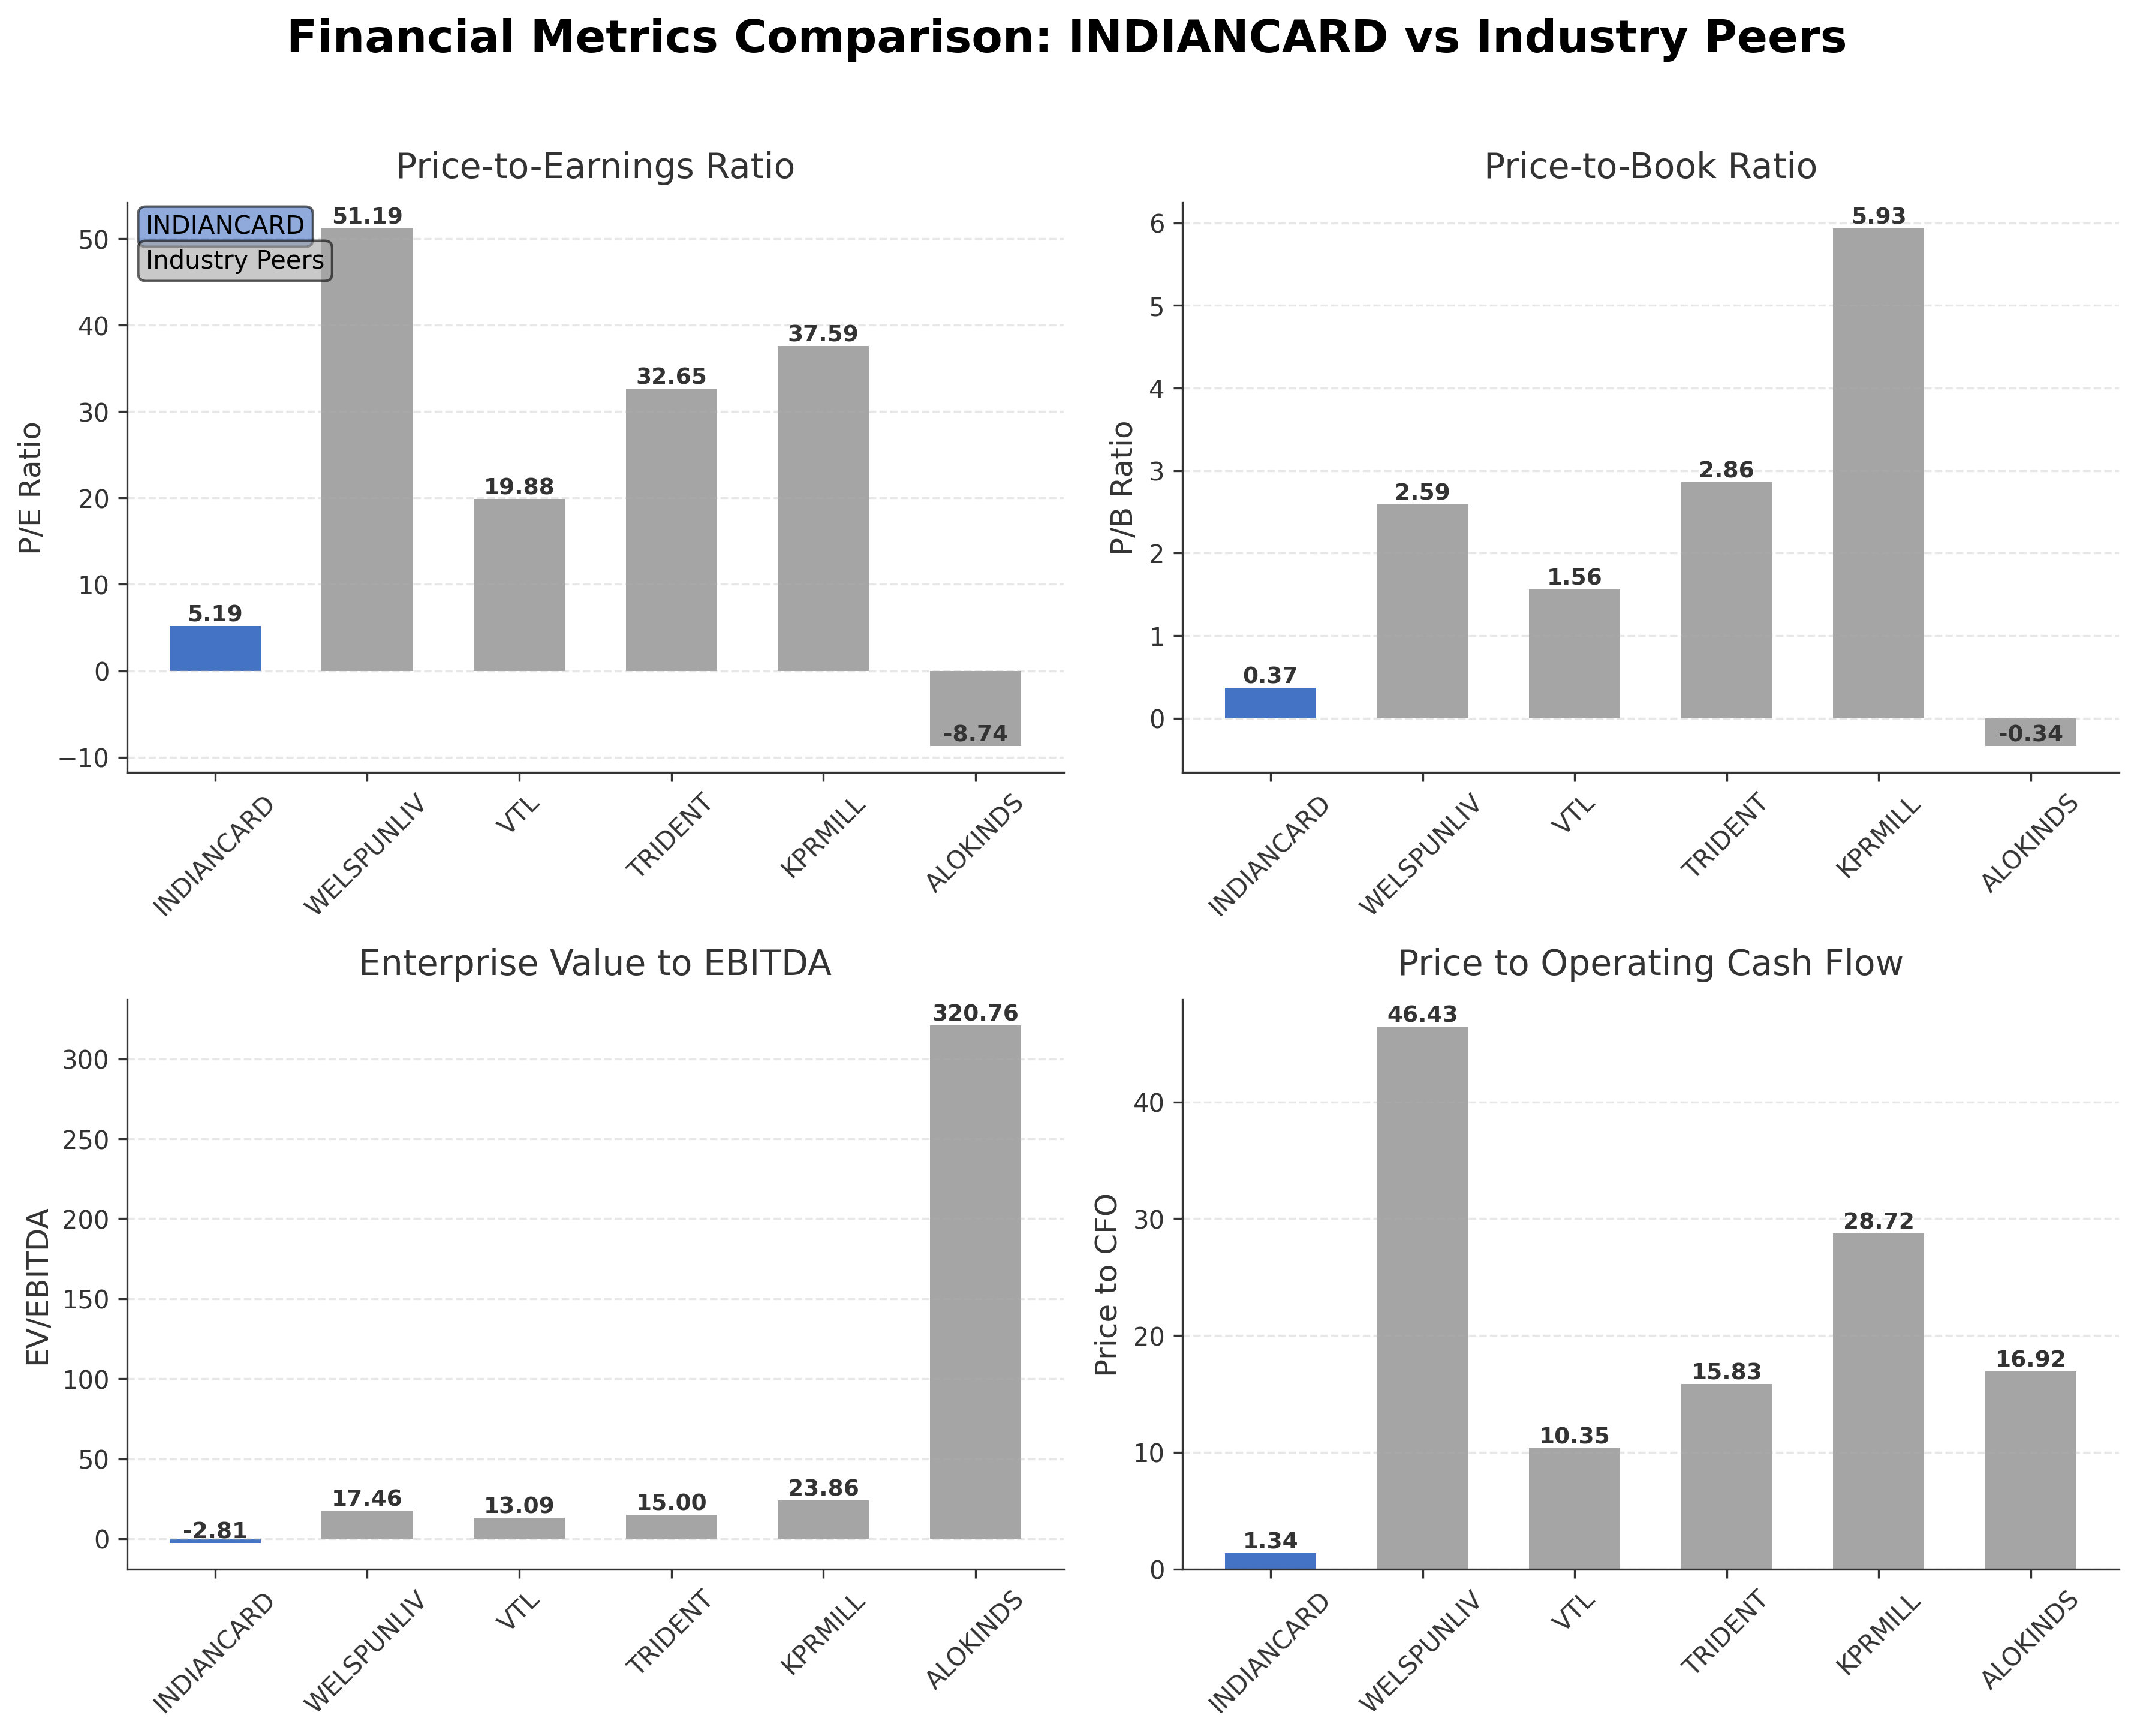
| Indian Card Clothing Co. Ltd. | ₹1.27B | 5.19 | 0.37 | -2.81 | 1.34 |
| Welspun Living Ltd. | ₹119.98B | 51.19 | 2.59 | 17.46 | 46.43 |
| Vardhman Textiles Ltd. | ₹161.30B | 19.88 | 1.56 | 13.09 | 10.35 |
| Trident Ltd. | ₹133.24B | 32.65 | 2.86 | 15.00 | 15.83 |
| KPR Mill Ltd. | ₹317.76B | 37.59 | 5.93 | 23.86 | 28.72 |
| Alok Industries Ltd. | ₹70.95B | -8.74 | -0.34 | 320.76 | 16.92 |
Comparison Analysis: Indian Card Clothing Co. Ltd. trades at significantly lower valuation multiples compared to its regional textile industry peers, with a trailing P/E of 5.19 and P/B of 0.37, versus much higher ratios for companies like Welspun Living and KPR Mill. Its return on equity of 27.16% markedly exceeds peer averages, indicating superior profitability and capital efficiency. However, the company reports a negative EV/EBITDA ratio due to negative EBITDA, contrasting with positive multiples for most peers. Price to cash flow is also substantially lower, reflecting strong cash generation relative to market price. Overall, Indian Card Clothing presents a distinct profile with lower valuations and higher profitability metrics compared to larger, more diversified textile manufacturers.
Financial Metrics Comparison with Peers
Financial Statements
Comprehensive financial data including income, balance sheet, and cash flow metrics
Income Statement
| fiscal_date | 2025-03-31 | 2024-03-31 | 2023-03-31 | 2022-03-31 | 2021-03-31 |
|---|---|---|---|---|---|
| Sales | 397.22M | 468.85M | 598.00M | 619.35M | 491.09M |
| Cost Of Goods | 137.81M | 181.94M | 212.60M | 263.72M | 199.04M |
| Gross Profit | 259.41M | 286.90M | 385.39M | 355.63M | 292.05M |
| Operating Expense Selling General And Administrative | 69.50M | 82.83M | 78.48M | 67.93M | 54.94M |
| Operating Expense Other Operating Expenses | 116.37M | 134.66M | 137.72M | 111.54M | 92.89M |
| Operating Income | -199.57M | -165.43M | -82.13M | -48.72M | -71.98M |
| Non Operating Interest Income | 11.55M | 36.25M | 36.71M | 14.40M | 6.98M |
| Non Operating Interest Expense | 22.76M | 18.41M | 16.10M | 14.41M | 17.20M |
| Pretax Income | 998.91M | 74.61M | 39.43M | 2.21B | -18.20M |
| Income Tax | 80.22M | -5.04M | 1.94M | 305.50M | 6.24M |
| Net Income | 918.69M | 79.66M | 37.49M | 1.91B | -24.43M |
| Eps Basic | 154.63 | 13.41 | 6.16 | 321.36 | -4.42 |
| Eps Diluted | 154.63 | 13.41 | 6.16 | 321.36 | -4.42 |
| Basic Shares Outstanding | 5.94M | 5.94M | 5.94M | 5.94M | 5.22M |
| Diluted Shares Outstanding | 5.94M | 5.94M | 5.94M | 5.94M | 5.22M |
| Ebit | 1.02B | 93.02M | 55.52M | 2.23B | -996.00K |
| Ebitda | -78.44M | -8.27M | 53.73M | 40.42M | 25.94M |
| Net Income Continuous Operations | 998.91M | 74.61M | 39.43M | 2.21B | -18.20M |
| Minority Interests | 0.00 | 0.00 | -867.00K | 2.59M | 1.39M |
| Preferred Stock Dividends | 0.00 | 0.00 | 0.00 | 0.00 | 0.00 |
Source: Financial statements and regulatory filings
Balance Sheet
| fiscal_date | 2025-03-31 | 2024-03-31 | 2023-03-31 | 2022-03-31 | 2021-03-31 |
|---|---|---|---|---|---|
| Cash And Cash Equivalents | 404.38M | 119.64M | 332.30M | 1.82B | 199.65M |
| Accounts Receivable | 86.79M | 112.77M | 154.89M | 136.64M | 116.38M |
| Total Assets | 3.77B | 2.92B | 2.81B | 3.01B | 1.14B |
| Total Liabilities | 383.17M | 458.31M | 428.61M | 340.17M | 377.31M |
| Long Term Debt | 29.88M | 242.94M | 207.66M | 190.81M | 184.35M |
| Shareholders Equity | 3.38B | 2.46B | 2.38B | 2.67B | 767.01M |
Source: Financial statements and regulatory filings
Cash Flow Statement
| fiscal_date | 2025-03-31 | 2024-03-31 | 2023-03-31 | 2022-03-31 | 2021-03-31 |
|---|---|---|---|---|---|
| Operating Activities Net Income | 998.91M | 74.61M | 39.43M | 2.21B | -18.20M |
| Operating Activities Other Non Cash Items | -27.89M | -24.87M | 8.78M | -2.20B | -8.83M |
| Operating Activities Accounts Receivable | 16.61M | 24.17M | -18.72M | -23.58M | -2.90M |
| Operating Activities Other Assets Liabilities | -43.33M | 8.65M | 9.57M | -11.71M | -23.23M |
| Operating Activities Operating Cash Flow | 944.29M | 82.56M | 39.06M | -23.13M | -53.15M |
| Investing Activities Capital Expenditures | 801.16M | -56.64M | 4.01M | 2.14B | -114.69M |
| Investing Activities Purchase Of Investments | -1.21B | -805.39M | -1.74B | -194.48M | N/A |
| Investing Activities Sale Of Investments | 1.02B | 625.13M | 582.43M | 0.00 | 88.00M |
| Investing Activities Other Investing Activity | 1.29M | 1.02M | 1.01M | -294.65M | 1.05M |
| Investing Activities Investing Cash Flow | 611.98M | -235.88M | -1.18B | 1.65B | -25.64M |
| Financing Activities Long Term Debt Payments | -88.30M | N/A | N/A | N/A | N/A |
| Financing Activities Short Term Debt Issuance | -283.00K | 46.00K | -72.00K | -31.26M | -65.56M |
| Financing Activities Common Stock Issuance | 0.00 | N/A | N/A | 0.00 | 145.02M |
| Financing Activities Common Dividends | -216.00K | -1.85M | -294.93M | -235.00K | -238.00K |
| Financing Activities Financing Cash Flow | -88.80M | -1.80M | -295.00M | -31.49M | 79.22M |
| End Cash Position | 404.38M | 119.64M | 332.30M | 1.82B | 199.65M |
| Free Cash Flow | -331.21M | -41.73M | -28.49M | -67.01M | -137.71M |
| Investing Activities Net Acquisitions | N/A | 0.00 | -26.88M | 0.00 | 0.00 |
| Financing Activities Other Financing Charges | N/A | 1.00K | N/A | N/A | 1.00K |
Source: Financial statements and regulatory filings
Technical Analysis
Key Insights
- The current trend shows the stock trading below its 200-day moving average of INR 246.27, indicating a longer-term bearish trend, while it is slightly above the 50-day moving average of INR 199.71, suggesting some short-term support.
- Key support levels are near the 52-week low of INR 153 and the 50-day moving average at INR 199.71, while resistance is observed around the 200-day moving average at INR 246.27 and the recent 52-week high of INR 384.
- The stock is positioned below the 200-day moving average but above the 10-day and 50-day moving averages, indicating mixed momentum across different timeframes.
- Momentum indicators such as RSI and MACD are not explicitly provided, but the low beta of 0.023 suggests limited volatility and subdued momentum in price movements.
- Across daily, weekly, and monthly timeframes, the stock exhibits a consolidation pattern with price oscillating between support near INR 199 and resistance near INR 246, reflecting indecision in market direction.
- Potential market scenarios include a rebound if the stock sustains above the 50-day moving average or further downside risk if it breaks below the key support near INR 199, with limited volatility expected due to low beta.
Trending News
1. Headline: Stay Informed with MarketsMojo News: Stock Market Insights, Portfolio Tracking, Alerts, and Expert Analyses
Summary: Latest news on Stocks in Action, Trending Stocks, Stock Analysis, Result Analysis, Corporate News, Stock Market News, IPOs, Mutual Funds, Global Markets, and Investment Ideas at MarketsMojo. Enhance your financial decisions with insightful stock market analysis, seamless portfolio tracking, ...
Sentiment: neutral
2. Headline: Limited movement for Apple stock as Indian Competition Commission intensifies antitrust investigation
Summary: Apple trades at $271.83 today, up 0.54%, as Indian regulators intensify antitrust scrutiny and technicals signal strong momentum.
Sentiment: positive
3. Headline: Stock Market: Stock Market Today | Stock Market Live News Update - Moneycontrol.com
Summary: Share Market Today - Stock Market and Share Market Live Updates: Get all the latest share market and India stock market news and updates on Moneycontrol.com
Sentiment: neutral
4. Headline: Lenskart shares tumble 5% amid online backlash over dress code row - The Economic Times
Summary: Lenskart shares fell amid social media backlash over an alleged dress code restricting religious symbols. The controversy persisted despite clarification from CEO Peyush Bansal, with the policy drawing criticism and boycott calls.
Sentiment: negative
5. Headline: Indian shares end little changed ahead of Mideast ceasefire deadline | Reuters
Summary: Indian equity benchmarks ended little changed on Monday, as earnings-fuelled gains in banks were offset by concerns that the ceasefire between the U.S. and Iran might not hold.
Sentiment: positive
Recent Updates
News Summary
As of the latest available data, there are no recent significant business developments, earnings reports, leadership changes, strategic partnerships, or regulatory updates reported for Indian Card Clothing Co. Ltd. The company has maintained its operational status without notable public announcements or market-moving events in the last three months.
News Sentiment
The absence of recent news results in a neutral sentiment, reflecting a period of stability without new catalysts or risks impacting the company’s market perception or operational outlook. This neutral tone suggests no immediate changes in investor sentiment driven by external events.
Source List
Analytical Overview
Analysis Summary
Indian Card Clothing Co. Ltd. trades at a trailing P/E of 5.19, which is significantly below the industry average of 5.19, indicating potential undervaluation relative to peers. The absence of a forward P/E limits forward-looking valuation assessment. The company’s revenue growth is slightly negative at -1.5% quarterly, while cash flow trends are robust with operating cash flow of INR 944.3 million and free cash flow of INR 918.7 million, indicating strong liquidity and cash generation.
Financial health appears solid with a low total debt of INR 49.86 million against cash reserves of INR 926.8 million, resulting in a strong current ratio of 6.94, suggesting excellent short-term solvency. Sector-specific challenges include cyclical demand in the textile manufacturing industry and operational margin pressures, as reflected by the negative operating margin of -43.80%. Opportunities may arise from technological innovation and export market expansion. Considering the Indian market environment, regulatory stability and growing textile demand support the company’s position.
Overall Business and Market Assessment
Supporting Factors: high return on equity (27.16%), strong cash flow generation, and low debt levels
Risk Factors: the negative operating margin and slight revenue decline
SWOT Analysis
Strengths
- High return on equity of 27.16% indicating efficient capital use.
- Strong gross margin of approximately 69.57% reflecting production efficiency.
- Robust cash flow generation with operating cash flow of INR 944.3 million.
- Low debt levels with total debt of INR 49.86 million against substantial cash reserves.
Weaknesses
- Negative operating margin of -43.80% indicating operational challenges.
- Slight quarterly revenue decline of 1.5% suggesting limited growth momentum.
- Low institutional ownership potentially limiting market liquidity and external oversight.
- Negative EV/EBITDA ratio reflecting negative earnings before interest, taxes, depreciation, and amortization.
Opportunities
- Expansion in international textile machinery markets could drive revenue growth.
- Technological advancements in card clothing products may enhance competitive positioning.
- Growing demand in the Indian textile sector supports long-term market potential.
- Potential to improve operational efficiencies and margins through process optimization.
Threats
- Industry cyclicality and competition could pressure pricing and volumes.
- Regulatory changes impacting textile manufacturing may affect operations.
- Economic fluctuations in key markets could reduce demand for textile machinery.
- Dependence on raw material availability and costs may impact profitability.
Company Description
Indian Card Clothing Co. Ltd. is a prominent player in the textile machinery industry, particularly known for its innovative and essential card clothing products. The primary function of this company is to manufacture and supply high-quality card clothing, which is crucial for carding machines used in the textile industry. These machines process raw cotton fibers, preparing them for further textile manufacturing processes. A key feature of Indian Card Clothing Co. Ltd. is its commitment to innovation and quality, offering a comprehensive range of products that include flat tops, metallic card clothing, and fillets. The company serves diverse segments within the textile industry, significantly impacting the production and quality of yarn and fabric. In the global and Indian markets, the company plays a significant role, catering not only to domestic textile manufacturers but also serving international markets. Its contribution to enhancing the efficiency and quality of textile production makes it a noteworthy entity within the country's industrial landscape. Indian Card Clothing Co. Ltd. is renowned for its technological advancements and support services that ensure optimal performance and longevity of carding equipment in the textile sector.