


ICICIBANK (ICICIBANK)
Stock Analysis Report
Stock Journey
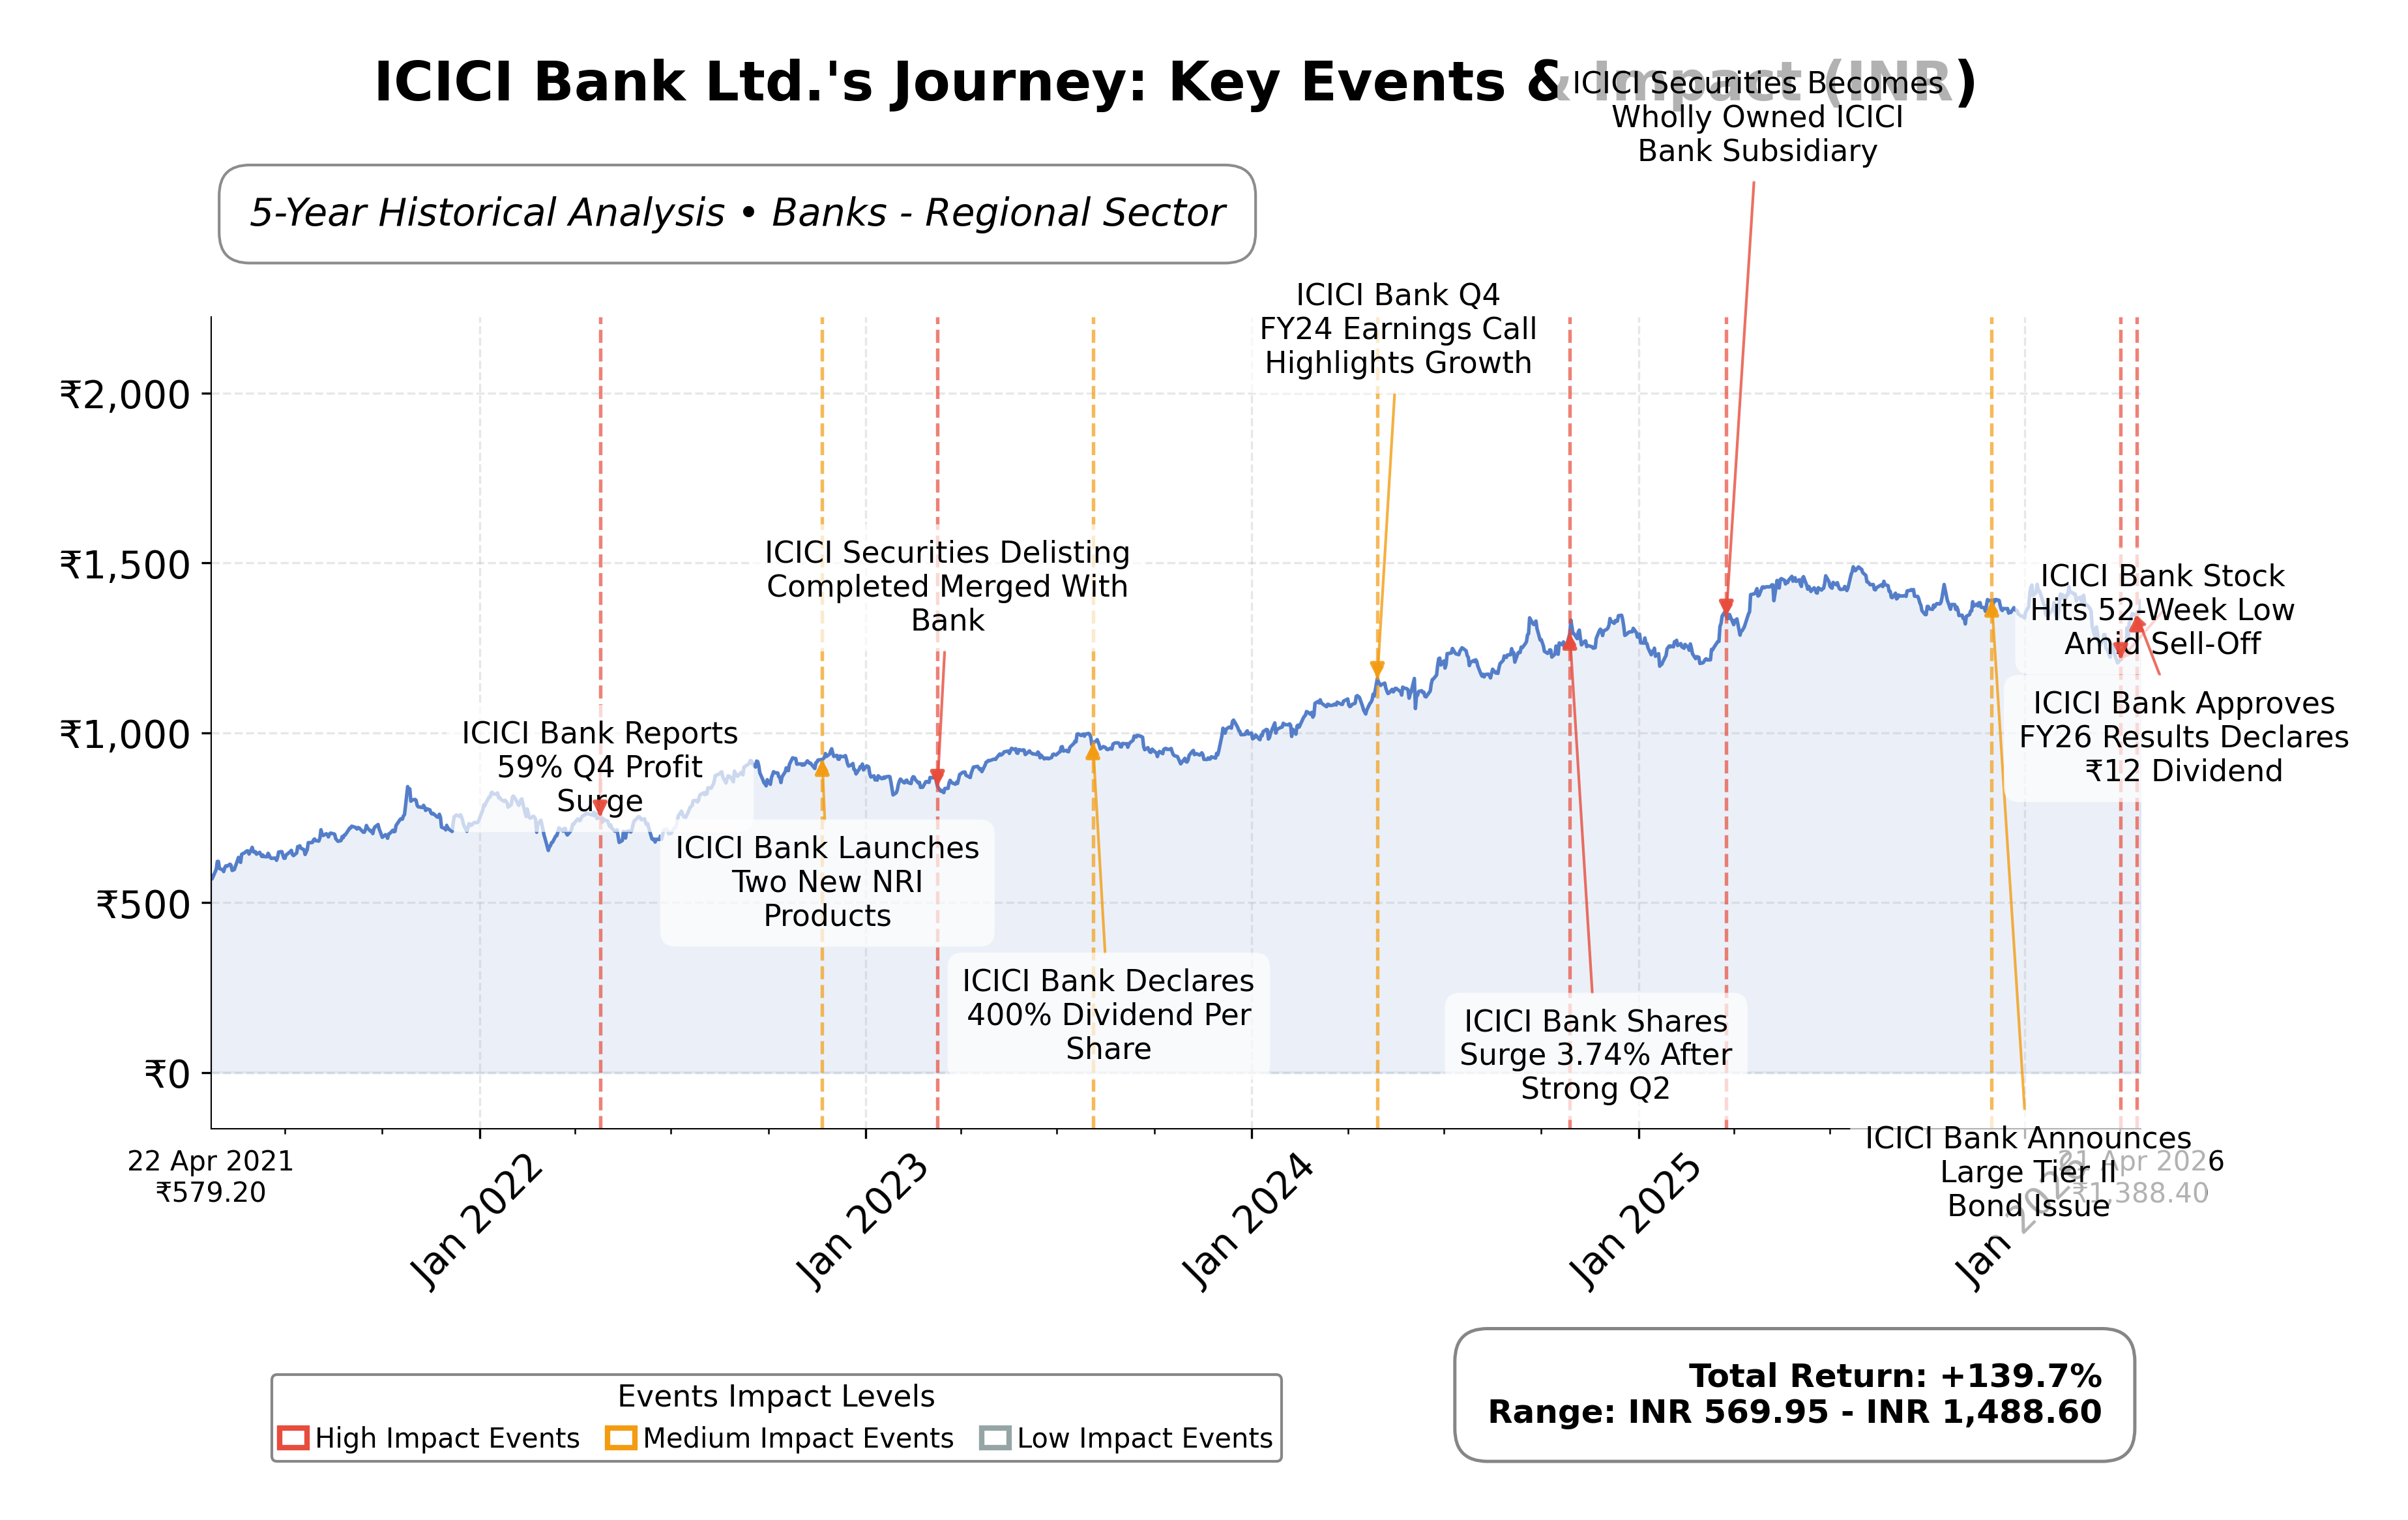
Key Positives and Key Risks
Pros
- Strong market capitalization of ₹9.64 trillion reflects significant scale and market presence.
- Robust return on equity of 16.8% indicates efficient use of shareholder capital.
- Operating cash flow of INR 3.05 trillion demonstrates strong cash generation capacity.
Cons
- Rising operating expenses increased by 12% year-on-year, potentially impacting margins.
- Credit card portfolio declined by 5.6%, signaling challenges in a key growth segment.
- Treasury loss of Rs 1.06 billion in the recent quarter negatively affected profitability.
Disclosure: This information is for general awareness and does not constitute investment advice
Report Summary
ICICI Bank Ltd. is a leading private sector bank in India, operating primarily in the financial services sector and listed on the NSE. The bank offers a wide range of banking and financial products including retail banking, corporate finance, investment banking, insurance, and treasury services. It serves diverse customer segments such as individuals, businesses, corporates, and NRIs, leveraging an extensive branch network and digital platforms. The bank's core business segments include retail banking, wholesale banking, treasury, and other banking activities, positioning it as a comprehensive financial services provider in the regional banking industry.
Financially, ICICI Bank reported trailing twelve months (TTM) revenue of approximately INR 1.92 trillion with a profit margin of 27.5%, operating margin of 33.97%, and net income of INR 529.5 billion. The bank’s return on equity (ROE) stands at 16.8%, and return on assets (ROA) at 2.14%, indicating efficient use of equity and assets to generate profits. The operating cash flow over the past twelve months was INR 3.05 trillion, with a levered free cash flow of INR 510 billion, reflecting strong cash generation capabilities. The bank maintains a total debt to equity ratio of 0.59, suggesting a moderate leverage position.
Valuation metrics show a trailing P/E ratio of 18.38 and a forward P/E of 14.86, with a price-to-book ratio of 2.76. The market capitalization is approximately INR 9.64 trillion, with an enterprise value of INR 10.16 trillion. The stock price currently trades at INR 1,367.60, within a 52-week range of INR 1,187.60 to INR 1,500, representing a downside risk of about 9.7% from the 52-week high. The valuation ratios suggest the stock is priced moderately relative to its fundamentals and industry peers.
ICICI Bank’s strengths include robust deposit growth of 11.4% year-on-year, a healthy retail loan portfolio growth of 9.5%, and improved asset quality with a net NPA ratio of 0.33%. The bank benefits from strong operating cash flows and a diversified business model. Key risks involve rising operating expenses, a decline in the credit card portfolio by 5.6%, and a treasury loss impacting quarterly profitability. Recent strategic actions include digital banking initiatives and fresh stakes acquisition by the ICICI Group worth ₹5,300 crore in Q4 FY26, reflecting active portfolio management and growth focus.
Technically, the stock is trading below its 200-day moving average of INR 1,374.79 but above the 50-day moving average of INR 1,319.69, indicating mixed momentum. Momentum indicators show moderate strength, and multi-timeframe analysis suggests consolidation with potential for volatility. Recent news and earnings updates highlight steady profit growth and operational improvements, suggesting a balanced outlook where market participants may consider monitoring developments closely for directional cues.
Company and Industry Overview
Company Basics
Price Performance
Company Size
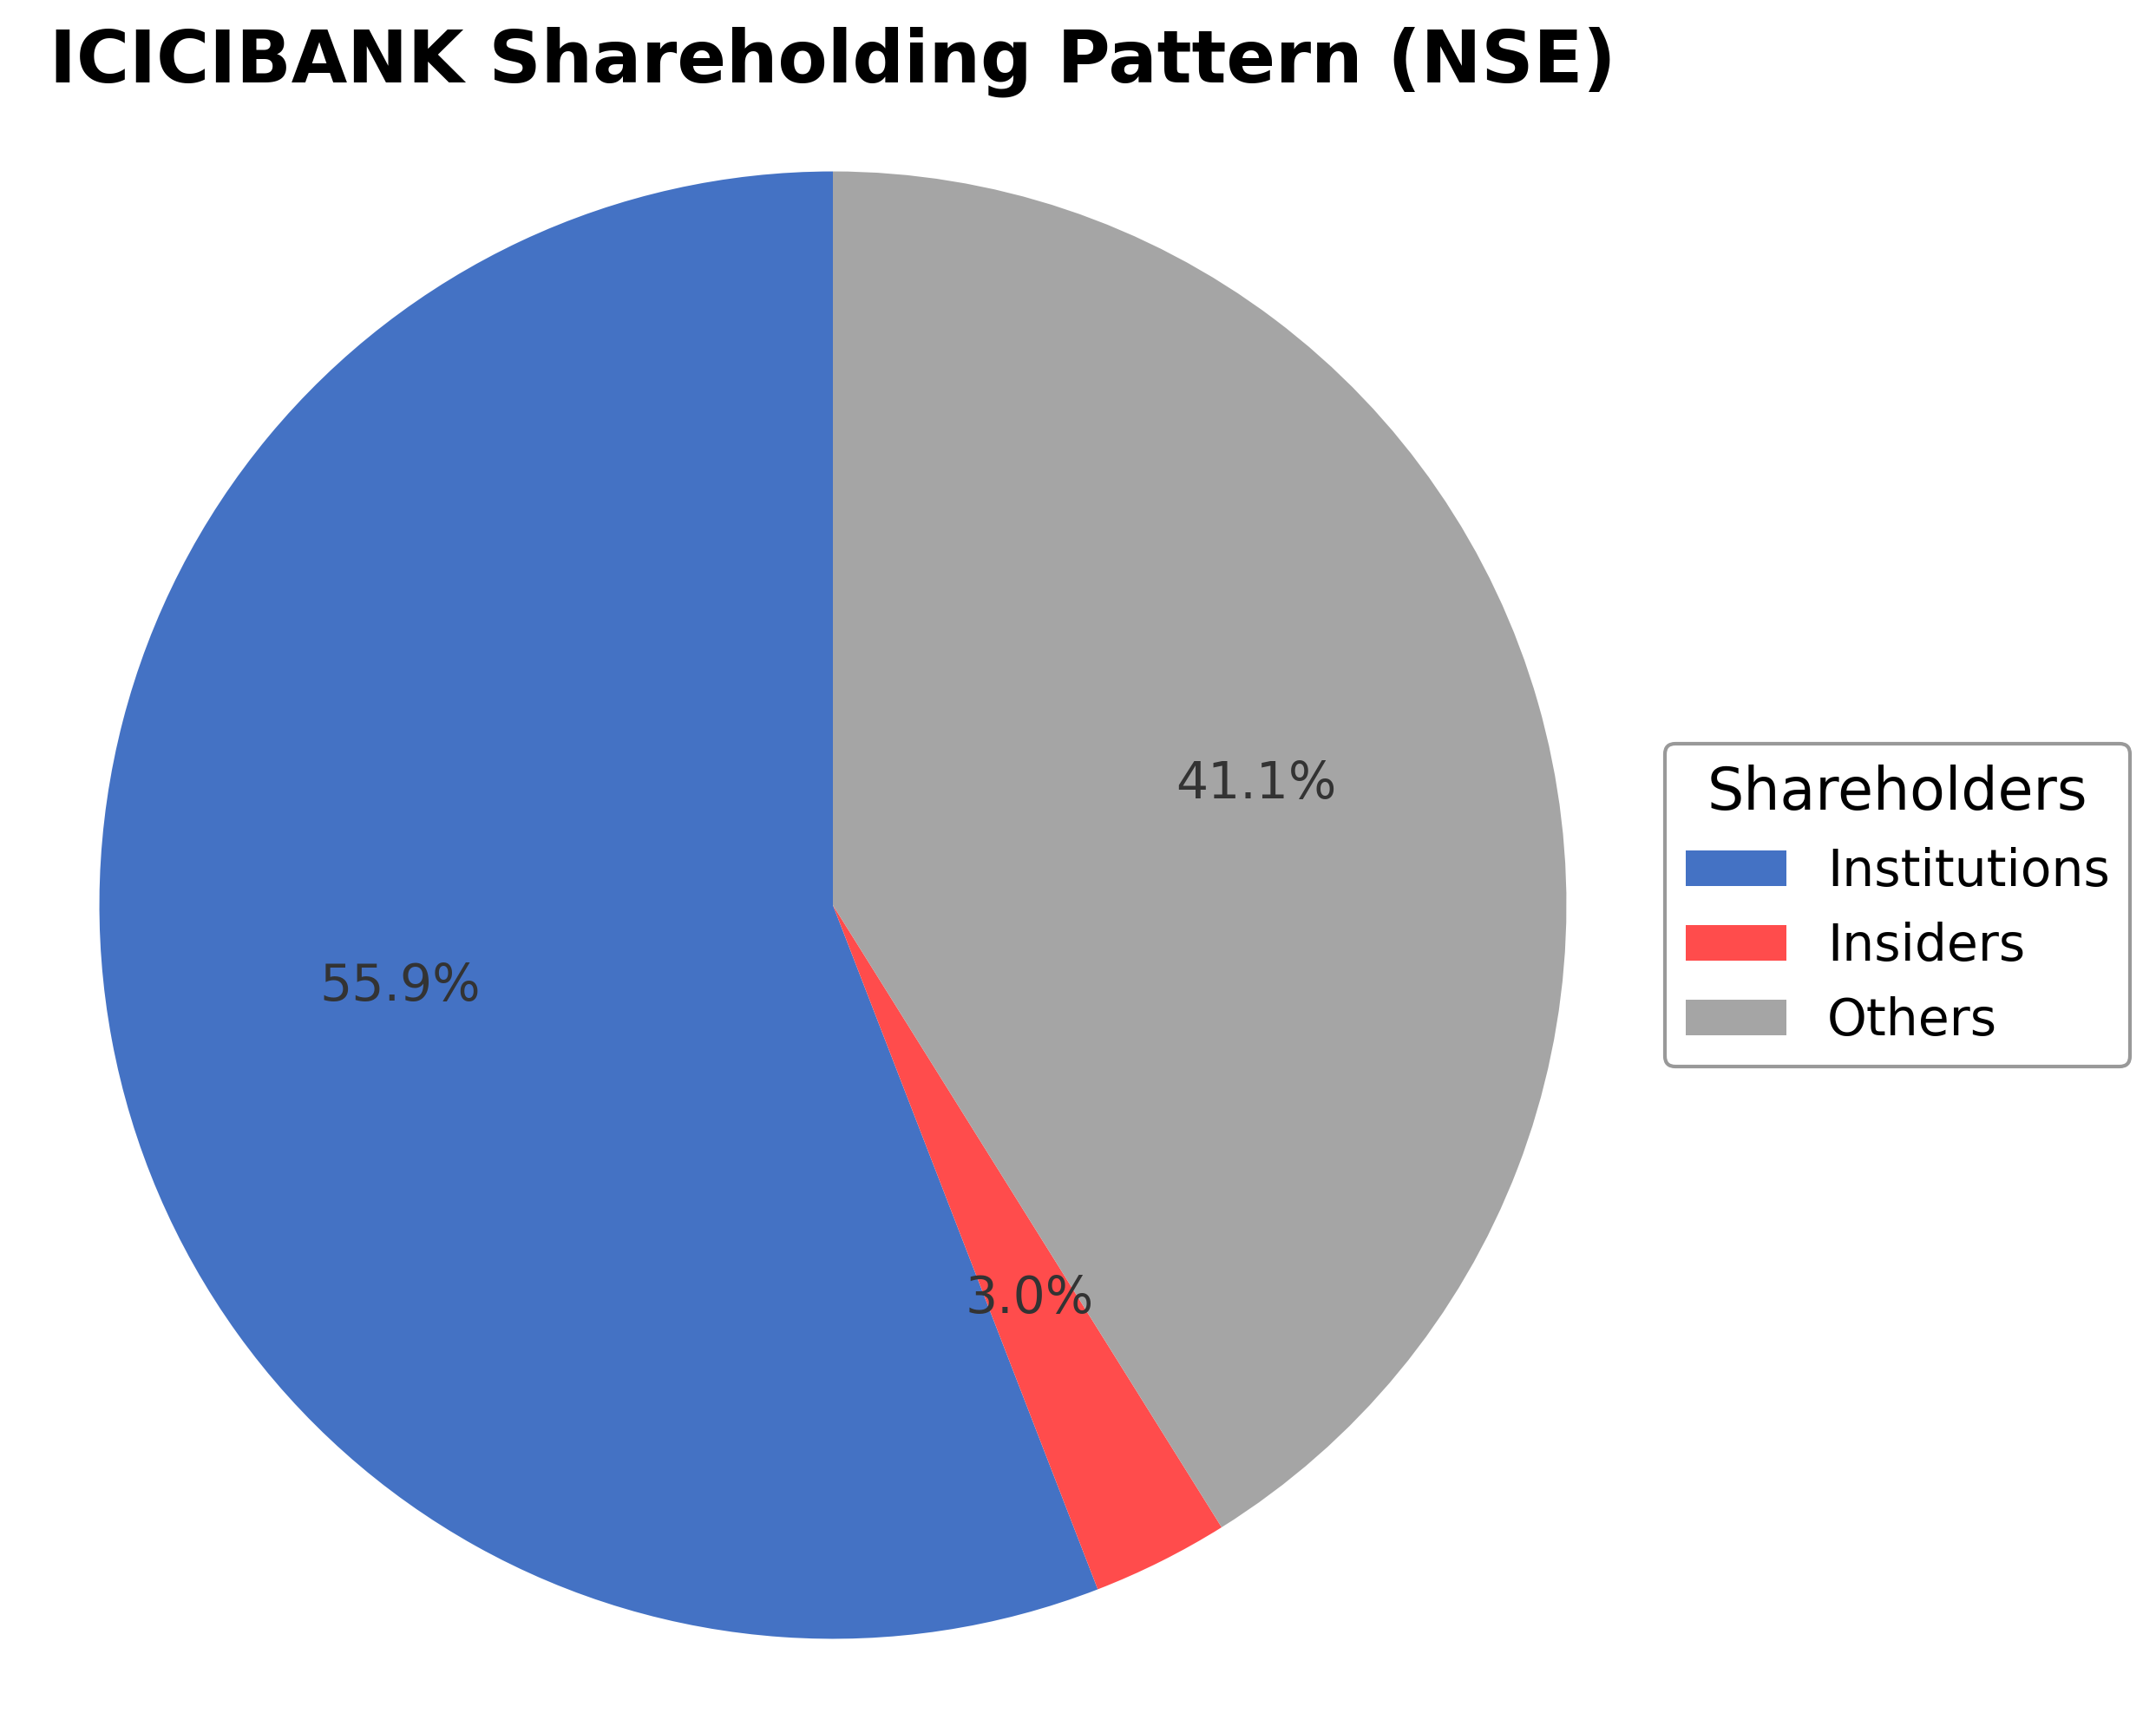
Shareholding Pattern
Sector and Industry Analysis
The Indian banking sector is one of the largest and fastest-growing financial markets globally, driven by a rising middle class, increasing digital adoption, and expanding credit demand. It encompasses a diverse range of institutions including public sector banks, private sector banks, and foreign banks, with key players such as ICICI Bank, HDFC Bank, and State Bank of India dominating market share. The sector has witnessed steady growth supported by economic expansion and rising financial inclusion initiatives.
Industry trends highlight a shift towards digital banking, with significant investments in technology to enhance customer experience and operational efficiency. Competition is intensifying as new entrants leverage fintech innovations, while established banks focus on expanding their retail and corporate lending portfolios. Barriers to entry remain high due to regulatory requirements, capital adequacy norms, and the need for extensive branch networks and technology infrastructure.
The regulatory environment is shaped primarily by the Reserve Bank of India, which maintains a neutral monetary policy stance with stable policy rates to support growth while managing inflation. Recent measures emphasize liquidity management, credit growth, and financial stability, impacting banks’ lending and deposit rates. Ongoing regulatory oversight aims to balance economic growth with risk mitigation, influencing strategic decisions within the banking industry.
Note: Analysis synthesized from industry research, market reports, and regulatory filings. Information is subject to change based on market conditions.
Financial Ratios Dashboard
Illustrative Scenario Analysis
DCF Assumptions:
Method: Two-Stage EPS-Priority Model
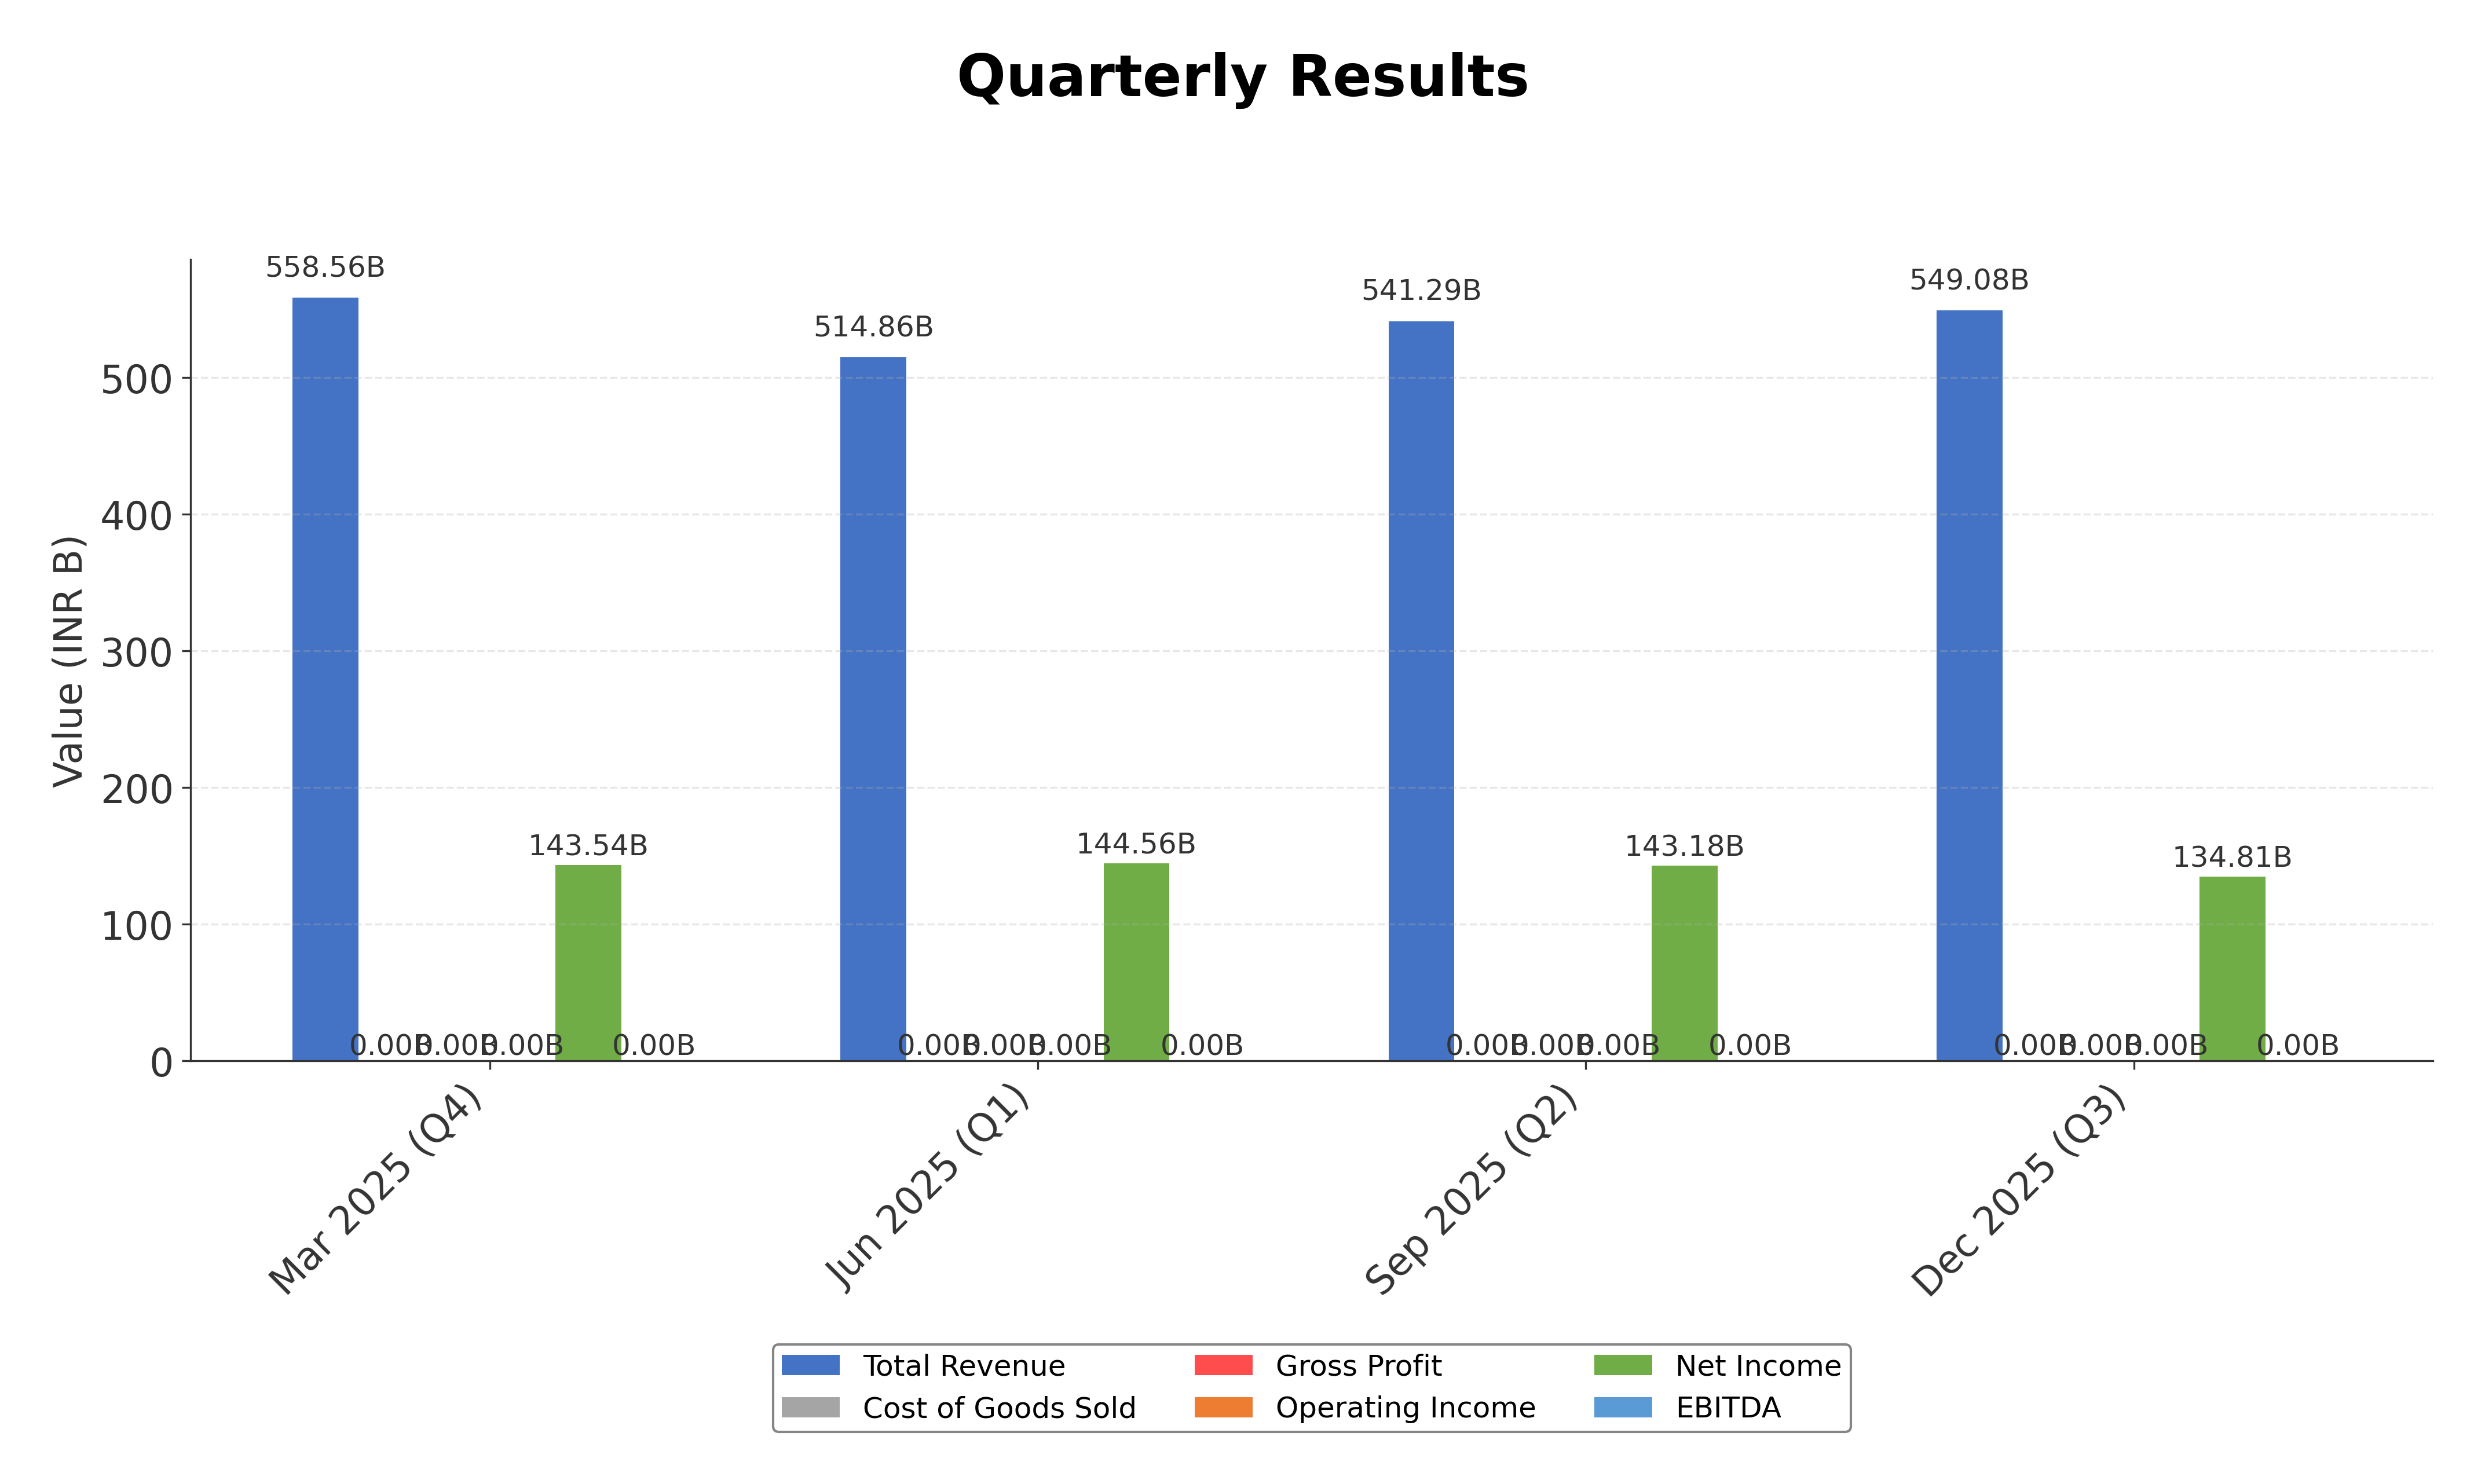
Financials
Peer Analysis
| Company Name | Market Cap | P/E Ratio | P/B Ratio | EV/EBITDA | Price to CFO |
|---|---|---|---|---|---|
| ICICI Bank Ltd. | ₹9.64T | 18.38 | 2.76 | N/A | 3.16 |
| State Bank of India | ₹9.97T | 11.76 | 1.68 | N/A | 5.13 |
| Indian Overseas Bank | ₹673.21B | 14.21 | 1.97 | N/A | 20.95 |
| AU Small Finance Bank Ltd. | ₹740.16B | 32.16 | 4.03 | N/A | 49.25 |
| Canara Bank | ₹1.29T | 6.33 | 1.09 | N/A | 5.27 |
| Karur Vysya Bank Ltd. | ₹268.29B | 11.67 | 2.10 | N/A | 12.61 |
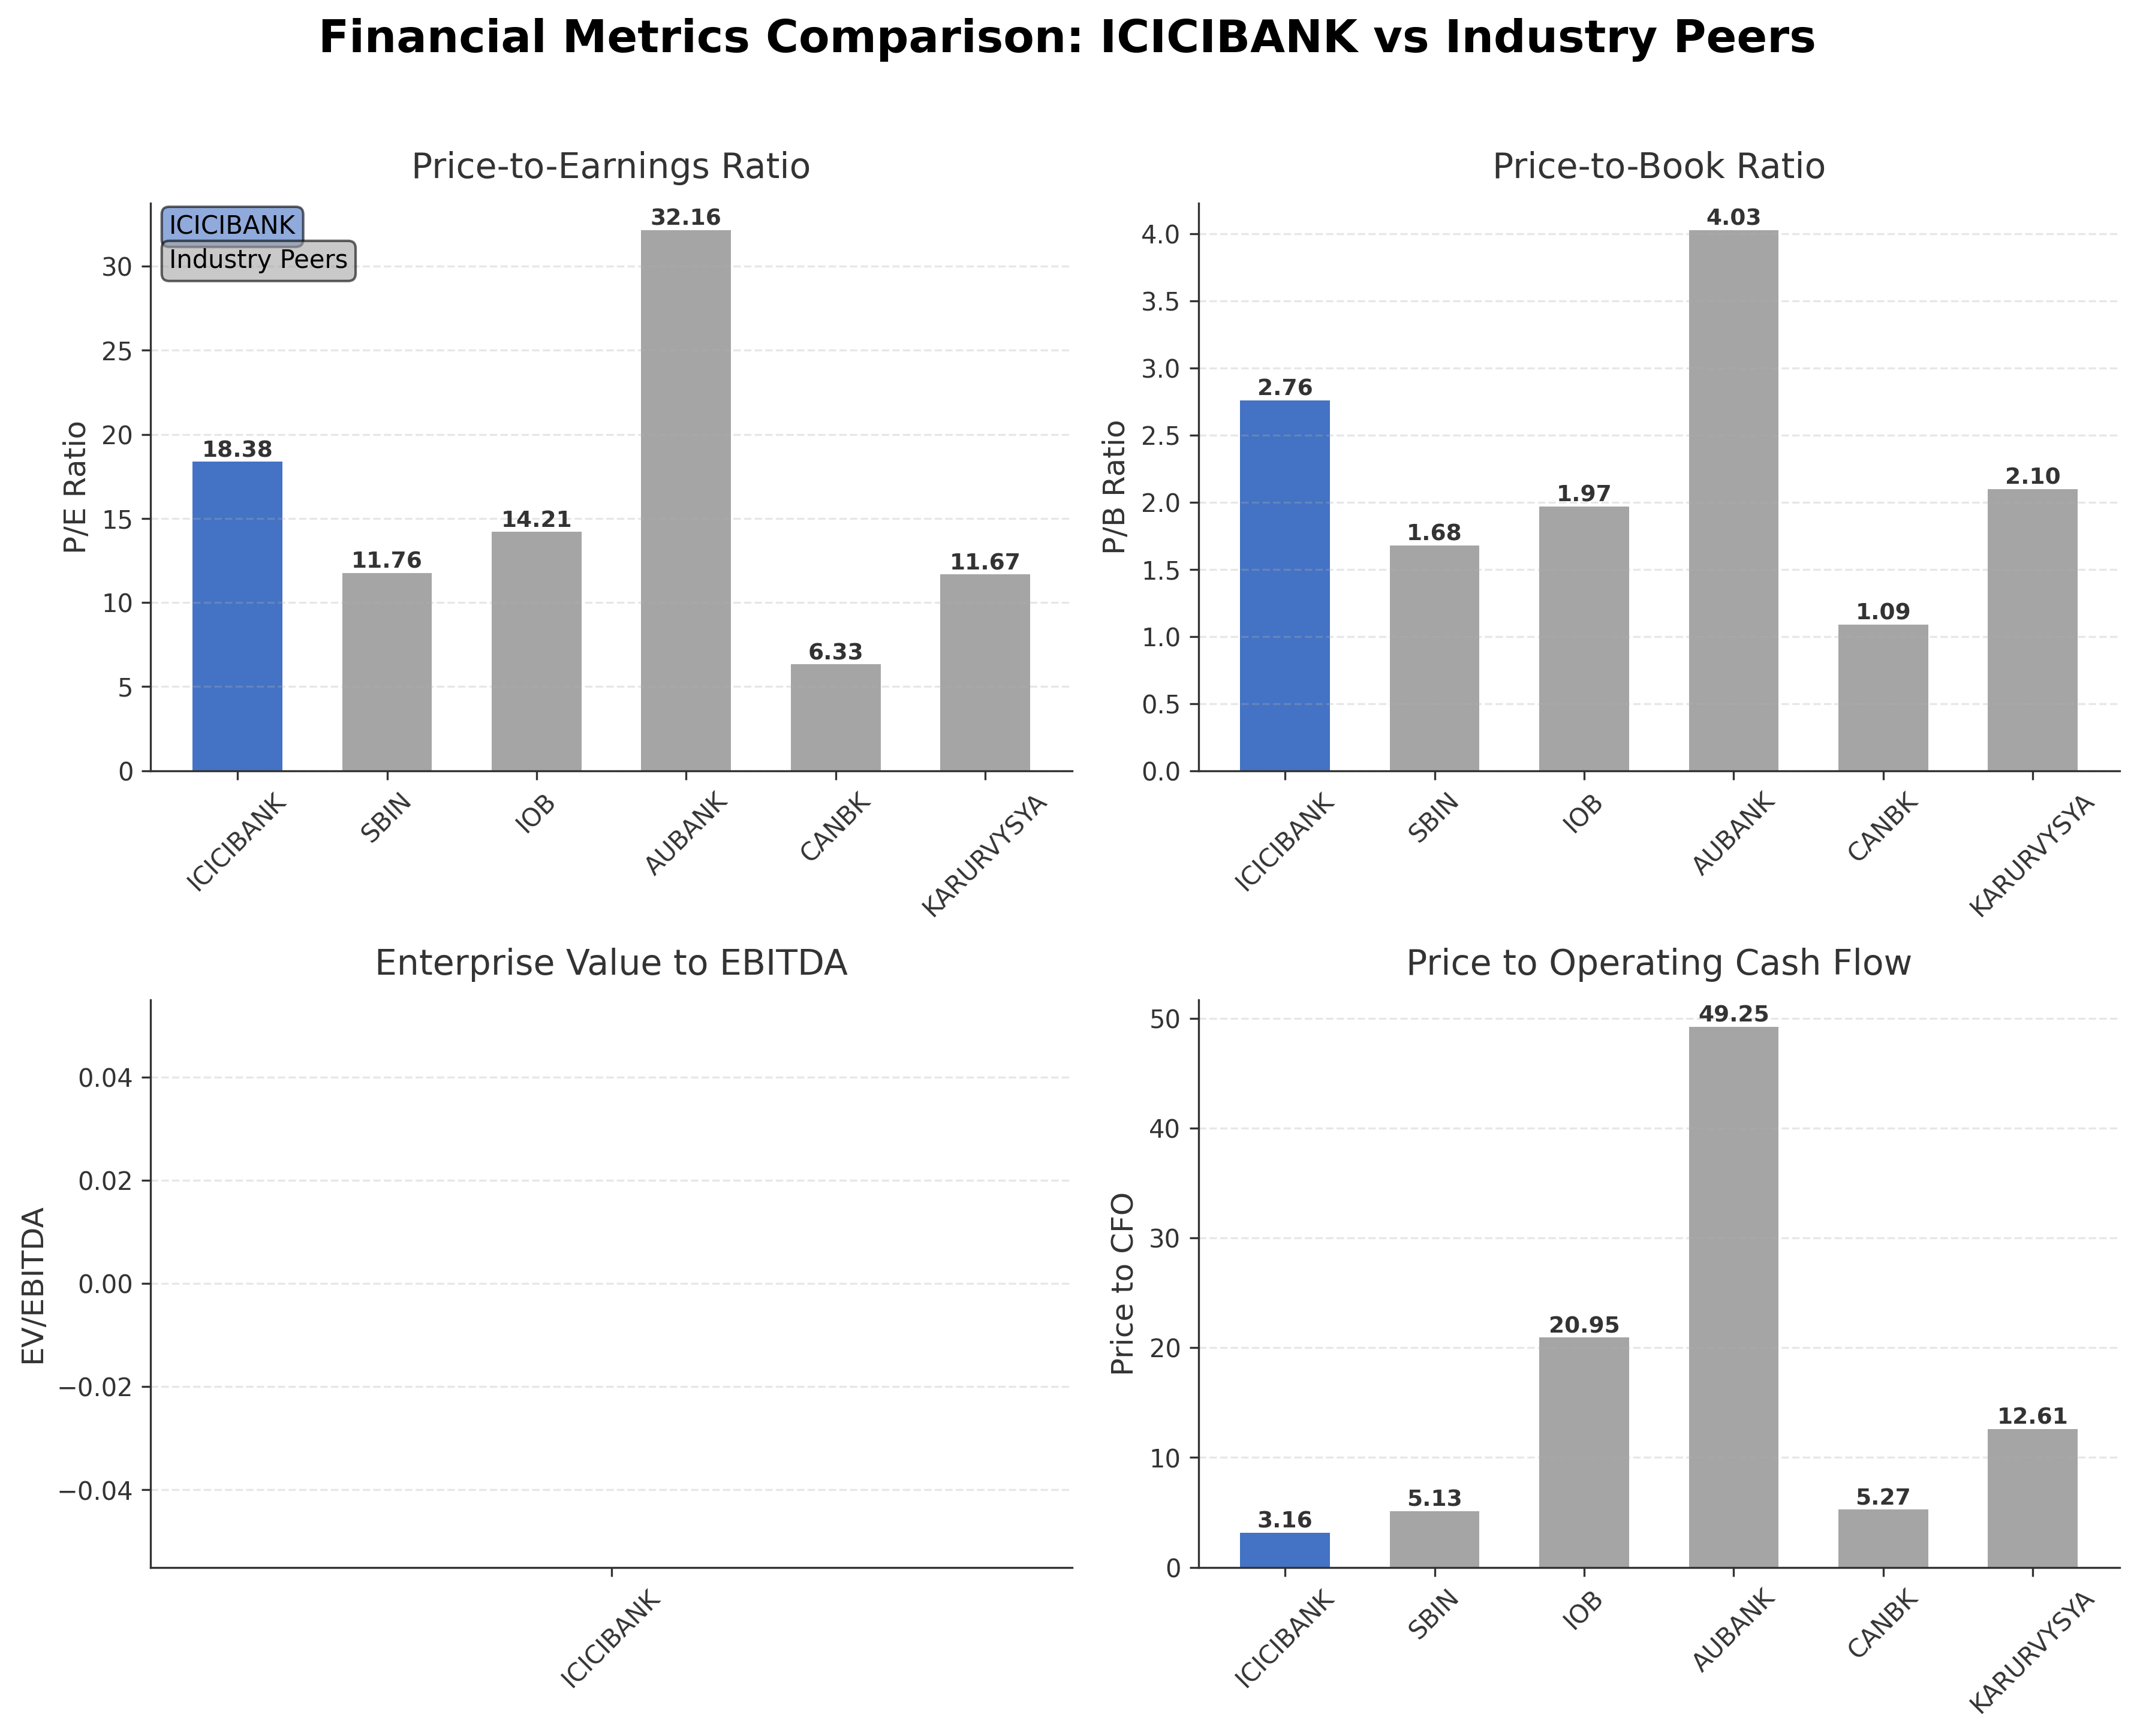
Comparison Analysis: ICICI Bank Ltd. exhibits a higher P/E ratio of 18.38 compared to most regional peers such as State Bank of India (11.76) and Canara Bank (6.33), reflecting relatively higher market valuation. Its price-to-book ratio of 2.76 is above the peer average, indicating premium pricing relative to book value. The bank’s return on equity of 16.8% is competitive, slightly below Canara Bank’s 18% but higher than AU Small Finance Bank’s 12%. ICICI Bank’s price to CFO ratio of 3.16 is significantly lower than smaller peers like AU Small Finance Bank and Indian Overseas Bank, suggesting better cash flow valuation. Overall, ICICI Bank balances strong profitability with premium valuation metrics within its peer group.
Financial Metrics Comparison with Peers
Financial Statements
Comprehensive financial data including income, balance sheet, and cash flow metrics
Income Statement
| fiscal_date | 2025-03-31 | 2024-03-31 | 2023-03-31 | 2022-03-31 | 2021-03-31 |
|---|---|---|---|---|---|
| Sales | 2047.15B | 1612.10B | 1341.89B | 1163.64B | 1185.39B |
| Operating Expense Selling General And Administrative | 552.97B | 370.33B | 301.95B | 258.70B | 282.20B |
| Pretax Income | 730.04B | 615.08B | 472.55B | 265.38B | 203.64B |
| Income Tax | 184.35B | 154.28B | 117.93B | 84.57B | 56.64B |
| Net Income | 545.69B | 460.81B | 354.61B | 265.38B | 203.64B |
| Eps Basic | 72.41 | 63.19 | 48.86 | 36.21 | 27.26 |
| Eps Diluted | 71.14 | 61.96 | 47.84 | 35.44 | 26.83 |
| Basic Shares Outstanding | 7.05B | 7.00B | 6.97B | 6.93B | 6.74B |
| Diluted Shares Outstanding | 7.05B | 7.00B | 6.97B | 6.93B | 6.74B |
| Net Income Continuous Operations | 694.64B | 596.84B | 458.30B | 335.68B | 240.49B |
| Minority Interests | -35.40B | -18.24B | -14.25B | -14.28B | -19.80B |
Data provided by Twelve Data
Balance Sheet
| fiscal_date | 2025-03-31 | 2024-03-31 | 2023-03-31 | 2022-03-31 | 2021-03-31 |
|---|---|---|---|---|---|
| Cash And Cash Equivalents | 2383.04B | 1901.30B | 1635.67B | 2135.55B | 1815.51B |
| Accounts Receivable | 238.38B | 208.55B | 151.10B | 108.39B | 110.63B |
| Total Assets | 26422.41B | 23640.63B | N/A | N/A | N/A |
| Total Liabilities | 23134.99B | 20940.31B | N/A | N/A | N/A |
| Long Term Debt | 1810.28B | 1837.03B | 1737.07B | 1494.67B | 1360.62B |
| Shareholders Equity | 3287.43B | 2700.32B | 2211.85B | 1880.33B | 1671.76B |
Data provided by Twelve Data
Cash Flow Statement
| fiscal_date | 2025-03-31 | 2024-03-31 | 2023-03-31 | 2022-03-31 | 2021-03-31 |
|---|---|---|---|---|---|
| Operating Activities Net Income | 694.64B | 596.84B | 458.30B | 335.68B | 240.49B |
| Operating Activities Depreciation | 26.90B | 19.96B | 16.35B | 14.70B | 14.71B |
| Operating Activities Stock Based Compensation | 7.90B | 7.03B | 5.18B | 2.67B | 77.61M |
| Operating Activities Other Non Cash Items | 41.06B | 30.07B | 55.48B | 84.35B | 165.72B |
| Operating Activities Other Assets Liabilities | 2280.37B | 2819.00B | 1148.15B | 1524.32B | 1988.83B |
| Operating Activities Operating Cash Flow | 3050.88B | 3472.90B | 1683.46B | 1961.71B | 2409.83B |
| Investing Activities Capital Expenditures | -47.05B | -36.09B | -21.80B | -17.43B | -16.76B |
| Investing Activities Investing Cash Flow | -47.05B | -36.09B | -21.80B | -17.43B | -16.76B |
| Financing Activities Long Term Debt Issuance | 404.46B | 391.97B | 417.36B | 356.98B | 294.22B |
| Financing Activities Long Term Debt Payments | -399.33B | -391.47B | -268.92B | -346.03B | -527.73B |
| Financing Activities Short Term Debt Issuance | 106.80B | 181.42B | 124.84B | 169.44B | -467.75B |
| Financing Activities Common Stock Issuance | 14.38B | 11.71B | 9.42B | 7.98B | 154.60B |
| Financing Activities Common Dividends | -70.41B | -55.99B | -34.79B | -13.85B | N/A |
| Financing Activities Financing Cash Flow | 55.89B | 137.65B | 247.91B | 174.51B | -546.67B |
| End Cash Position | 2140.23B | 1627.69B | 1364.56B | 1831.26B | 1475.71B |
| Free Cash Flow | 1180.35B | 1536.06B | -62.39B | 562.51B | 1363.27B |
Data provided by Twelve Data
Technical Analysis
Key Insights
- The current trend shows consolidation with the stock trading below the 200-day moving average of ₹1,374.79 but above the 50-day moving average of ₹1,319.69, indicating mixed momentum.
- Key support levels are near ₹1,187.60 (52-week low) and ₹1,320 (50-day MA), while resistance is observed around ₹1,375 (200-day MA) and ₹1,500 (52-week high).
- The stock is positioned between its short-term and long-term moving averages, suggesting a neutral stance with potential for directional breakout.
- Momentum indicators such as RSI and MACD show moderate strength without extreme overbought or oversold conditions, indicating balanced buying and selling pressure.
- Multi-timeframe analysis across daily, weekly, and monthly charts reveals a sideways pattern with no clear dominant trend, reflecting market indecision.
- Potential market scenarios include a breakout above the 200-day moving average signaling bullish momentum or a decline towards the 52-week low indicating bearish pressure.
Trending News
1. Headline: 5 Stocks in Which ICICI Group Bought Fresh Stakes Worth ₹5,300 Cr in Q4 FY26
Summary: In Q4 FY26, the ICICI Group made significant investments worth around Rs. 5,300 crore by acquiring fresh stakes in select companies.
Sentiment: neutral
Summary: ICICIAMC Share Price: Find the latest news on ICICIAMC Stock Price. Get all the information on ICICIAMC with historic price charts for NSE / BSE. Experts & Broker view also get the ICICIAMC Ltd. buy/sell tips detailed news, announcements, Forecasts, Analysts, Valuation, Earning forecasts, ...
Sentiment: neutral
3. Headline: ICICI Bank Files Form 6-K, Releases FY 2026 Earnings Investor Presentation - TipRanks.com
Summary: The latest update is out from Icici Bank ( ($IBN) ). ICICI Bank has notified investors that it has released an investor presentation to accompany its earnings call ...
Sentiment: neutral
4. Headline: ICICI Bank posts FY 2026 results call recordings | IBN SEC Filing - Form 6-K
Summary: ICICI Bank’s latest Form 6-K says audio recordings for quarter and year ended March 31, 2026 media and earnings calls are now available on its website.
Sentiment: neutral
5. Headline: ICICI Bank Ltd stock (INE090A01021): Is its digital banking push strong enough to unlock new upside?
Summary: ICICI Bank's shift to digital-first banking targets India's growing middle class, but can it sustain margins amid competition? For you in the United States and English-speaking markets worldwide, it offers exposure to Asia's fastest-growing economy. ISIN: INE090A01021
Sentiment: positive
Powered by Brave
Recent Updates
News Summary
As of April 20, 2026. ICICI Bank Ltd reported strong profit growth in Q4 FY26, with core operating profit rising 5.1% year-on-year and total deposits increasing by 11.4%. The retail loan portfolio grew by 9.5%, while asset quality improved with a net NPA ratio of 0.33%. Despite these positives, the credit card portfolio declined by 5.6%, and operating expenses rose by 12%, which may pressure margins. The bank also recorded a treasury loss of Rs 1.06 billion during the quarter. The filing of Form 6-K and release of the FY 2026 earnings presentation provided detailed financial insights and strategic outlook, supporting transparency and investor confidence. The earnings call transcript highlighted management’s focus on profit growth excluding treasury income and operational achievements.
News Sentiment
The overall sentiment from recent updates is moderately positive, driven by strong profit growth, robust deposit and loan portfolio expansion, and improved asset quality. However, rising operating expenses and a decline in the credit card segment introduce some caution. The treasury loss and elevated cost of deposits are additional factors tempering the outlook. Transparency through regulatory filings and management commentary reinforces confidence in the bank’s strategic direction. The balance of positive operational metrics against cost pressures results in a cautiously optimistic tone.
Source List
Analytical Overview
Analysis Summary
ICICI Bank’s valuation metrics show a trailing P/E of 18.38 and forward P/E of 14.86, which are slightly above the industry average of 18.38, indicating moderate premium valuation relative to peers. The bank’s revenue growth of 3% quarter-on-quarter and strong operating cash flow of INR 3.05 trillion highlight a stable growth trajectory supported by solid cash generation. Financial health appears sound with a total debt to equity ratio of 0.59 and substantial cash reserves of INR 1.79 trillion, reflecting prudent leverage and liquidity management. Sector-specific challenges include rising operating expenses and a shrinking credit card portfolio, while opportunities arise from the expanding retail loan book and digital banking initiatives. Considering India’s regulatory environment and growing middle-class consumer base, the bank is well-positioned to capitalize on evolving market dynamics.
Overall Business and Market Assessment
Supporting Factors: No data
Risk Factors: increasing operating expenses, treasury losses, and competitive pressures in the credit card segment
SWOT Analysis
Strengths
- ICICI Bank has a diversified financial services portfolio covering retail, corporate, and treasury segments.
- The bank demonstrates strong deposit growth and improving asset quality with a low net NPA ratio of 0.33%.
- Robust operating cash flow of INR 3.05 trillion supports financial flexibility.
- Significant institutional ownership at 55.88% provides governance stability.
Weaknesses
- Operating expenses increased by 12% year-on-year, potentially pressuring margins.
- The credit card portfolio declined by 5.6%, indicating challenges in this segment.
- Treasury losses impacted quarterly profitability.
- Moderate leverage with a debt to equity ratio of 0.59 could limit financial agility.
Opportunities
- Expansion of digital banking services targeting India’s growing middle class.
- Growing retail loan portfolio with 9.5% year-on-year growth.
- Potential to capitalize on increasing financial inclusion and economic growth in India.
- Strategic acquisitions and fresh stakes acquisition by ICICI Group indicate growth focus.
Threats
- Competitive pressures in the banking and credit card markets.
- Rising operating costs may affect profitability.
- Macroeconomic factors and regulatory changes could impact lending and asset quality.
- Volatility in treasury and investment income could affect earnings stability.
Company Description
ICICI Bank Ltd. is a diversified financial services group offering a comprehensive range of banking and financial products through its subsidiaries, joint ventures, and associates. It provides commercial banking, retail banking, project and corporate finance, working capital finance, insurance, venture capital and private equity, investment banking, broking, and treasury services. The bank operates across key segments including retail banking for individual exposures, wholesale banking for advances to companies and statutory bodies, treasury for its investment portfolio, and other banking activities like hire purchase and leasing. ICICI Bank Ltd. serves personal, business, corporate, and NRI customers with services such as savings accounts, deposits, payments, credit cards, loans, mutual funds, life and non-life insurance, cash management, trade finance, and global market services. Primarily focused on the Indian market, it maintains a extensive branch network and digital banking platforms to deliver seamless financial solutions. Founded in 1994 and headquartered in Mumbai, India, ICICI Bank Ltd. stands as a leading private sector bank shaping the financial landscape.