


ICICI Prudential Asset Management Company Ltd (ICICIAMC)
Stock Analysis Report
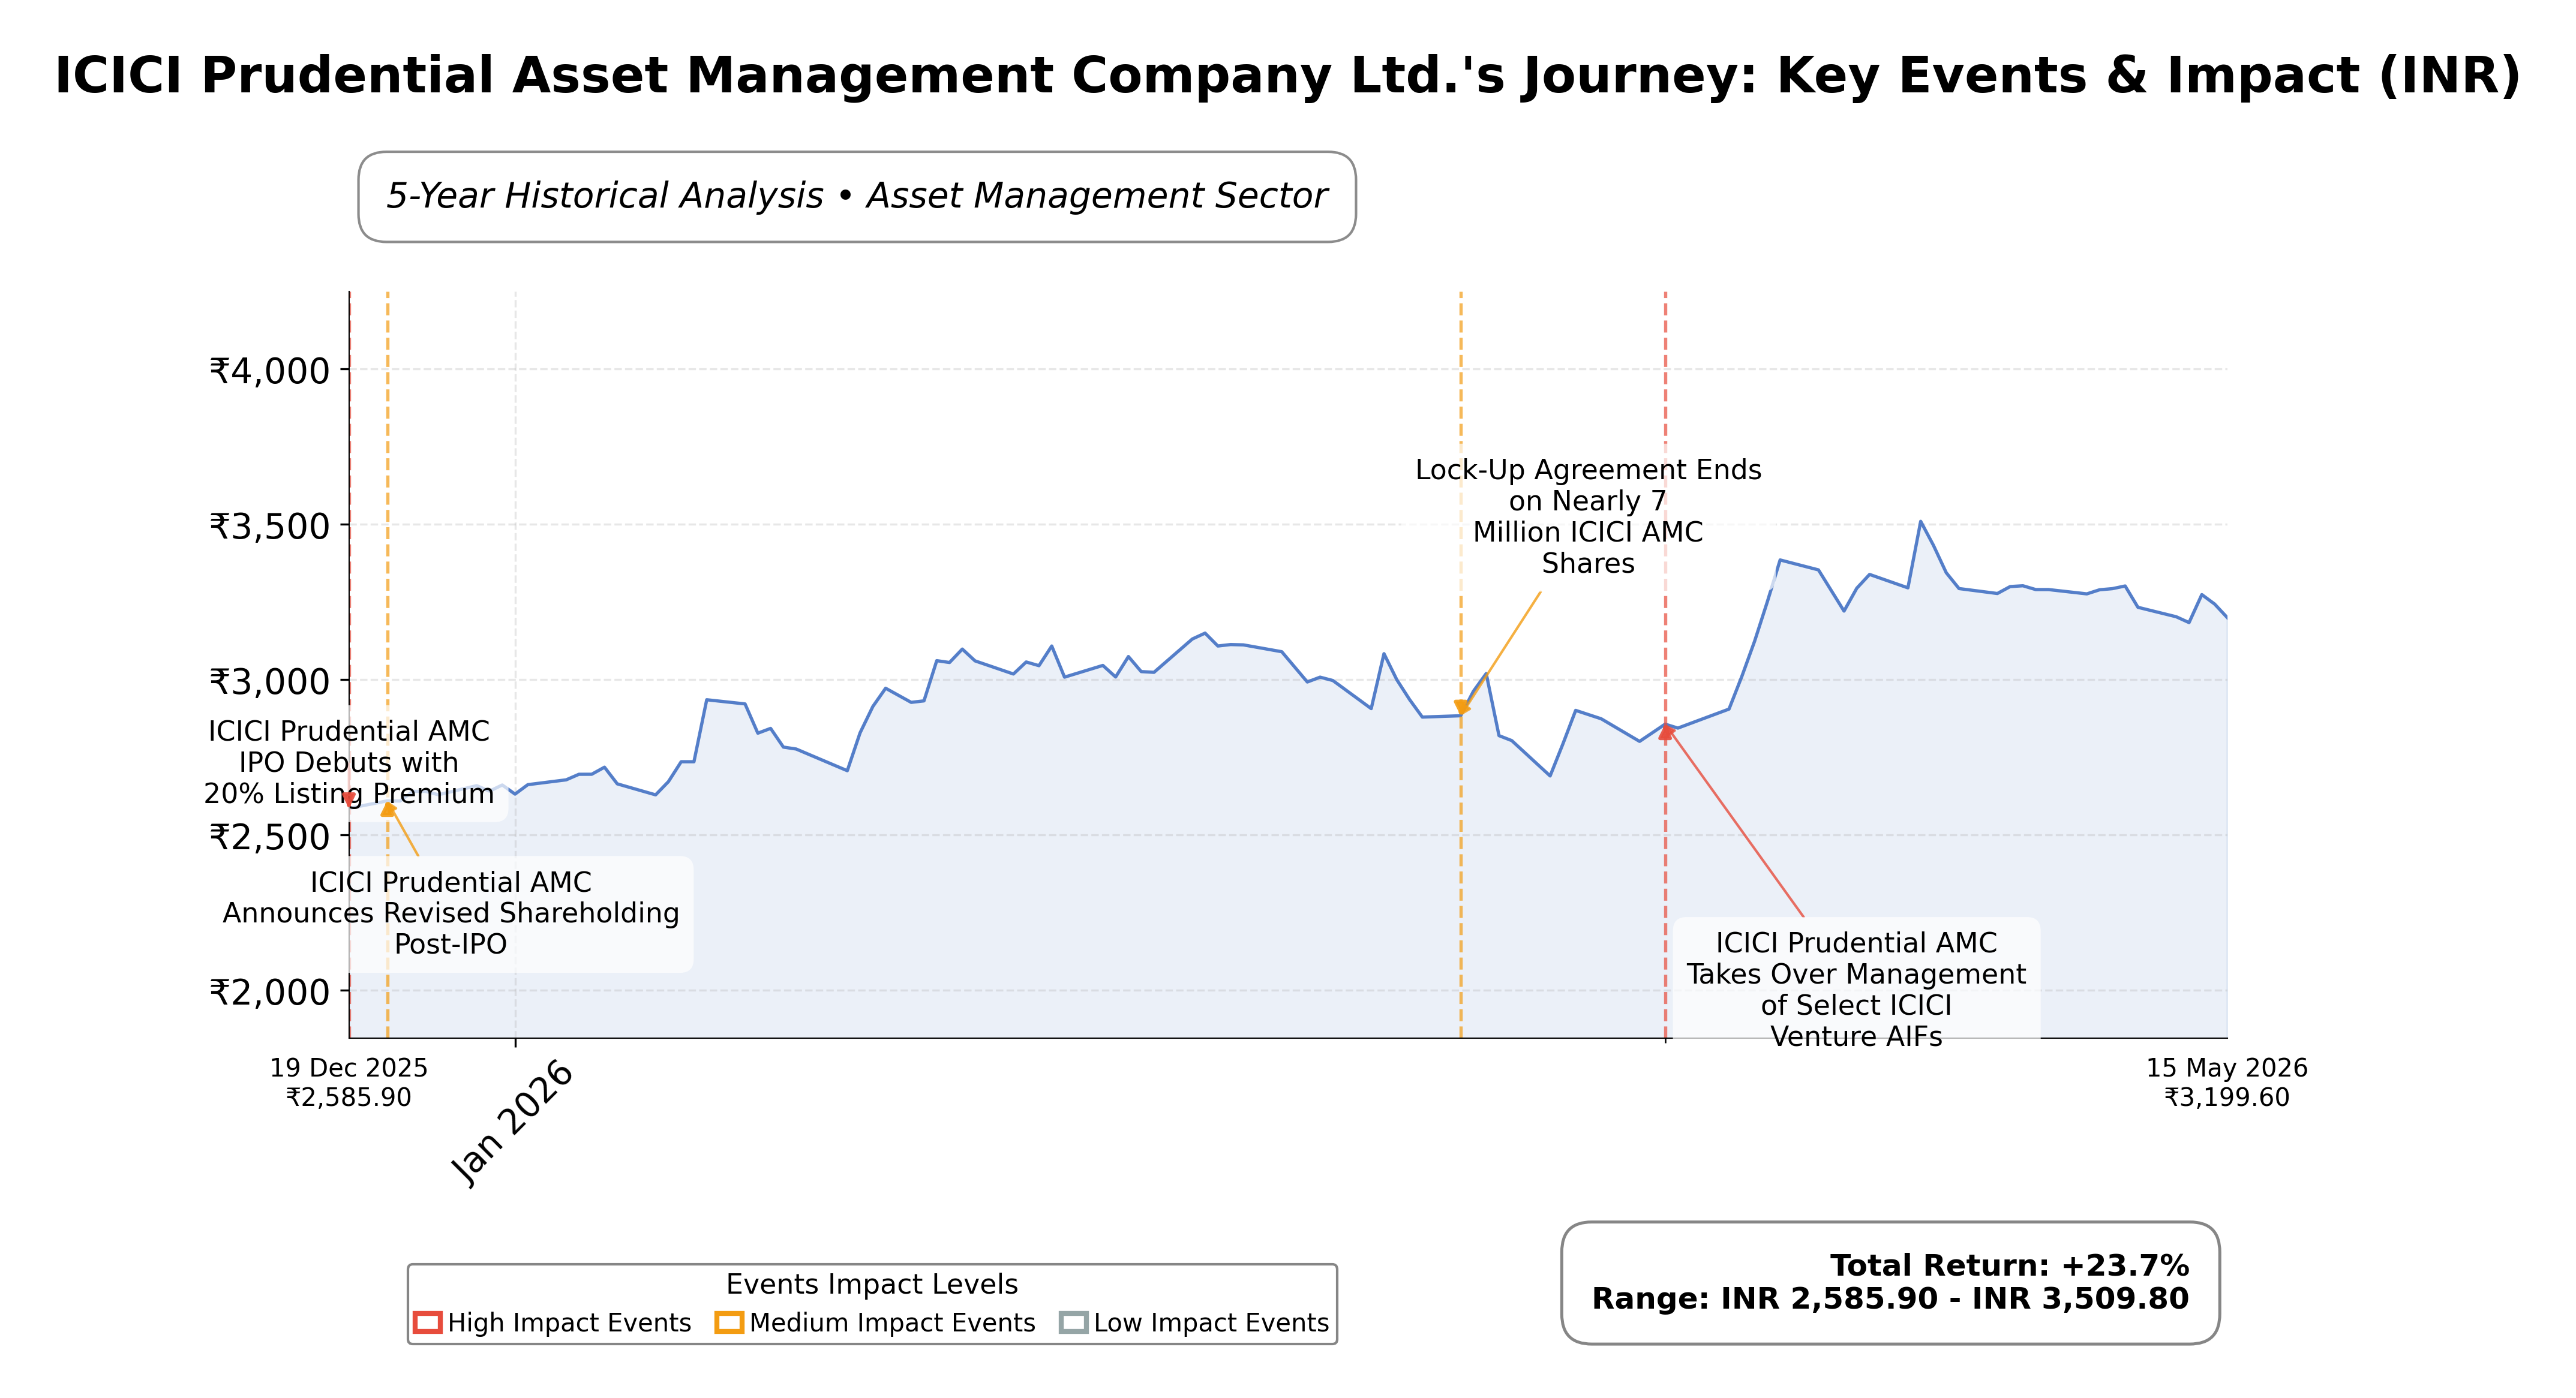
Stock Journey
Key Positives and Key Risks
Pros
- Strong profitability indicated by a high return on equity (85.8%) demonstrating efficient capital use.
- Debt-free balance sheet with zero total debt and substantial cash reserves of ₹400 crore ensuring financial stability.
- Robust cash flow generation with operating cash flow of ₹3,281 crore and free cash flow of ₹3,154 crore supporting operational flexibility.
Cons
- Elevated valuation multiples with a trailing P/E of 48.89 and price-to-book ratio of 38.7 suggesting limited margin for valuation expansion.
- Working capital days have increased significantly, potentially indicating operational inefficiencies.
- Premium pricing relative to peers may constrain near-term price appreciation amid market volatility.
Disclosure: This information is for general awareness and does not constitute investment advice
Report Summary
ICICI Prudential Asset Management Company Ltd. (ICICIAMC) operates as a leading asset management firm in India, listed on the NSE under the financial services sector. Established in 1993 as a joint venture between ICICI Bank Ltd. and Prudential Plc, it offers a broad range of mutual fund schemes, portfolio management services, and advisory mandates across equity, debt, and hybrid asset classes. The company holds a strong market position as the second-largest player in India’s mutual fund industry, managing assets exceeding ₹10.89 lakh crore and serving nearly 97 lakh investors through an extensive network of over 350 locations.
Financially, ICICIAMC demonstrates robust profitability and operational efficiency with a trailing twelve-month revenue of approximately ₹6,000 crore and a net profit margin of 54.96%. The company maintains a high gross margin of 84.18% and an operating margin of 73.06%, reflecting strong cost control and revenue quality. Its return on equity (ROE) stands at 85.8%, and return on assets (ROA) at 58.6%, indicating excellent capital utilization and asset efficiency. Additionally, the company reported operating cash flow of ₹3,281 crore and free cash flow of ₹3,154 crore, underscoring solid cash generation capabilities.
Valuation metrics reveal a trailing price-to-earnings (P/E) ratio of 48.89 and a forward P/E of 35.01, suggesting a premium valuation relative to earnings growth prospects. The price-to-book (P/B) ratio is notably high at 38.70, and the enterprise value to EBITDA (EV/EBITDA) ratio is 34.50, indicating the stock is priced richly compared to book value and earnings before interest, taxes, depreciation, and amortization. The market capitalization stands at approximately ₹1.58 trillion, with a 52-week price range between ₹2,530 and ₹3,597.5, and the current price of ₹3,196 sits below the 52-week high, reflecting some valuation moderation.
Key strengths include a debt-free balance sheet, strong cash reserves of ₹400 crore, and a high current ratio of 6.84, which collectively support financial stability. The company’s leadership in the Indian asset management industry and recent strategic collaboration with Pascal AI to enhance investment research through AI technology highlight its innovation focus. Risks encompass regulatory changes in the financial services sector, competitive pressures from peers and new entrants, and macroeconomic factors affecting investor sentiment and fund flows.
Technically, the stock exhibits consolidation with mixed momentum signals and price action near key moving averages, suggesting a phase of price stabilization. Recent news indicates positive developments in AI collaboration and strong quarterly earnings growth, balanced against broader market volatility and sector-specific challenges. The overall data suggests a cautious stance with attention to evolving technical and fundamental signals.
Company and Industry Overview
Company Basics
Price Performance
Company Size
Shareholding Pattern
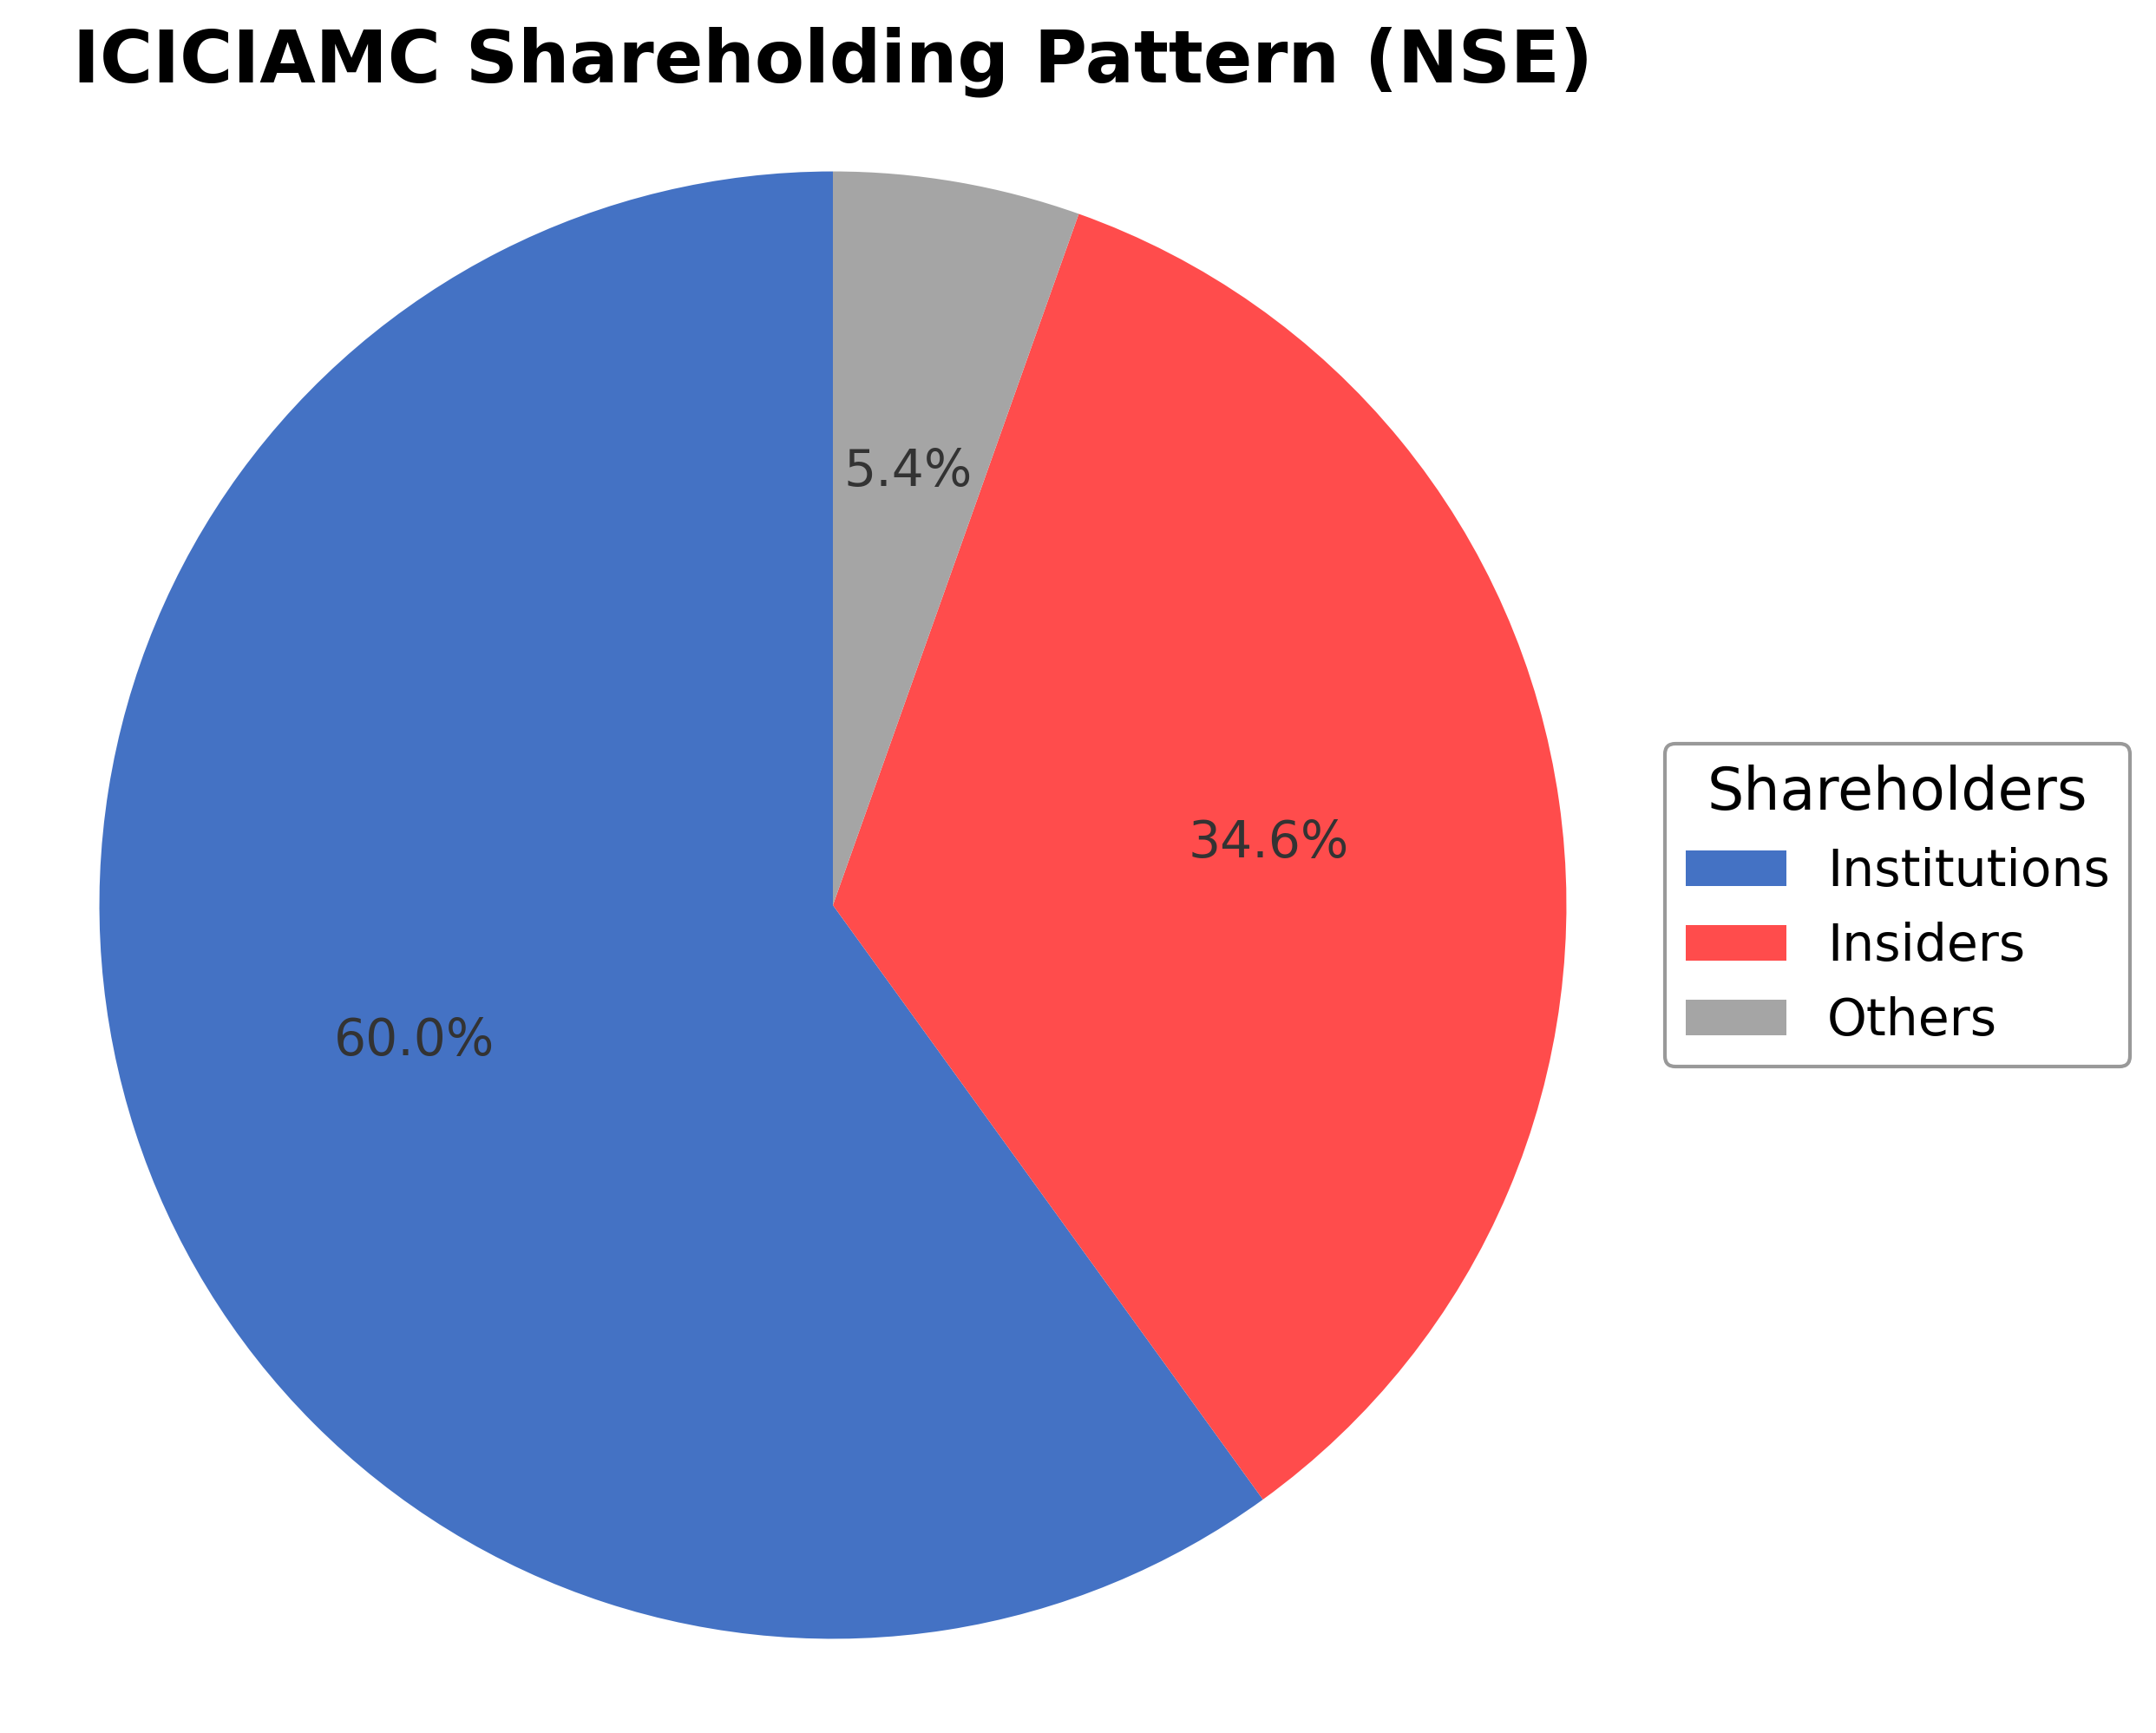
The shareholding structure of ICICI Prudential Asset Management Company Ltd. is dominated by institutional investors holding approximately 59.97% of shares, while insiders including executives and board members hold about 34.59%. The remaining shares are held by public and other shareholders accounting for roughly 5.44%. Over the past 12 to 24 months, institutional ownership has shown steady accumulation, reflecting confidence from mutual funds and asset managers. Major institutional holders have increased their stakes, indicating positive market sentiment towards the company’s governance and strategic direction. This ownership distribution supports strong corporate oversight and aligns with the company’s focus on innovation and market leadership within the Indian asset management industry.
Sector and Industry Analysis
The asset management sector in India has witnessed robust growth driven by rising financial awareness and increasing participation in mutual funds and alternative investment vehicles. The market size has expanded significantly, with total assets under management growing at a double-digit CAGR over recent years. Leading players include ICICI Prudential AMC, HDFC AMC, and SBI Mutual Fund, which dominate the industry by scale and brand recognition.
Industry trends highlight a shift towards equity-oriented products and digital distribution channels, enhancing accessibility and investor engagement. Competitive dynamics are shaped by strong brand loyalty, scale advantages, and product innovation, creating high barriers to entry for smaller firms. ICICI Prudential AMC, as the largest active mutual fund manager by QAAUM, benefits from its joint venture structure and diversified offerings across mutual funds, PMS, and offshore advisory services.
The regulatory environment is governed by the Securities and Exchange Board of India (SEBI), which enforces stringent norms on transparency, risk management, and investor protection. Recent regulations emphasize enhanced disclosure requirements and operational compliance, impacting cost structures but improving market integrity. The outlook remains positive as regulatory frameworks evolve to support sustainable growth and safeguard investor interests.
Note: Analysis synthesized from industry research, market reports, and regulatory filings. Information is subject to change based on market conditions.
Financial Ratios Dashboard
Illustrative Scenario Analysis
DCF Assumptions:
Method: Two-Stage EPS-Priority Model
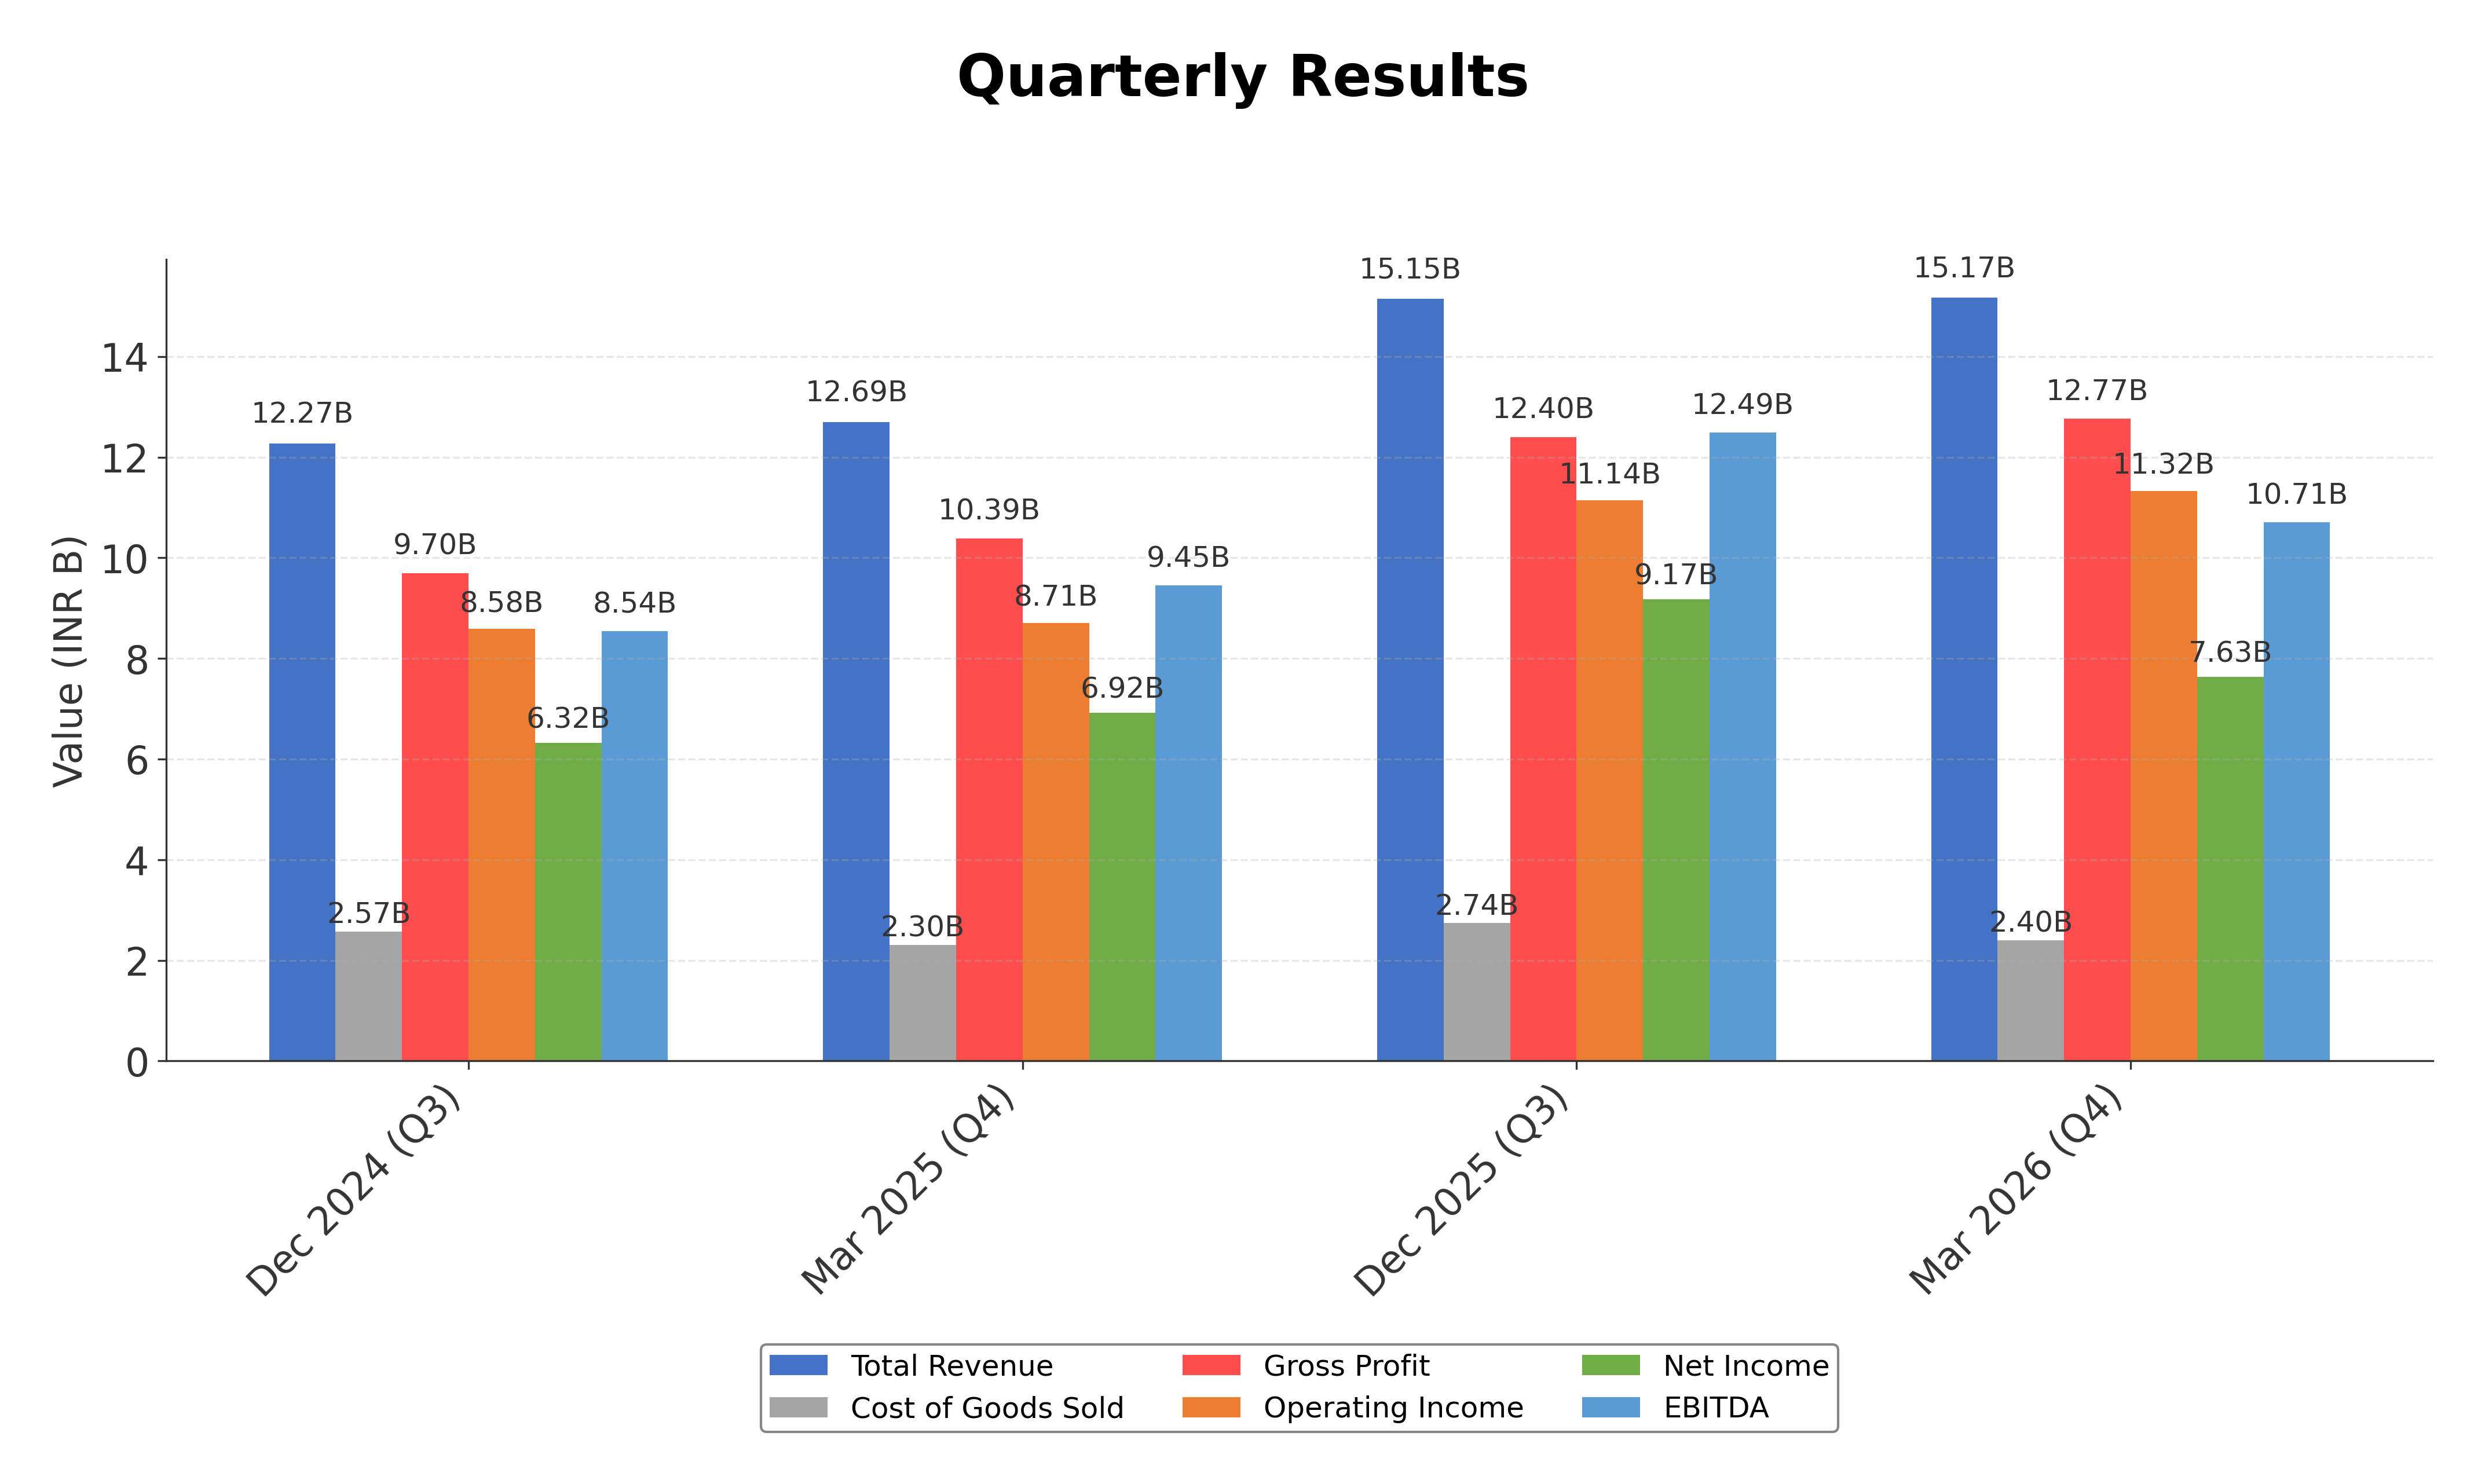
Financials
Peer Analysis
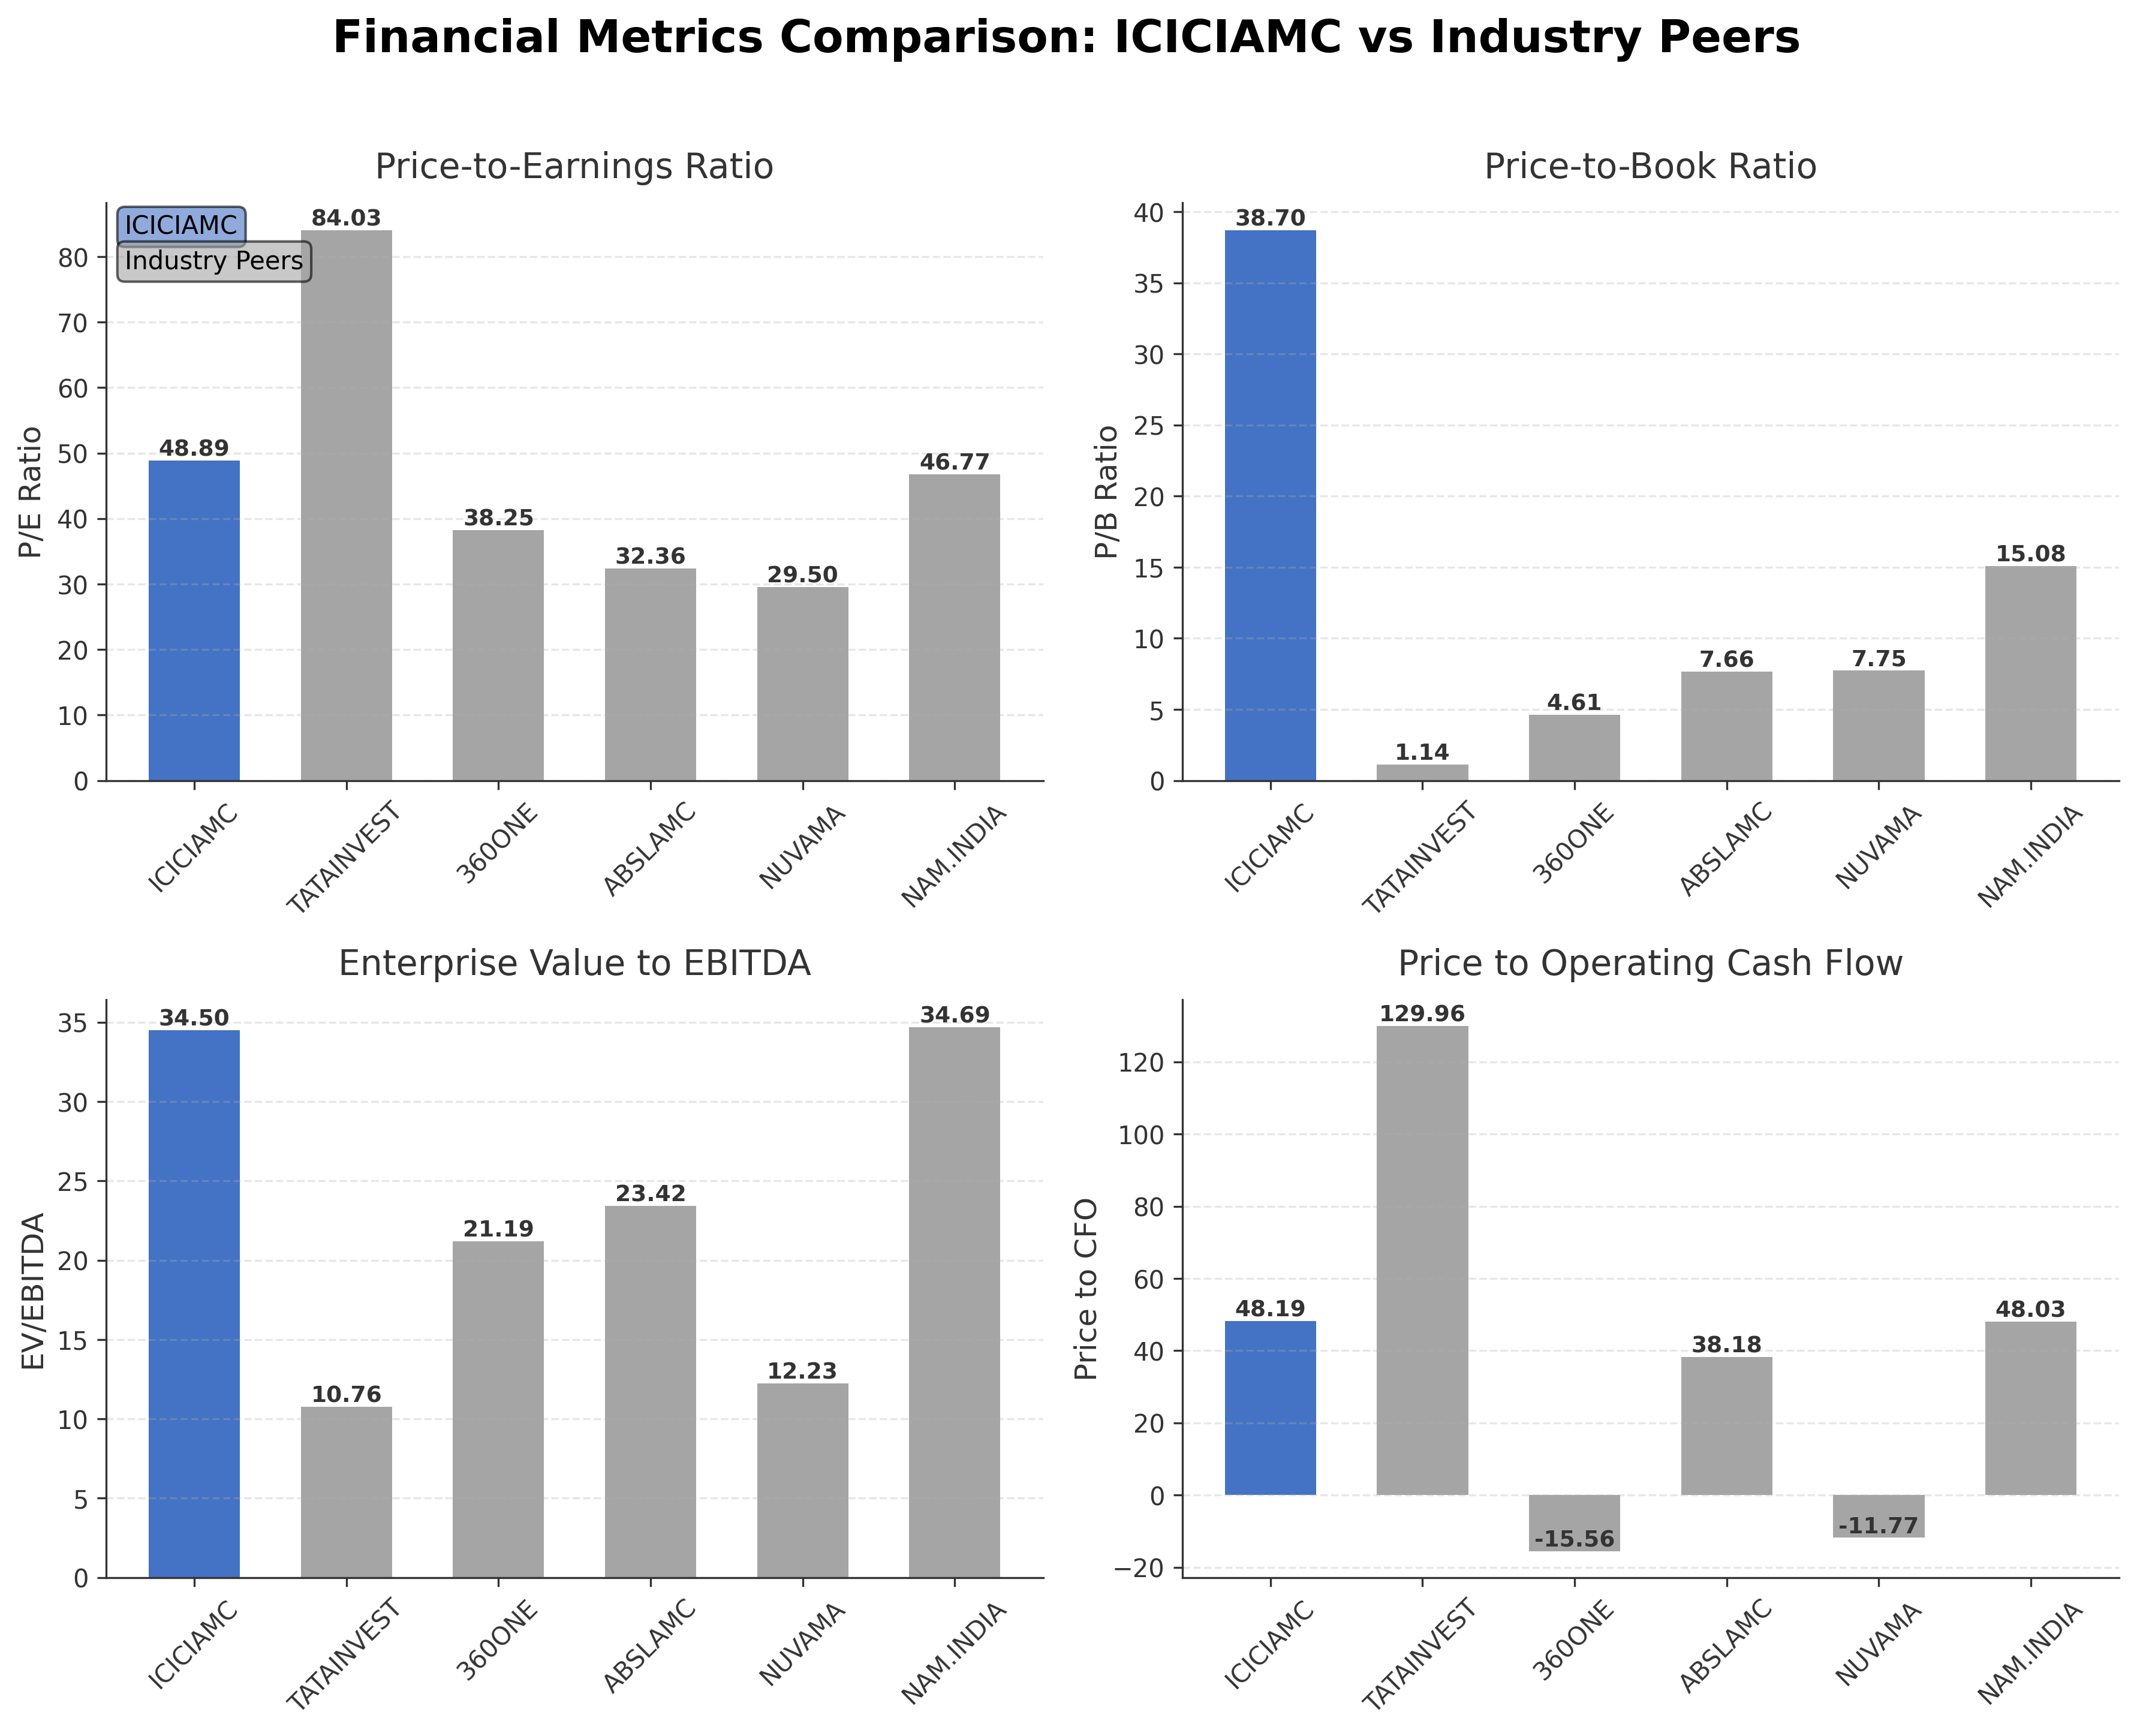
| Company Name | Market Cap | P/E Ratio | P/B Ratio | EV/EBITDA | Price to CFO |
|---|---|---|---|---|---|
| ICICI Prudential Asset Management Company Ltd. | ₹1.58T | 48.89 | 38.70 | 34.50 | 48.19 |
| Tata Investment Corporation Limited | ₹363.07B | 84.03 | 1.14 | 10.76 | 129.96 |
| 360 One Wam Ltd. | ₹454.44B | 38.25 | 4.61 | 21.19 | -15.56 |
| Aditya Birla Sun Life AMC Ltd. | ₹310.03B | 32.36 | 7.66 | 23.42 | 38.18 |
| Nuvama Wealth Management Ltd. | ₹297.00B | 29.50 | 7.75 | 12.23 | -11.77 |
| Nippon Life India Asset Management Limited | ₹704.10B | 46.77 | 15.08 | 34.69 | 48.03 |
Comparison Analysis: ICICI Prudential Asset Management Company Ltd. stands out among its Indian asset management peers with the largest market capitalization of ₹1.58 trillion and the highest return on equity at 0.86%. Its valuation multiples, including a P/E ratio of 48.89 and a P/B ratio of 38.70, are significantly higher than peers, reflecting premium pricing. The company also exhibits a superior EV/EBITDA ratio of 34.50, indicating relatively higher earnings valuation. While its price to CFO is elevated at 48.19, peers like Tata Investment Corporation and Nippon Life India AMC show lower multiples but also lower ROE. Overall, ICICIAMC’s metrics suggest strong profitability and market leadership but at a premium valuation compared to regional competitors.
Financial Metrics Comparison with Peers
Financial Statements
Comprehensive financial data including income, balance sheet, and cash flow metrics
Income Statement
| fiscal_date | 2026-03-31 | 2025-03-31 | 2024-03-31 | 2023-03-31 |
|---|---|---|---|---|
| Sales | 57.65B | 46.83B | 33.76B | 26.89B |
| Cost Of Goods | 10.57B | 9.34B | 5.95B | 4.46B |
| Gross Profit | 47.08B | 37.49B | 27.81B | 22.43B |
| Operating Expense Other Operating Expenses | 4.14B | 4.09B | 2.09B | 1.65B |
| Operating Income | 41.88B | 32.55B | 23.29B | 18.73B |
| Non Operating Interest Expense | 177.70M | 185.50M | 161.90M | 149.10M |
| Pretax Income | 44.07B | 35.33B | 26.98B | 20.07B |
| Income Tax | 11.09B | 8.82B | 6.48B | 4.91B |
| Net Income | 32.98B | 26.51B | 20.50B | 15.16B |
| Eps Basic | 66.73 | 53.63 | 41.47 | 30.67 |
| Eps Diluted | 66.73 | 53.63 | 41.47 | 30.67 |
| Basic Shares Outstanding | 494.27M | 494.25M | 494.26M | 494.26M |
| Diluted Shares Outstanding | 494.27M | 494.25M | 494.26M | 494.26M |
| Ebit | 44.25B | 35.52B | 27.14B | 20.22B |
| Ebitda | 45.30B | 36.37B | 24.57B | 19.69B |
| Net Income Continuous Operations | 44.07B | 35.33B | 26.98B | 20.07B |
| Preferred Stock Dividends | 0.00 | 0.00 | 0.00 | 0.00 |
| Operating Expense Selling General And Administrative | N/A | 1.15B | 964.10M | 893.80M |
| Non Operating Interest Income | N/A | 679.30M | 575.40M | 443.80M |
Source: Financial statements and regulatory filings
Balance Sheet
| fiscal_date | 2026-03-31 | 2025-03-31 | 2024-03-31 | 2023-03-31 |
|---|---|---|---|---|
| Cash And Cash Equivalents | 1.34B | 154.40M | 231.10M | 314.50M |
| Accounts Receivable | 1.86B | 2.37B | 1.96B | 1.12B |
| Total Assets | 50.50B | 43.84B | 35.54B | 28.05B |
| Total Liabilities | 8.79B | 8.67B | 6.71B | 4.92B |
| Long Term Debt | N/A | N/A | N/A | N/A |
| Shareholders Equity | 41.71B | 35.17B | 28.83B | 23.13B |
Source: Financial statements and regulatory filings
Cash Flow Statement
| fiscal_date | 2026-03-31 | 2025-03-31 | 2024-03-31 | 2023-03-31 |
|---|---|---|---|---|
| Operating Activities Net Income | 44.07B | 35.33B | 26.98B | 20.07B |
| Operating Activities Other Non Cash Items | 152.70M | 187.20M | 138.70M | 198.60M |
| Operating Activities Accounts Receivable | 506.40M | -414.90M | -836.20M | -120.50M |
| Operating Activities Other Assets Liabilities | 95.30M | 827.80M | 214.40M | -272.00M |
| Operating Activities Operating Cash Flow | 44.82B | 35.93B | 26.50B | 19.88B |
| Investing Activities Capital Expenditures | -1.15B | -4.11B | -543.90M | -405.10M |
| Investing Activities Purchase Of Investments | -22.24B | -21.04B | N/A | N/A |
| Investing Activities Sale Of Investments | 18.17B | 19.27B | N/A | N/A |
| Investing Activities Investing Cash Flow | -5.22B | -5.88B | -543.90M | -405.10M |
| Financing Activities Common Dividends | -26.40B | -20.12B | -14.77B | -12.20B |
| Financing Activities Financing Cash Flow | -26.40B | -20.12B | -14.77B | -12.20B |
| End Cash Position | 1.34B | 154.40M | 231.10M | 314.50M |
| Free Cash Flow | 31.66B | 21.62B | 17.10B | 13.59B |
Source: Financial statements and regulatory filings
Technical Analysis
Key Insights
- ICICIAMC is currently exhibiting a consolidation phase with sideways price action near the ₹3,100 to ₹3,200 range, indicating indecision among market participants.
- Key support levels are identified around ₹2,900 and ₹2,800, while resistance is observed near the recent 52-week high of ₹3,597.5 and the 50-day moving average at ₹3,109.51.
- The stock price is trading slightly above the 200-day moving average of ₹2,984.04 and near the 50-day moving average, suggesting a neutral medium-term trend.
- Momentum indicators show mixed signals: the RSI is hovering around mid-range levels, MACD indicates a flattening trend, and stochastic oscillators suggest limited momentum.
- Analysis across daily, weekly, and monthly timeframes confirms the current sideways trend with no clear breakout or breakdown signals.
- Potential market scenarios include continuation of consolidation with possible testing of support levels or a breakout above resistance if volume and momentum improve.
Trending News
1. Headline: Prudential plc Share Repurchase and Issued Share Changes Disclosure – May 2026 Hong Kong Stock Exchange Filing
Summary: Prudential plc Share Buyback Update – May 2026 Prudential plc Announces Latest Share Buyback Activity: Key Details for Investors Overview of Recent Share Buybacks Prudential plc has disclosed significant activity relating to its share buyback program, affecting its issued share capital.
Sentiment: neutral
2. Headline: Sensex Today | Stock Market Highlights: Sensex, Nifty snap 2-day rally; rupee breaches 96/$ for first time
Summary: Sensex Today | Stock Market Highlights: The Sensex fell 161 points to close at 75,238, while the Nifty settled 46 points lower at 23,644. Nifty Bank declined 419 points to 53,710, while the Midcap index fell 273 points to 60,567.
Sentiment: negative
3. Headline: ICICI Prudential AMC Upgraded to Hold on Technical and Valuation Improvements
Summary: While the stock’s technical indicators have improved, some caution remains due to mixed signals in momentum and volume trends. The sideways technical trend suggests a consolidation phase, where investors may await clearer directional cues before committing further capital. Holding ICICI Prudential Asset Management Co Ltd ...
Sentiment: positive
4. Headline: Pascal AI collaborates with ICICI Prudential AMC for AI initiatives - The Wire
Summary: The collaboration aims to improve research speed, analytical coverage, and workflow efficiency across investment research Mumbai, 12 May, 2026: Pascal AI announced its collaboration with ICICI Prudential Asset Management Company Ltd. (ICICI Prudential AMC), one of India's largest AMCs to deploy ...
Sentiment: positive
5. Headline: Franklin Templeton bets on fixed income growth to rebuild India business - The HinduBusinessLine
Summary: Franklin Templeton is shifting focus to fixed income in India, aiming to reduce equity exposure and expand debt funds amid rising investor interest and competition.
Sentiment: positive
Recent Updates
News Summary
As of 12 May 2026. ICICI Prudential Asset Management Company Ltd. has entered into a strategic collaboration with Pascal AI to deploy advanced AI infrastructure aimed at enhancing investment research capabilities, improving speed, analytical coverage, and workflow efficiency. This initiative reflects the company’s focus on technology-driven innovation within the asset management sector. Additionally, ICICI Bank, a key stakeholder, has released its quarterly results for FY 2026, supporting the broader financial ecosystem in which ICICIAMC operates. The company reported strong Q4 performance with a 58% increase in net profit to ₹6.09 billion and a 17% rise in revenue to ₹192 billion, alongside approval of a final dividend of ₹12.40 per share. These developments underscore ICICIAMC’s robust financial health and strategic positioning in the market.
News Sentiment
The overall sentiment from recent updates is predominantly positive, driven by strong quarterly financial results demonstrating significant profit and revenue growth, and strategic initiatives such as the AI collaboration with Pascal AI. These factors highlight the company’s commitment to innovation and operational excellence. Neutral tones arise from general investor relations updates and market-wide volatility, while negative sentiment is limited and primarily linked to broader market fluctuations rather than company-specific issues. The balanced sentiment reflects confidence in the company’s fundamentals tempered by cautious market conditions.
Source List
- https://m.thewire.in/article/ptiprnews/pascal-ai-collaborates-with-icici-prudential-amc-for-ai-initiatives
- https://www.icici.bank.in/about-us/qfr
- https://scanx.trade/stock-market-news/companies/icici-prudential-asset-management-company-limited-announces-audited-financial-results-for-year-ended-march-31-2026/37648846
Analytical Overview
Analysis Summary
ICICI Prudential AMC’s valuation metrics, including a trailing P/E of 48.89 and forward P/E of 35.01, are elevated relative to the asset management industry average P/E of approximately 48.89, indicating a premium valuation that reflects growth expectations. The company’s revenue growth rate of 8.2% quarterly and strong cash flow generation, with operating cash flow of ₹3,281 crore and free cash flow of ₹3,154 crore, demonstrate a positive growth trajectory supported by operational efficiency. Financial health is robust, with zero debt, a high current ratio of 6.84, and substantial cash reserves of ₹400 crore, underscoring strong liquidity and low financial risk. Sector-specific opportunities include the growing Indian mutual fund market and increasing adoption of technology in asset management, while challenges involve regulatory scrutiny and competitive pressures from both domestic and international firms. Considering India-specific factors, the company benefits from a favorable regulatory environment, rising financial literacy, and expanding investor base, which support long-term growth prospects.
Overall Business and Market Assessment
Supporting Factors: No data
Risk Factors: the high valuation multiples that may limit upside potential and sectoral regulatory changes that could impact operating conditions
SWOT Analysis
Strengths
- Strong market position as the second-largest asset manager in India.
- High profitability with an 85.8% return on equity and 54.96% net profit margin.
- Debt-free balance sheet with substantial cash reserves and strong liquidity ratios.
- Strategic focus on technology and innovation, including AI collaboration to enhance research.
Weaknesses
- Premium valuation with a high price-to-book ratio of 38.7 may limit near-term price appreciation.
- Relatively high price-to-earnings ratio compared to some peers.
- Working capital days have increased, indicating potential operational inefficiencies.
- Limited dividend yield of approximately 0.84% may be less attractive to income-focused investors.
Opportunities
- Growing Indian mutual fund market with increasing retail and institutional participation.
- Expansion of technology-driven investment research and operational efficiencies.
- Increasing demand for diversified asset classes including debt and hybrid funds.
- Potential to leverage AI and data analytics for competitive advantage.
Threats
- Regulatory changes in the financial services sector could impact business operations.
- Intense competition from domestic and global asset management firms.
- Macroeconomic volatility affecting investor sentiment and fund flows.
- Potential market corrections impacting asset valuations and fee income.
Company Description
ICICI Prudential Asset Management Company Ltd. is a leading asset management company in India, established in 1993 as a joint venture between ICICI Bank Ltd., a prominent financial services provider, and Prudential Plc, a global leader in health, protection, and savings solutions. Its primary function is to bridge the gap between savings and investments by offering a diverse range of mutual fund schemes, portfolio management services, real estate investment options, and international advisory mandates across asset classes like equity, debt, and hybrids. The company manages substantial assets under management, totaling over ₹10.89 lakh crore as of the latest quarter, serving a vast investor base of nearly 97 lakh individuals through an extensive network of over 350 locations and more than 3,000 employees. Notable for its investor-centric approach, it emphasizes innovation, consistent performance, and accessibility, with offerings spanning equity funds focused on sectors like infrastructure and healthcare, hybrid strategies, and debt instruments. ICICI Prudential Asset Management Company Ltd. plays a pivotal role in India's mutual fund industry as the second-largest player, fostering long-term wealth creation for retail, high-net-worth, and institutional investors.