


Hyundai Motor India Ltd (HYUNDAI)
Stock Analysis Report
Stock Journey
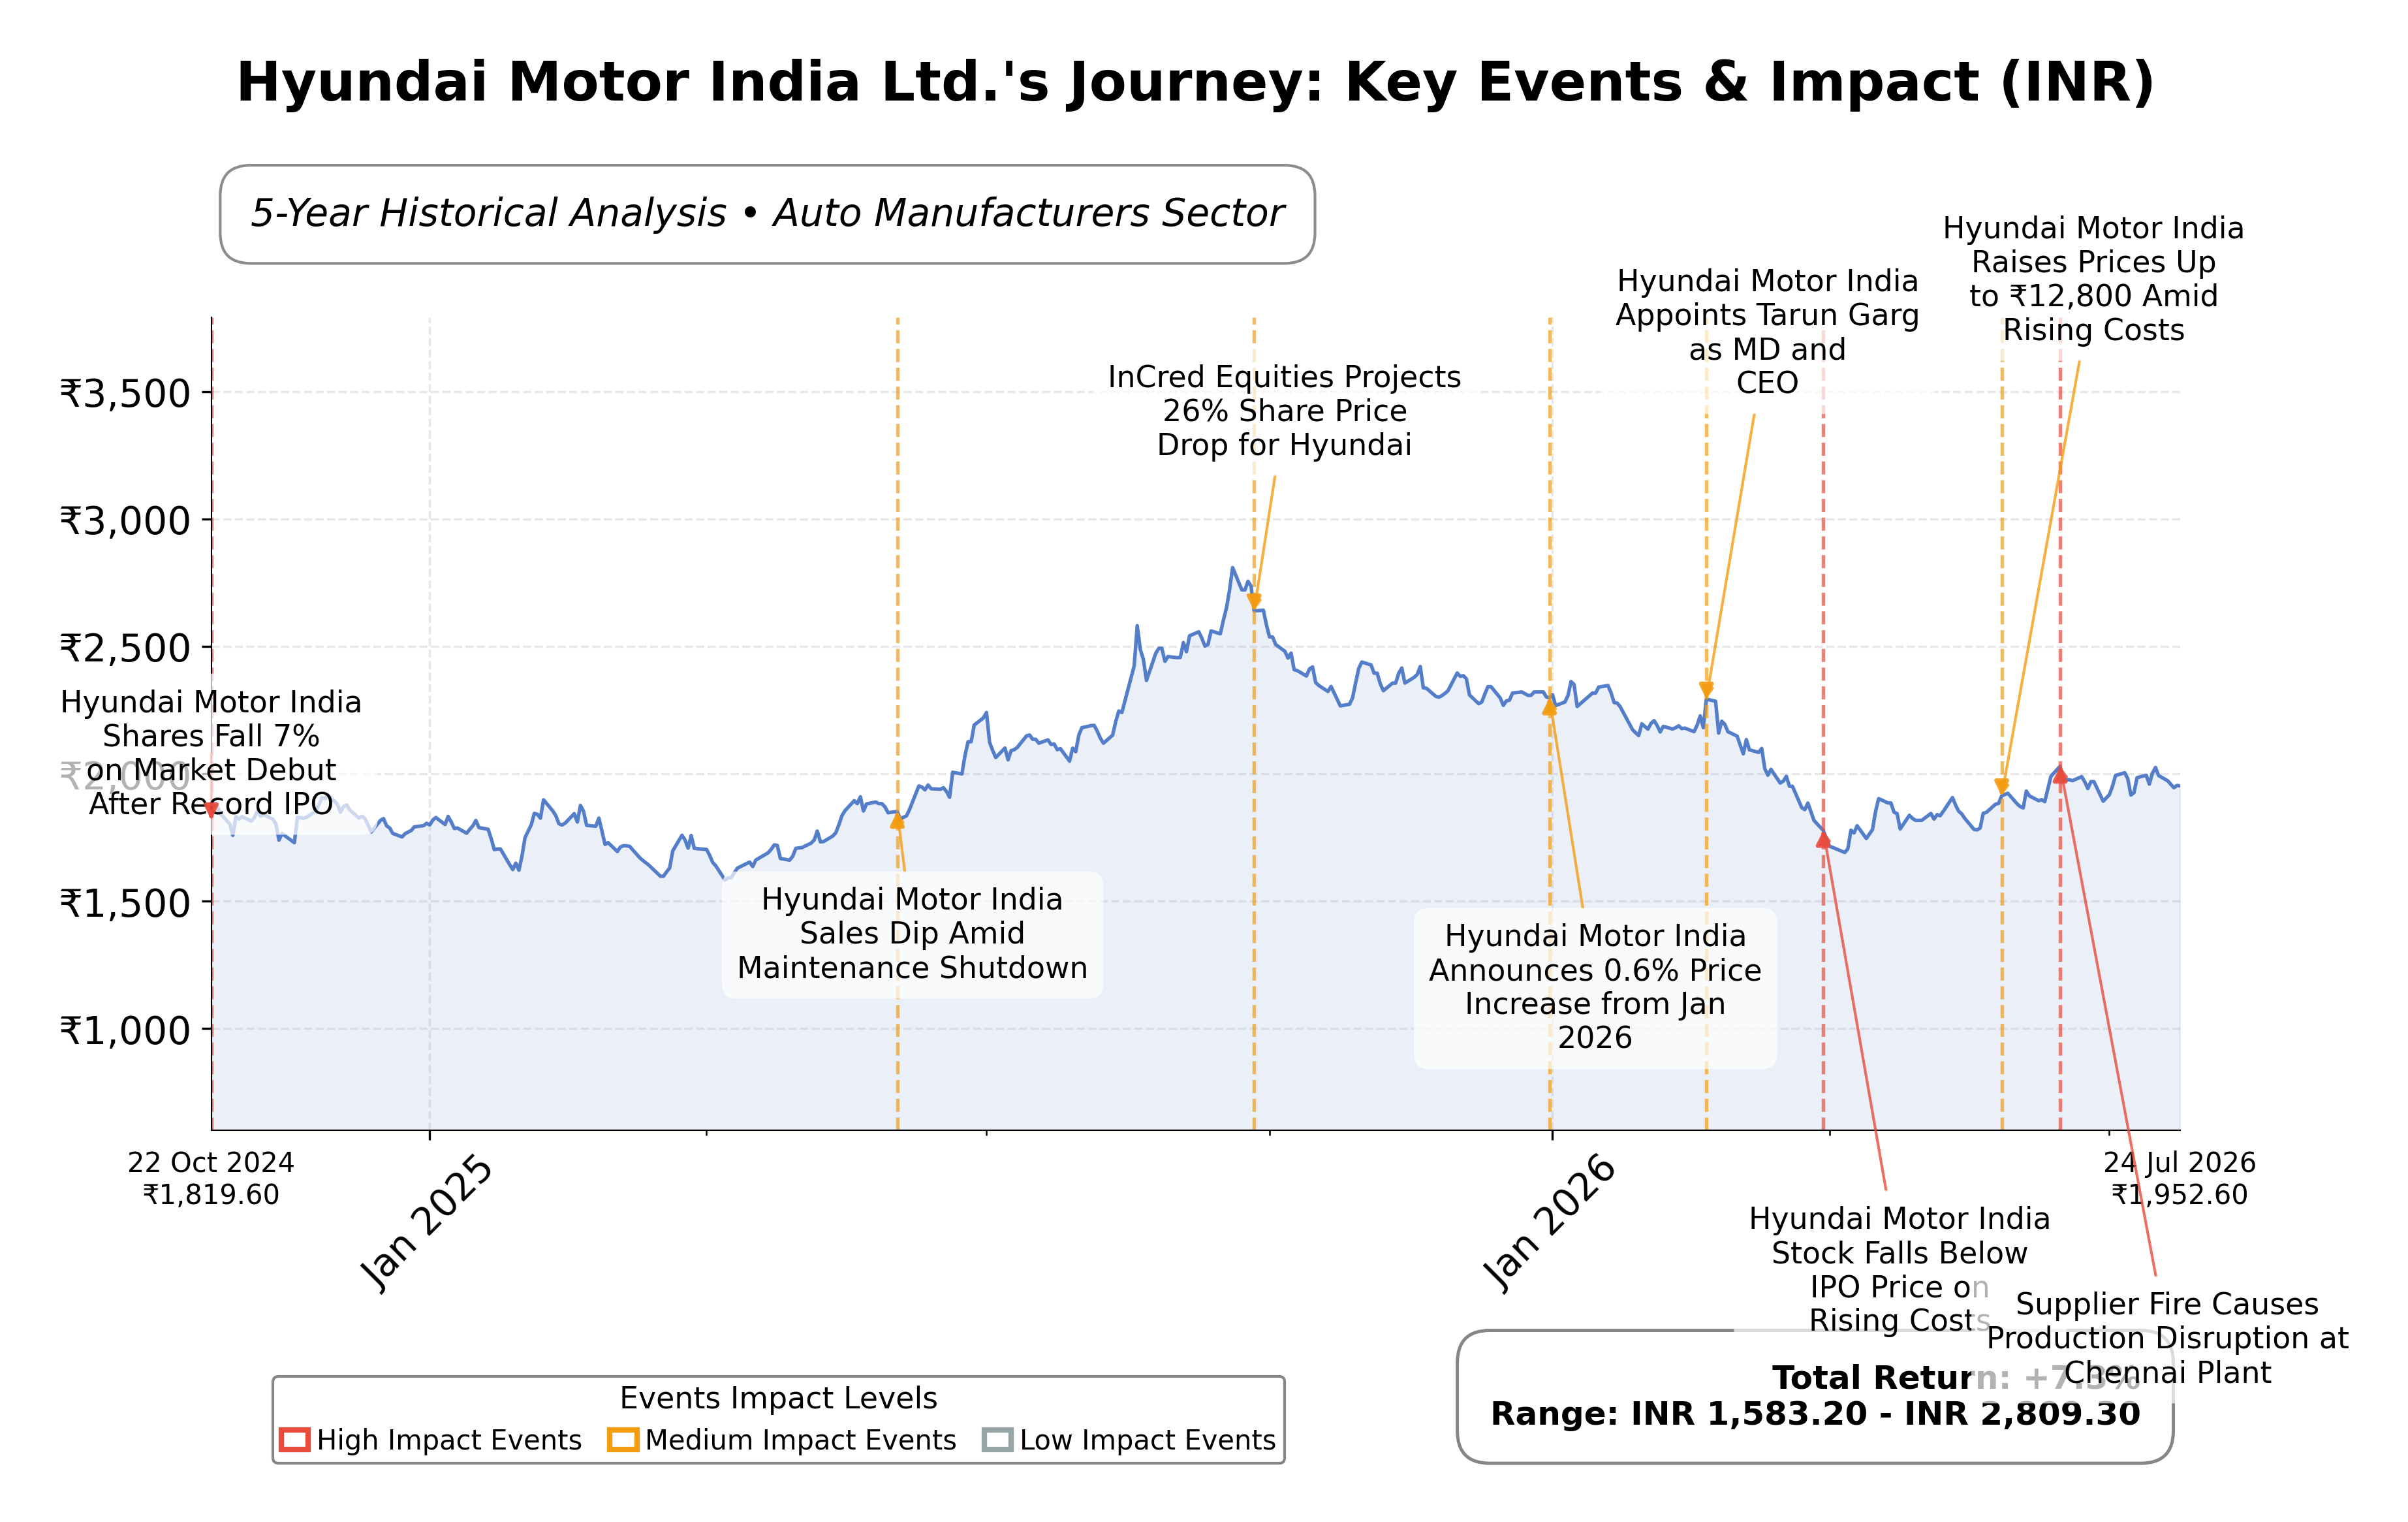
Key Positives and Key Risks
Pros
- Return on Equity of 29.92% demonstrates strong profitability and efficient capital use.
- Healthy cash reserves of INR 105.52 billion provide liquidity and financial flexibility.
- Market capitalization of INR 1.55 trillion reflects significant scale and market presence.
Cons
- Price-to-Book ratio of 7.84 indicates a high valuation premium relative to book value.
- Quarterly earnings growth declined by 22.2% year-over-year, signaling near-term profitability pressure.
- Production loss of 13,900 units due to supplier fire incident highlights operational risks.
Disclosure: This information is for general awareness and does not constitute investment advice
Report Summary
Hyundai Motor India Ltd. is a leading automobile manufacturer operating in the Indian market, listed on the NSE under the symbol HYUNDAI. It is a subsidiary of the South Korean Hyundai Motor Company and specializes in producing a diverse range of passenger vehicles including compact cars, sedans, SUVs, and hybrid models. The company is positioned within the Consumer Cyclical sector, specifically in the Auto Manufacturers industry, and holds a significant market share in India with popular models like the Hyundai Creta, i20, and Verna. Hyundai Motor India’s manufacturing operations are centered in Tamil Nadu, contributing to local economic growth and employment.
Financially, Hyundai Motor India reported trailing twelve months (TTM) revenue of approximately INR 707.63 billion with a gross margin of 25.16%, operating margin of 7.31%, and a net profit margin of 7.68%. The company’s return on equity (ROE) stands at a robust 29.92%, and return on assets (ROA) is 12.40%, indicating efficient use of capital and assets. Its return on invested capital (ROIC) is reflected in an enterprise value to EBITDA ratio of 17.56, suggesting moderate operational efficiency relative to its valuation. However, quarterly earnings growth year-over-year declined by 22.2%, signaling some near-term profitability pressures.
Valuation metrics show a trailing price-to-earnings (P/E) ratio of 28.93 and a forward P/E of 21.80, which are in line with the industry average of 28.93, while the price-to-book (P/B) ratio is elevated at 7.84. The company’s market capitalization is approximately INR 1.55 trillion, with a 52-week price range between INR 1,658 and INR 2,890. The current share price of INR 1,986.60 is closer to the lower end of this range, reflecting a recent 11.45% decline from the peak, which may indicate market caution or valuation recalibration.
Hyundai Motor India’s strengths include strong cash flow generation with operating cash flow of INR 73.21 billion and a healthy cash balance of INR 105.52 billion against relatively low debt of INR 10.98 billion, resulting in a low debt-to-equity ratio of 5.48%. The company also benefits from market leadership in India’s passenger vehicle segment and a well-recognized brand. Key risks involve regulatory challenges, intensifying competition from domestic and international players, and recent operational disruptions such as supplier-related production losses. Recent strategic actions include scheduled earnings calls and continued product innovation, notably in electric and hybrid vehicle segments.
Technically, the stock is trading below its 50-day (INR 1,884) and 200-day (INR 2,147) moving averages, with momentum indicators showing mixed signals across multiple timeframes. Recent news highlights both positive milestones such as the Hyundai i20 crossing 1.5 million cumulative sales and negative developments including production setbacks and share price volatility. Overall, the data suggests a cautious stance with conditions warranting close monitoring of upcoming earnings and market developments for clearer directional cues.
Company and Industry Overview
Company Basics
Price Performance
Company Size
Shareholding Pattern
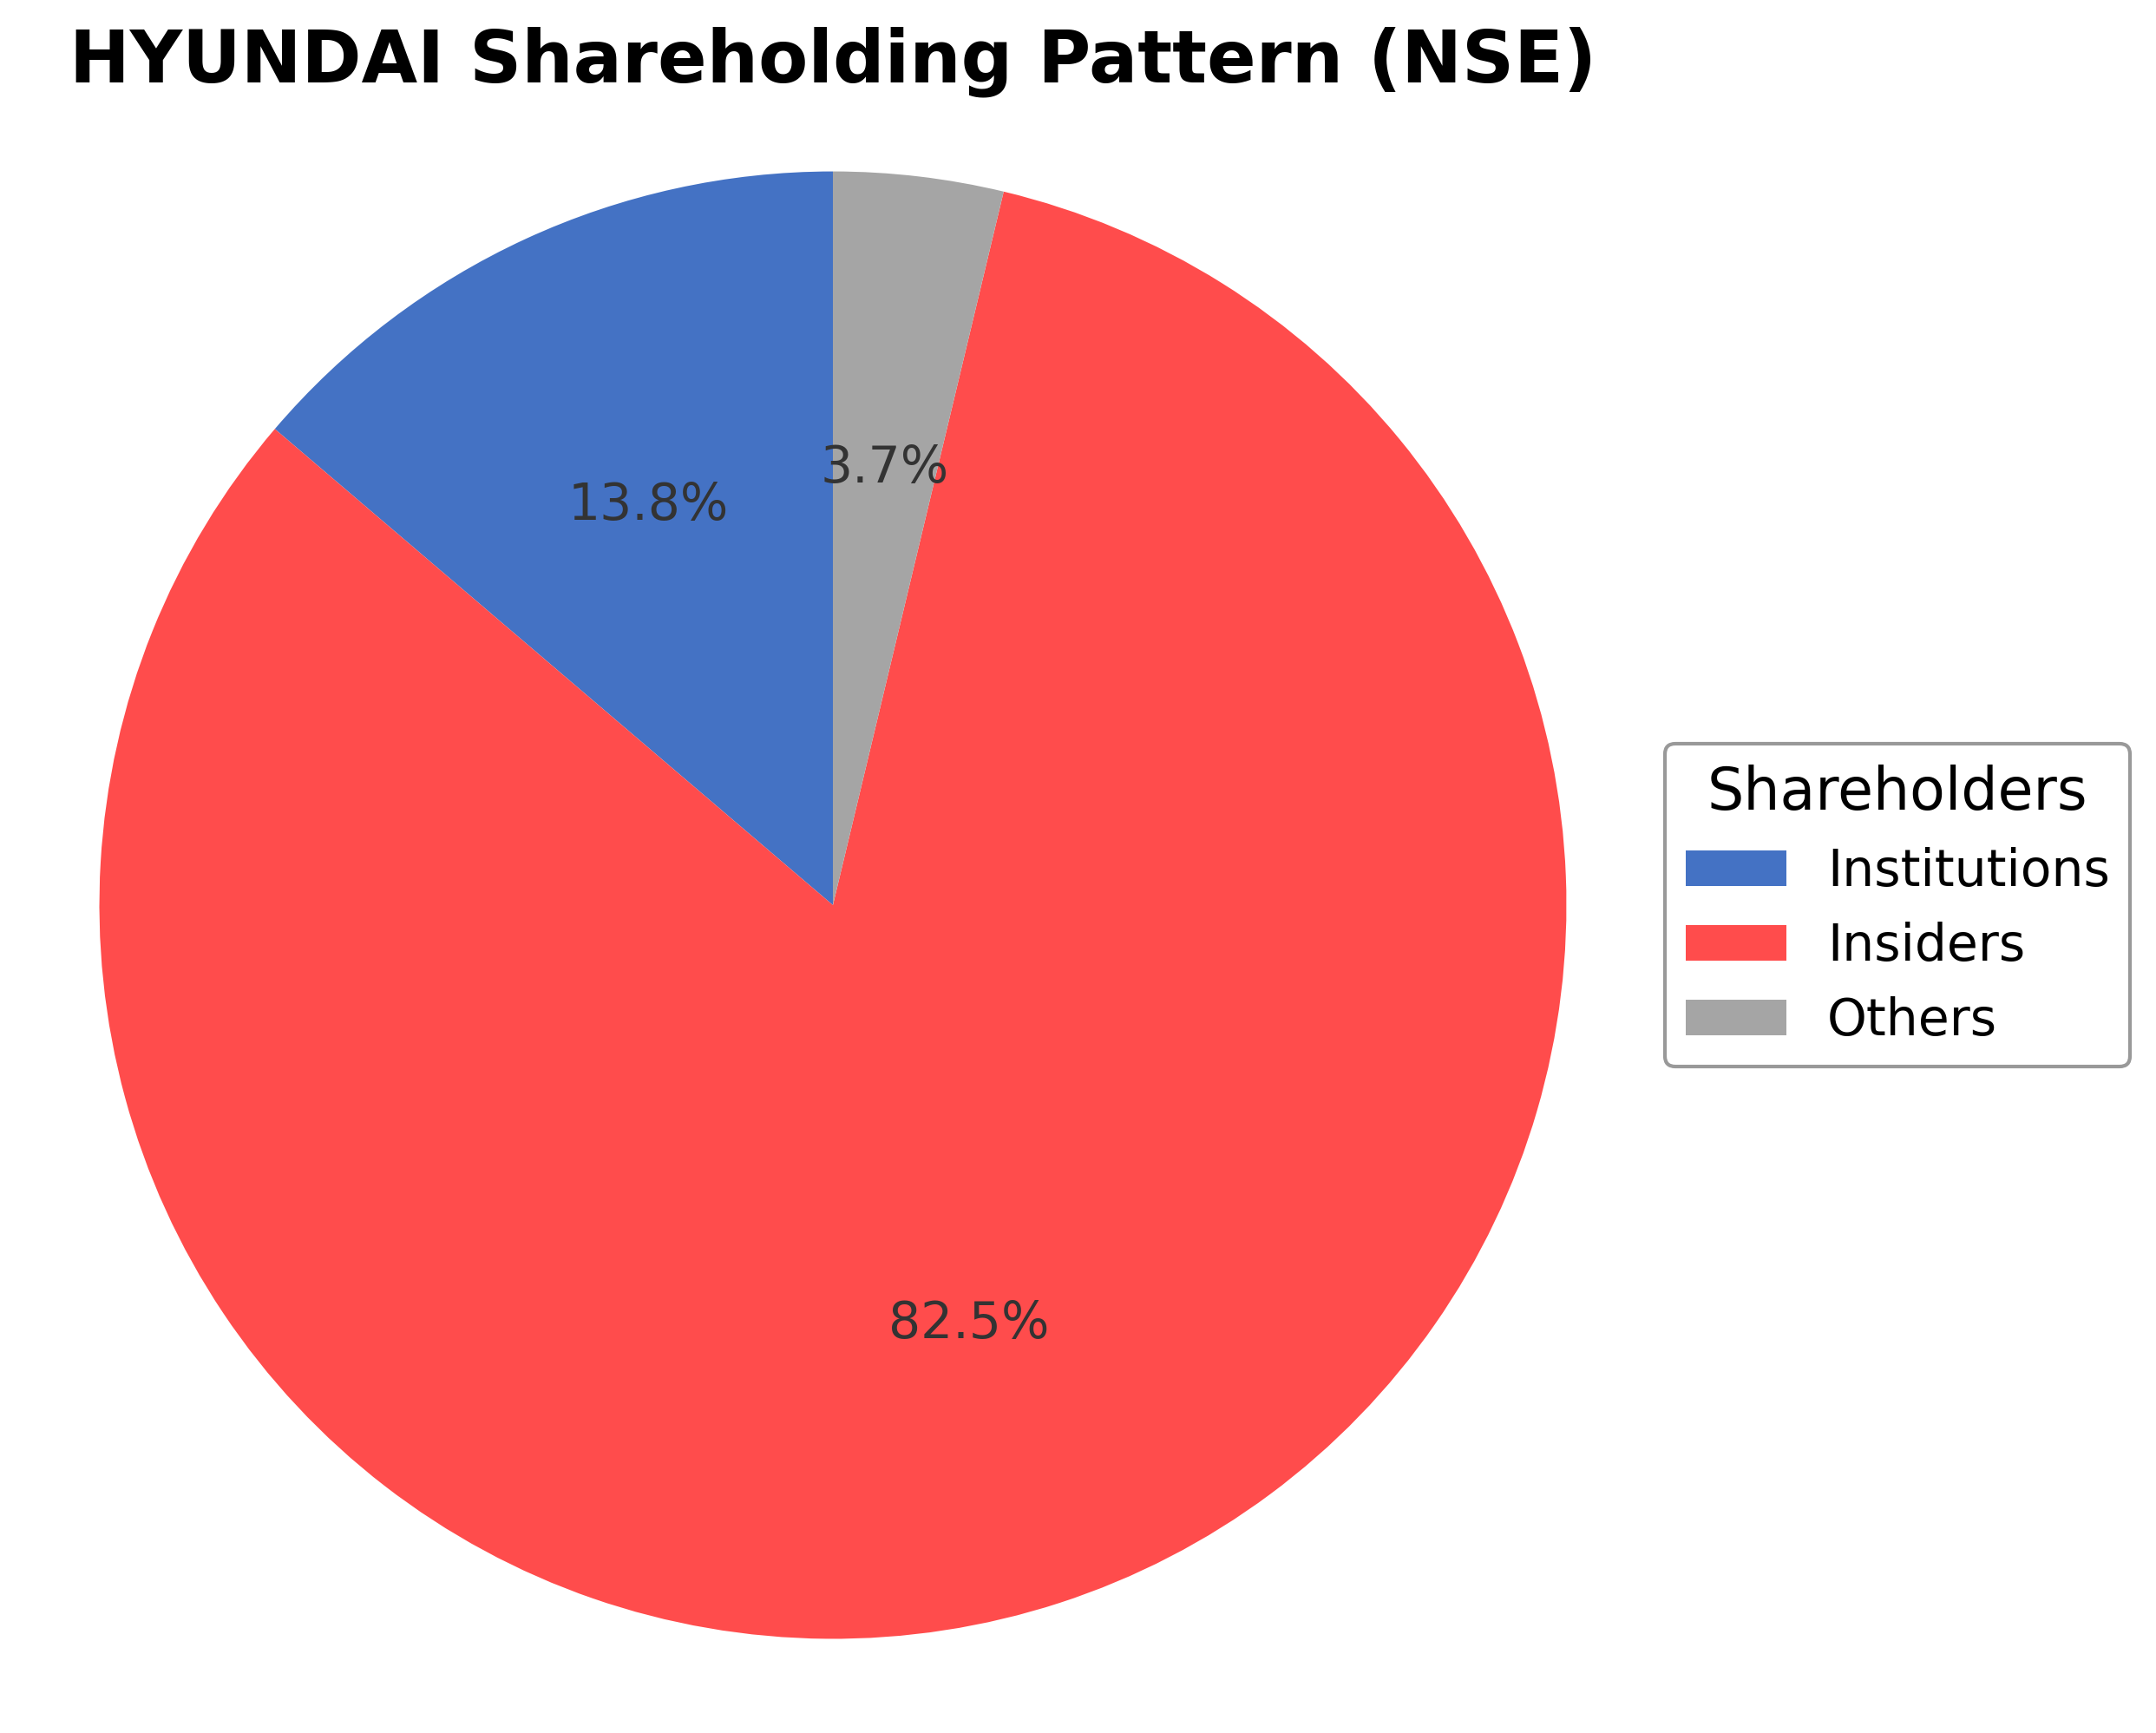
Hyundai Motor India Ltd. exhibits a dominant insider ownership with approximately 82.50% held by promoters including executives and board members, reflecting strong control by the parent Hyundai Motor Company. Institutional investors hold around 13.76%, comprising mutual funds, pension funds, and asset managers, who have maintained a relatively stable position over the past 12-24 months with no significant accumulation or distribution trends reported. The remaining 3.74% is held by public shareholders including retail investors and employee stock plans. This ownership structure indicates a concentrated control with limited public float, which may influence governance and strategic decisions. The stable institutional presence suggests moderate market confidence, while the high promoter stake aligns with long-term strategic alignment in the competitive Indian automotive sector.
Sector and Industry Analysis
The Indian passenger car sector is a significant component of the country's automotive market, with Hyundai Motor India Ltd. being a leading player. The market has shown steady growth, supported by rising consumer incomes and urbanization, with Hyundai projecting increasing unit sales and revenue. Key competitors include Maruti Suzuki, Tata Motors, and Mahindra, all vying for market share in a rapidly expanding environment.
Industry trends highlight a shift towards electric and connected vehicles, with increasing adoption of eMobility solutions and advanced driver assistance systems. The competitive landscape is marked by innovation in fuel efficiency, autonomous driving capabilities, and digital connectivity, creating high barriers to entry due to capital intensity and technology requirements. Hyundai's strong brand presence and investment in new technologies position it well against rivals in this evolving market.
The regulatory environment in India is increasingly focused on emissions standards and safety norms, with the government enforcing Bharat Stage VI emission norms and promoting electric vehicle adoption through incentives. These regulations impact manufacturing processes and product offerings, compelling automakers to accelerate their transition to cleaner technologies. Ongoing policy support for sustainable mobility is expected to shape the industry's growth trajectory and competitive strategies.
Note: Analysis synthesized from industry research, market reports, and regulatory filings. Information is subject to change based on market conditions.
Financial Ratios Dashboard
Illustrative Scenario Analysis
DCF Assumptions:
Method: Two-Stage EPS-Priority Model
Financials
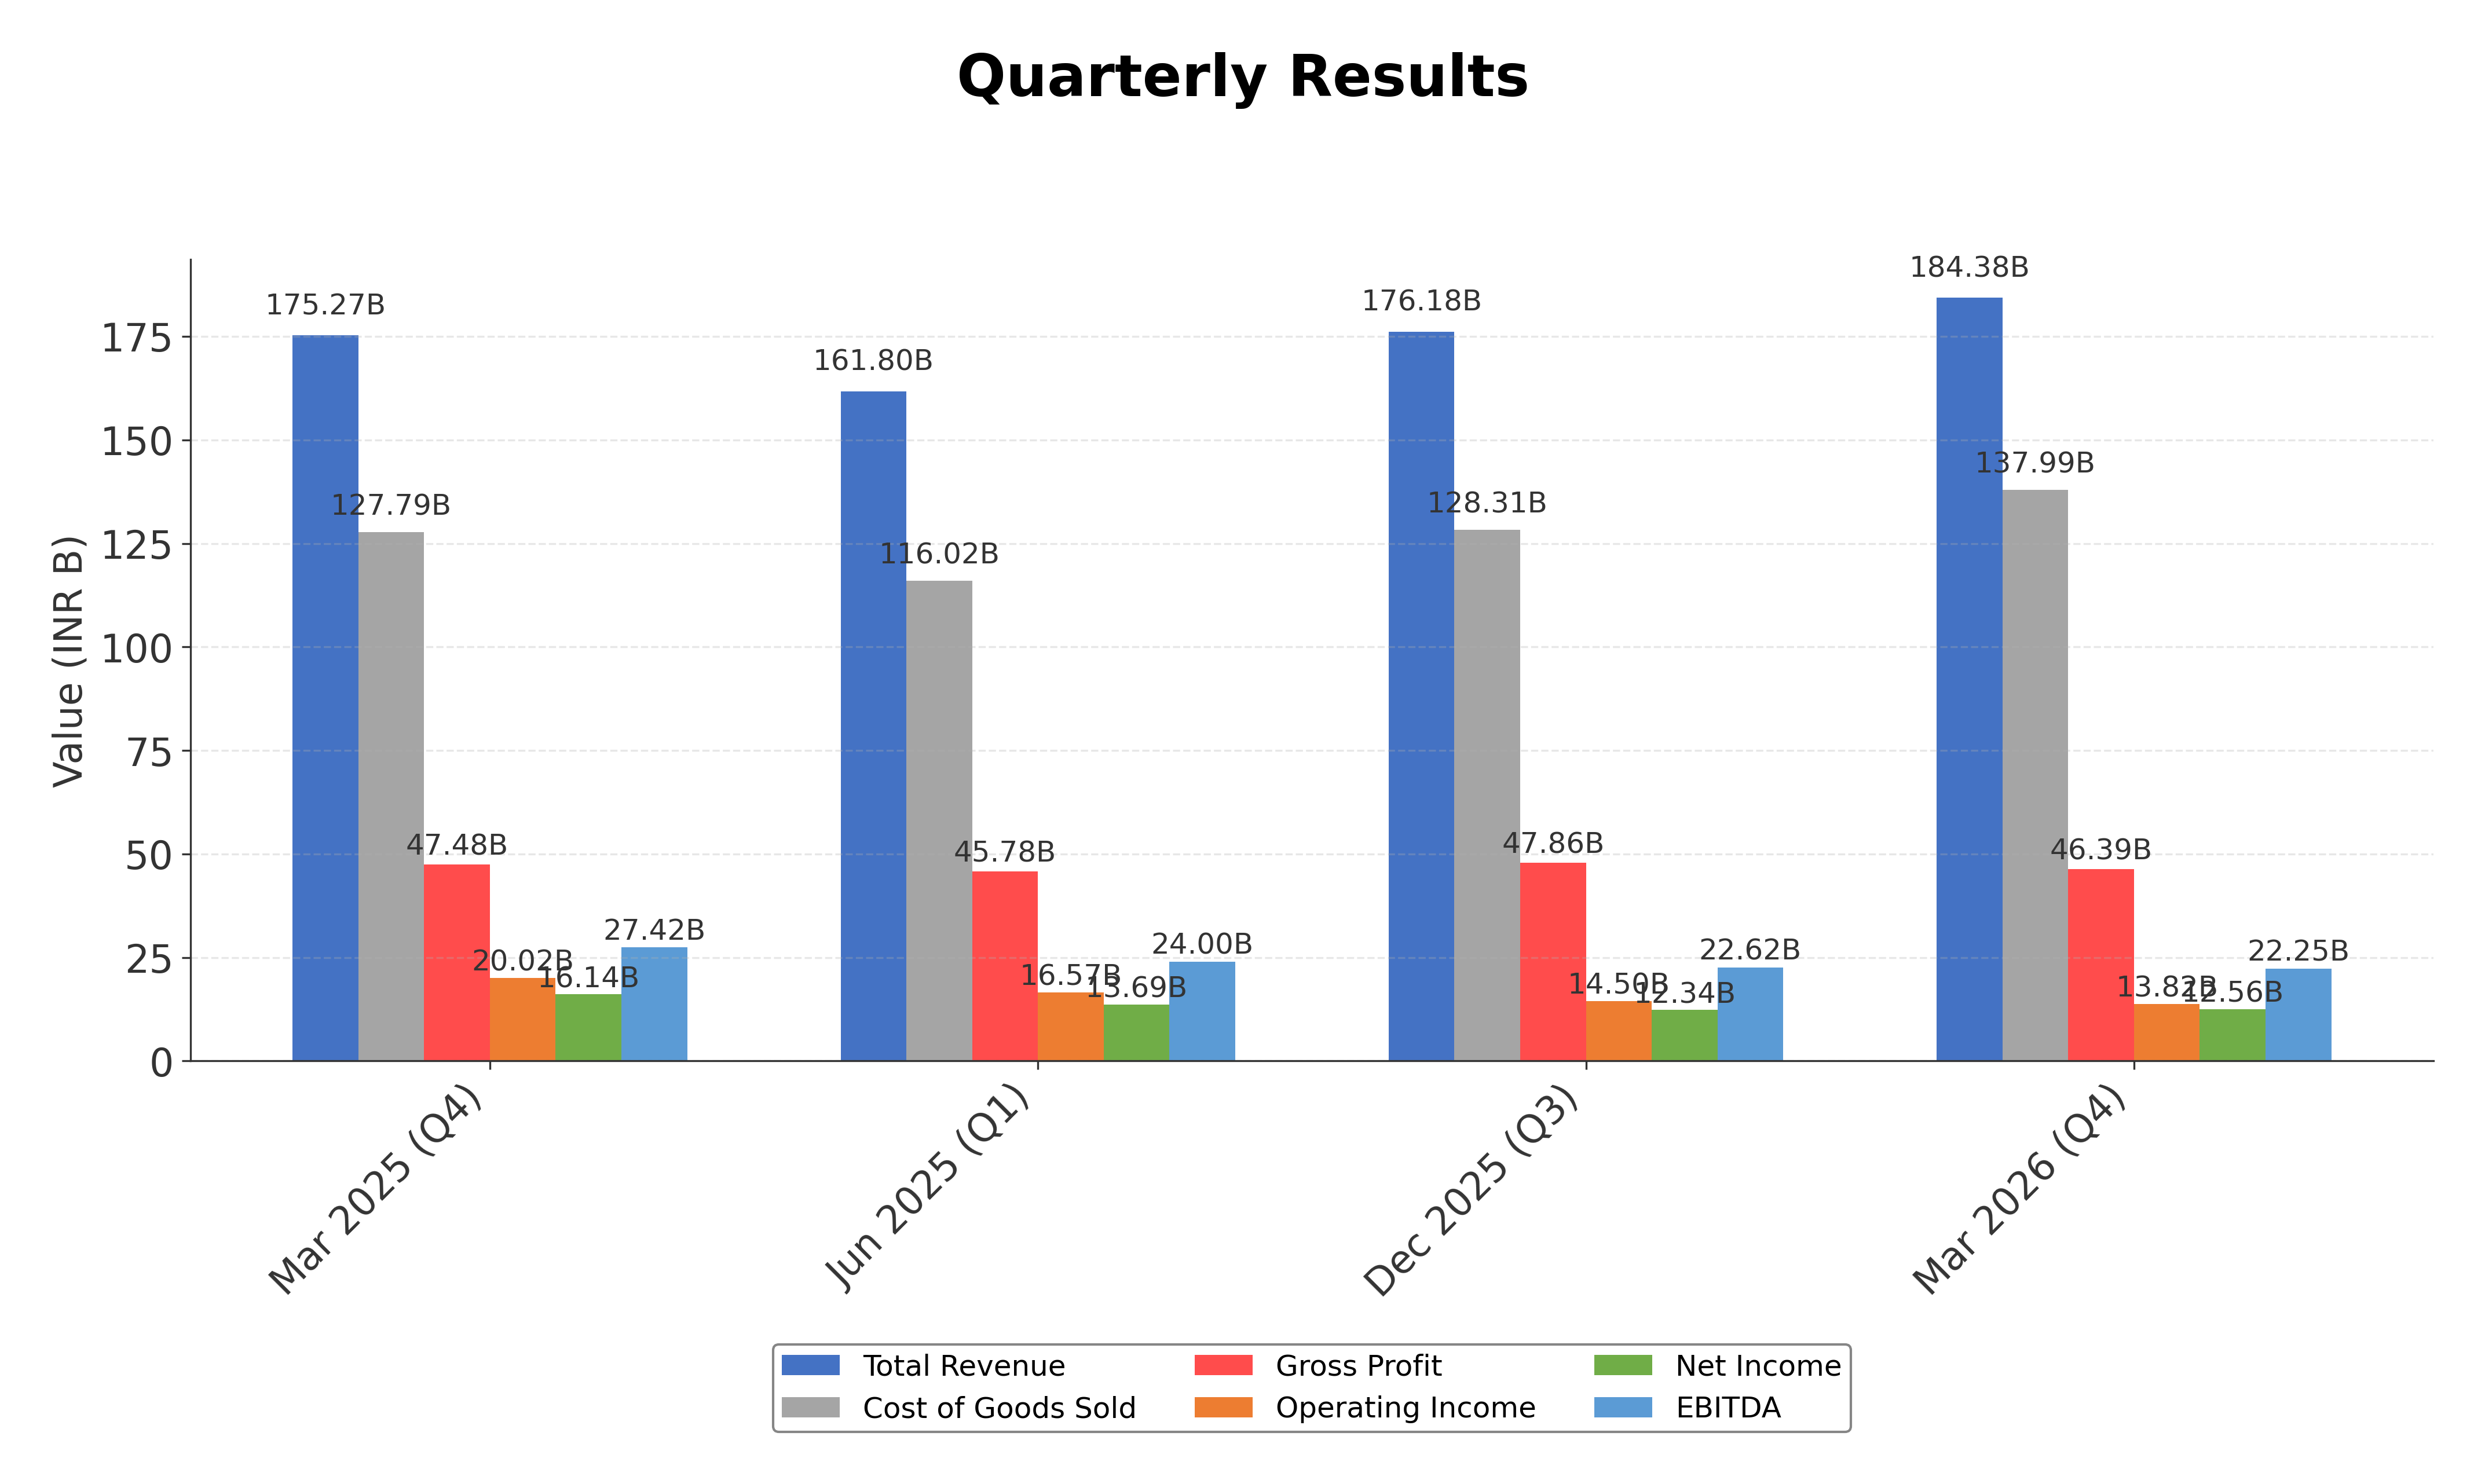
Peer Analysis
| Company Name | Market Cap | P/E Ratio | P/B Ratio | EV/EBITDA | Price to CFO |
|---|---|---|---|---|---|
| Hyundai Motor India Ltd. | ₹1.55T | 28.93 | 7.84 | 17.56 | 21.15 |
| Maruti Suzuki India Limited | ₹4.23T | 28.74 | 3.94 | 18.89 | 22.13 |
| Tata Motors Ltd. | ₹1.19T | 6.66 | 1.29 | 3.99 | 3.67 |
| Mahindra & Mahindra Ltd. | ₹3.70T | 21.04 | 3.84 | 12.28 | 31.78 |
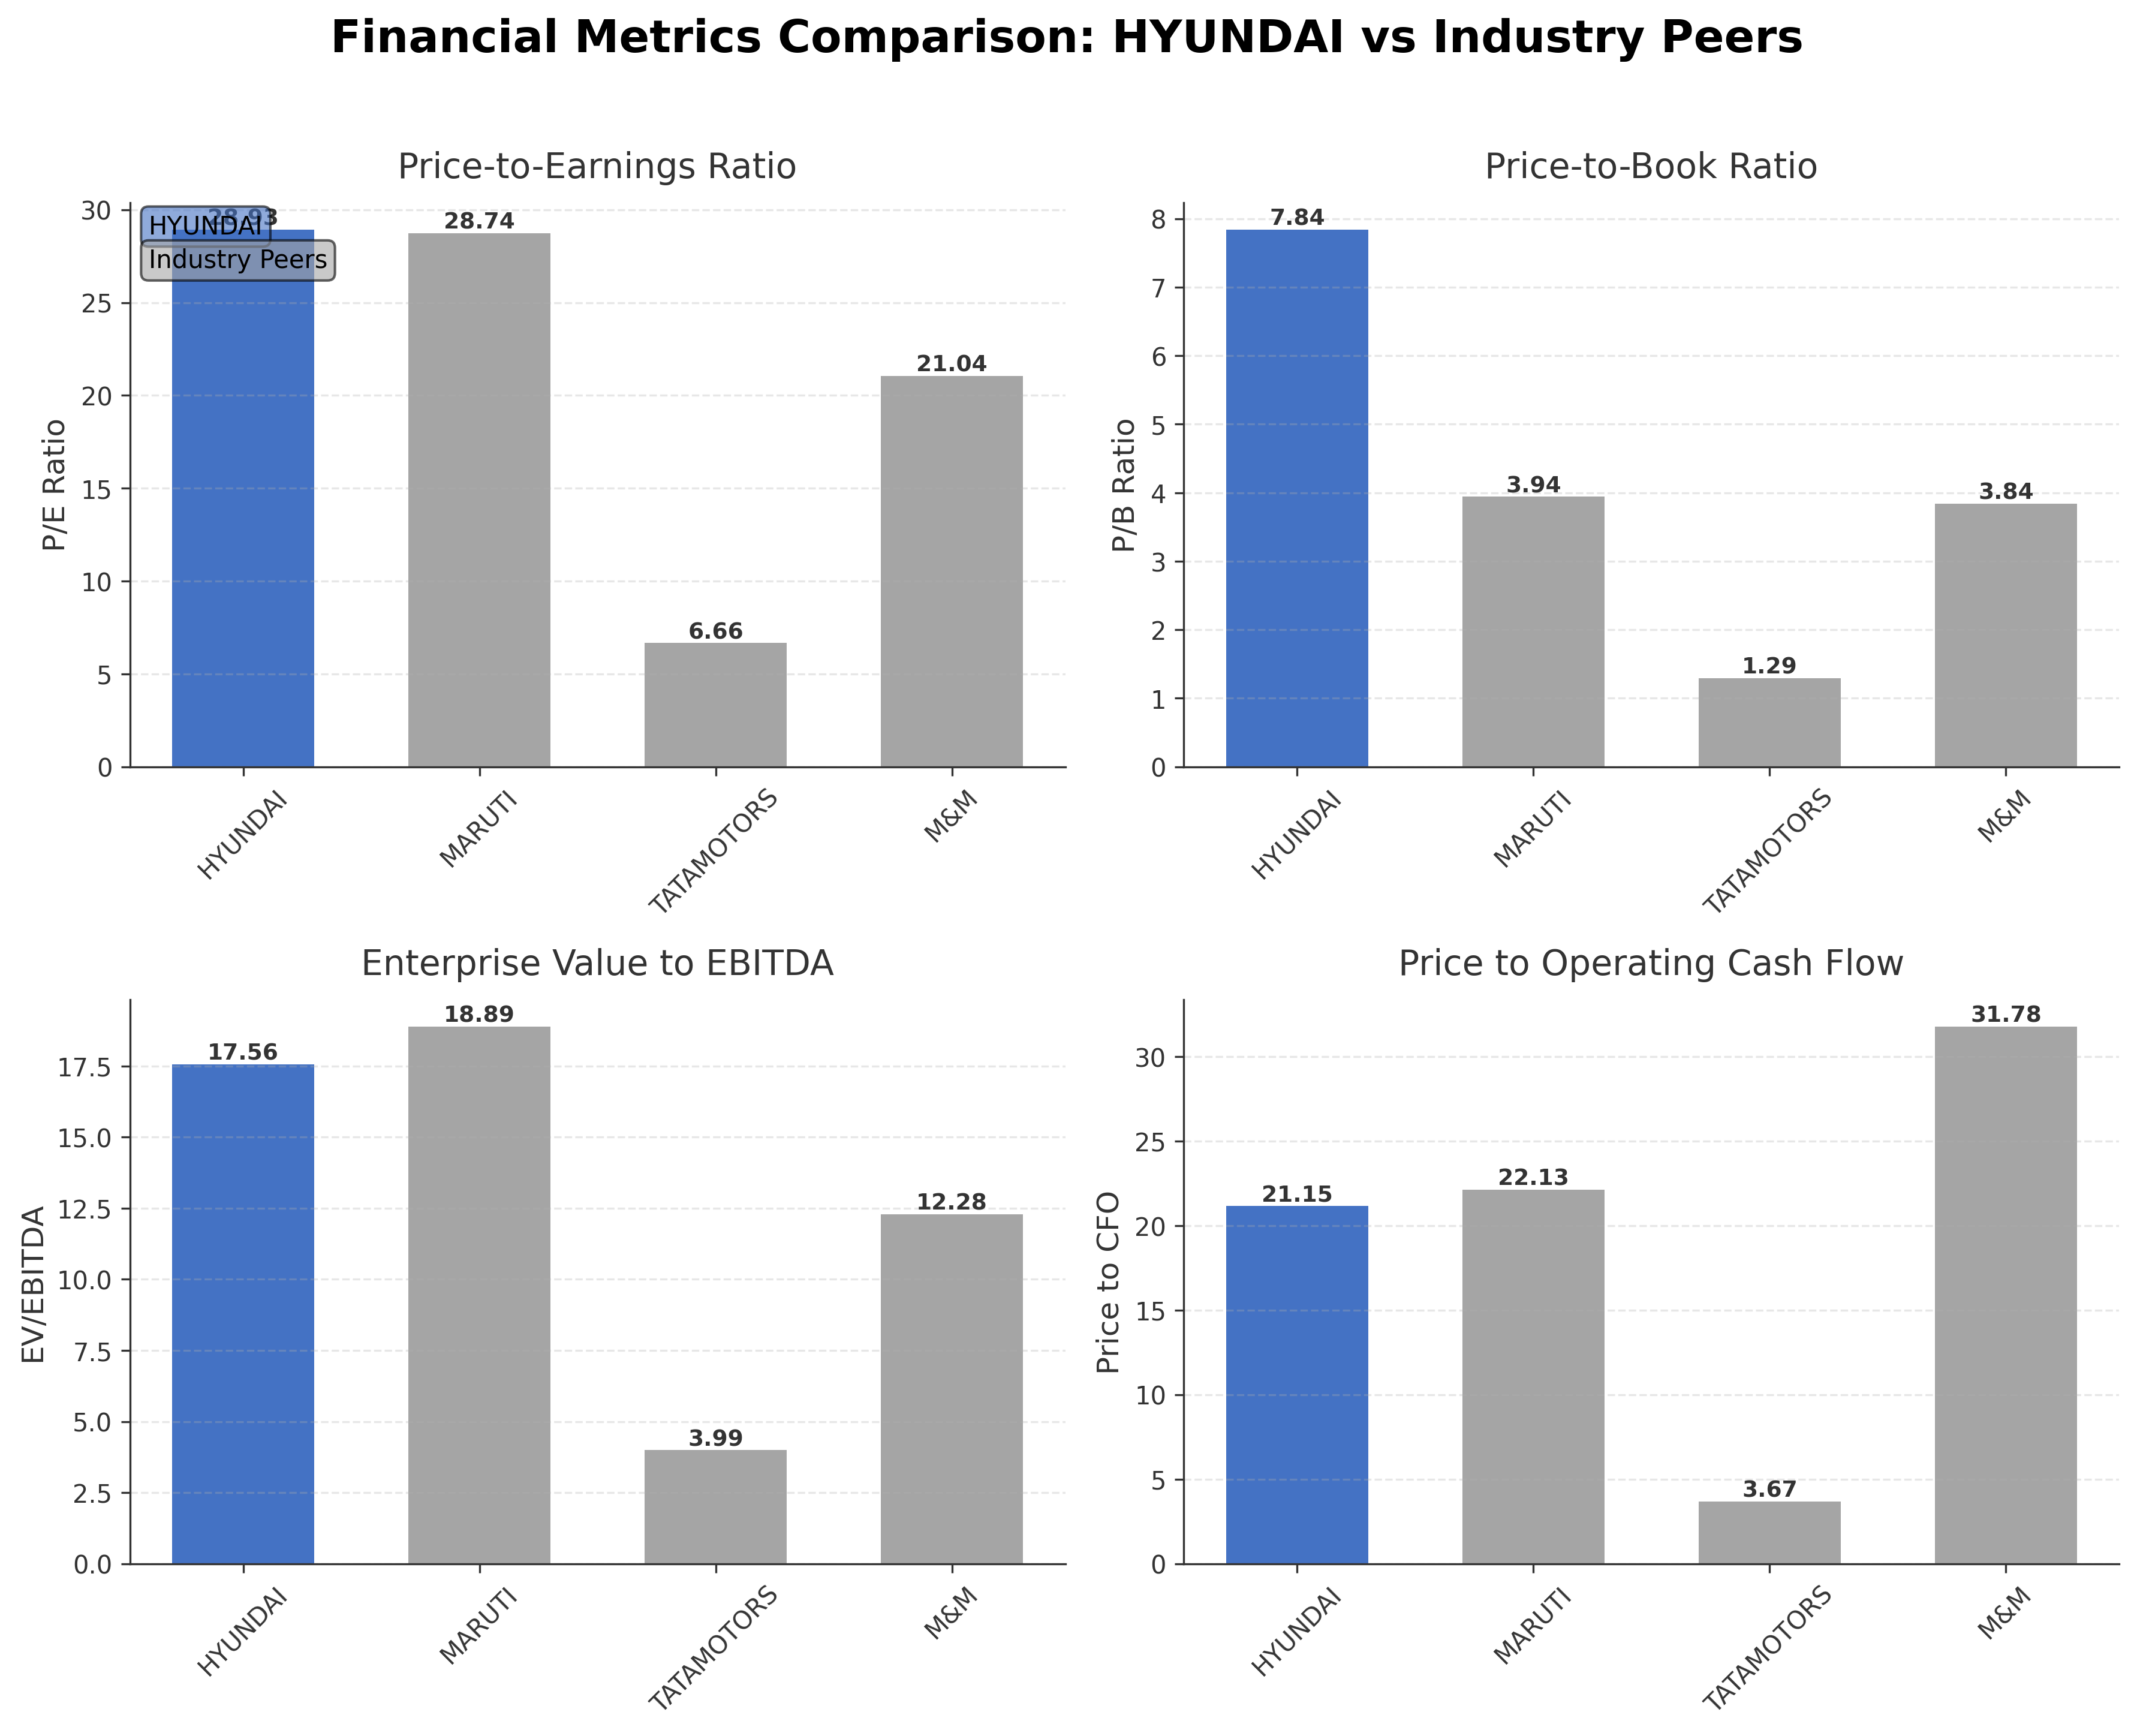
Comparison Analysis: Hyundai Motor India Ltd. trades at a higher P/E ratio of 28.93 compared to peers Tata Motors (6.66) and Mahindra & Mahindra (21.04), indicating a premium valuation relative to earnings. Its P/B ratio of 7.84 is significantly above the peer group average, reflecting market expectations of strong brand value and growth prospects. The EV/EBITDA multiple of 17.56 is moderate but higher than Tata Motors’ 3.99 and Mahindra’s 12.28, suggesting relatively higher operational valuation. Hyundai’s return on equity at 29.92% outperforms all listed peers, highlighting superior profitability and capital efficiency. Price to CFO at 21.15 is in line with Maruti Suzuki but higher than Tata Motors, indicating robust cash flow generation but also a premium market pricing.
Financial Metrics Comparison with Peers
Financial Statements
Comprehensive financial data including income, balance sheet, and cash flow metrics
Income Statement
| fiscal_date | 2026-03-31 | 2025-03-31 | 2024-03-31 | 2023-03-31 | 2022-03-31 |
|---|---|---|---|---|---|
| Sales | 693.91B | 679.42B | 685.90B | 591.03B | 464.61B |
| Cost Of Goods | 504.81B | 499.29B | 515.39B | 450.98B | 359.07B |
| Gross Profit | 189.10B | 180.13B | 170.51B | 140.05B | 105.54B |
| Operating Expense Other Operating Expenses | 89.37B | 79.99B | 71.82B | 29.89B | 22.65B |
| Operating Income | 64.00B | 68.48B | 69.25B | 53.64B | 33.22B |
| Non Operating Interest Expense | 1.06B | 1.27B | 1.58B | 1.42B | 1.32B |
| Pretax Income | 72.43B | 75.91B | 82.40B | 63.46B | 37.72B |
| Income Tax | 18.12B | 19.51B | 21.80B | 16.36B | 8.71B |
| Net Income | 54.32B | 56.40B | 60.60B | 47.09B | 29.02B |
| Eps Basic | 66.85 | 69.41 | 74.58 | 57.96 | 35.71 |
| Eps Diluted | 66.85 | 69.41 | 74.58 | 57.96 | 35.71 |
| Basic Shares Outstanding | 812.49M | 812.59M | 812.54M | 812.54M | 812.54M |
| Diluted Shares Outstanding | 812.49M | 812.59M | 812.54M | 812.54M | 812.54M |
| Ebit | 73.50B | 77.19B | 83.98B | 64.88B | 39.04B |
| Ebitda | 95.48B | 98.24B | 106.06B | 86.83B | 60.79B |
| Net Income Continuous Operations | 54.32B | 56.40B | 60.60B | 47.09B | 29.02B |
| Preferred Stock Dividends | 0.00 | 0.00 | 0.00 | 0.00 | 0.00 |
| Operating Expense Selling General And Administrative | N/A | 40.77B | 30.99B | 28.65B | 20.36B |
| Non Operating Interest Income | N/A | 6.16B | 12.50B | 9.23B | 4.46B |
Data provided by Twelve Data
Balance Sheet
| fiscal_date | 2026-03-31 | 2025-03-31 | 2024-03-31 | 2023-03-31 | 2022-03-31 |
|---|---|---|---|---|---|
| Cash And Cash Equivalents | 87.12B | 48.46B | 9.73B | 177.41B | 141.39B |
| Accounts Receivable | 21.94B | 23.89B | 25.10B | 28.97B | 21.82B |
| Total Assets | 344.04B | 300.97B | 263.49B | 345.73B | 283.58B |
| Total Liabilities | 143.89B | 138.01B | 156.84B | 145.19B | 115.02B |
| Long Term Debt | 5.35B | 5.83B | 6.79B | 7.33B | 7.97B |
| Shareholders Equity | 200.15B | 162.96B | 106.66B | 200.55B | 168.56B |
Data provided by Twelve Data
Cash Flow Statement
| fiscal_date | 2026-03-31 | 2025-03-31 | 2024-03-31 | 2023-03-31 | 2022-03-31 |
|---|---|---|---|---|---|
| Operating Activities Net Income | 54.32B | 56.40B | 60.60B | 47.09B | 29.02B |
| Operating Activities Other Non Cash Items | -3.88B | -4.97B | -11.00B | -8.08B | -3.67B |
| Operating Activities Accounts Receivable | 2.25B | 1.08B | 4.61B | -7.73B | 2.96B |
| Operating Activities Other Assets Liabilities | -6.37B | -26.11B | 17.29B | -2.91B | 7.01B |
| Operating Activities Operating Cash Flow | 46.32B | 26.41B | 71.50B | 28.38B | 35.31B |
| Investing Activities Capital Expenditures | -42.52B | -52.93B | -32.32B | -22.49B | -12.54B |
| Investing Activities Purchase Of Investments | -41.96B | -88.40B | -270.15B | -1.04M | 0.00 |
| Investing Activities Sale Of Investments | 60.07B | 128.89B | 193.11B | 0.00 | 0.00 |
| Investing Activities Investing Cash Flow | -24.41B | -12.44B | -109.36B | -22.49B | -12.54B |
| Financing Activities Long Term Debt Payments | -5.47B | -6.85B | -10.08B | -16.96B | -13.17B |
| Financing Activities Short Term Debt Issuance | 2.95B | 1.17B | -3.29B | 746.37M | -1.62B |
| Financing Activities Common Dividends | -17.06B | N/A | -154.36B | -14.93B | -13.59B |
| Financing Activities Financing Cash Flow | -19.58B | -5.69B | -167.72B | -31.15B | -28.38B |
| End Cash Position | 87.12B | 48.46B | 9.73B | 177.41B | 141.39B |
| Free Cash Flow | 30.55B | -9.62B | 60.06B | 43.03B | 38.73B |
| Financing Activities Long Term Debt Issuance | N/A | N/A | N/A | 0.00 | N/A |
Data provided by Twelve Data
Technical Analysis
Key Insights
- Current trend shows the stock trading below its 50-day moving average of ₹1,884 and 200-day moving average of ₹2,147, indicating a short to medium-term bearish momentum.
- Key support levels are identified near ₹1,658 (52-week low) and ₹1,800, while resistance is observed around ₹2,100 and ₹2,890 (52-week high).
- The stock price is below the 10-day, 50-day, and 200-day moving averages, suggesting downward pressure across multiple time horizons.
- Momentum indicators such as RSI are near oversold levels, while MACD shows weakening bullish crossover potential; stochastic oscillators indicate possible short-term consolidation.
- Daily and weekly charts confirm a bearish trend with lower highs and lower lows, whereas monthly charts show longer-term support around ₹1,600-₹1,700.
- Potential market scenarios include continued consolidation near support levels or a rebound if momentum indicators improve; failure to hold support could lead to further downside.
Trending News
1. Headline: Stock Market Live: Sensex rises 670 pts, Nifty at 23,960; Eternal, IndiGo, Infosys top gainers | Moneycontrol News
Summary: Sensex Today | Stock Market Live: Sensex and Nifty traded higher in the afternoon trade on Monday, amid buying across the sectors. At 13:47 hrs IST, the Sensex was up 652.49 points or 0.86 percent at 76,712.26, and the Nifty was up 189.50 points or 0.80 percent at 23,956.95.
Sentiment: positive
Summary: Hyundai Motor Share Price: Find the latest news on Hyundai Motor Stock Price. Get all the information on Hyundai Motor with historic price charts for NSE / BSE. Experts & Broker view also get the Hyundai Motor Ltd. buy/sell tips detailed news, announcements, Forecasts, Analysts, Valuation, ...
Sentiment: neutral
3. Headline: Hyundai i20 crosses 1.5 million cumulative sales in India, ETAuto
Summary: Hyundai I20: The premium hatchback hit the milestone nearly two decades after its 2008 debut, spanning three generations and multiple variants.
Sentiment: neutral
Summary: PepsiCo bottler Varun Beverages, multinational port operator Adani Ports and Special Economic Zone, steel producer Tata Steel, automobile company Mahindra and Mahindra, cigarette manufacturer ITC, battery maker Exide Industries, home loan provider Bajaj Housing Finance, and railway projects ...
Sentiment: neutral
5. Headline: Hyundai Motor India schedules Q1FY27 earnings call on July 30
Summary: Hyundai Motor India Limited is holding an earnings call on July 30, 2026, to discuss Q1FY27 results. The session begins at 4:30 PM IST and includes dial-in options for domestic and international participants. No UPSI will be disclosed during the proceedings.
Sentiment: neutral
Powered by Brave
Recent Updates
News Summary
As of July 30, 2026. Hyundai Motor India Limited has scheduled its Q1FY27 earnings call for July 30, 2026, to discuss quarterly financial results with investors and analysts. The company reaffirmed its commitment to transparency by ensuring no unpublished price sensitive information will be shared during the call. Additionally, the Hyundai i20 model has reached a cumulative sales milestone of 1.5 million units in India, underscoring the brand’s strong market acceptance in the premium hatchback segment. These developments reflect ongoing operational focus and product strength amid a competitive automotive market landscape.
News Sentiment
The overall sentiment from recent updates is neutral, balancing positive product milestones with cautious anticipation of upcoming earnings results. The milestone achievement of the Hyundai i20 indicates sustained consumer demand, while the scheduled earnings call signals proactive investor engagement. No significant negative news or regulatory challenges were reported in the recent updates, supporting a stable outlook in the near term.
Source List
- https://scanx.trade/stock-market-news/companies/hyundai-motor-india-schedules-q1fy27-earnings-call-on-july-30/46420897
- https://auto.economictimes.indiatimes.com/news/passenger-vehicle/hyundai-i20-crosses-1-5-million-cumulative-sales-in-india/132606130
Analytical Overview
Analysis Summary
Hyundai Motor India’s valuation metrics, including a trailing P/E of 28.93 and forward P/E of 21.80, are aligned with the industry average of 28.93, indicating the stock is priced in line with sector peers. The PEG ratio of 3.56 suggests that growth expectations are factored into the current valuation, though it may imply a premium for anticipated future earnings growth.
The company’s revenue growth rate of 4.8% and operating cash flow of INR 73.21 billion demonstrate a stable growth trajectory supported by strong cash generation. However, a year-over-year quarterly earnings decline of 22.2% highlights some near-term profitability challenges that require monitoring.
Financial health appears solid with a low debt-to-equity ratio of 5.48% and a substantial cash reserve of INR 105.52 billion, providing liquidity and flexibility. The operating cash flow to debt ratio supports the company’s ability to service liabilities comfortably.
Sector-specific challenges include intensifying competition from domestic and international automakers and regulatory pressures related to emissions and safety standards. Opportunities arise from increasing demand for hybrid and electric vehicles in India, where Hyundai is actively innovating.
Considering India-specific factors, the regulatory environment is evolving with stricter emission norms and incentives for electric vehicles, which Hyundai is positioned to capitalize on given its product portfolio. Consumer trends favoring SUVs and premium hatchbacks align well with Hyundai’s offerings, supporting sustained demand.
Overall Business and Market Assessment
Supporting Factors: Hyundai’s strong market position in India, robust cash flow generation, and alignment with evolving consumer preferences toward premium and eco-friendly vehicles
Risk Factors: near-term earnings volatility, competitive pressures, and operational disruptions such as supplier-related production losses
SWOT Analysis
Strengths
- Strong market leadership in the Indian passenger vehicle segment.
- Robust return on equity of 29.92% indicating efficient capital utilization.
- Healthy cash reserves of INR 105.52 billion supporting liquidity.
- Diverse product portfolio including popular models like Creta, i20, and Verna.
Weaknesses
- Elevated price-to-book ratio of 7.84 indicating premium valuation.
- Quarterly earnings growth declined by 22.2% year-over-year.
- Relatively low institutional ownership at 13.76%, limiting broader market participation.
- Production disruptions due to supplier-related incidents impacting sales.
Opportunities
- Growing demand for hybrid and electric vehicles in the Indian market.
- Favorable regulatory incentives for environmentally friendly vehicles.
- Expansion potential in suburban and urban consumer segments.
- Innovation in vehicle technology aligning with global sustainability trends.
Threats
- Intensifying competition from domestic and international automakers.
- Regulatory challenges related to emissions and safety standards.
- Supply chain risks including production losses from supplier incidents.
- Macroeconomic factors affecting consumer spending and auto sales.
Company Description
Hyundai Motor India Ltd. is a prominent automobile manufacturer serving the Indian market, recognized for its diverse range of passenger vehicles. As a subsidiary of the South Korean Hyundai Motor Company, it plays a pivotal role in catering to the dynamic demands of the Indian automotive sector. The company's lineup includes compact cars, sedans, SUVs, and hybrid models, reflecting a commitment to innovation and quality. Key models include the Hyundai Creta, i20, and Verna, which are popular among urban and suburban consumers alike. Hyundai Motor India Ltd. focuses on integrating cutting-edge technology and sustainability in vehicle design, aligning with global environmental standards. It operates a notable manufacturing facility in Tamil Nadu, contributing significantly to local employment and economic growth. Hyundai's dominance in the Indian market underscores its ability to adapt to consumer preferences and capitalize on the expanding demand for efficient and reliable transportation solutions. The brand is synonymous with reliability and modernity, marking its significance in shaping India's automotive landscape.