
Hyundai Motor India Ltd (HYUNDAI)
Stock Analysis Report
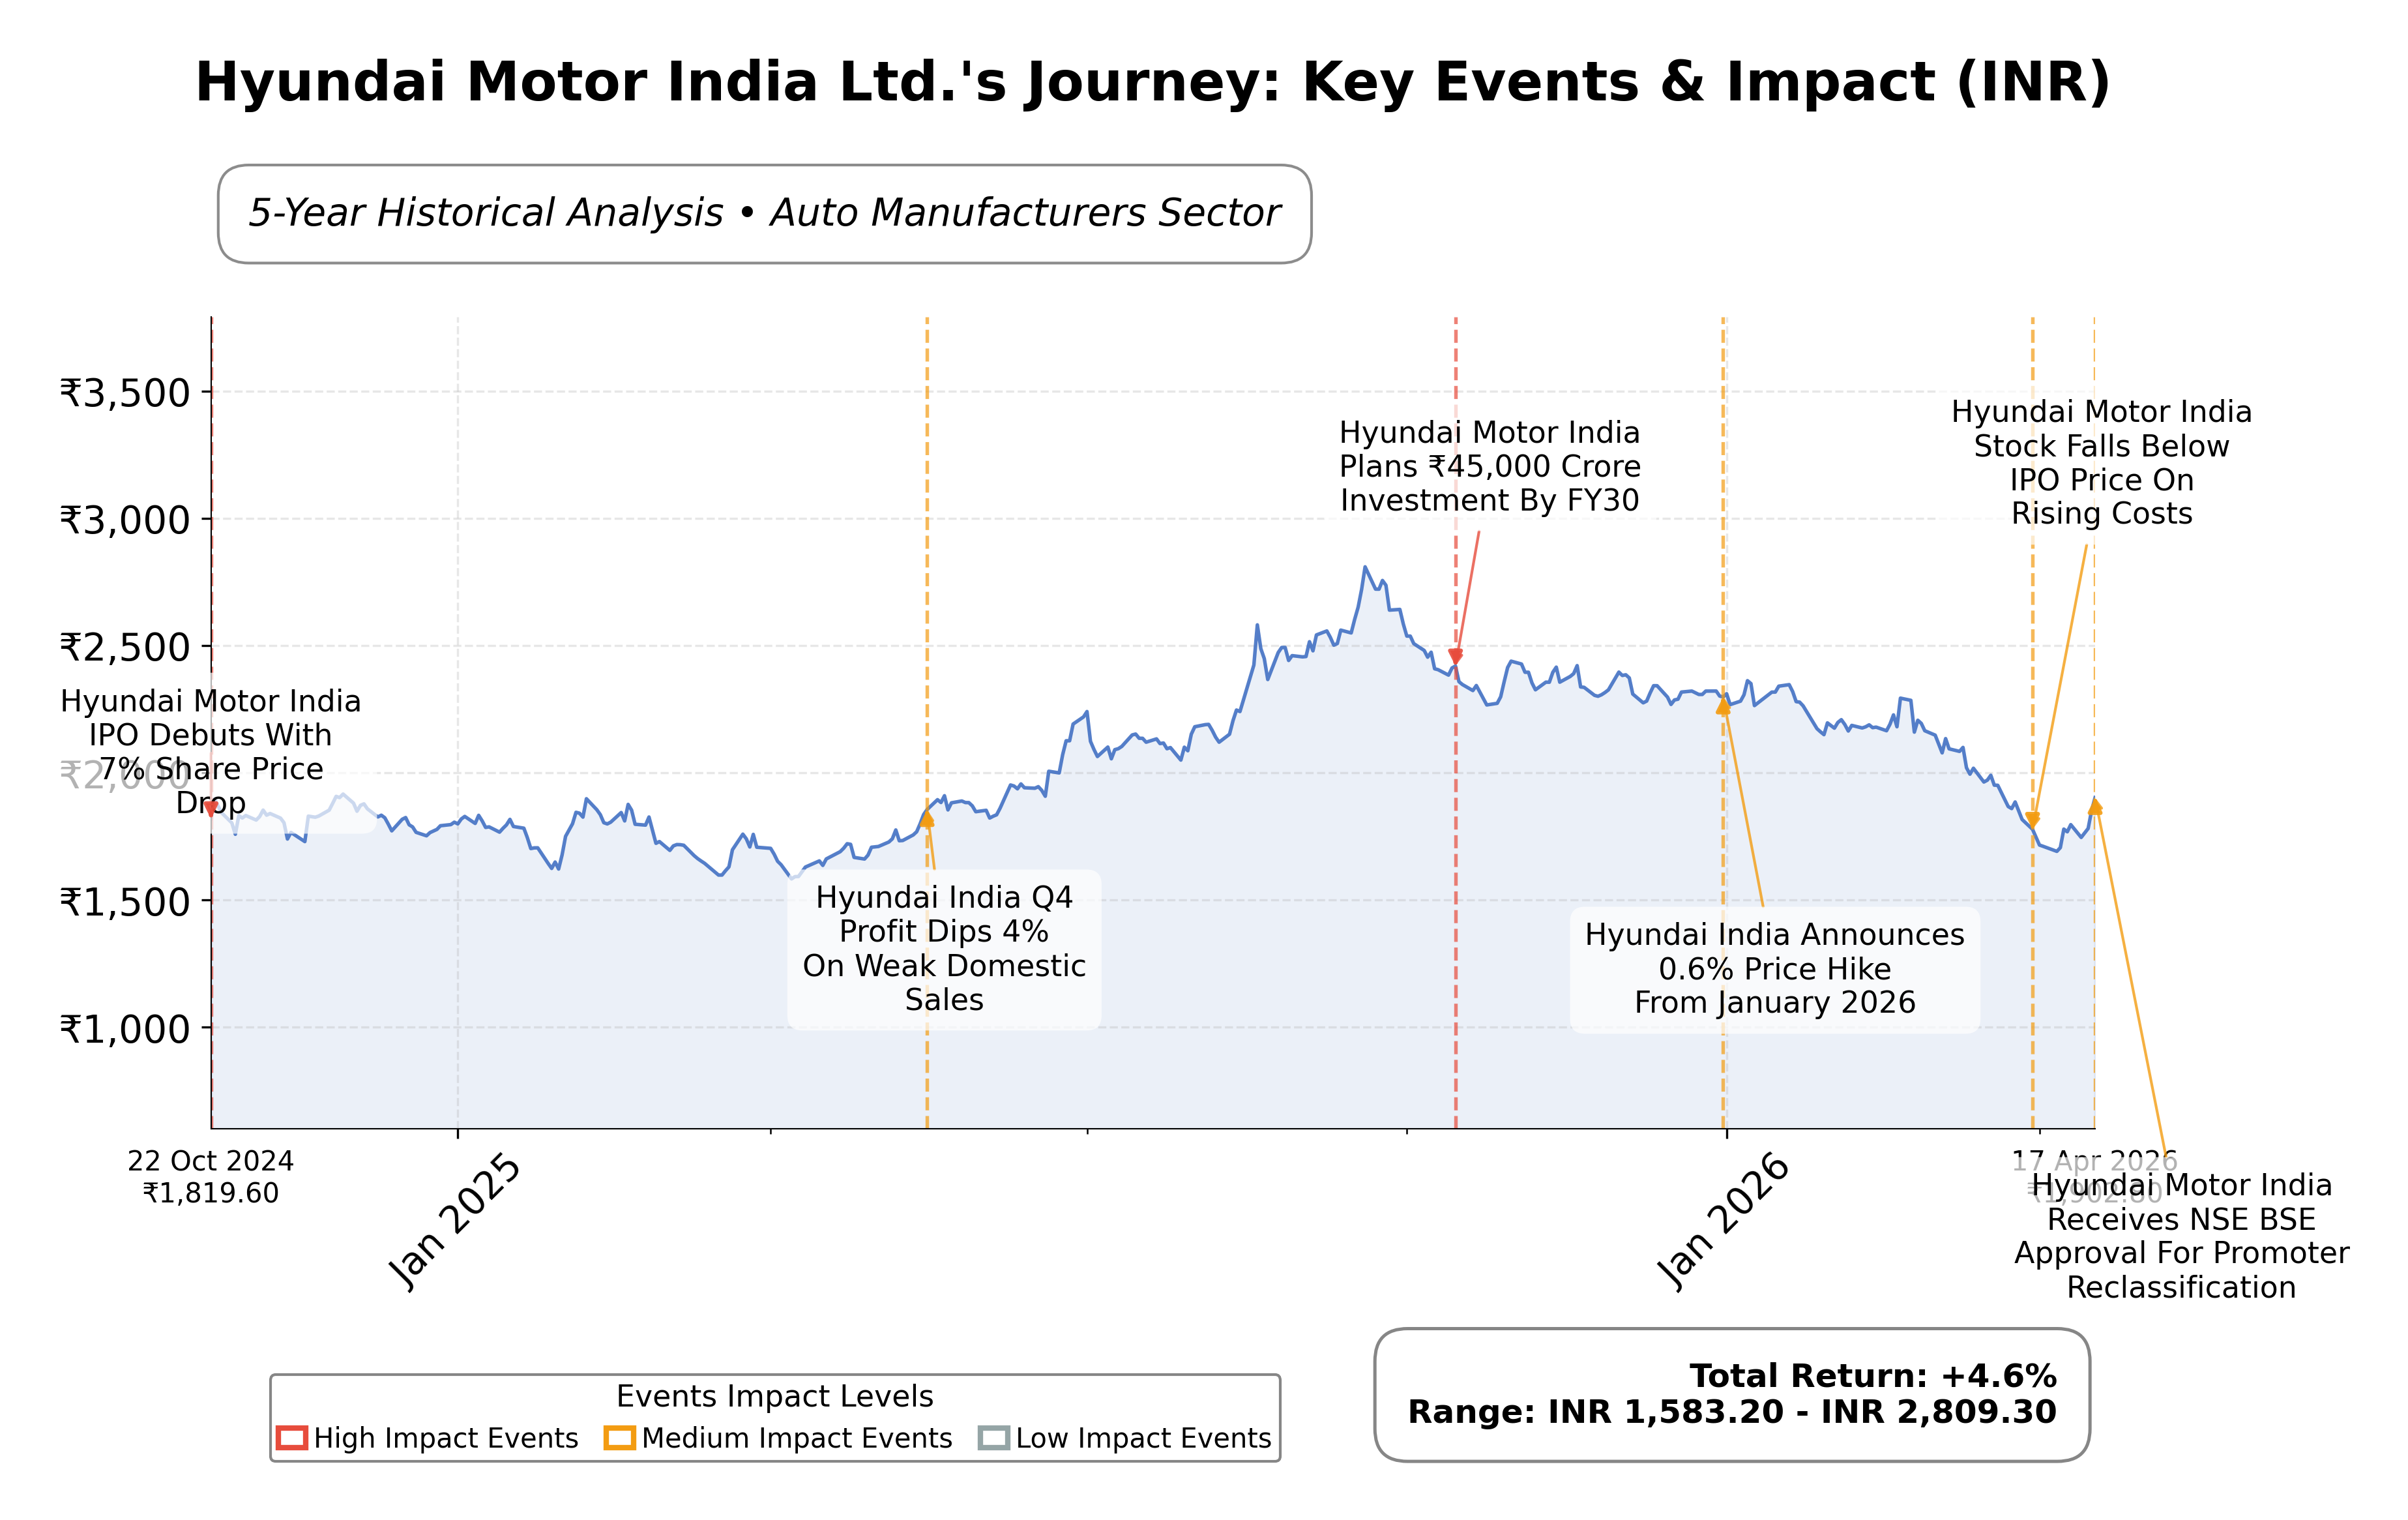
Stock Journey
Key Positives and Key Risks
Pros
- High return on equity at 34.61% indicating strong profitability and efficient capital use.
- Robust free cash flow generation of ₹56.4 billion supporting financial flexibility and growth.
- Market capitalization of ₹1.78 trillion reflects significant scale and market presence.
Cons
- Price to cash flow ratio of 67.52 suggests a premium valuation relative to cash generation.
- Price to book ratio of 10.15 is substantially higher than industry peers, indicating potential overvaluation.
- Downside risk of approximately 52% from current price to 52-week high indicates significant price volatility.
Disclosure: This information is for general awareness and does not constitute investment advice
Report Summary
Hyundai Motor India Ltd. is a leading automobile manufacturer listed on the National Stock Exchange of India (NSE) under the Consumer Cyclical sector. As a subsidiary of the South Korean Hyundai Motor Company, it offers a broad portfolio of passenger vehicles including compact cars, sedans, SUVs, and hybrid models. The company operates a significant manufacturing facility in Tamil Nadu and holds a strong market position in India with popular models like the Creta, i20, and Verna. Hyundai Motor India Ltd. is recognized for integrating advanced technology and sustainability in its vehicles, catering to both domestic and export markets.
Financially, Hyundai Motor India reported trailing twelve months (TTM) revenue of approximately ₹698.9 billion with a gross margin of 27.17%, operating margin of 8.06%, and net profit margin of 8.29%. The company demonstrates robust profitability and operational efficiency, reflected in a return on equity (ROE) of 34.61%, return on assets (ROA) of 18.74%, and a return on invested capital (ROIC) of 8.0% for the recent quarter. These metrics indicate strong capital utilization and earnings generation relative to equity and assets.
Valuation metrics show a trailing price-to-earnings (P/E) ratio of 30.79 and a forward P/E of 27.25, with a price-to-book (P/B) ratio of 10.15 and an enterprise value to EBITDA (EV/EBITDA) multiple of 18.79. The market capitalization stands at approximately ₹1.78 trillion. The stock price currently trades at ₹1,902.80, within a 52-week range of ₹1,541.70 to ₹2,890.00, suggesting the stock is positioned below its recent highs. The PEG ratio is negative at -1.80, reflecting growth expectations relative to earnings.
Hyundai Motor India’s strengths include strong cash flow generation with operating cash flow of ₹26.4 billion and free cash flow of ₹56.4 billion, low debt levels with a total debt to equity ratio of 4.89%, and market leadership in the Indian automotive sector. Key risks involve regulatory compliance, competitive pressures from domestic and international automakers, and commodity price volatility impacting margins. Recent strategic developments include regulatory approval for promoter group reclassification and expansion initiatives by the parent group in India and Southeast Asia.
Technically, the stock is trading near its 50-day and 200-day moving averages at approximately ₹2,254 and ₹2,274 respectively, indicating consolidation around key support levels. Momentum indicators suggest moderate strength with recent positive price action supported by sector outperformance and favorable news flow. Overall, the data suggests a cautious stance with potential for accumulation given the company’s solid fundamentals and ongoing strategic initiatives.
Company and Industry Overview
Company Basics
Price Performance
Company Size
Shareholding Pattern
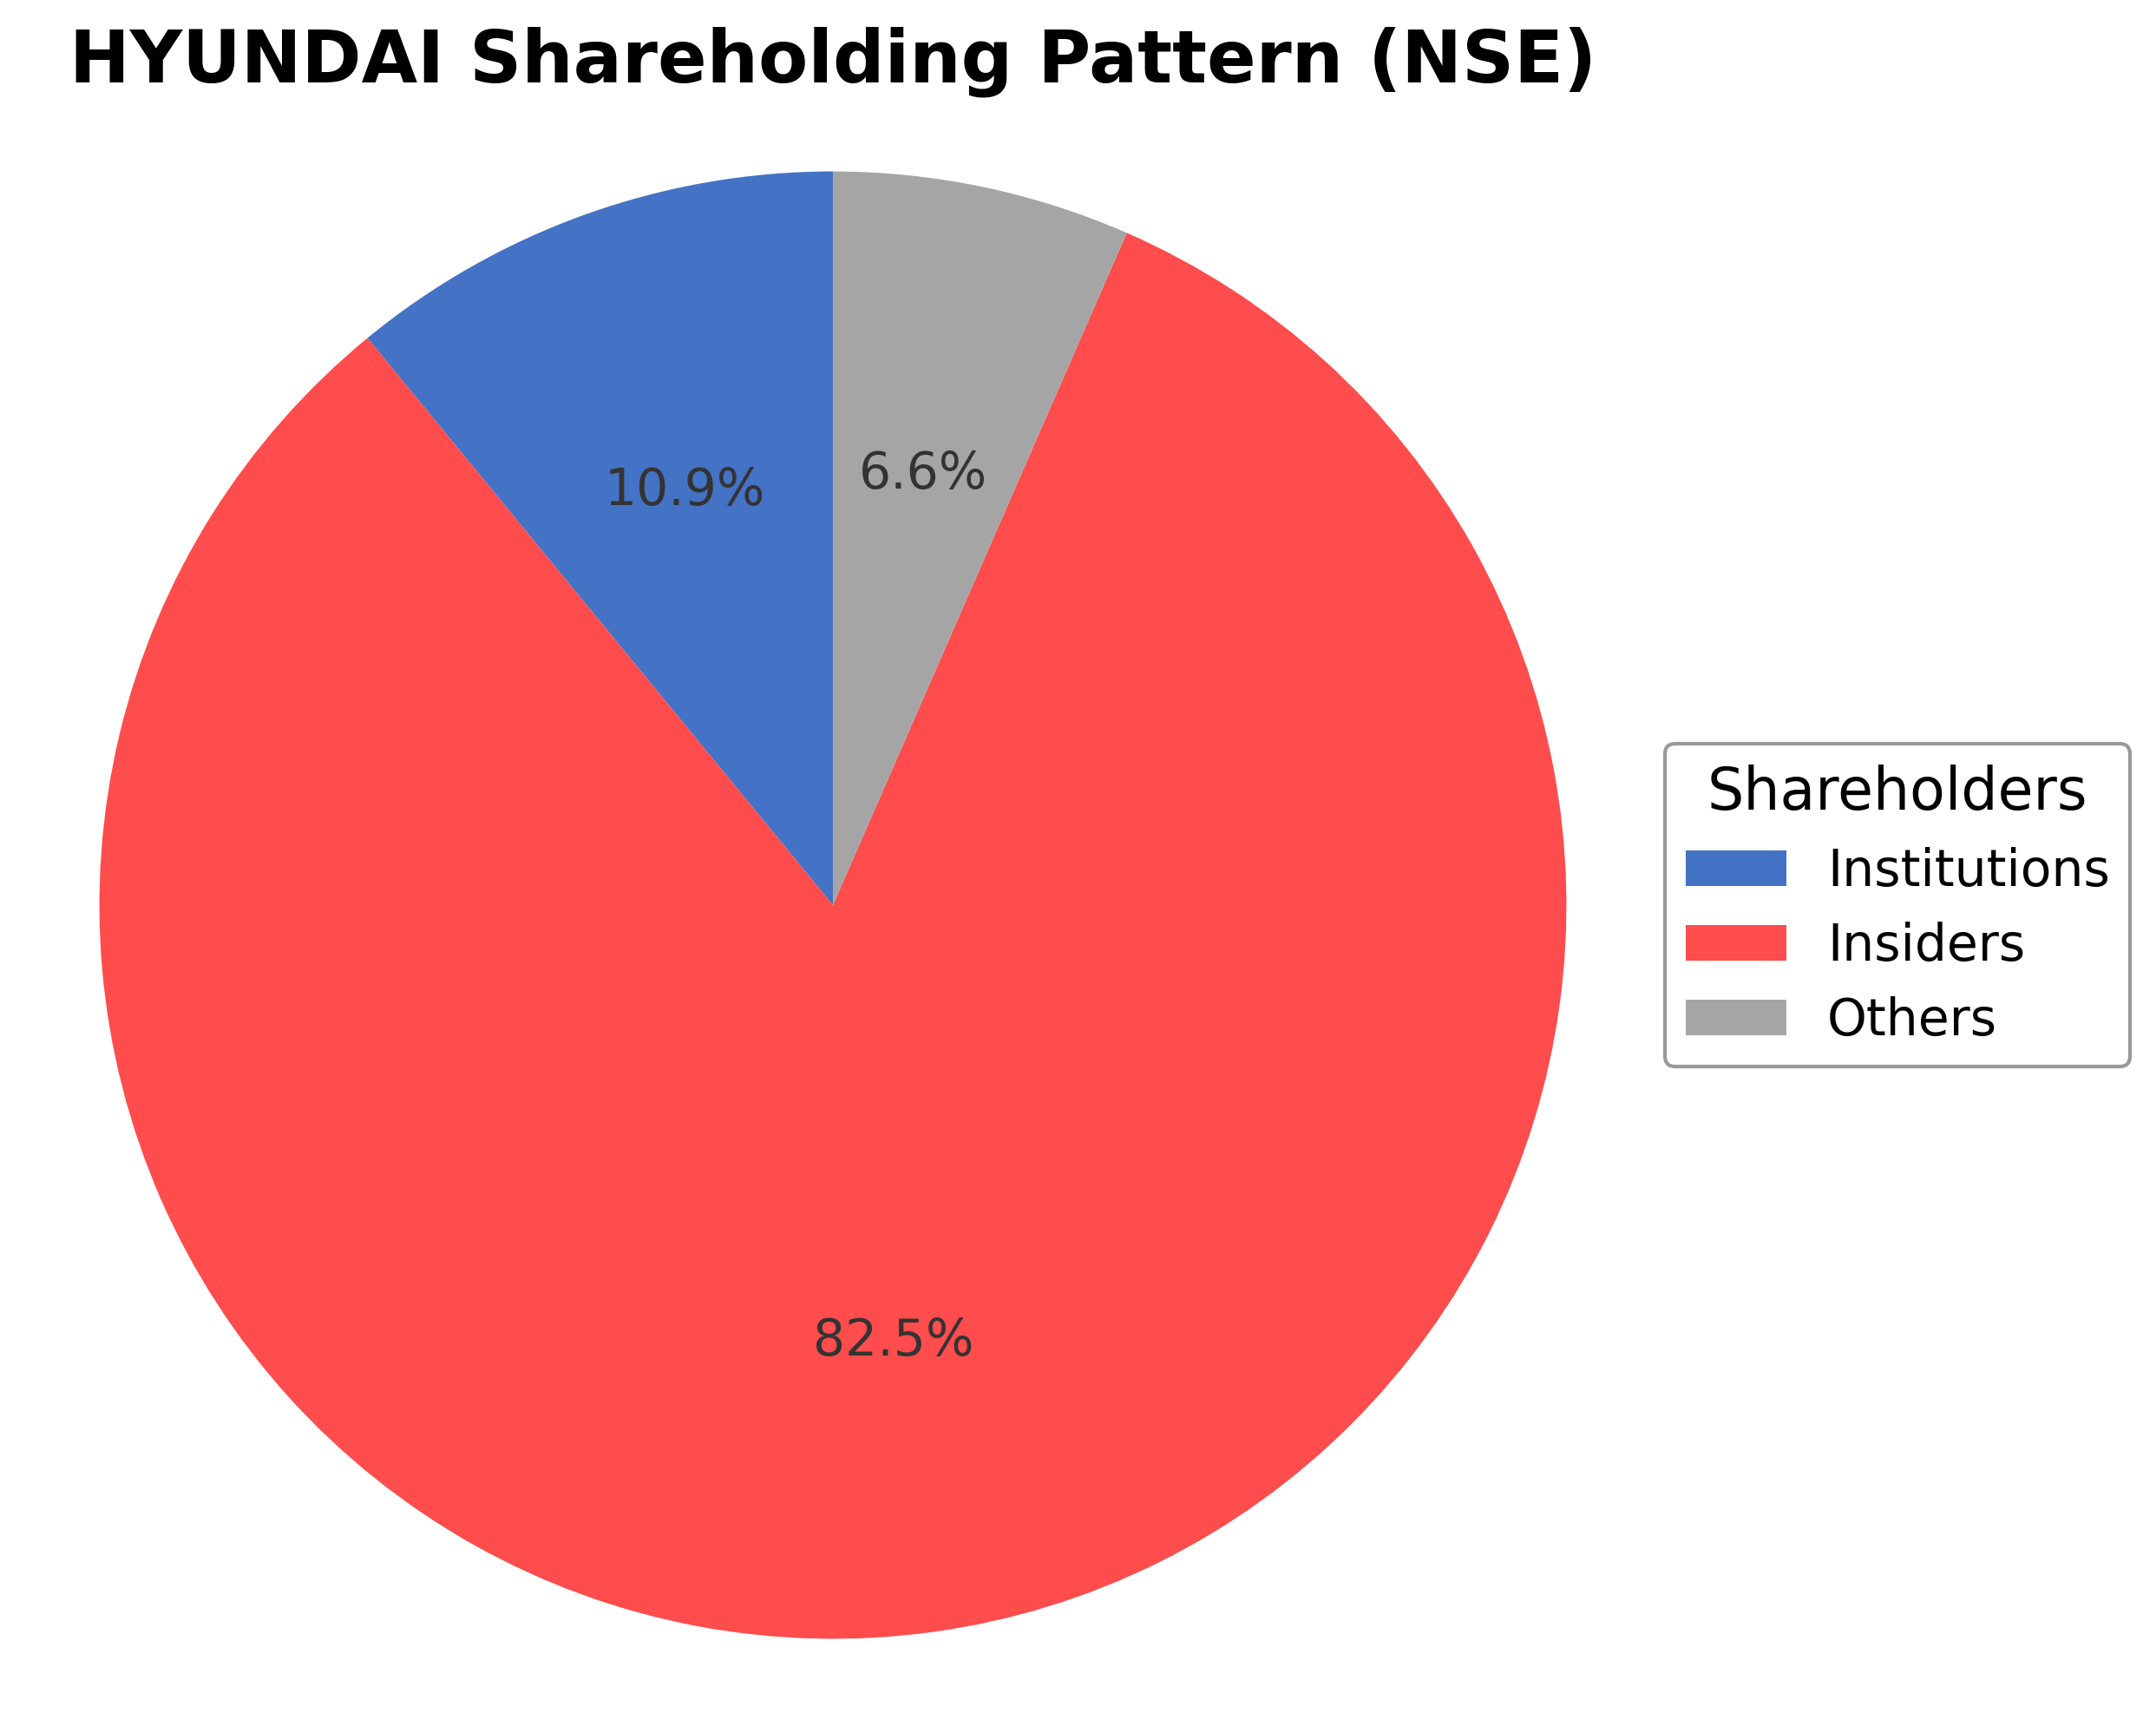
Hyundai Motor India Ltd. exhibits a shareholding structure dominated by insiders, including executives and board members, holding approximately 82.5% of shares. Institutional investors such as mutual funds and pension funds hold around 10.94%, while public and other shareholders account for 6.56%. Over the past 12 to 24 months, there has been a notable reclassification of Hyundai Motor Investment, INC from promoter to public category, reflecting regulatory compliance and potential shifts in ownership dynamics. Institutional accumulation appears moderate with no significant recent large-scale changes reported. This ownership pattern suggests a stable governance framework with strong promoter control, balanced by institutional oversight, which may influence strategic decisions and corporate actions in alignment with shareholder interests.
Sector and Industry Analysis
The Indian automotive sector is one of the largest globally, with a market size exceeding several million vehicles annually and a growth trajectory driven by rising consumer income, urbanization, and infrastructure development. Passenger vehicles, including cars and SUVs, constitute a significant segment, with major players such as Maruti Suzuki, Hyundai Motor India Ltd., Tata Motors, and Mahindra & Mahindra dominating the market. The sector has witnessed consistent revenue growth, supported by increasing domestic demand and export opportunities, contributing substantially to the country’s industrial output.
Industry trends highlight a shift towards electric vehicles (EVs), enhanced fuel efficiency, and digital integration, reflecting changing consumer preferences and environmental concerns. Competitive dynamics are characterized by intense rivalry among established manufacturers, continuous product innovation, and expansion of dealership networks. Barriers to entry remain high due to capital intensity, technology requirements, and regulatory compliance, favoring incumbent players with established brand equity and distribution capabilities.
The regulatory landscape is evolving with stricter emission norms, safety standards, and incentives for electric mobility under government initiatives like FAME (Faster Adoption and Manufacturing of Hybrid and Electric Vehicles). Policies promoting localization and export competitiveness also influence industry operations. These regulations aim to reduce environmental impact while fostering innovation, shaping the sector’s outlook towards sustainable growth and technological advancement.
Note: Analysis synthesized from industry research, market reports, and regulatory filings. Information is subject to change based on market conditions.
Financial Ratios Dashboard
Illustrative Scenario Analysis
DCF Assumptions:
Method: Two-Stage EPS-Priority Model
Financials
Peer Analysis
| Company Name | Market Cap | P/E Ratio | P/B Ratio | EV/EBITDA | Price to CFO |
|---|---|---|---|---|---|
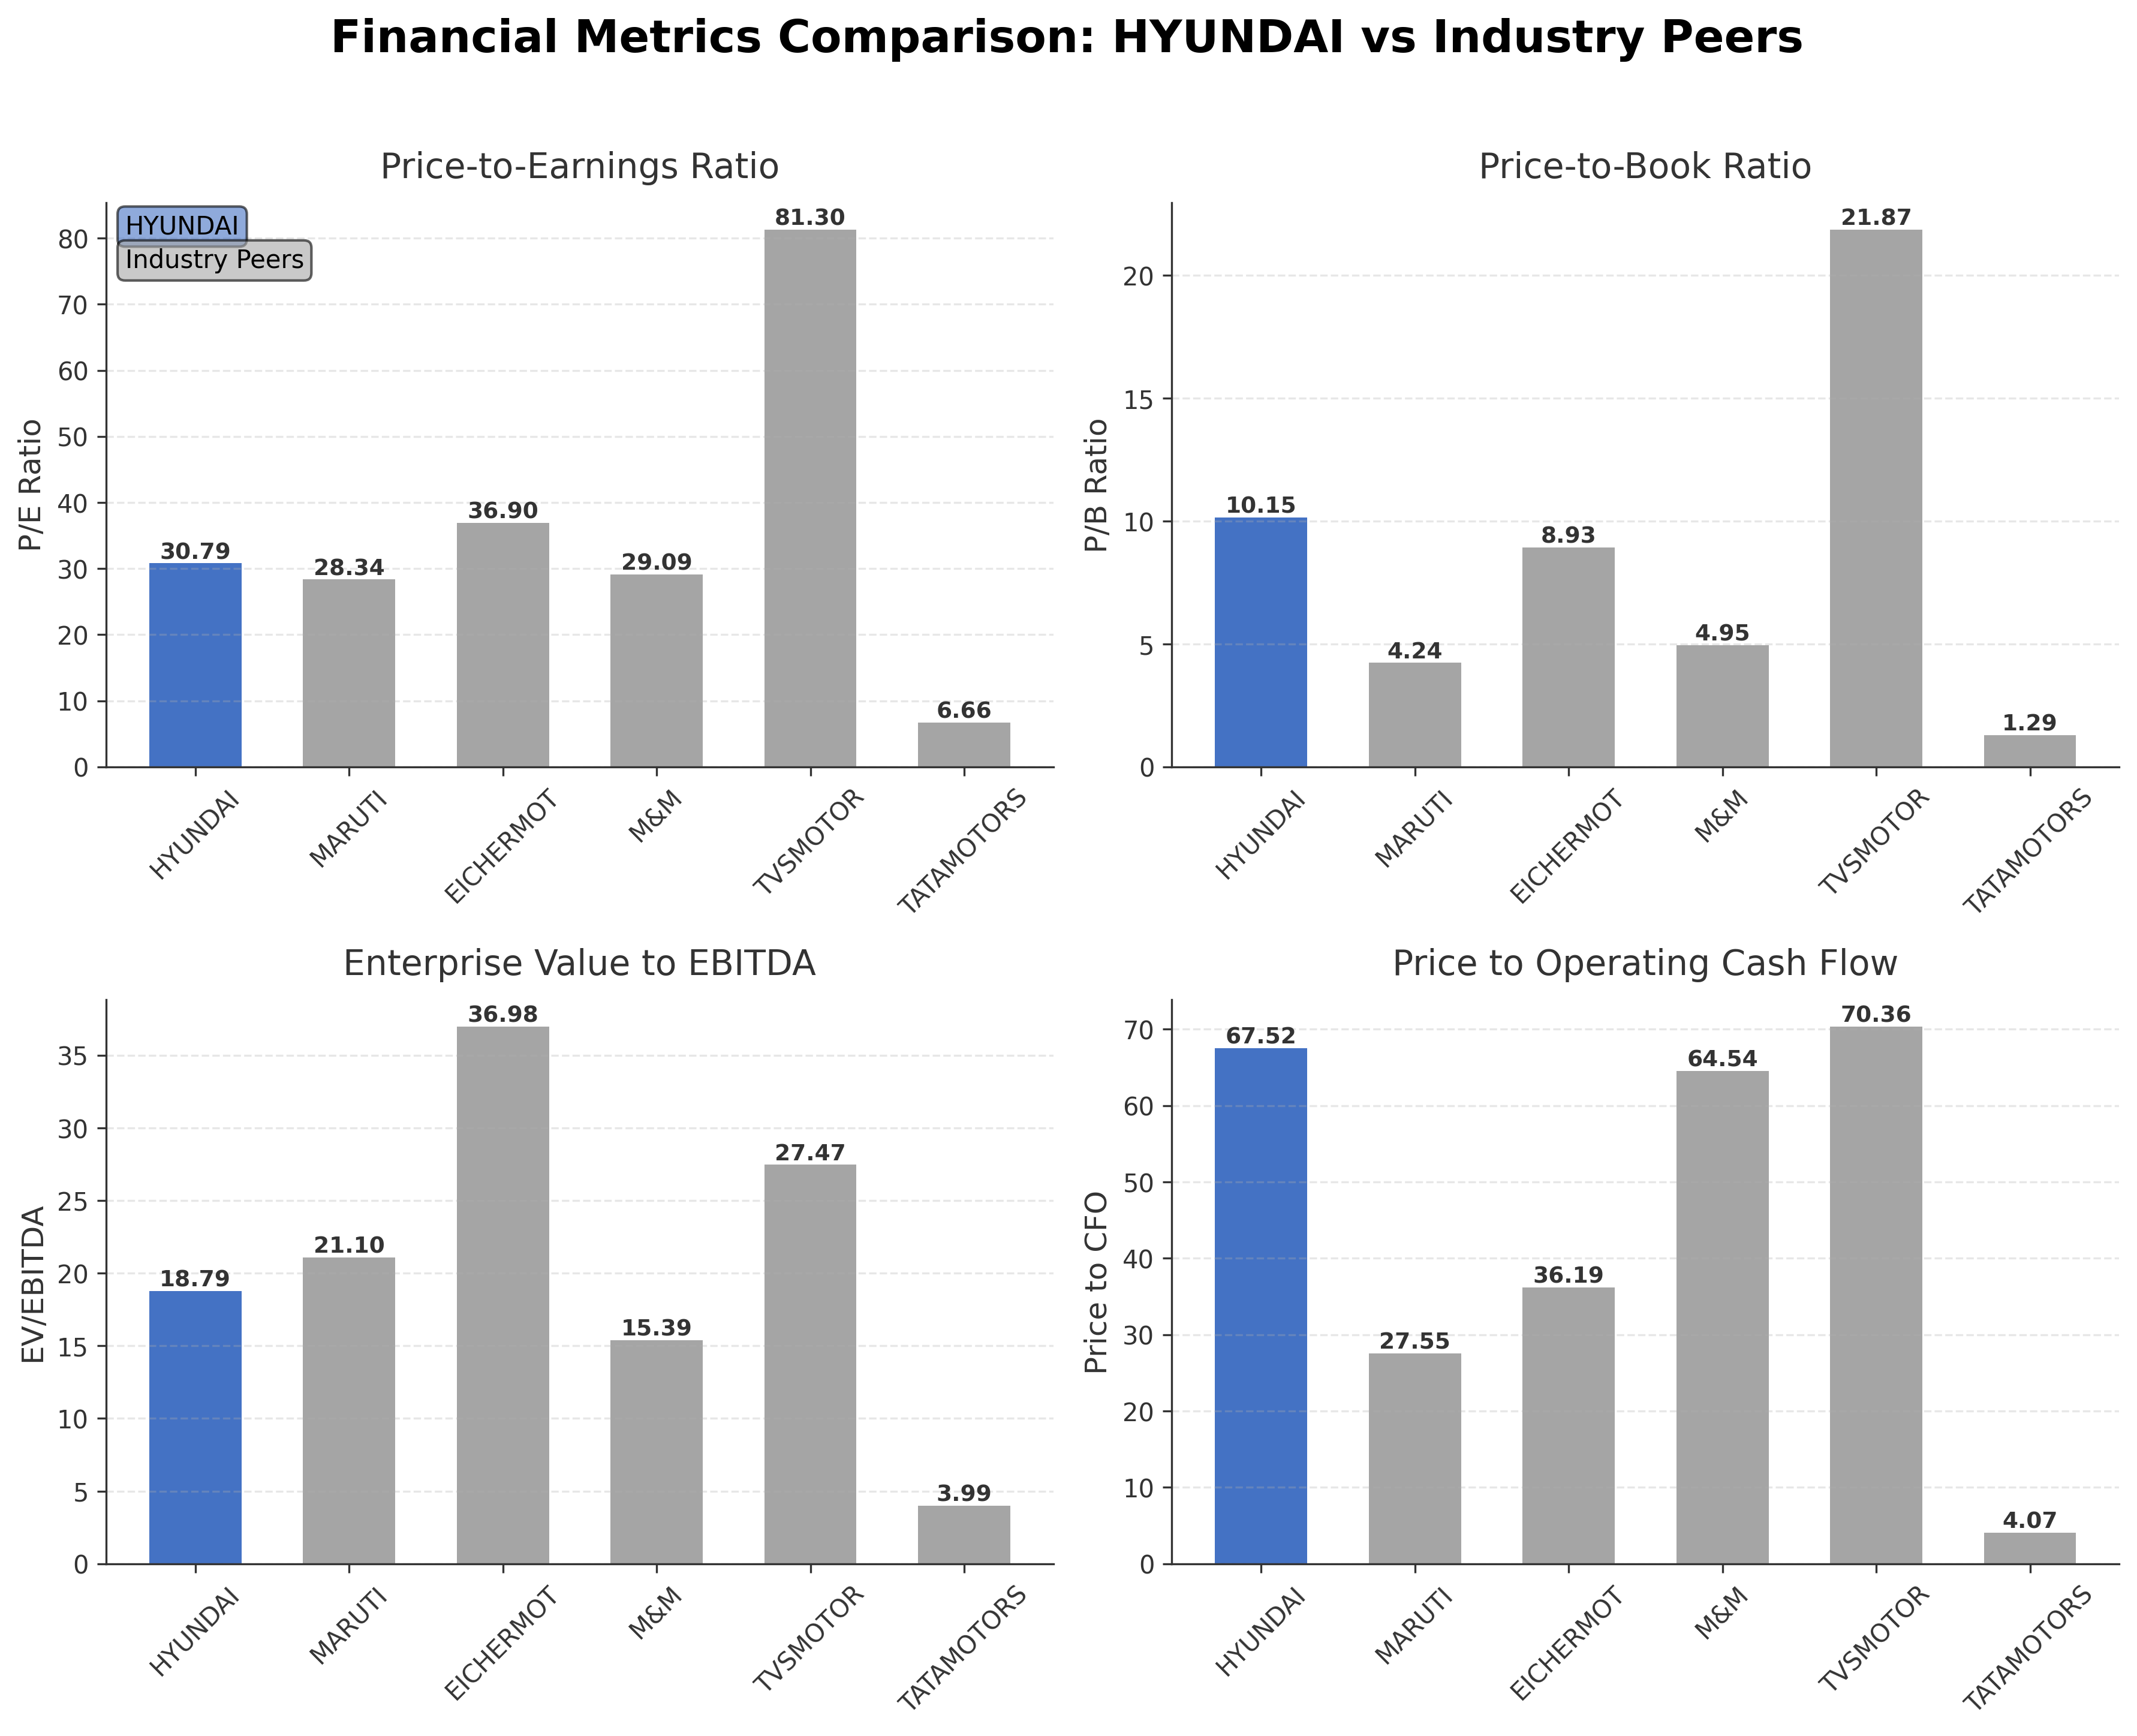
| Hyundai Motor India Ltd. | ₹1.78T | 30.79 | 10.15 | 18.79 | 67.52 |
| Maruti Suzuki India Limited | ₹4.24T | 28.34 | 4.24 | 21.10 | 27.55 |
| Eicher Motors Ltd. | ₹1.97T | 36.90 | 8.93 | 36.98 | 36.19 |
| Mahindra & Mahindra Ltd. | ₹4.31T | 29.09 | 4.95 | 15.39 | 64.54 |
| TVS Motor Company Limited | ₹1.78T | 81.30 | 21.87 | 27.47 | 70.36 |
| Tata Motors Ltd. | ₹1.32T | 6.66 | 1.29 | 3.99 | 4.07 |
Comparison Analysis: Hyundai Motor India Ltd. trades at a higher P/E ratio of 30.79 compared to peers such as Maruti Suzuki (28.34) and Mahindra & Mahindra (29.09), indicating relatively higher valuation. Its P/B ratio of 10.15 is significantly above the industry average, reflecting premium pricing relative to book value. The EV/EBITDA multiple of 18.79 is moderate compared to Eicher Motors’ elevated 36.98 and Tata Motors’ lower 3.99. Hyundai's return on equity at 34.61% is the highest among peers, demonstrating superior profitability and capital efficiency. However, the price to cash flow ratio at 67.52 is notably higher than most peers, suggesting a premium valuation on cash flow metrics.
Financial Metrics Comparison with Peers
Financial Statements
Comprehensive financial data including income, balance sheet, and cash flow metrics
Income Statement
| fiscal_date | 2025-03-31 | 2024-03-31 | 2023-03-31 | 2022-03-31 | 2021-03-31 |
|---|---|---|---|---|---|
| Sales | 679.42B | 685.90B | 591.03B | 464.61B | 403.64B |
| Cost Of Goods | 500.58B | 515.39B | 450.98B | 359.07B | 313.98B |
| Gross Profit | 178.84B | 170.51B | 140.05B | 105.54B | 89.66B |
| Operating Expense Selling General And Administrative | 40.77B | 30.99B | 28.65B | 20.36B | 17.82B |
| Operating Expense Other Operating Expenses | 37.47B | 71.82B | 29.89B | 22.65B | 20.32B |
| Operating Income | 68.52B | 69.25B | 53.64B | 33.22B | 22.84B |
| Non Operating Interest Income | 6.16B | 12.50B | 9.23B | 4.46B | 3.60B |
| Non Operating Interest Expense | 1.27B | 1.58B | 1.42B | 1.32B | 1.65B |
| Pretax Income | 75.91B | 82.40B | 63.46B | 37.72B | 25.40B |
| Income Tax | 19.51B | 21.80B | 16.36B | 8.71B | 6.59B |
| Net Income | 56.40B | 60.60B | 47.09B | 29.02B | 18.81B |
| Eps Basic | 69.41 | 74.58 | 57.96 | 35.71 | 23.15 |
| Eps Diluted | 69.41 | 74.58 | 57.96 | 35.71 | 23.15 |
| Basic Shares Outstanding | 812.54M | 812.54M | 812.54M | 812.54M | 812.54M |
| Diluted Shares Outstanding | 812.54M | 812.54M | 812.54M | 812.54M | 812.54M |
| Ebit | 77.19B | 83.98B | 64.88B | 39.04B | 27.05B |
| Ebitda | 98.25B | 106.06B | 86.83B | 60.79B | 46.81B |
| Net Income Continuous Operations | 56.40B | 60.60B | 47.09B | 29.02B | 18.81B |
| Preferred Stock Dividends | 0.00 | 0.00 | 0.00 | 0.00 | 0.00 |
Data provided by Twelve Data
Balance Sheet
| fiscal_date | 2025-03-31 | 2024-03-31 | 2023-03-31 | 2022-03-31 | 2021-03-31 |
|---|---|---|---|---|---|
| Cash And Cash Equivalents | 48.46B | 9.73B | 177.41B | 141.39B | 115.68B |
| Accounts Receivable | 23.89B | 25.10B | 28.97B | 21.82B | 24.65B |
| Total Assets | 300.97B | 263.49B | 345.73B | 283.58B | 267.31B |
| Total Liabilities | 138.01B | 156.84B | 145.19B | 115.02B | 114.19B |
| Long Term Debt | 5.83B | 6.79B | 7.33B | 7.97B | 8.21B |
| Shareholders Equity | 162.96B | 106.66B | 200.55B | 168.56B | 153.11B |
Data provided by Twelve Data
Cash Flow Statement
| fiscal_date | 2025-03-31 | 2024-03-31 | 2023-03-31 | 2022-03-31 | 2021-03-31 |
|---|---|---|---|---|---|
| Operating Activities Net Income | 56.40B | 60.60B | 47.09B | 29.02B | 18.81B |
| Operating Activities Other Non Cash Items | -4.97B | -11.00B | -8.08B | -3.67B | -2.01B |
| Operating Activities Accounts Receivable | 1.08B | 4.61B | -7.73B | 2.96B | -9.62B |
| Operating Activities Other Assets Liabilities | -26.11B | 17.29B | -2.91B | 7.01B | 15.64B |
| Operating Activities Operating Cash Flow | 26.41B | 71.50B | 28.38B | 35.31B | 22.82B |
| Investing Activities Capital Expenditures | -52.93B | -32.32B | -22.49B | -12.54B | -25.78B |
| Investing Activities Purchase Of Investments | -88.40B | -270.15B | -1.04M | 0.00 | 0.00 |
| Investing Activities Sale Of Investments | 128.89B | 193.11B | 0.00 | 0.00 | 0.00 |
| Investing Activities Investing Cash Flow | -12.44B | -109.36B | -22.49B | -12.54B | -25.78B |
| Financing Activities Long Term Debt Payments | -6.85B | -10.08B | -16.96B | -13.17B | -12.59B |
| Financing Activities Short Term Debt Issuance | 1.17B | -3.29B | 746.37M | -1.62B | 2.95B |
| Financing Activities Financing Cash Flow | -5.69B | -167.72B | -31.15B | -28.38B | -9.46B |
| End Cash Position | 48.46B | 9.73B | 177.41B | 141.39B | 115.68B |
| Free Cash Flow | -9.62B | 60.06B | 43.03B | 38.73B | 28.40B |
| Financing Activities Common Dividends | N/A | -154.36B | -14.93B | -13.59B | N/A |
| Financing Activities Long Term Debt Issuance | N/A | N/A | 0.00 | N/A | 181.92M |
Data provided by Twelve Data
Technical Analysis
Key Insights
- The current trend shows consolidation with the stock price hovering near the 50-day moving average of ₹2,253.92 and the 200-day moving average of ₹2,273.76, indicating a neutral to slightly bullish price action pattern.
- Key support levels are identified around ₹1,541.70 (52-week low) and near the 50-day moving average at ₹2,254, while resistance is observed near the 52-week high of ₹2,890.
- The stock price is currently slightly below the 200-day moving average, suggesting a cautious stance in the medium term, while it remains close to the 50-day average, indicating short-term stability.
- Momentum indicators show moderate strength with RSI levels indicating neither overbought nor oversold conditions; MACD and Stochastic oscillators reflect neutral momentum without strong directional bias.
- Across daily, weekly, and monthly timeframes, the stock exhibits sideways movement with no clear breakout, suggesting consolidation after recent gains.
- Potential market scenarios include a continuation of the consolidation phase with possible upward momentum if the stock breaks above the 200-day moving average, or a retracement towards support levels if selling pressure increases.
Trending News
1. Headline: HD Hyundai Expands India, Vietnam Shipyards to Counter China - Seoul Economic Daily
Summary: HD Hyundai is expanding shipyards in India and Vietnam to counter China's commercial vessel market dominance, with a potential $4 billion investment in India and capacity expansion across Southeast Asia.
Sentiment: positive
2. Headline: Hyundai Motor India Ltd Surges 3.52% to Day's High of Rs 1908 — Outperforms Sector by 1.76 Percentage Points
Summary: The Sensex advanced 0.33% on 17 Apr 2026, yet Hyundai Motor India Ltd outpaced the broader market with a 3.52% gain, reaching an intraday high of Rs 1908. This 1.76 percentage-point outperformance over the Automobiles sector highlights a distinctly stock-specific rally rather than a market-wide ...
Sentiment: positive
3. Headline: Hyundai Motor India Receives NSE and BSE Approval for Promoter Group Reclassification
Summary: Hyundai Motor India Limited received regulatory approval from NSE and BSE on April 16, 2026, for reclassifying Hyundai Motor Investment, INC from promoter group to public category under SEBI LODR Regulation 31A. The approval followed the company's application dated February 06, 2026, and requires ...
Sentiment: positive
4. Headline: This auto giant has an important session on April 20; Here's what 8 lakh retail shareholders need to know - CNBC TV18
Summary: HomeMarket NewsThis auto giant has an important session on April 20; Here's what 8 lakh retail shareholders need to know · By Shloka Badkar April 17, 2026, 1:04:07 PM IST (Updated) ... Shares of Hyundai Motor India Ltd. are trading over 3% higher on Friday, April 17, before its shareholder lock-in period ends on Monday. This is the third day of gains for the stock ...
Sentiment: positive
5. Headline: Hyundai Motor Group Expands Social Contribution in India, Strengthening Korea-India Bridge
Summary: Hyundai Motor Group and its affiliates expand a diverse range of community-centered social contribution projects across India The projects support local...
Sentiment: positive
Powered by Brave
Recent Updates
News Summary
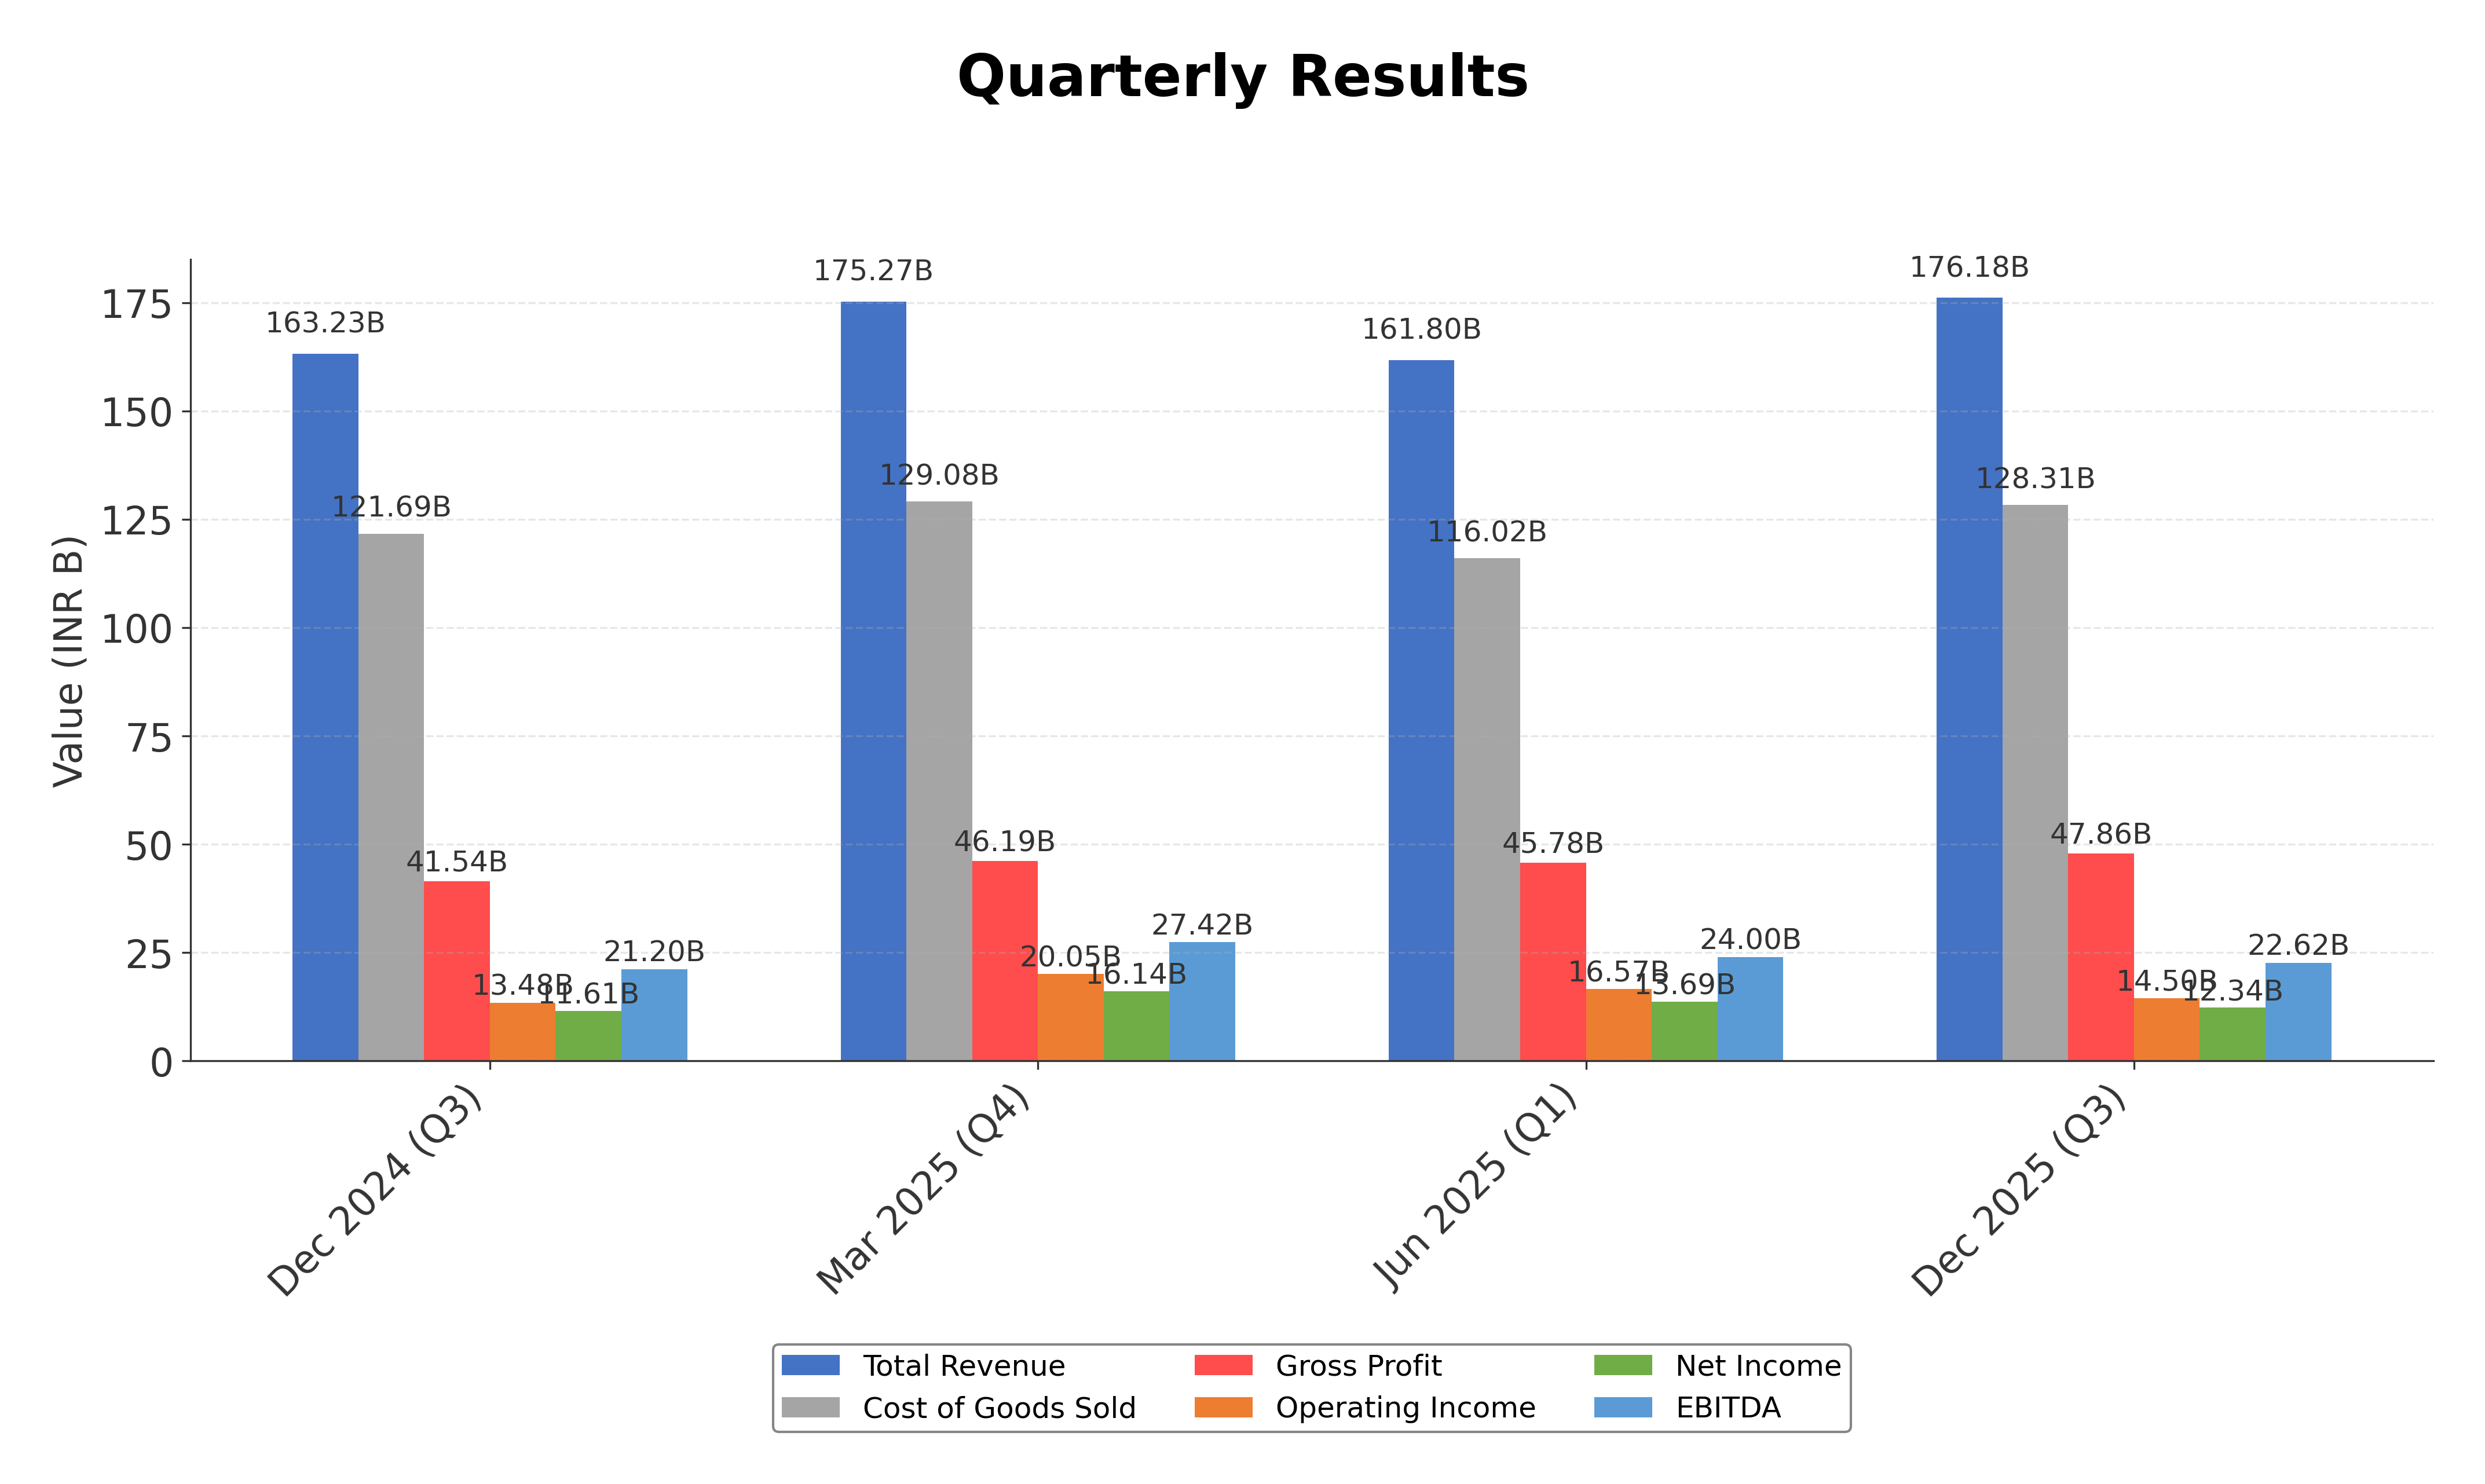
As of April 16, 2026. Hyundai Motor India Limited has recently received regulatory approval from NSE and BSE for reclassifying Hyundai Motor Investment, INC from the promoter group to the public category under SEBI LODR Regulation 31A. This regulatory milestone reflects the company's adherence to compliance and impacts its shareholding structure. The company reported strong financial performance in Q3 FY26 with consolidated revenue of ₹179.7 billion, EBITDA of ₹20.2 billion at an 11.2% margin, and PAT of ₹12.3 billion. Volume growth was supported by domestic and export markets, with exports increasing 21% year-over-year. The company continues to maintain leadership in the SUV segment and has diversified into commercial mobility. Management expects FY26 EBITDA margins within the guided range of 11%-14%, despite ongoing cost pressures. Investor relations activities have been active with multiple conferences and roadshows in recent months.
News Sentiment
The overall sentiment from recent updates is predominantly positive, driven by regulatory approvals for shareholding reclassification and strong quarterly financial results. The company’s sustained volume growth, export expansion, and leadership in key segments contribute to favorable operational momentum. However, ongoing cost pressures and commodity price volatility present moderate challenges. The positive regulatory developments and active investor engagement support a constructive outlook, tempered by cautious monitoring of margin pressures and market conditions.
Source List
- https://scanx.trade/stock-market-news/companies/hyundai-motor-india-receives-nse-and-bse-approval-for-promoter-group-reclassification/37964849
- https://www.hyundai.com/in/en/investor-relations
- https://quartr.com/companies/hyundai-motor-india-limited_18642
- https://www.hyundai.com/in/en/investor-relations/financial-information/quaterly-financials
Analytical Overview
Analysis Summary
Hyundai Motor India’s valuation metrics, including a trailing P/E of 30.79 and forward P/E of 27.25, are slightly above the industry average of 30.79, indicating a premium valuation relative to peers. The company’s revenue growth of 8% year-over-year and positive cash flow trends, with operating cash flow of ₹26.4 billion and free cash flow of ₹56.4 billion, demonstrate a solid growth trajectory and strong liquidity. Financial health appears robust with a low total debt to equity ratio of 4.89%, supporting manageable leverage and financial stability. Sector-specific challenges include commodity price inflation and competitive pressures in the Indian automotive market, while opportunities arise from export expansion and SUV segment leadership. Considering the Indian regulatory environment, evolving consumer preferences, and economic outlook, Hyundai is well positioned to capitalize on growth prospects while navigating sectoral risks.
Overall Business and Market Assessment
Supporting Factors: Hyundai Motor India’s strong profitability with a 34.61% ROE, consistent revenue growth, and leadership in the SUV segment
Risk Factors: margin pressures from commodity costs and regulatory compliance challenges, including recent promoter reclassification impacts
SWOT Analysis
Strengths
- Strong market leadership in the Indian automotive SUV segment.
- Robust profitability with a high return on equity of 34.61%.
- Healthy cash flow generation supporting operational and strategic initiatives.
- Low debt levels with a total debt to equity ratio of 4.89%.
Weaknesses
- High price to cash flow ratio indicating premium valuation.
- Price to book ratio significantly above industry peers.
- Exposure to commodity price volatility impacting margins.
- Limited institutional shareholding relative to promoter dominance.
Opportunities
- Expansion in export markets with 21% year-over-year export volume growth.
- Diversification into commercial mobility segments.
- Regulatory approvals enabling shareholding structure optimization.
- Growing demand for hybrid and technologically advanced vehicles.
Threats
- Intense competition from domestic and international automobile manufacturers.
- Regulatory compliance risks related to promoter reclassification.
- Macroeconomic uncertainties affecting consumer demand and input costs.
- Potential leadership changes impacting strategic continuity.
Company Description
Hyundai Motor India Ltd. is a prominent automobile manufacturer serving the Indian market, recognized for its diverse range of passenger vehicles. As a subsidiary of the South Korean Hyundai Motor Company, it plays a pivotal role in catering to the dynamic demands of the Indian automotive sector. The company's lineup includes compact cars, sedans, SUVs, and hybrid models, reflecting a commitment to innovation and quality. Key models include the Hyundai Creta, i20, and Verna, which are popular among urban and suburban consumers alike. Hyundai Motor India Ltd. focuses on integrating cutting-edge technology and sustainability in vehicle design, aligning with global environmental standards. It operates a notable manufacturing facility in Tamil Nadu, contributing significantly to local employment and economic growth. Hyundai's dominance in the Indian market underscores its ability to adapt to consumer preferences and capitalize on the expanding demand for efficient and reliable transportation solutions. The brand is synonymous with reliability and modernity, marking its significance in shaping India's automotive landscape.