


Honasa Consumer Ltd (HONASA)
Stock Analysis Report
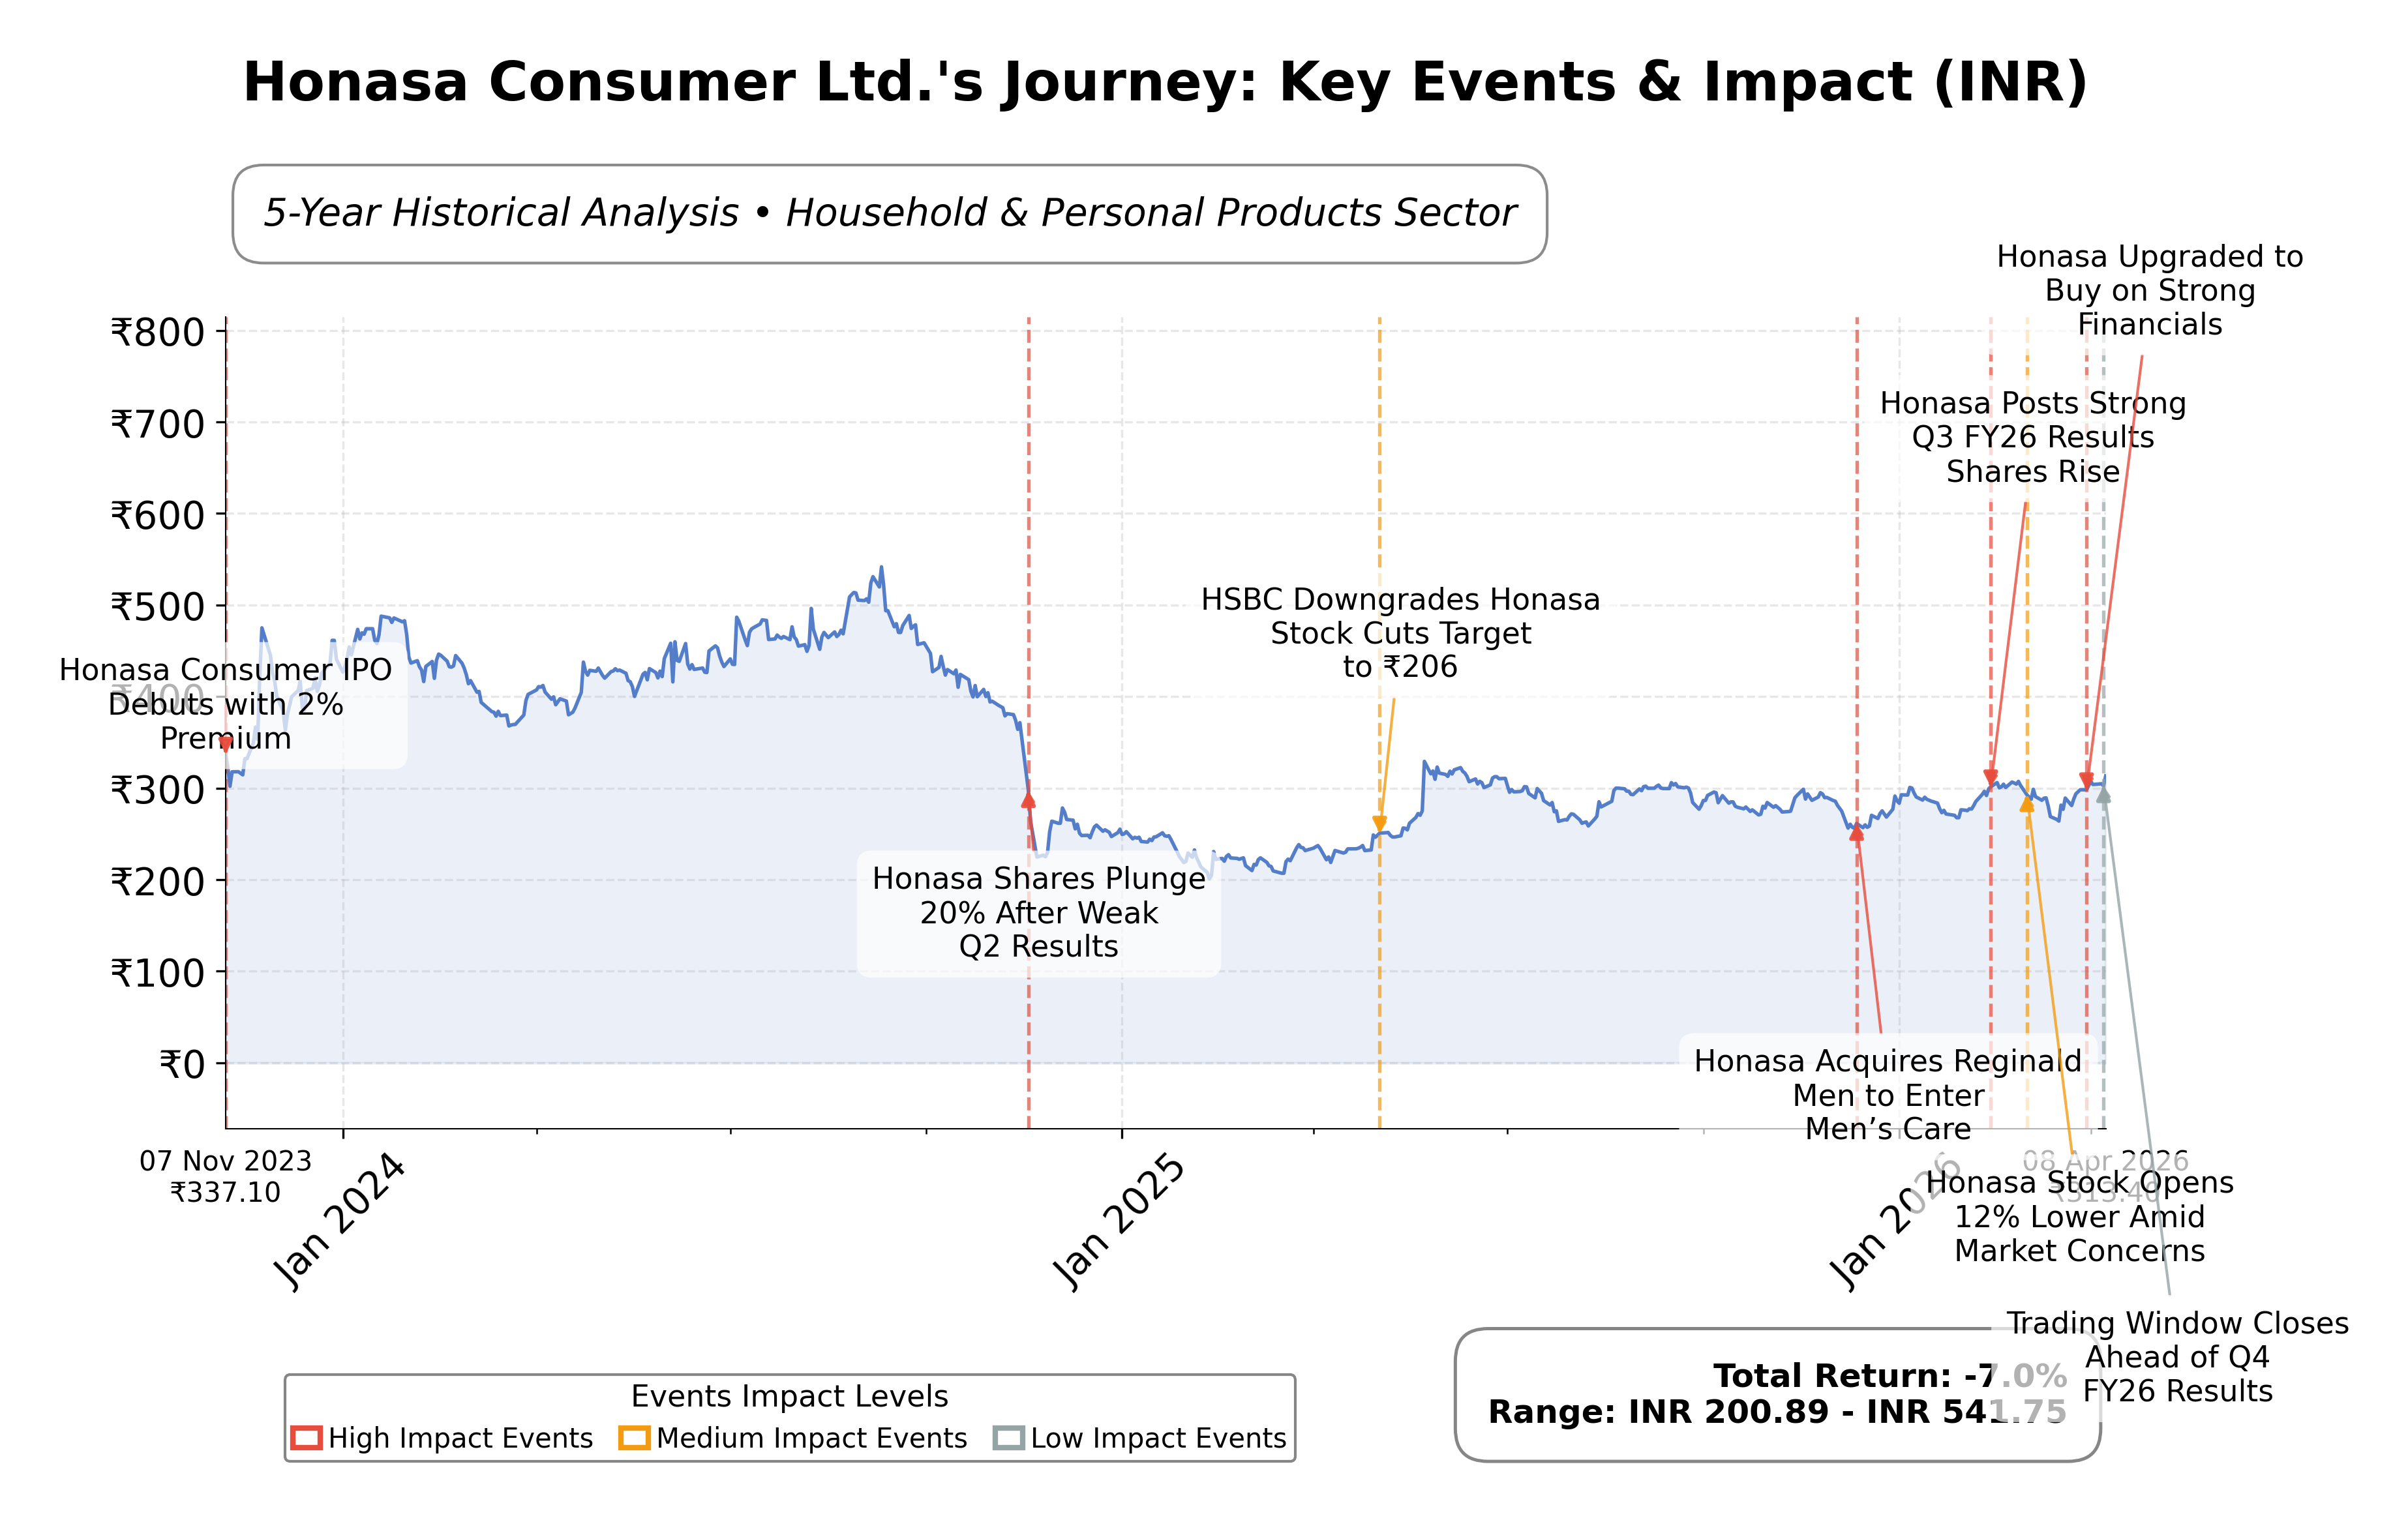
Stock Journey
Key Positives and Key Risks
Pros
- Revenue growth of 16.2% quarterly and year-over-year earnings growth of 92.9% demonstrate strong top-line and profitability momentum.
- Gross margin of 68.5% indicates efficient cost management and product pricing power.
- Current ratio of 1.92 and low debt-to-equity ratio of 0.11 reflect solid liquidity and financial stability.
Cons
- Trailing P/E ratio of 63.73 and EV/EBITDA of 61.47 suggest elevated valuation levels relative to earnings and cash flow.
- Negative operating cash flow of INR -201 million indicates challenges in cash generation from operations.
- Regulatory scrutiny due to multiple advertising norm breaches may impact brand reputation and compliance costs.
Disclosure: This information is for general awareness and does not constitute investment advice
Report Summary
Honasa Consumer Ltd. operates in the personal care segment within the Household & Personal Products industry, primarily focusing on natural and toxin-free skincare, haircare, and baby care products. The company is recognized for its commitment to organic ingredients and sustainability, leveraging digital platforms and social media to engage environmentally conscious consumers. Its market positioning is strengthened by a strong online presence and brand transparency, catering to evolving consumer preferences in Indiaâs growing personal care market.
Financially, Honasa Consumer Ltd. reports a trailing twelve months (TTM) revenue of approximately INR 22.68 billion with a gross margin of 68.5% and a profit margin of 6.9%. The companyâs valuation metrics indicate a trailing P/E ratio of 63.73 and a forward P/E of 44.96, reflecting premium valuation relative to earnings growth prospects. The enterprise value to EBITDA ratio stands at 61.47, suggesting elevated market expectations. The balance sheet shows a healthy current ratio of 1.92 and a modest debt-to-equity ratio of 0.11, supported by cash reserves of over INR 5 billion.
From a strategic perspective, recent technical indicators signal bullish momentum, including a Golden Cross formation and improved moving averages. The company has experienced leadership upgrades in market ratings and has demonstrated strong quarterly earnings growth of 92.9% year-over-year. However, regulatory scrutiny concerning advertising norms presents a reputational risk. Institutional ownership is significant at 48.3%, indicating confidence from major shareholders, while insider holdings remain modest at 0.39%.
Peer analysis within the Indian Household & Personal Products sector shows Honasa Consumer Ltd. as a smaller-cap entity compared to established players like Colgate-Palmolive India and Dabur India. While Honasaâs valuation multiples are higher, its return on equity (6.16%) is lower than peers, reflecting a growth-stage profile. The companyâs price-to-cash-flow ratio is notably negative, contrasting with positive cash flow metrics among competitors, highlighting areas for operational improvement.
Navigating a competitive and evolving personal care landscape, Honasa Consumer Ltd. has achieved notable growth and market recognition through innovation and digital engagement. The company faces ongoing challenges related to regulatory compliance and operational cash flow. The current phase represents a pivotal moment where strategic execution and market dynamics will influence future positioning. Given the data, a balanced approach that monitors valuation and operational metrics alongside market developments may be appropriate for stakeholders assessing the companyâs trajectory.
Company and Industry Overview
Company Basics
Price Performance
Company Size
Shareholding Pattern
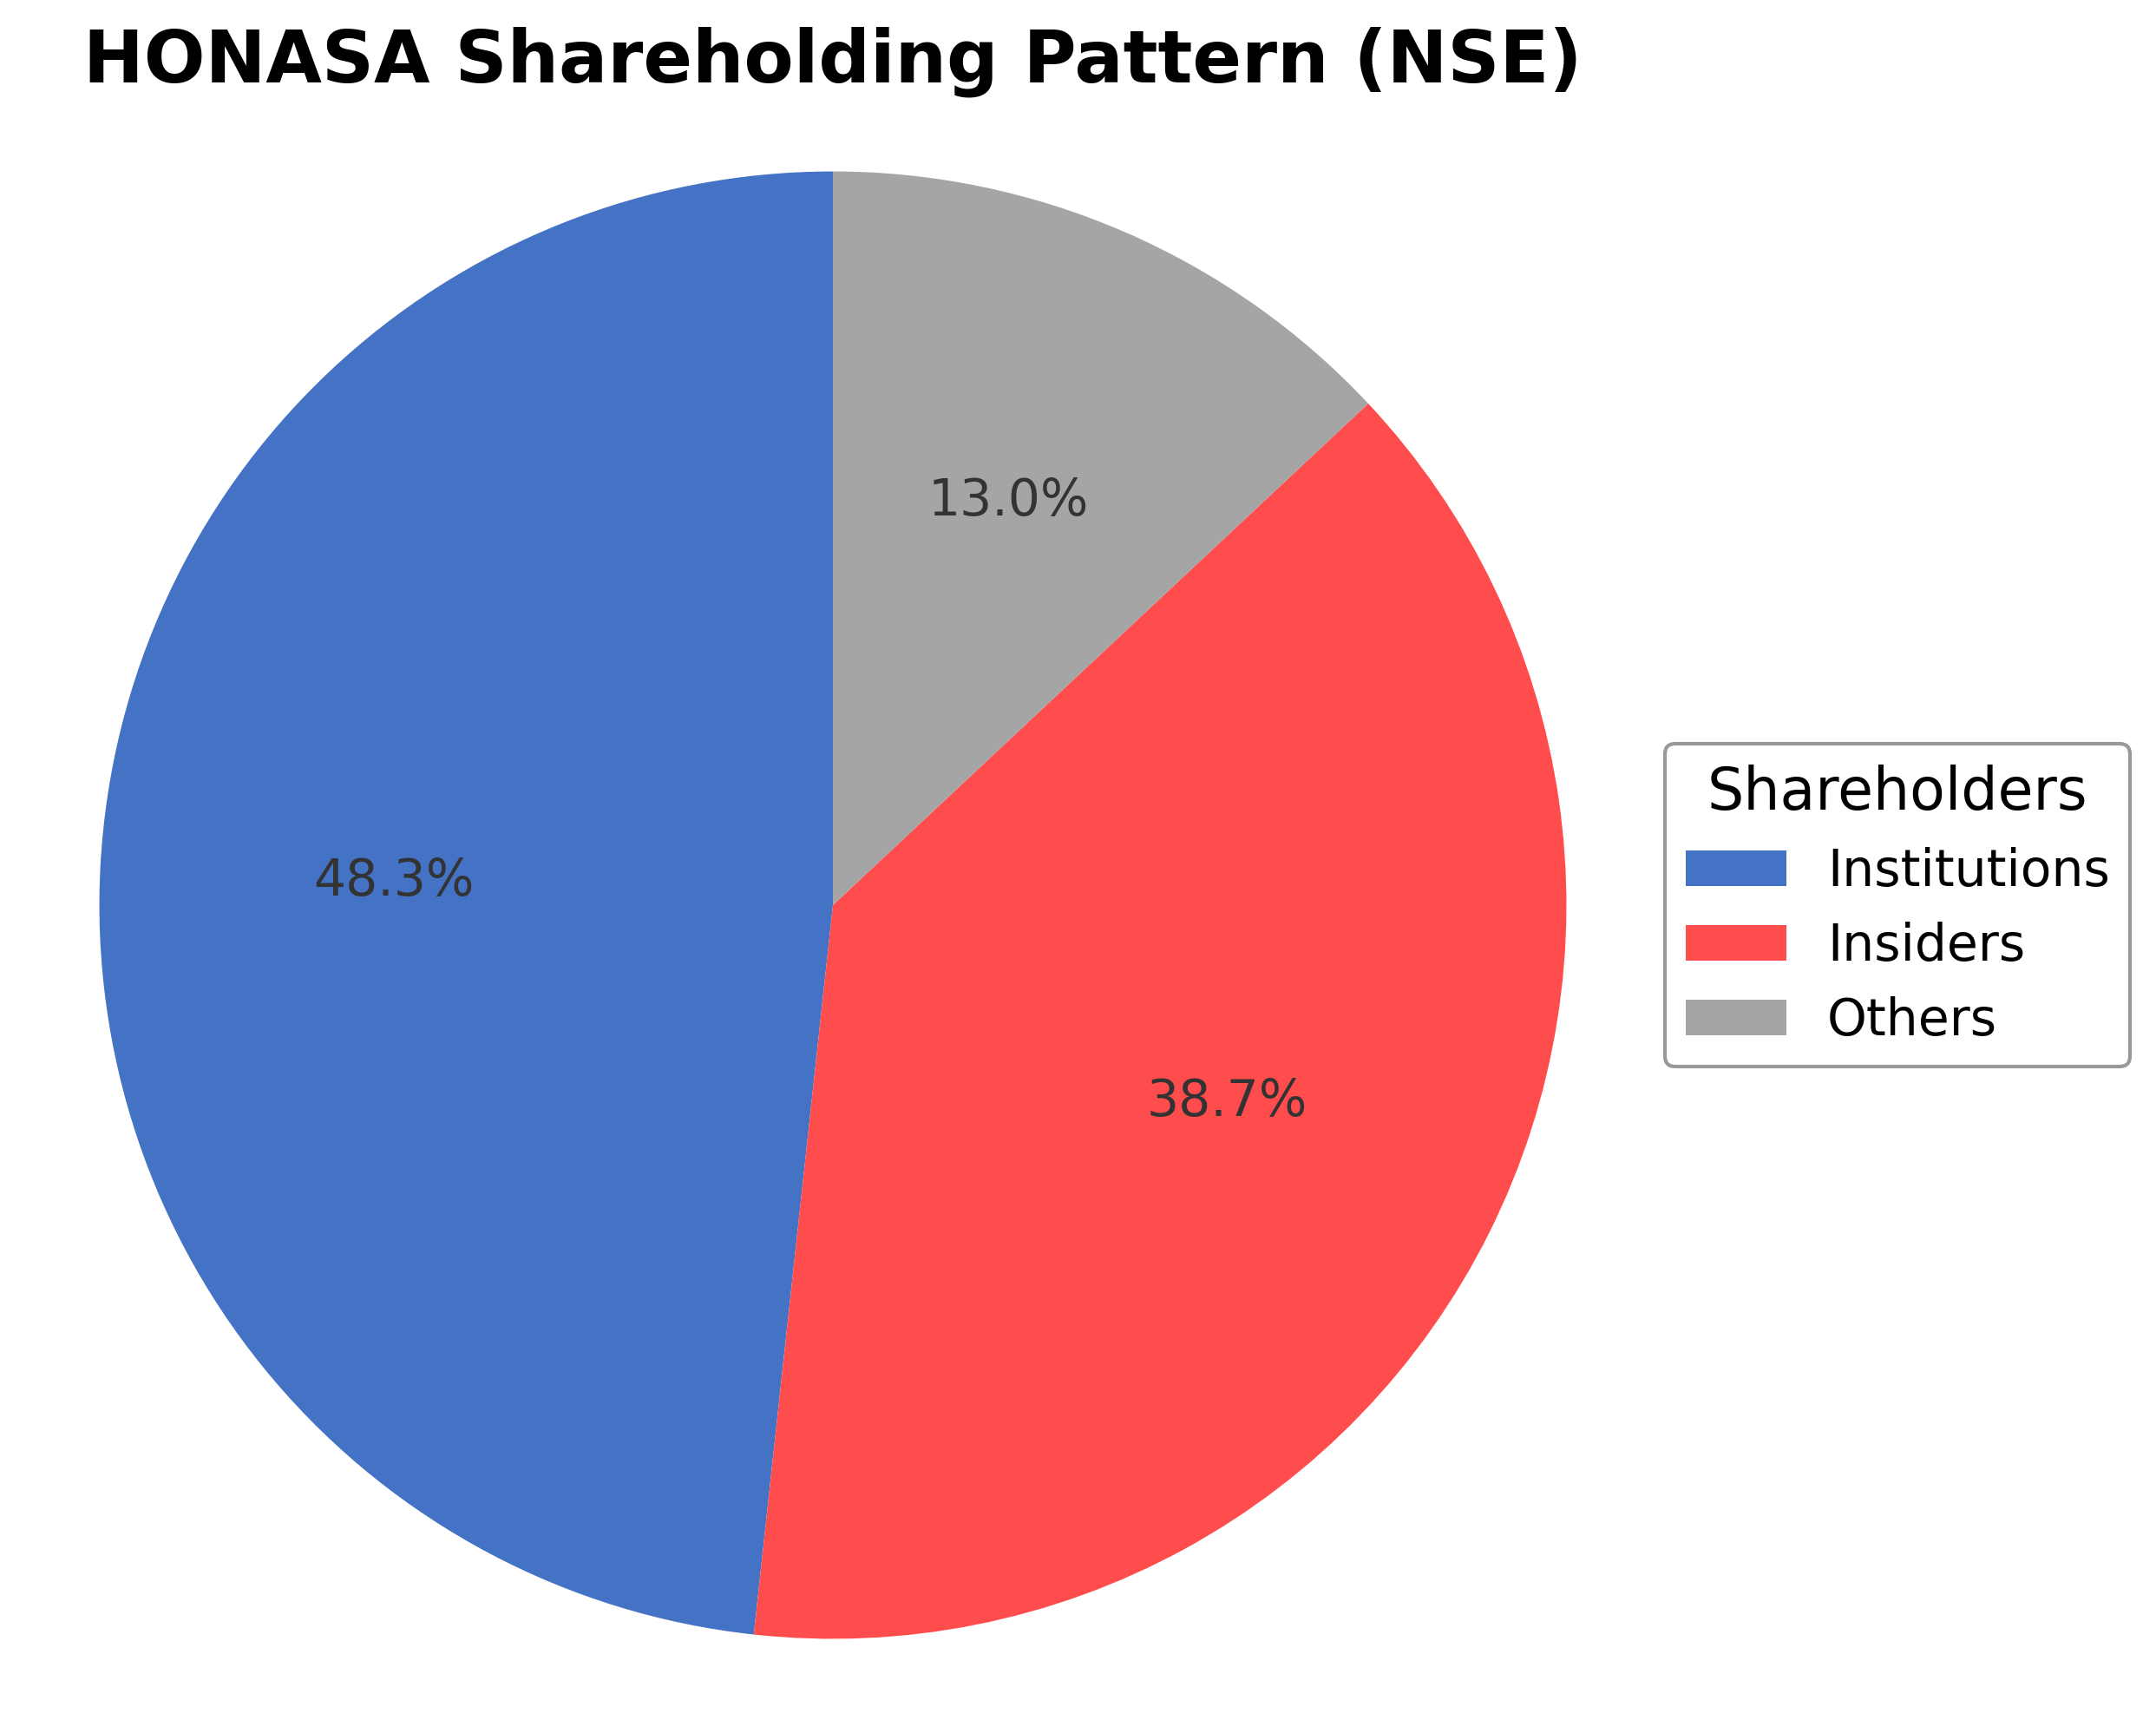
Honasa Consumer Ltd.'s ownership structure comprises approximately 0.39% held by insiders including executives and board members, 48.28% by institutional investors such as mutual funds and asset managers, and the remaining 51.33% by public shareholders including retail investors and employee stock plans. Over the past 12-24 months, institutional holdings have shown accumulation trends, reflecting growing confidence from major funds. This distribution suggests a balanced market sentiment with significant institutional influence on governance and strategic direction. The ownership pattern supports potential stability in corporate actions and indicates alignment with market expectations in the Indian personal care sector.
Sector and Industry Analysis
Honasa Consumer Ltd. (NSE: HONASA) operates within the broader Consumer Goods sector, specifically in the personal care and household products industry. This sector in India has witnessed robust growth driven by rising disposable incomes, urbanization, and increasing consumer awareness about health and hygiene. The Indian personal care market alone is estimated to be worth over $15 billion and is projected to grow at a CAGR of 12-15% over the next five years, fueled by expanding middle-class demographics and digital penetration. Key players in this space include multinational corporations such as Hindustan Unilever, Procter & Gamble, and Dabur, alongside emerging domestic brands like Honasa, which leverage e-commerce and direct-to-consumer models to capture market share.
Industry trends are characterized by rapid technological adoption and evolving consumer preferences. Digital transformation has enabled brands to engage consumers directly through social media, influencer marketing, and personalized online experiences. There is a marked shift towards natural, organic, and sustainable products, reflecting growing environmental consciousness and health awareness. Additionally, the rise of omni-channel retailing, combining online and offline sales, presents new growth avenues. Innovations in product formulations, packaging, and supply chain efficiencies are also critical, with companies investing in R&D to differentiate in a crowded marketplace. Emerging opportunities include premiumization of personal care products and expansion into tier 2 and tier 3 cities, where consumer spending is on the rise.
The regulatory environment for the consumer goods sector in India is multifaceted, encompassing product safety standards, labeling requirements, and advertising norms governed by bodies such as the Bureau of Indian Standards (BIS), Food Safety and Standards Authority of India (FSSAI), and the Advertising Standards Council of India (ASCI). Compliance with the Consumer Protection Act and the Drugs and Cosmetics Act is mandatory for personal care products. Recent policy initiatives promoting Make in India and Digital India indirectly benefit companies like Honasa by encouraging domestic manufacturing and e-commerce growth. However, regulatory scrutiny on product claims, ingredient disclosures, and environmental impact is intensifying, necessitating stringent quality control and transparency.
Competitive dynamics in the personal care and household products industry are shaped by a mix of large incumbents and agile startups. The market structure is moderately concentrated, with established multinational corporations commanding significant brand loyalty and distribution networks, while new entrants leverage innovation and digital channels to disrupt traditional models. Barriers to entry include high capital requirements for brand building, regulatory compliance, and supply chain establishment, but digital platforms have lowered these hurdles somewhat. Honasa’s competitive positioning benefits from its digital-first approach and portfolio of niche brands targeting millennial and Gen Z consumers. Nonetheless, sustaining growth requires continuous innovation, aggressive marketing, and scaling capabilities to compete against entrenched players and new challengers.
Note: Analysis synthesized from industry research, market reports, and regulatory filings. Information is subject to change based on market conditions.
Illustrative Scenario Analysis
DCF Assumptions:
Method: Two-Stage EPS-Priority Model
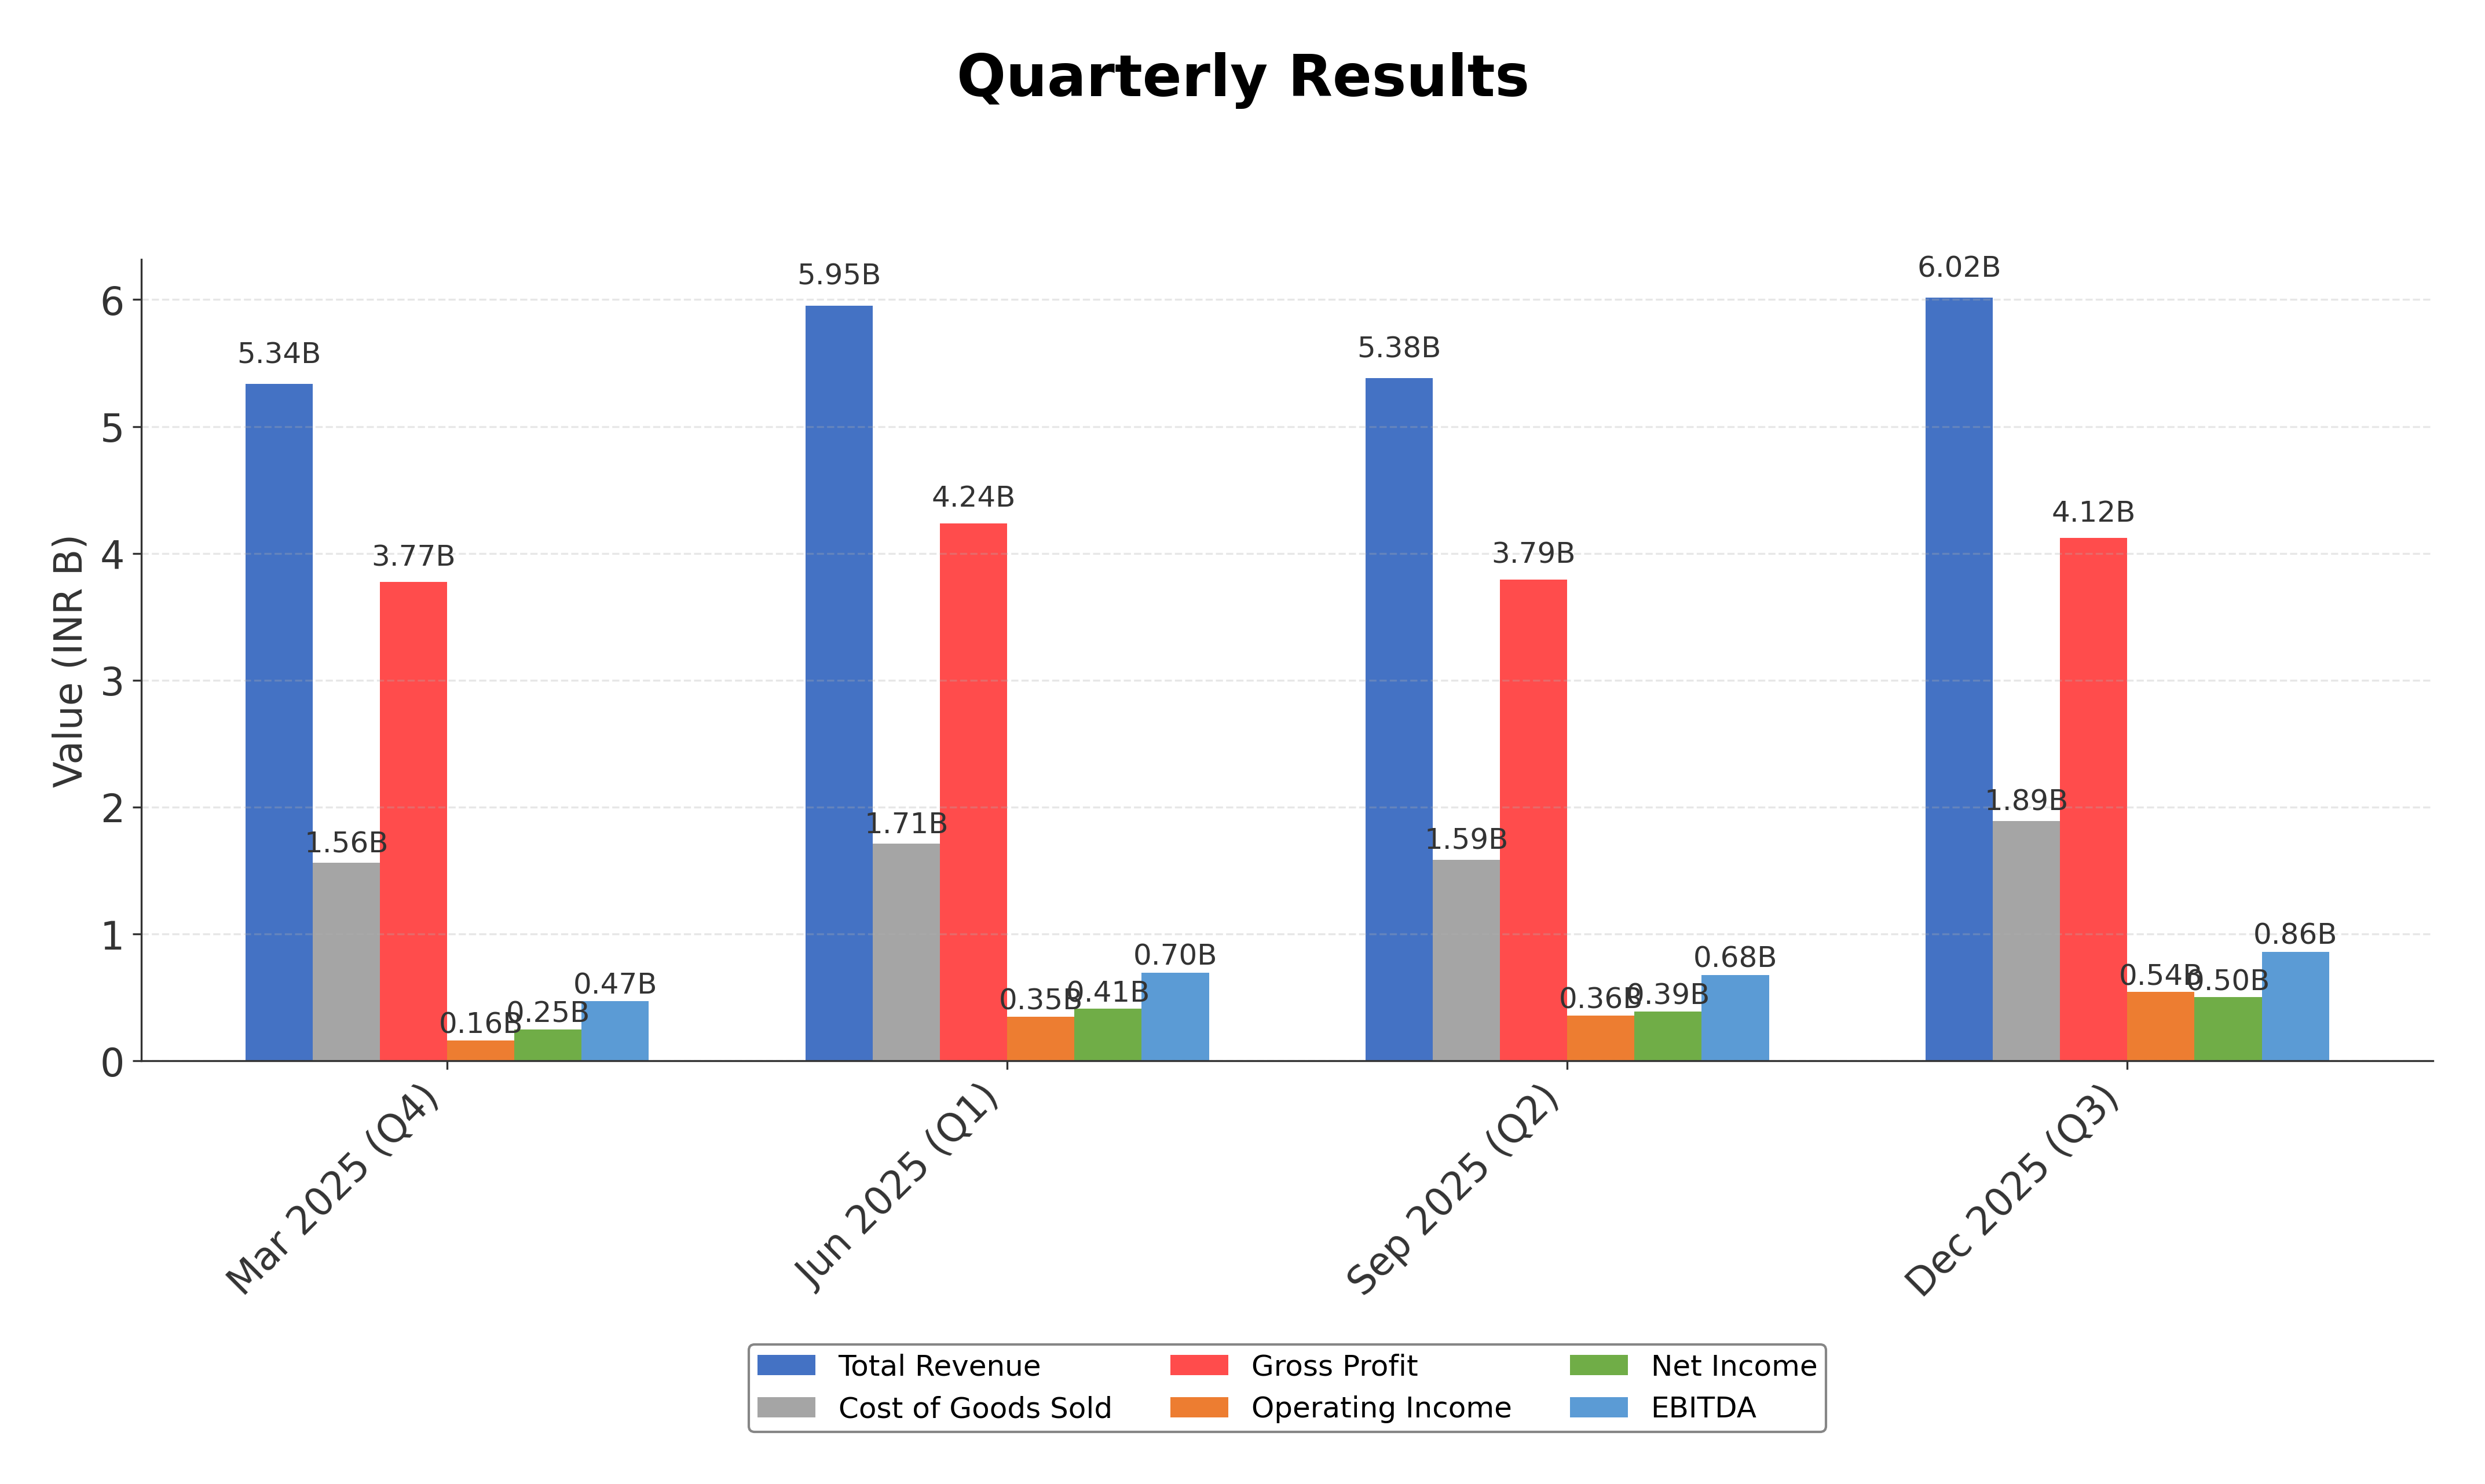
Financials
Peer Analysis
| Company Name | Market Cap | P/E Ratio | P/B Ratio | EV/EBITDA | Price to CFO |
|---|---|---|---|---|---|
| Honasa Consumer Ltd. | ₹98.95B | 63.73 | 7.75 | 61.47 | -491.37 |
| Colgate-Palmolive (India) Ltd. | ₹497.60B | 37.51 | 31.45 | 26.15 | 27.75 |
| Dabur India Ltd. | ₹740.07B | 40.24 | 6.76 | 29.73 | 46.01 |
| Emami Ltd. | ₹173.87B | 21.86 | 5.93 | 16.80 | 18.14 |
| Gillette India Ltd. | ₹246.59B | 46.26 | 21.21 | 26.55 | 39.76 |
| Procter & Gamble Hygiene Limited | ₹316.72B | 44.29 | 34.01 | 26.28 | 40.48 |
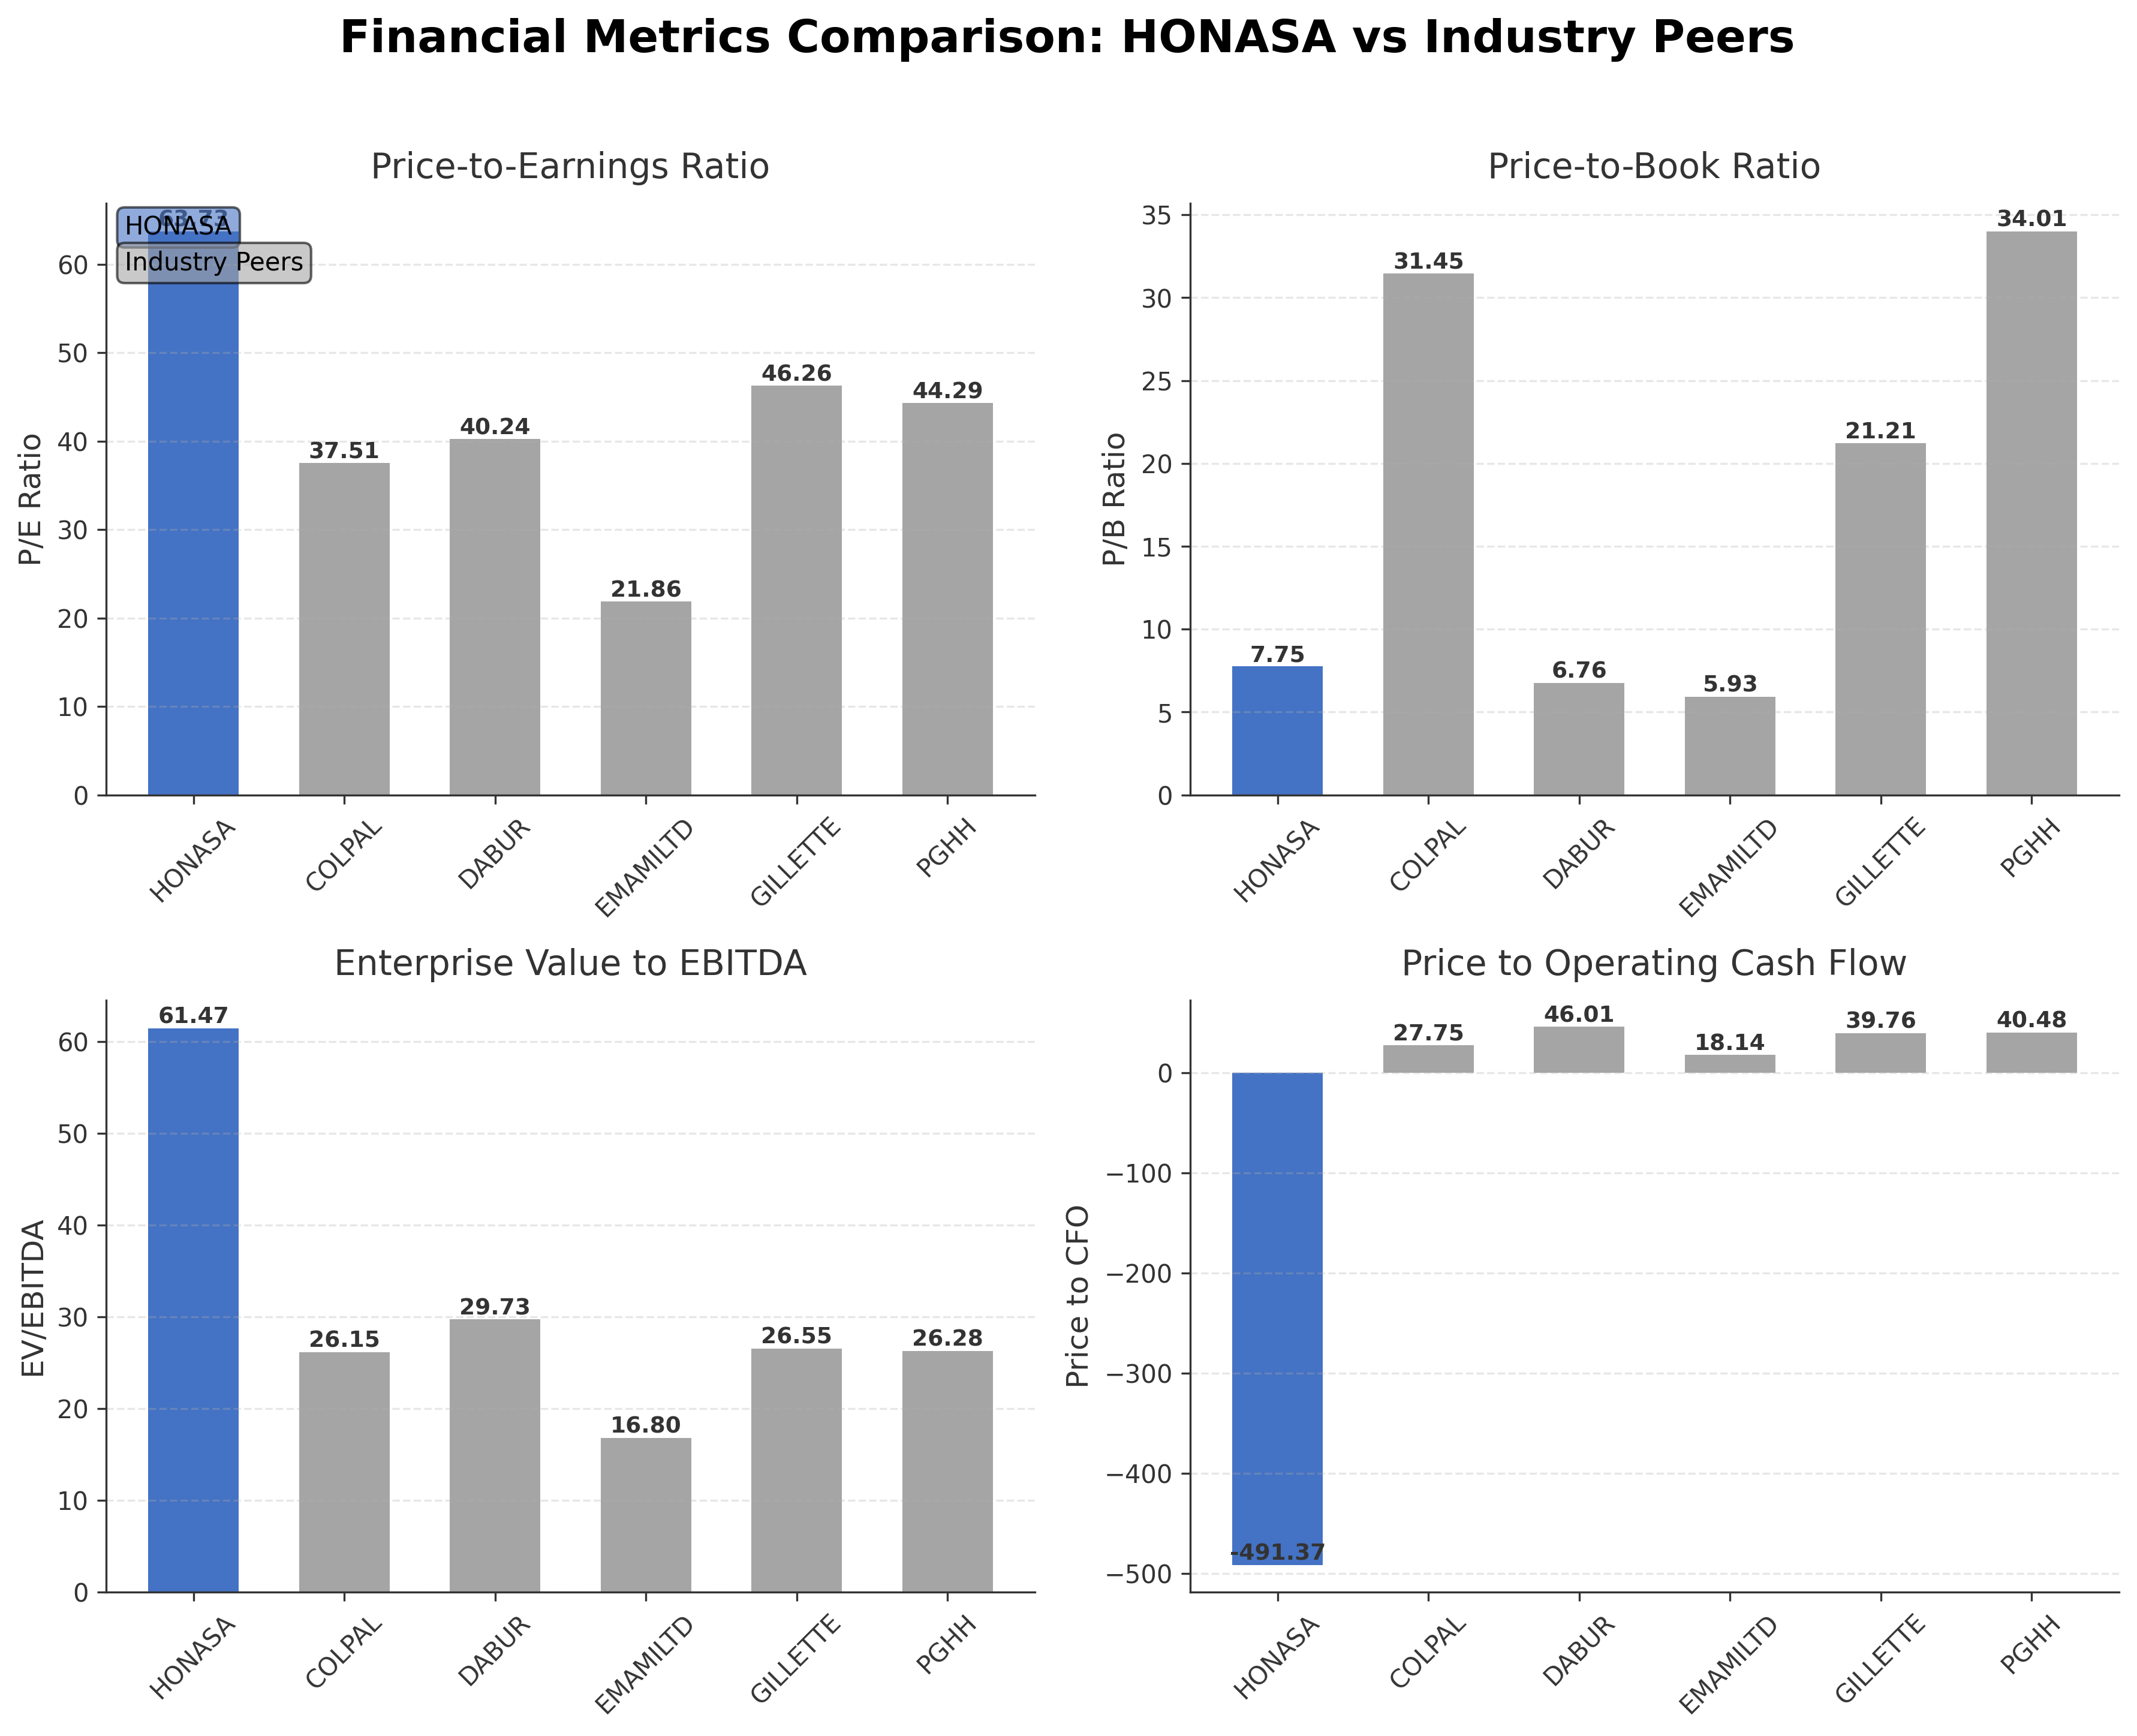
Comparison Analysis: Honasa Consumer Ltd. exhibits higher valuation multiples compared to its Indian household and personal products peers, with a trailing P/E of 63.73 versus peer averages ranging from approximately 22 to 46. The company's price-to-book ratio of 7.75 is moderate relative to some peers with notably higher P/B ratios, such as Colgate-Palmolive and Procter & Gamble Hygiene. Honasa’s EV/EBITDA ratio at 61.47 is significantly elevated compared to peer levels between 16.80 and 29.73, indicating premium market expectations. Return on equity is lower at 6.16% compared to peers, reflecting a growth-focused profile. The negative price to cash flow ratio contrasts with positive cash flow metrics among competitors, highlighting areas for operational improvement.
Financial Metrics Comparison with Peers
Financial Statements
Comprehensive financial data including income, balance sheet, and cash flow metrics
Income Statement
| fiscal_date | 2025-03-31 | 2024-03-31 | 2023-03-31 | 2022-03-31 | 2021-03-31 |
|---|---|---|---|---|---|
| Sales | 20.67B | 19.20B | 14.93B | 9.43B | 4.60B |
| Cost Of Goods | 6.13B | 5.81B | 4.47B | 2.83B | 1.33B |
| Gross Profit | 14.54B | 13.39B | 10.46B | 6.60B | 3.27B |
| Operating Expense Research And Development | 290.00K | 2.94M | 35.34M | 7.69M | 0.00 |
| Operating Expense Selling General And Administrative | 10.56B | 9.26B | 7.53B | 5.25B | 2.49B |
| Operating Expense Other Operating Expenses | 977.73M | 798.38M | 866.17M | 365.49M | 165.64M |
| Operating Income | 252.97M | 1.08B | -21.55M | 52.92M | 255.10M |
| Non Operating Interest Income | 563.41M | 254.33M | 110.02M | 66.59M | 19.38M |
| Non Operating Interest Expense | 118.93M | 86.52M | 61.02M | 26.80M | 9.21M |
| Pretax Income | 896.13M | 1.47B | -1.41B | 224.39M | -13.25B |
| Income Tax | 169.26M | 366.02M | 99.26M | 79.96M | 76.06M |
| Net Income | 726.87M | 1.11B | -1.51B | 144.43M | -13.32B |
| Eps Basic | 2.24 | 3.57 | -4.44 | 0.49 | -41.41 |
| Eps Diluted | 2.23 | 3.55 | -4.44 | 0.49 | -41.41 |
| Basic Shares Outstanding | 325.09M | 313.29M | 321.75M | 321.75M | 321.75M |
| Diluted Shares Outstanding | 325.09M | 313.29M | 321.75M | 321.75M | 321.75M |
| Ebit | 1.02B | 1.56B | -1.35B | 251.19M | -13.24B |
| Ebitda | 1.29B | 1.66B | -1.01B | 192.09M | -13.32B |
| Net Income Continuous Operations | 896.13M | 1.47B | -1.41B | 224.39M | -13.25B |
| Minority Interests | 0.00 | 12.47M | 81.57M | 12.72M | 0.00 |
| Preferred Stock Dividends | 0.00 | 0.00 | 0.00 | 0.00 | 0.00 |
Data provided by Twelve Data
Balance Sheet
| fiscal_date | 2025-03-31 | 2024-03-31 | 2023-03-31 | 2022-03-31 | 2021-03-31 |
|---|---|---|---|---|---|
| Cash And Cash Equivalents | 329.67M | 1.07B | 82.55M | 337.45M | 97.59M |
| Accounts Receivable | 1.32B | 1.59B | 1.31B | 727.86M | 338.43M |
| Total Assets | 17.90B | 16.32B | 9.77B | 10.35B | 3.03B |
| Total Liabilities | 6.10B | 5.37B | 3.71B | 3.29B | 20.68B |
| Long Term Debt | 1.10B | 1.12B | 739.38M | 497.96M | 185.88M |
| Shareholders Equity | 11.80B | 10.95B | 6.06B | 7.06B | -17.65B |
Data provided by Twelve Data
Cash Flow Statement
| fiscal_date | 2025-03-31 | 2024-03-31 | 2023-03-31 | 2022-03-31 | 2021-03-31 |
|---|---|---|---|---|---|
| Operating Activities Net Income | 896.13M | 1.47B | -1.41B | 224.39M | -13.25B |
| Operating Activities Stock Based Compensation | 71.00M | 130.69M | 273.91M | 167.75M | 41.54M |
| Operating Activities Other Non Cash Items | -436.92M | -202.79M | -43.39M | -36.54M | -9.63M |
| Operating Activities Accounts Receivable | 144.92M | -389.51M | -695.81M | -331.17M | -235.35M |
| Operating Activities Other Assets Liabilities | -876.50M | 403.61M | -641.66M | -356.96M | -325.83M |
| Operating Activities Operating Cash Flow | -201.37M | 1.41B | -2.52B | -332.53M | -13.78B |
| Investing Activities Capital Expenditures | -166.01M | -117.68M | -117.19M | -14.08M | -10.20M |
| Investing Activities Net Intangibles | -32.81M | -320.00K | 0.00 | -12.20M | 0.00 |
| Investing Activities Net Acquisitions | 0.00 | -230.08M | -464.33M | -2.20B | 0.00 |
| Investing Activities Purchase Of Investments | -8.91B | -5.27B | -1.55B | -7.30B | -749.87M |
| Investing Activities Sale Of Investments | 7.26B | 790.72M | 2.47B | 4.50B | 529.50M |
| Investing Activities Other Investing Activity | -470.00K | -1.88M | -8.13M | N/A | N/A |
| Investing Activities Investing Cash Flow | -1.81B | -4.83B | 339.52M | -5.01B | -230.57M |
| Financing Activities Common Stock Issuance | 47.89M | 3.63B | 49.01M | 4.87B | 900.00K |
| Financing Activities Financing Cash Flow | 47.89M | 3.63B | -390.00K | 4.87B | 900.00K |
| End Cash Position | 329.67M | 1.07B | 46.46M | 303.88M | 97.59M |
| Free Cash Flow | 817.86M | 2.24B | -632.73M | 419.60M | 287.06M |
| Financing Activities Long Term Debt Payments | N/A | 0.00 | -24.70M | 0.00 | 0.00 |
| Financing Activities Short Term Debt Issuance | N/A | 0.00 | -24.70M | 0.00 | 0.00 |
Data provided by Twelve Data
Technical Analysis
Key Insights
- The current trend direction shows a bullish momentum with price action above the 50-day and 200-day moving averages, supported by a recent Golden Cross formation.
- Key support levels are identified near ₹285, while resistance is observed around the 52-week high of ₹334.
- The stock price is trading above the 10-day (short-term), 50-day (medium-term), and 200-day (long-term) moving averages, indicating sustained upward momentum.
- Momentum indicators show RSI in the mid to high range, MACD lines crossing positively, and Stochastic oscillators signaling bullish momentum.
- Multi-timeframe analysis reveals consistent bullish signals across daily, weekly, and monthly charts, confirming strength in various trading horizons.
- Potential market scenarios include continuation of the uptrend if support levels hold, with possible consolidation near resistance zones before further directional moves.
Trending News
Summary: Experts & Broker view also get the Honasa Consumer Ltd. buy/sell tips detailed news, announcements, Forecasts, Analysts, Valuation, Earning forecasts, Estimates, Recommendations, Analysts Ratings, financial report, company information, annual report, balance sheet, profit & loss account, results ...
Sentiment: neutral
2. Headline: Honasa Consumer Ltd Upgraded to Buy on Strong Financials and Bullish Technicals
Summary: Honasa Consumer Ltd has seen its investment rating upgraded from Hold to Buy, reflecting significant improvements across technical indicators, financial trends, valuation metrics, and overall quality. The upgrade, effective from 6 April 2026, is underpinned by robust quarterly results, bullish ...
Sentiment: positive
Summary: According to ASCI data, Honasa Consumer Private Limited has emerged as the biggest violator, with 23 advertisements flagged for modification. A further 17 instances involved inadequate or missing influencer disclosures.
Sentiment: neutral
4. Headline: Honasa Consumer Ltd Gains 2.28%: 4 Key Factors Driving This Week’s Market Moves
Summary: Honasa Consumer Ltd recorded a modest weekly gain of 2.28%, closing at Rs.304.95 on 2 April 2026, outperforming the BSE Sensex which declined by 0.29% over the same period. The week was marked by significant shifts in the company’s technical momentum and valuation metrics, with an initial ...
Sentiment: positive
5. Headline: Honasa Consumer Ltd Upgraded to Buy on Strong Technical and Financial Performance
Summary: Honasa Consumer Ltd, a small-cap player in the FMCG sector, has seen its investment rating upgraded from Hold to Buy as of 27 March 2026. This upgrade reflects significant improvements across technical indicators, valuation metrics, financial trends, and overall quality assessments, signalling ...
Sentiment: positive
6. Headline: Honasa Consumer Ltd Technical Momentum Shifts to Bullish Amid Strong Market Returns
Summary: Honasa Consumer Ltd has demonstrated a notable shift in price momentum, supported by a series of bullish technical indicators that suggest strengthening investor confidence. The company’s recent upgrade from a Hold to a Buy rating, alongside improved moving averages and MACD signals, highlights ...
Sentiment: positive
7. Headline: Honasa Consumer Ltd Valuation Shifts Signal Changing Market Sentiment
Summary: Honasa Consumer Ltd, a small-cap player in the FMCG sector, has recently undergone a notable shift in its valuation parameters, moving from a fair to an expensive rating. This change reflects evolving market perceptions and has important implications for investors assessing the stock’s price ...
Sentiment: positive
8. Headline: Honasa Consumer Ltd is Rated Buy
Summary: Honasa Consumer Ltd is rated 'Buy' by MarketsMOJO, with this rating last updated on 27 Mar 2026. However, the analysis and financial metrics discussed here reflect the stock's current position as of 29 March 2026, providing investors with the most up-to-date insight into the company’s performance ...
Sentiment: neutral
9. Headline: Honasa Consumer Ltd Hits Intraday High with 7.32% Surge on 18 Mar 2026
Summary: Honasa Consumer Ltd recorded a robust intraday performance on 18 Mar 2026, surging to a day’s high of Rs 283.2, marking a 7.35% increase. This sharp uptick outpaced the FMCG sector and broader market indices, reflecting a notable reversal after a five-day decline.
Sentiment: positive
10. Headline: Honasa Consumer Ltd Forms Golden Cross, Signalling Potential Bullish Breakout
Summary: Honasa Consumer Ltd, a prominent player in the FMCG sector, has recently formed a Golden Cross—a significant technical indicator where the 50-day moving average (DMA) has crossed above the 200-DMA. This development often signals a potential bullish breakout, indicating a shift in long-term ...
Sentiment: positive
Powered by Brave
Recent Updates
News Summary
Recent news highlights a positive shift in Honasa Consumer Ltd.'s technical momentum, moving towards a bullish outlook amid market volatility. The company has experienced an upgrade in investment ratings from Hold to Buy, supported by strong financial performance and improved technical indicators. However, some reports maintain a neutral or sell stance, reflecting mixed market views. Regulatory scrutiny regarding advertising practices has surfaced as a notable theme, with the company flagged for ad norm breaches. Overall, developments indicate strengthening market confidence balanced by compliance challenges, with ongoing attention to operational and strategic execution.
News Sentiment
Sentiment trends lean positive, driven by upgrades in technical and financial assessments and strong market returns. Neutral and slightly negative sentiments arise from regulatory concerns and divergent analyst opinions, creating a nuanced market perception. The balance of positive momentum and regulatory scrutiny suggests cautious optimism in market reactions.
Analytical Overview
Analysis Summary
Honasa Consumer Ltd.’s valuation metrics, including a trailing P/E of 63.73 and forward P/E of 44.96, exceed the industry average of 63.73, reflecting premium pricing relative to earnings. The PEG ratio of 0.69 indicates growth expectations are factored into the valuation.
The company exhibits a strong revenue growth rate of 16.2% quarterly and a significant year-over-year earnings growth of 92.9%, supported by a gross margin of 68.5%. However, operating cash flow remains negative, indicating short-term cash generation challenges.
Financial health is supported by a low debt-to-equity ratio of 0.11 and a current ratio near 1.92, indicating liquidity adequacy. Free cash flow is positive at approximately INR 727 million, offsetting operating cash flow deficits.
Sector-specific challenges include regulatory scrutiny on advertising practices and competitive pressures in the personal care market. Opportunities arise from increasing consumer demand for natural and sustainable products in India’s expanding economy.
Considering the Indian market environment, regulatory frameworks and evolving consumer trends towards eco-friendly products influence growth prospects and strategic direction.
Overall Business and Market Assessment
Supporting Factors: Primary supporting factors include robust revenue and earnings growth, strong gross margins, and a healthy liquidity position.
Risk Factors: Main risk factors to monitor are negative operating cash flow trends and regulatory compliance issues related to advertising.
SWOT Analysis
Strengths
- Strong brand presence in natural and toxin-free personal care products.
- High gross margin of 68.5% indicating efficient cost management.
- Robust revenue growth of 16.2% quarterly and 92.9% earnings growth year-over-year.
- Healthy liquidity with a current ratio of 1.92 and low debt-to-equity ratio of 0.11.
Weaknesses
- Negative operating cash flow indicating short-term cash generation challenges.
- High valuation multiples compared to industry peers, including a trailing P/E of 63.73.
- Relatively low return on equity at 6.16% compared to competitors.
- Regulatory scrutiny due to advertising norm breaches affecting reputation.
Opportunities
- Growing consumer demand for sustainable and organic personal care products in India.
- Expansion potential through digital platforms and direct-to-consumer sales channels.
- Increasing institutional investor interest supporting strategic initiatives.
- Potential to improve operational cash flow and profitability through scale.
Threats
- Regulatory risks related to advertising compliance and influencer disclosures.
- Intense competition from established personal care companies in India.
- Market volatility impacting valuation and investor sentiment.
- Operational risks associated with scaling and maintaining product quality.
Company Description
Honasa Consumer Ltd. is a dynamic personal care company, prominently known for brands like Mamaearth. This company focuses on manufacturing and distributing a wide range of natural and toxin-free personal care products. One of its primary functions is to provide consumers with ethically produced skincare, haircare, and baby care products that cater to environmentally conscious individuals. Honasa's product offerings are distinguished by their commitment to organic ingredients, aligning with the increasing consumer demand for sustainable and eco-friendly solutions. Operating in the consumer goods sector, Honasa Consumer Ltd. significantly impacts the personal care industry by promoting transparency and leveraging digital platforms for direct consumer outreach and engagement. Its market presence is further strengthened by a strong online sales strategy and adept utilization of social media for brand building. Honasa Consumer Ltd. plays a pivotal role in the shift towards sustainable personal care products, contributing positively to industry trends with their innovative, conscientious approach.