
Home First Finance Company India Ltd (HOMEFIRST)
Stock Analysis Report
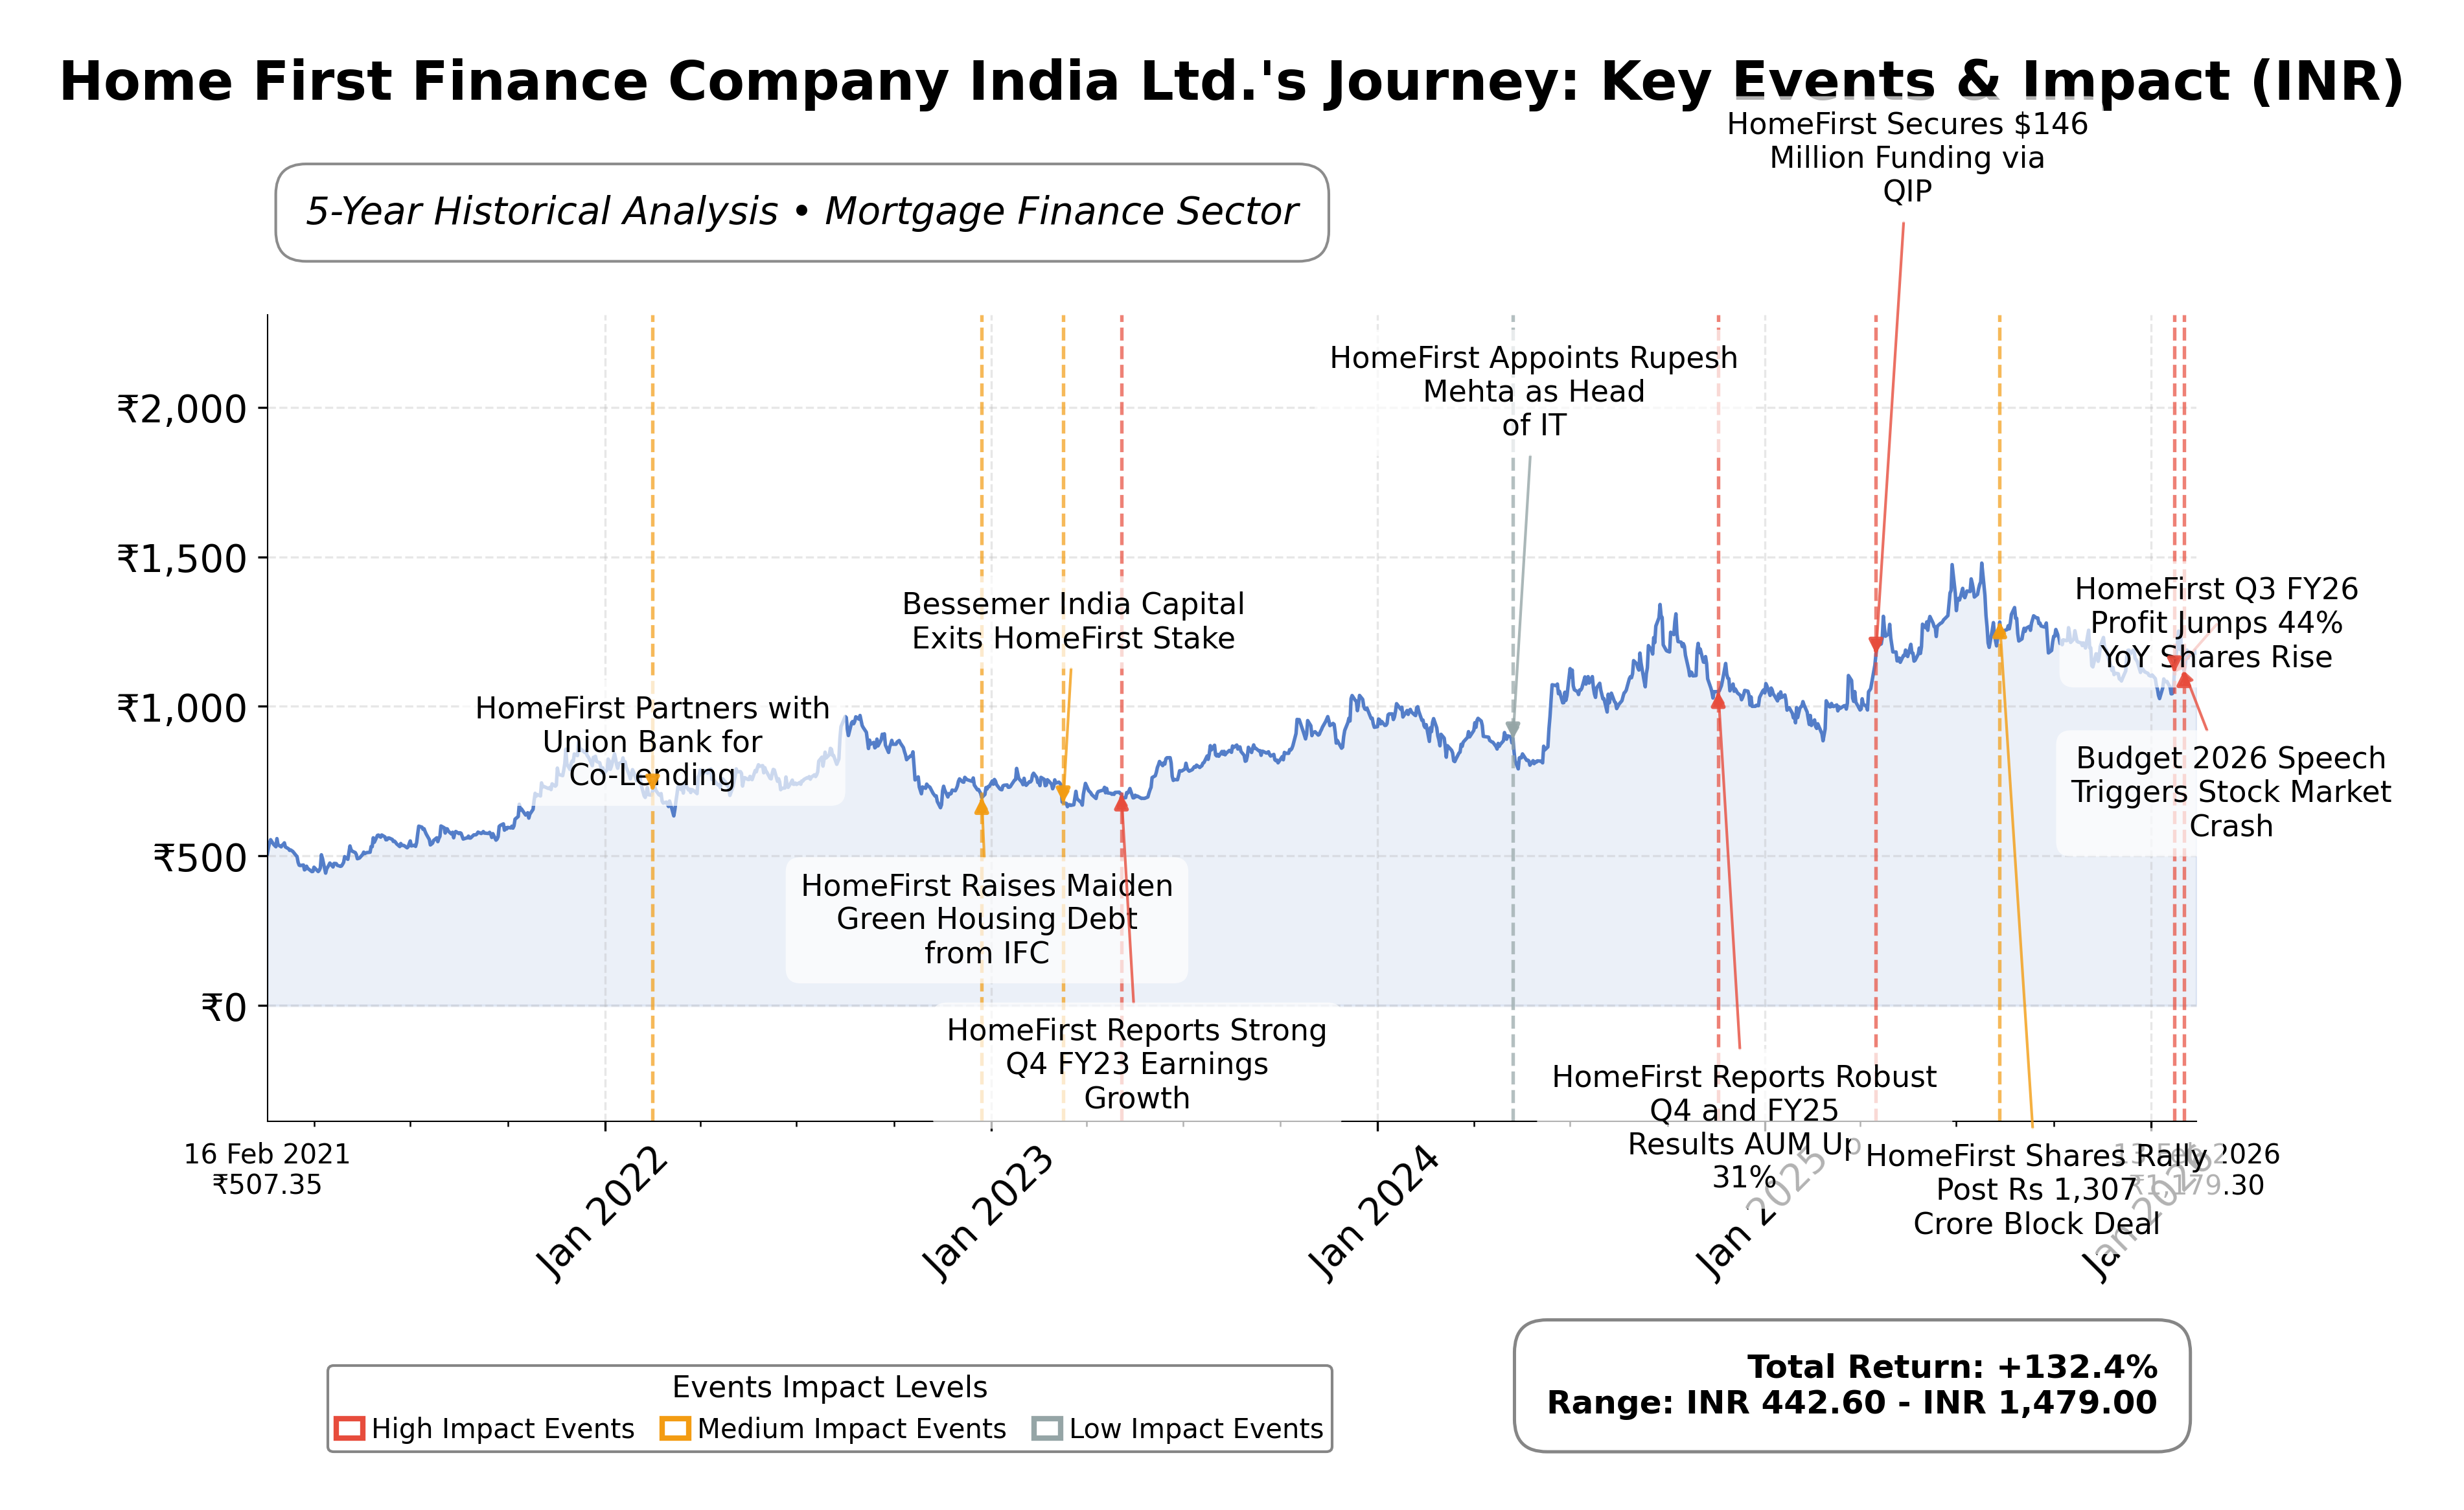
Stock Journey
Key Positives and Key Risks
Pros
- Revenue growth of 34.6% quarterly indicates strong top-line expansion.
- Profit margin of 50.24% reflects high operational efficiency.
- Institutional ownership at 60.93% suggests robust governance and market confidence.
Cons
- Debt-to-equity ratio of 3.79 highlights elevated financial leverage.
- Negative operating cash flow of ₹-26.27 billion raises liquidity concerns.
- EV/EBITDA ratio of 45.65 indicates a premium valuation relative to earnings.
Disclosure: This information is for general awareness and does not constitute investment advice
Report Summary
Home First Finance Company India Ltd. operates in the mortgage finance sector, focusing on providing affordable housing finance solutions primarily to low and middle-income groups across India. The company plays a vital role in India's housing ecosystem by offering accessible mortgage products tailored to salaried and self-employed professionals, thereby promoting financial inclusion in underserved markets. Its broad geographic presence underscores its commitment to democratizing home ownership in a rapidly growing residential property market.
Financially, Home First exhibits a market capitalization of approximately â¹122.89 billion with a trailing P/E ratio of 24.04 and a forward P/E of 18.56, indicating a valuation slightly above the industry average P/E of 24.04. The company shows robust revenue growth of 34.6% year-over-year and a profit margin exceeding 50%, reflecting operational efficiency. However, the enterprise value to EBITDA ratio is notably high at 45.65, suggesting premium valuation relative to earnings before interest, taxes, depreciation, and amortization.
From a strategic and technical perspective, Home First has demonstrated strong quarterly earnings growth and maintains a positive momentum with bullish RSI signals. The company is pursuing strategic initiatives aimed at achieving 25% annual asset under management growth by FY27. Notable risks include a high debt-to-equity ratio of 3.79 and negative operating cash flow, which warrant monitoring. Leadership and market sentiment appear stable, with recent shareholding patterns reflecting institutional confidence.
In comparison to its Indian mortgage finance peers such as Can Fin Homes, LIC Housing Finance, and PNB Housing Finance, Home First commands a competitive market cap but trades at higher valuation multiples, including P/E and EV/EBITDA ratios. While peers like LIC Housing Finance exhibit lower P/E and P/B ratios, Home First's growth metrics and strategic focus on affordable housing provide differentiated positioning within the sector.
Navigating a dynamic and competitive mortgage finance landscape, Home First Finance Company India Ltd. stands at a pivotal juncture with significant growth ambitions balanced against elevated leverage and valuation metrics. The companyâs ability to sustain its revenue momentum and manage financial risks will be critical in shaping its future trajectory. Given the current data and market context, a balanced approach that considers both growth potential and valuation discipline may be appropriate for those evaluating the stock.
Company and Industry Overview
Company Basics
Price Performance
Company Size
Shareholding Pattern
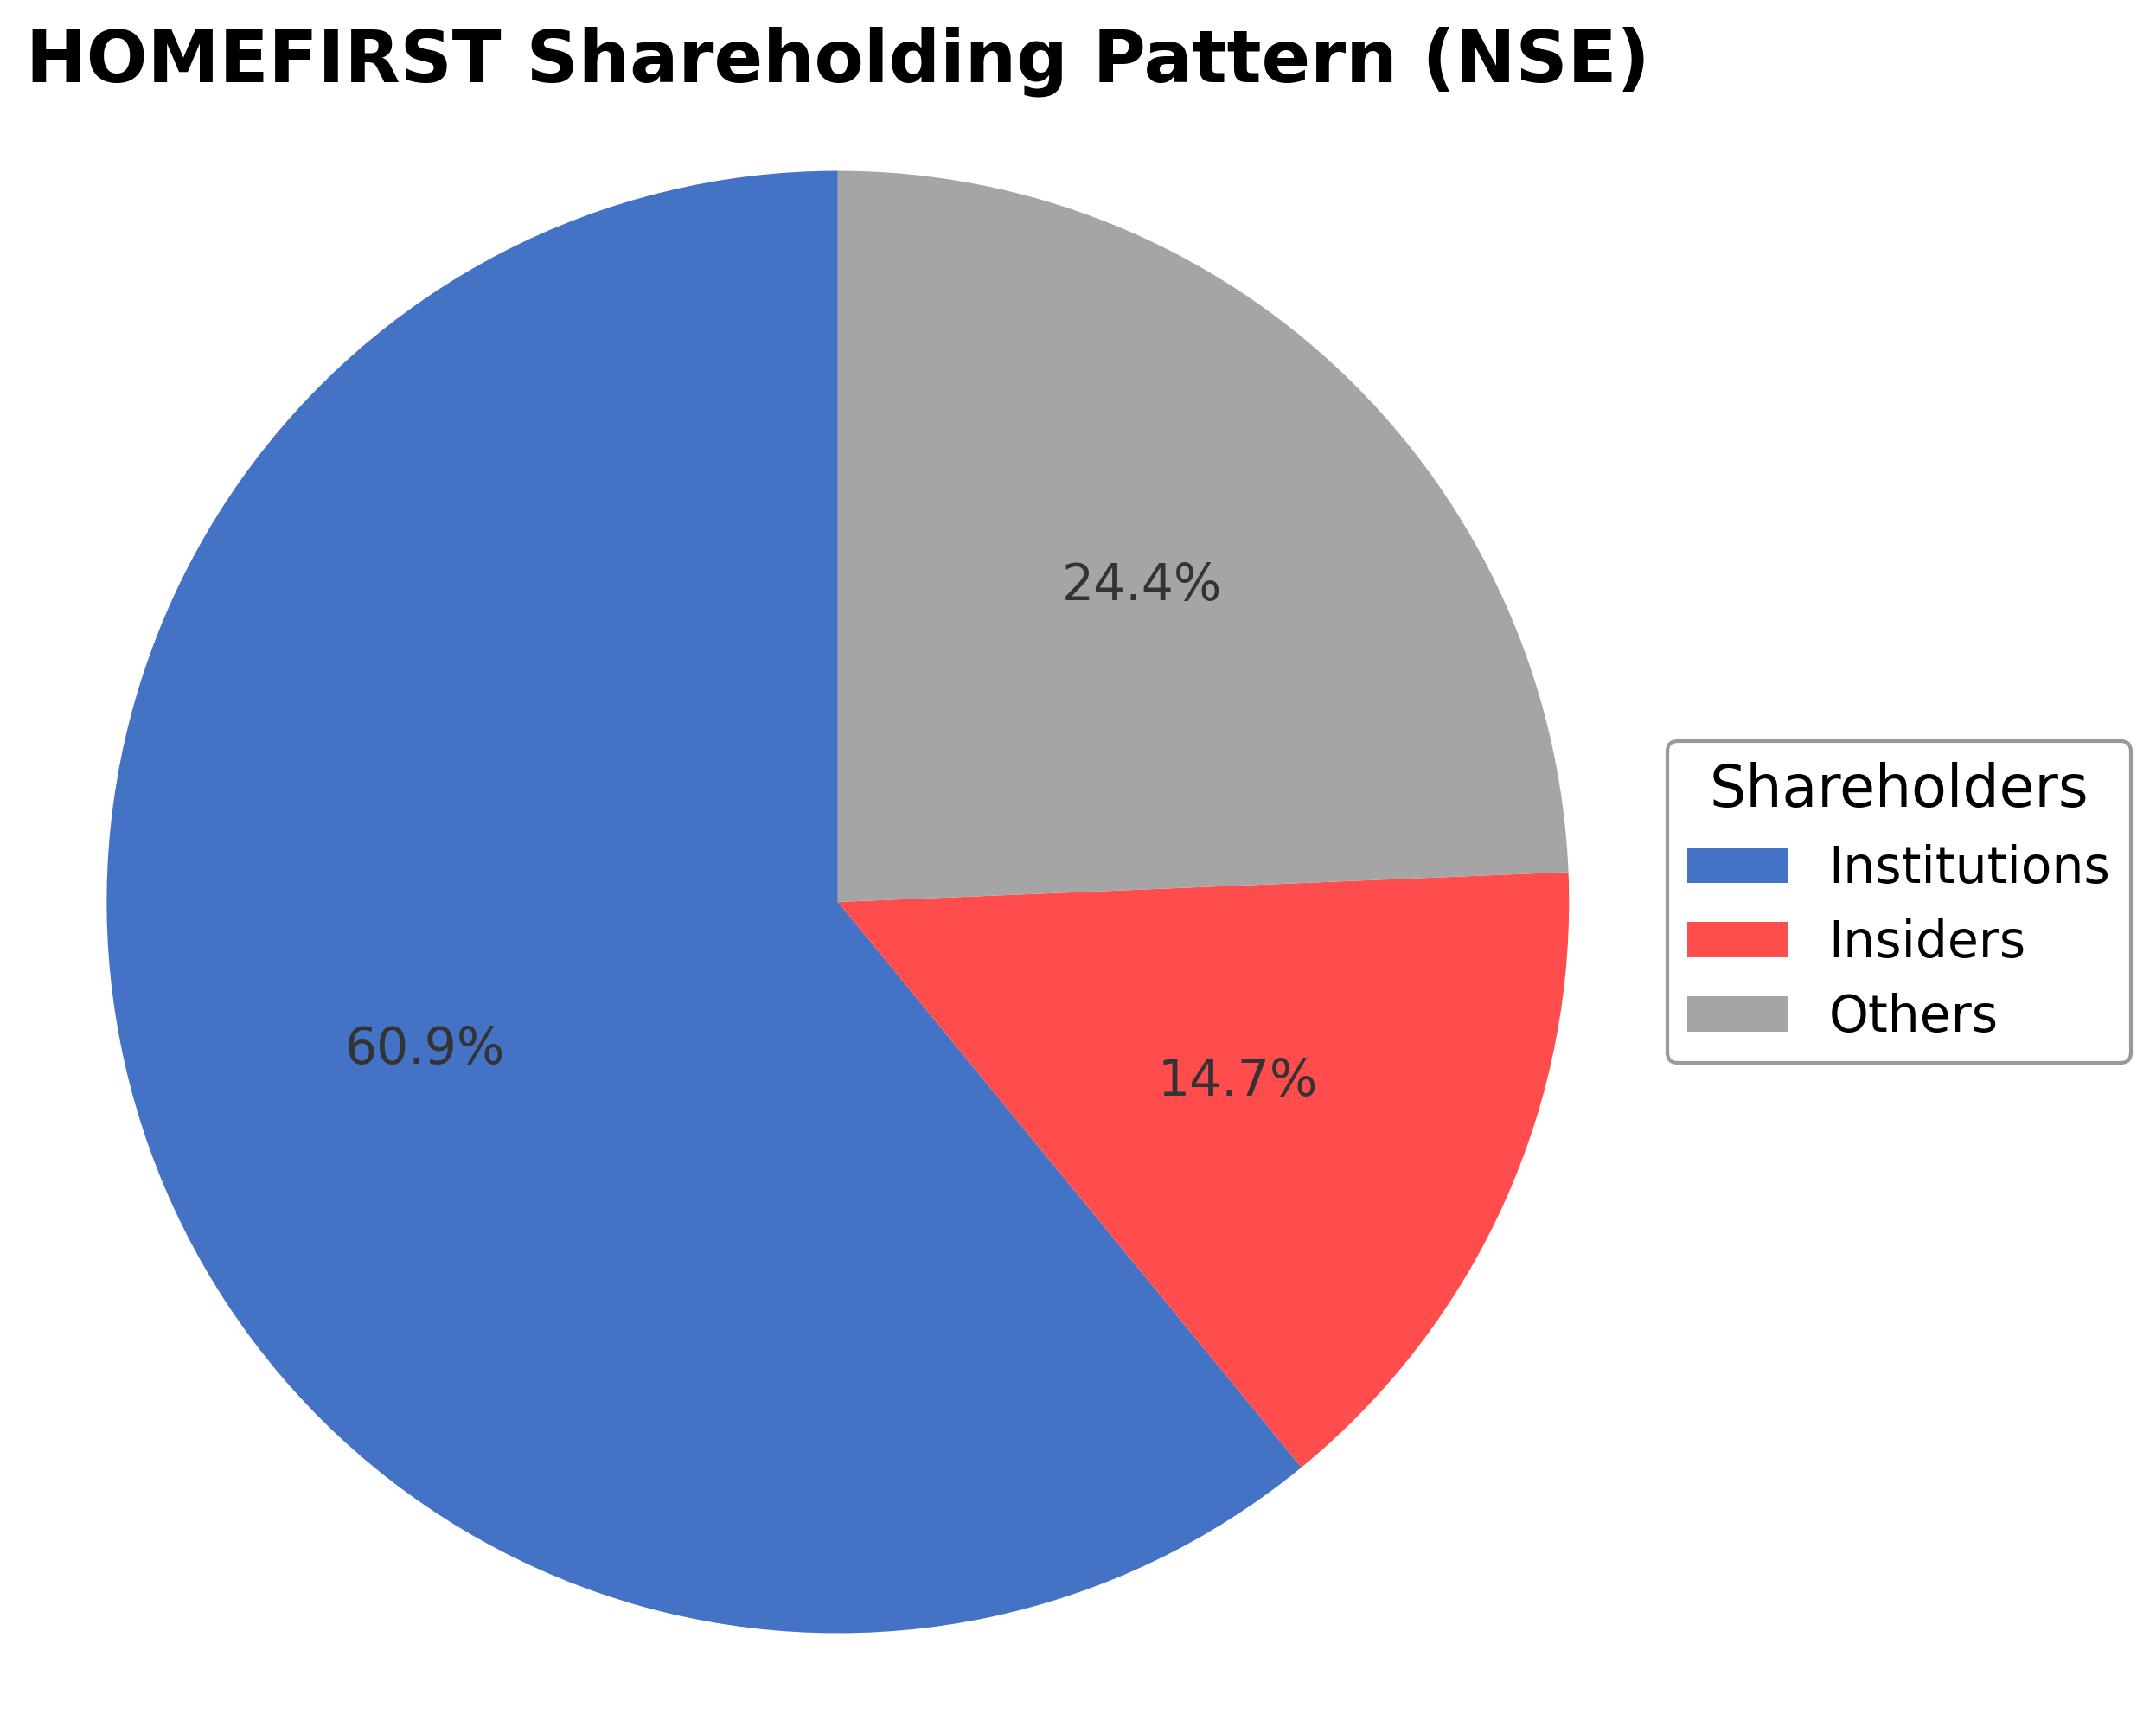
Home First Finance Company India Ltd.'s shareholding structure is characterized by insiders holding approximately 14.73%, institutional investors controlling a significant 60.93%, and the remaining 24.34% held by public and other shareholders. Over the past 12-24 months, institutional investors have maintained a steady accumulation trend, reflecting confidence in the company's growth prospects. Major funds and asset managers have shown increased positions, signaling positive market sentiment. This ownership distribution supports robust governance and strategic direction, aligning with the company's focus on affordable housing finance within India's expanding mortgage sector.
Sector and Industry Analysis
Home First Finance Company India Ltd. (NSE: HOMEFIRST) operates within the Indian housing finance sector, a critical subset of the broader financial services industry. The housing finance sector in India has witnessed robust growth over the past decade, driven by rising urbanization, increasing disposable incomes, and government initiatives promoting affordable housing. The market size is substantial, with outstanding housing loans in India crossing several trillion INR, supported by a growing middle class and favorable demographics. Key players include established banks, large housing finance companies (HFCs) such as HDFC Ltd., LIC Housing Finance, and non-banking financial companies (NBFCs) like Home First Finance, which focus on affordable housing segments and underserved customer bases.
Industry trends reflect a significant shift towards digitization and customer-centric technology adoption. Fintech integration, including AI-driven credit underwriting and digital loan origination platforms, is enhancing operational efficiency and customer experience. Consumer behavior is evolving with increased demand for affordable and mid-income housing, supported by government schemes like PMAY (Pradhan Mantri Awas Yojana) that incentivize home ownership. Additionally, the sector is witnessing emerging opportunities in green housing finance and sustainable real estate projects, aligning with global ESG trends. The penetration of formal housing finance in semi-urban and rural areas is also expanding, driven by improved credit accessibility and financial literacy.
The regulatory landscape is shaped primarily by the National Housing Bank (NHB) and the Reserve Bank of India (RBI), which oversee housing finance companies and NBFCs respectively. Key regulations include capital adequacy norms, asset classification and provisioning standards, and interest rate guidelines to ensure sector stability. Recent regulatory reforms have focused on tightening risk management frameworks and enhancing transparency, particularly after the NBFC liquidity crisis in 2018-2019. Compliance with KYC/AML norms and adherence to fair lending practices are mandatory, with ongoing policy support for affordable housing through tax incentives and subsidies. Regulatory shifts towards harmonizing NBFC and banking sector norms continue to impact operational strategies.
Competitive dynamics in the housing finance sector are characterized by a mix of large incumbents and niche players targeting specific customer segments. The market structure is moderately concentrated, with high entry barriers due to capital requirements, regulatory compliance, and the need for extensive distribution networks. Home First Finance differentiates itself by focusing on affordable housing finance with a technology-enabled underwriting model that reduces costs and turnaround times. Competitive positioning hinges on product innovation, customer acquisition efficiency, and risk management capabilities. The sector’s competitive intensity is heightened by the entry of fintech lenders and increasing collaboration between traditional HFCs and digital platforms, necessitating continuous adaptation to maintain market share.
Note: Analysis synthesized from industry research, market reports, and regulatory filings. Information is subject to change based on market conditions.
Illustrative Scenario Analysis
DCF Assumptions:
Method: Two-Stage EPS-Priority Model
Financials
Peer Analysis
| Company Name | Market Cap | P/E Ratio | P/B Ratio | EV/EBITDA | Price to CFO |
|---|---|---|---|---|---|
| Home First Finance Company India Ltd. | ₹122.89B | 24.04 | 3.04 | 45.65 | -4.68 |
| Can Fin Homes Ltd. | ₹117.77B | 12.14 | 2.17 | N/A | 10.85 |
| LIC Housing Finance Ltd. | ₹279.24B | 5.09 | 0.72 | N/A | -19.80 |
| PNB Housing Finance Ltd. | ₹217.80B | 9.98 | 1.21 | N/A | 3.04 |
| Aadhar Housing Finance Ltd. | ₹202.43B | 20.02 | 2.93 | 16.20 | -31.21 |
| Aavas Financiers Ltd. | ₹101.89B | 16.38 | 2.17 | 39.96 | -6.49 |
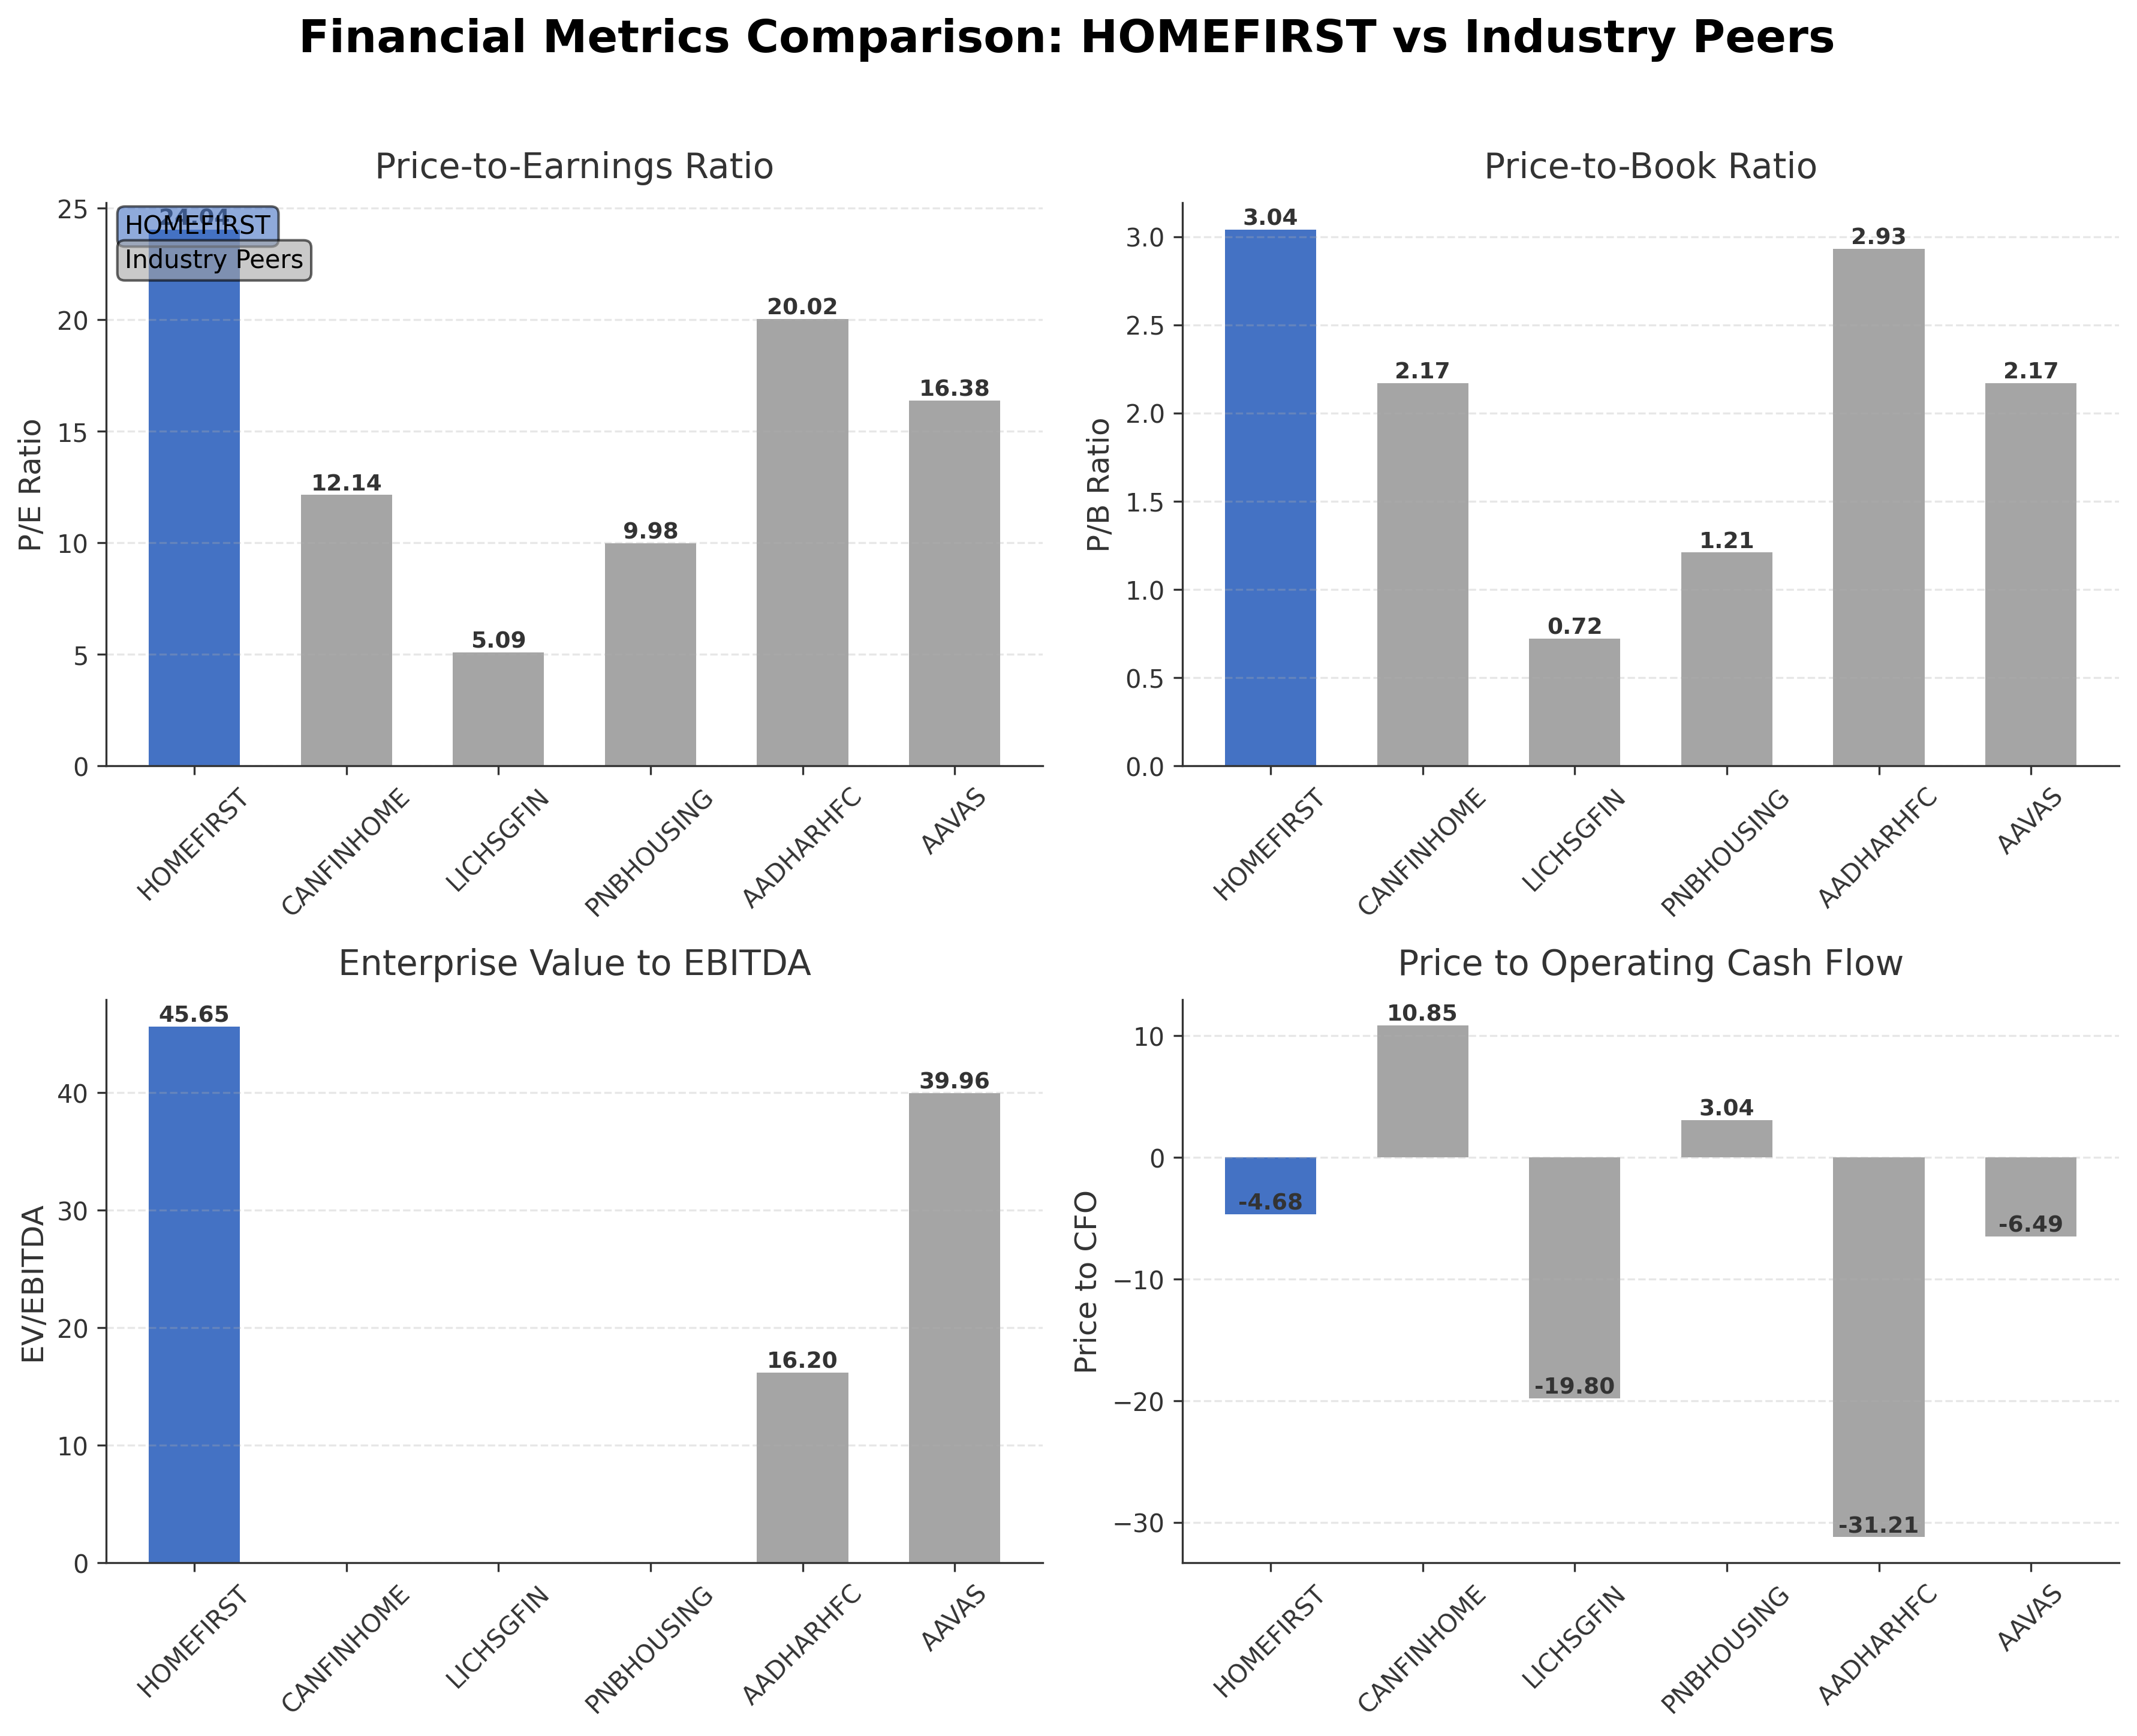
Comparison Analysis: Home First Finance Company India Ltd. exhibits higher valuation multiples compared to its regional peers, with a P/E ratio of 24.04 and EV/EBITDA of 45.65, indicating a premium market positioning. While peers such as LIC Housing Finance and PNB Housing Finance trade at lower P/E and P/B ratios, Home First's elevated multiples reflect its strong revenue growth and strategic focus on affordable housing. The negative price to CFO ratio contrasts with some peers showing positive cash flow metrics, highlighting areas for operational improvement. Overall, Home First stands out for its growth trajectory but carries valuation and cash flow considerations relative to its industry counterparts.
Financial Metrics Comparison with Peers
Financial Statements
Comprehensive financial data including income, balance sheet, and cash flow metrics
Income Statement
| fiscal_date | 2025-03-31 | 2024-03-31 | 2023-03-31 | 2022-03-31 | 2021-03-31 |
|---|---|---|---|---|---|
| Sales | 13.25B | 10.38B | 7.33B | 4.78B | 4.08B |
| Cost Of Goods | 8.38B | 6.48B | 4.11B | 2.85B | 2.75B |
| Gross Profit | 4.88B | 3.89B | 3.21B | 1.93B | 1.33B |
| Operating Expense Selling General And Administrative | 210.59M | N/A | 127.28M | 110.52M | 83.65M |
| Operating Expense Other Operating Expenses | 566.20M | 712.18M | 584.87M | 244.22M | 193.67M |
| Operating Income | 3.55B | 3.11B | 2.56B | 1.39B | 902.38M |
| Non Operating Interest Income | 738.71M | N/A | 397.27M | 346.51M | 239.87M |
| Non Operating Interest Expense | 309.97M | N/A | 10.33M | 8.52M | 8.15M |
| Pretax Income | 5.02B | 4.00B | 2.95B | 2.26B | 1.34B |
| Income Tax | 1.20B | 942.43M | 669.28M | 401.97M | 339.01M |
| Net Income | 3.82B | 3.06B | 2.28B | 1.86B | 1.00B |
| Eps Basic | 42.83 | 34.65 | 26.01 | 21.26 | 12.37 |
| Eps Diluted | 42.07 | 33.67 | 25.20 | 20.54 | 12.18 |
| Basic Shares Outstanding | 89.21M | 88.23M | 87.77M | 87.52M | 80.98M |
| Diluted Shares Outstanding | 89.21M | 88.23M | 87.77M | 87.52M | 80.98M |
| Ebit | 5.33B | 3.11B | 2.56B | 2.27B | 1.35B |
| Ebitda | 4.51B | 2.53B | 2.31B | 1.78B | 1.19B |
| Net Income Continuous Operations | 5.02B | 4.00B | 2.95B | 2.26B | 1.34B |
| Preferred Stock Dividends | 0.00 | 0.00 | 0.00 | 0.00 | 0.00 |
Data provided by Twelve Data
Balance Sheet
| fiscal_date | 2025-03-31 | 2024-09-30 | 2024-03-31 | 2023-09-30 | 2023-03-31 |
|---|---|---|---|---|---|
| Cash And Cash Equivalents | 5.99B | 7.48B | 5.80B | 4.15B | 2.36B |
| Accounts Receivable | 55.49M | 63.52M | N/A | N/A | N/A |
| Total Assets | 122.12B | 113.09B | 95.34B | 80.43B | 67.37B |
| Total Liabilities | 96.90B | 90.19B | 74.12B | 60.97B | 49.20B |
| Long Term Debt | 95.51B | 88.67B | 73.02B | 60.02B | 37.42B |
| Shareholders Equity | 25.21B | 22.89B | 21.21B | 19.47B | 18.17B |
Data provided by Twelve Data
Cash Flow Statement
| fiscal_date | 2025-03-31 | 2024-03-31 | 2023-03-31 | 2022-03-31 | 2021-03-31 |
|---|---|---|---|---|---|
| Operating Activities Net Income | 5.02B | 4.00B | 2.95B | 2.26B | 1.34B |
| Operating Activities Stock Based Compensation | 266.78M | 163.68M | 112.30M | 46.74M | 31.72M |
| Operating Activities Other Non Cash Items | -6.42B | -5.30B | -4.18B | -2.86B | -2.27B |
| Operating Activities Accounts Receivable | -25.20B | -21.61B | -17.12B | -10.02B | -3.46B |
| Operating Activities Other Assets Liabilities | 66.59M | 22.47M | -7.85M | 301.99M | -18.46M |
| Operating Activities Operating Cash Flow | -26.27B | -22.73B | -18.24B | -10.28B | -4.37B |
| Investing Activities Capital Expenditures | -117.81M | -79.85M | -71.47M | -34.59M | -25.17M |
| Investing Activities Purchase Of Investments | -80.50B | -80.50B | -54.48B | -44.67B | -28.33B |
| Investing Activities Sale Of Investments | 80.12B | 78.10B | 51.77B | 52.60B | 22.08B |
| Investing Activities Investing Cash Flow | -493.41M | -2.48B | -2.78B | 7.89B | -6.27B |
| Financing Activities Long Term Debt Issuance | 41.09B | 39.00B | 24.34B | 14.06B | 12.51B |
| Financing Activities Long Term Debt Payments | -18.72B | -14.11B | -10.77B | -9.95B | -6.91B |
| Financing Activities Short Term Debt Issuance | -57.97M | 57.97M | -24.82M | 24.80M | -60.00K |
| Financing Activities Common Stock Issuance | 260.40M | 51.93M | 42.73M | 28.12M | 3.55B |
| Financing Activities Common Dividends | -301.23M | -228.96M | N/A | N/A | N/A |
| Financing Activities Financing Cash Flow | 22.27B | 24.77B | 13.59B | 4.16B | 9.15B |
| End Cash Position | 5.99B | 5.80B | 2.36B | 6.18B | 2.09B |
| Free Cash Flow | -22.10B | -19.16B | -14.76B | -8.11B | -2.26B |
| Financing Activities Other Financing Charges | N/A | N/A | N/A | -110.00K | 110.00K |
Data provided by Twelve Data
Technical Analysis
Key Insights
- The current trend shows a moderate upward momentum with price consolidating near ₹1174.4 after recent volatility.
- Key support levels are identified around ₹1100 and ₹1050, while resistance is observed near the 52-week high of ₹1519.
- The stock price is trading below the 200-day moving average (₹1219.87) but above the 50-day moving average (₹1129.14), indicating mixed medium-term momentum.
- Momentum indicators show RSI around 52.28, suggesting neutral to slightly bullish momentum; MACD and Stochastic oscillators indicate potential for upward movement.
- Multi-timeframe analysis reveals daily charts showing consolidation, weekly charts indicating sideways movement, and monthly charts reflecting a longer-term uptrend.
- Current technical setup suggests potential for range-bound trading with breakout possibilities contingent on volume and broader market conditions.
Trending News
1. Headline: Home First Finance Company India Ltd is Rated Hold
Summary: Home First Finance Company India Ltd is rated 'Hold' by MarketsMOJO. This rating was last updated on 24 Nov 2025, reflecting a change from its previous 'Buy' status. The analysis and financial metrics discussed provide insight into the stock's current positioning as of February 2026.
Sentiment: Neutral
2. Headline: Home First Finance Company India Ltd Hits Intraday Low Amid Price Pressure
Summary: Shares of Home First Finance Company India Ltd declined sharply, touching an intraday low of ₹1167.1, reflecting significant price pressure despite a broadly positive market backdrop. The stock underperformed its sector and the benchmark Sensex, reversing previous gains.
Sentiment: Negative
3. Headline: Home First Finance Company India Ltd Valuation Shifts to Expensive Amid Market Rally
Summary: Home First Finance Company India Ltd has witnessed a notable change in its valuation parameters, shifting from fair to expensive. This transition, marked by rises in price-to-earnings and price-to-book ratios, invites closer examination of its price dynamics amid a market rally.
Sentiment: Positive
4. Headline: Home First Finance Company India Ltd Among Six Stocks Showing Bullish RSI Upswing
Summary: Home First Finance Company India Ltd is highlighted among six stocks exhibiting a bullish RSI upswing, with the RSI moving from 45.69 to 52.28, indicating improving momentum and potential positive price action in the near term.
Sentiment: Positive
5. Headline: Home First Finance Schedules One-on-One Meets With Analysts and Investors
Summary: Home First Finance Company India Ltd has announced scheduling one-on-one meetings with analysts and investors, signaling active engagement and transparency in communication regarding its strategic outlook and financial performance.
Sentiment: Neutral
Powered by Brave
Recent Updates
News Summary
Recent updates for Home First Finance Company India Ltd. include active engagement with analysts and investors through scheduled one-on-one meetings, reflecting a commitment to transparency. The company targets a 25% annual asset under management growth by FY27, supported by strategic initiatives aimed at expanding its affordable housing finance portfolio. Despite a recent intraday price decline amid market pressure, the stock has shown resilience with positive momentum indicators such as bullish RSI signals. Market sentiment remains mixed with valuation shifts from fair to expensive, highlighting evolving perceptions. These developments align with broader industry trends of growth and consolidation within India's mortgage finance sector.
News Sentiment
The sentiment across recent news is predominantly positive to neutral, with emphasis on growth ambitions and strategic communication. Positive momentum indicators and targeted growth strategies contribute to constructive outlooks, while price pressures and valuation concerns introduce caution. Overall, the sentiment reflects balanced market views with recognition of both opportunities and challenges.
Analytical Overview
Analysis Summary
Home First Finance Company India Ltd. trades at a trailing P/E of 24.04 and forward P/E of 18.56, slightly above the industry average of 24.04, indicating a premium valuation relative to peers. The PEG ratio of 0.79 suggests valuation is supported by growth expectations.
The company demonstrates strong growth with a quarterly revenue increase of 34.6% and a year-over-year earnings growth of 44%, reflecting robust operational performance and market demand.
Financial health shows a high debt-to-equity ratio of 3.79 and negative operating cash flow, which may pose liquidity and leverage risks despite positive free cash flow. Monitoring debt management remains crucial.
Sector-specific opportunities include India's expanding affordable housing market and regulatory support for financial inclusion, while challenges involve managing credit risk and competitive pressures.
Considering India-specific factors, the regulatory environment favors housing finance growth, supported by demographic trends and government initiatives promoting home ownership.
Investment Conclusion
Supporting Factors: Primary supporting factors include strong revenue and earnings growth, premium valuation supported by growth prospects, and strategic focus on affordable housing finance.
Risk Factors: Main risks involve elevated leverage, negative operating cash flow, and valuation premiums relative to peers.
SWOT Analysis
Strengths
- Strong revenue growth with 34.6% quarterly increase.
- High profit margin exceeding 50%, indicating operational efficiency.
- Significant institutional ownership at 60.93%, supporting governance.
- Focused presence in affordable housing finance catering to underserved markets.
Weaknesses
- Elevated debt-to-equity ratio of 3.79, indicating high leverage.
- Negative operating cash flow despite positive free cash flow.
- Premium valuation multiples relative to industry peers.
- Limited dividend yield at approximately 1.25%.
Opportunities
- Expanding affordable housing market in India driven by demographic trends.
- Regulatory support for financial inclusion and housing finance growth.
- Strategic initiatives targeting 25% annual AUM growth by FY27.
- Potential to increase market share in underserved low and middle-income segments.
Threats
- Competitive pressures from established mortgage finance companies.
- Market volatility impacting stock price and valuation.
- Credit risk associated with lending to low and middle-income borrowers.
- Economic fluctuations affecting housing demand and loan repayments.
Company Description
Home First Finance Company India Ltd. is a financial service provider specializing in affordable housing finance. Catering predominantly to low and middle-income groups in India, the company plays a crucial role in the country’s housing sector. This is especially relevant given India's large population and the increasing demand for residential properties. Home First Finance's primary function is to offer accessible and affordable mortgage solutions to eligible customers, enabling them to purchase or construct homes. Established to bridge the gap in the housing finance sector, it provides a broad suite of home loan products tailored to meet the diverse needs of salaried and self-employed professionals. The company's significant presence across multiple states in India highlights its influence and commitment to financial inclusion within the housing industry. By focusing on underserved markets, it ensures that even those often excluded from traditional banking services can realize the dream of home ownership. Its substantial contribution to the housing finance ecosystem underscores Home First Finance Company India Ltd.'s pivotal role in democratizing home ownership across India.