


Hindustan Unilever Ltd (HINDUNILVR)
Stock Analysis Report
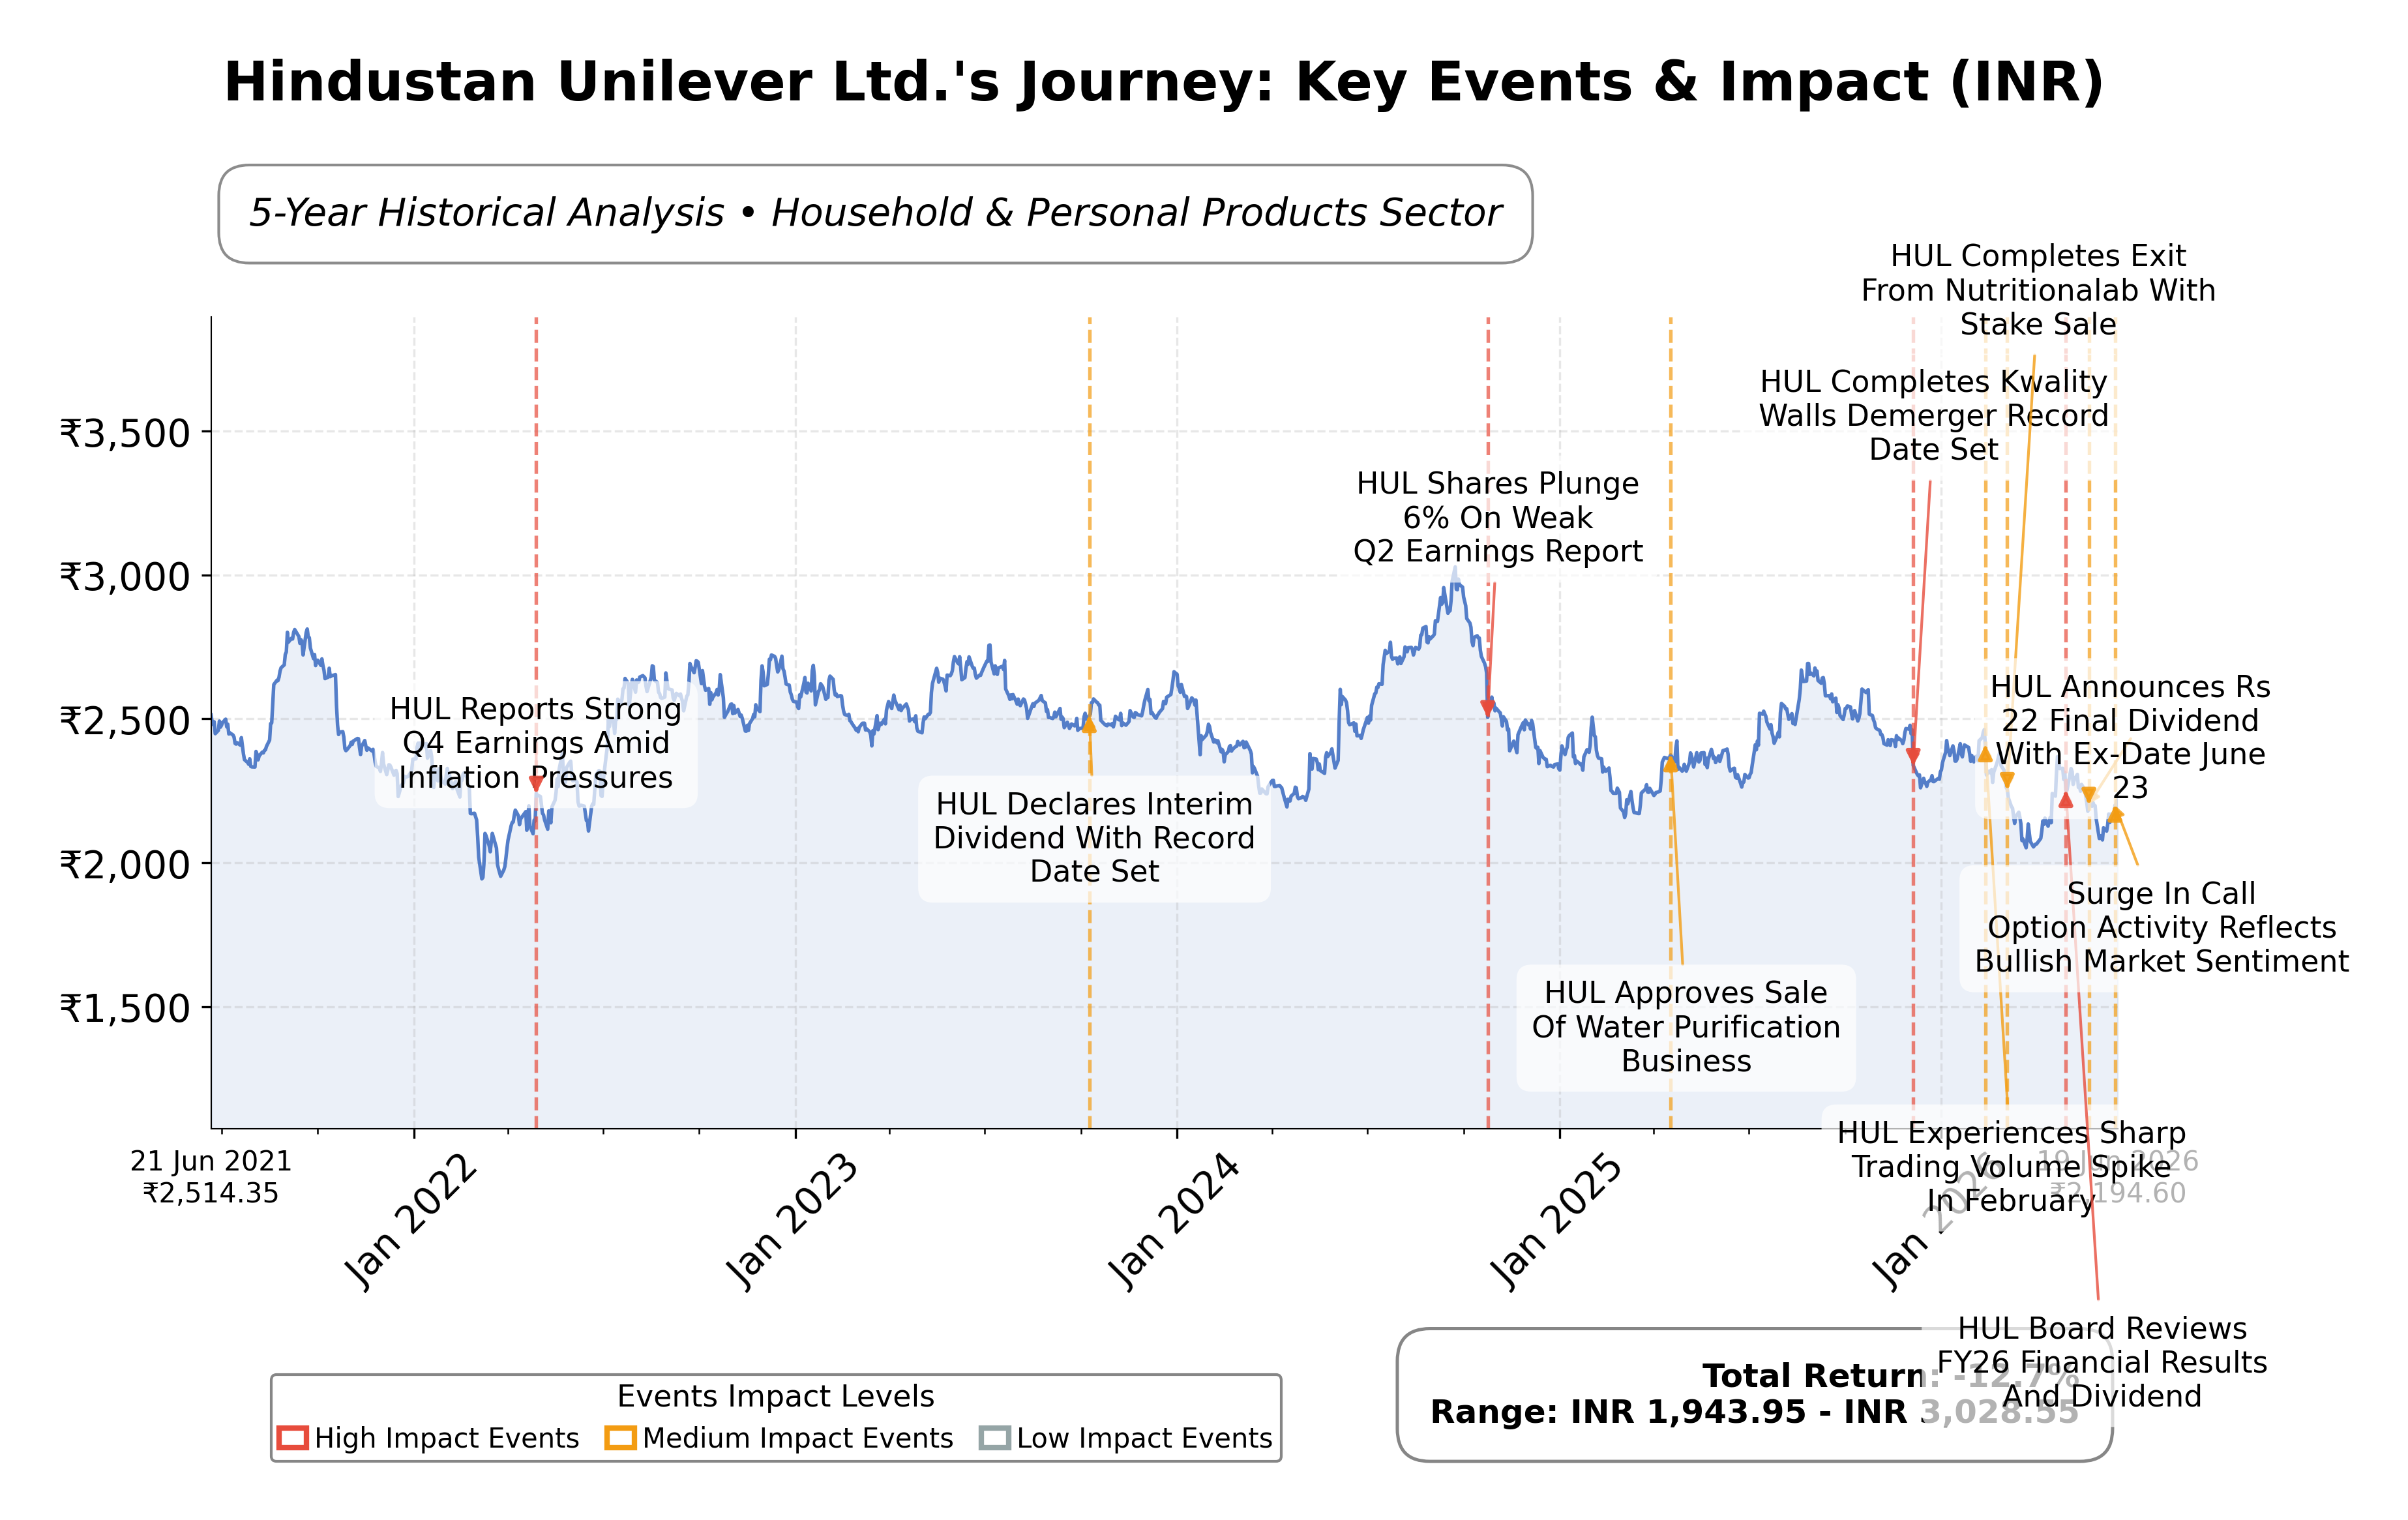
Stock Journey
Key Positives and Key Risks
Pros
- Hindustan Unilever Ltd. maintains a strong return on equity of 21.60%, indicating efficient use of shareholder capital.
- The company generates substantial operating cash flow of ₹109.99 billion, supporting dividends and investments.
- HUL has a low debt-to-equity ratio of 0.03, reflecting a conservative capital structure and financial stability.
Cons
- The stock trades at a high trailing P/E ratio of 48.54, suggesting a premium valuation that may limit upside.
- Operating margins of 21.14% face potential pressure from rising input costs and competitive pricing.
- The company’s current price of ₹2,202 is closer to its 52-week low of ₹2,022.50, indicating recent price weakness.
Disclosure: This information is for general awareness and does not constitute investment advice
Report Summary
Hindustan Unilever Ltd. (HUL) is a leading Indian consumer goods company operating primarily in the fast-moving consumer goods (FMCG) sector. Listed on the National Stock Exchange of India (NSE), it offers a broad portfolio of products including food, personal care, and home care items. The company holds a strong market position with well-known brands such as Surf Excel, Dove, Lux, Lipton, and Knorr, serving a vast consumer base across India through an extensive distribution network. Its operations are headquartered in Mumbai and it is classified under the Consumer Defensive sector.
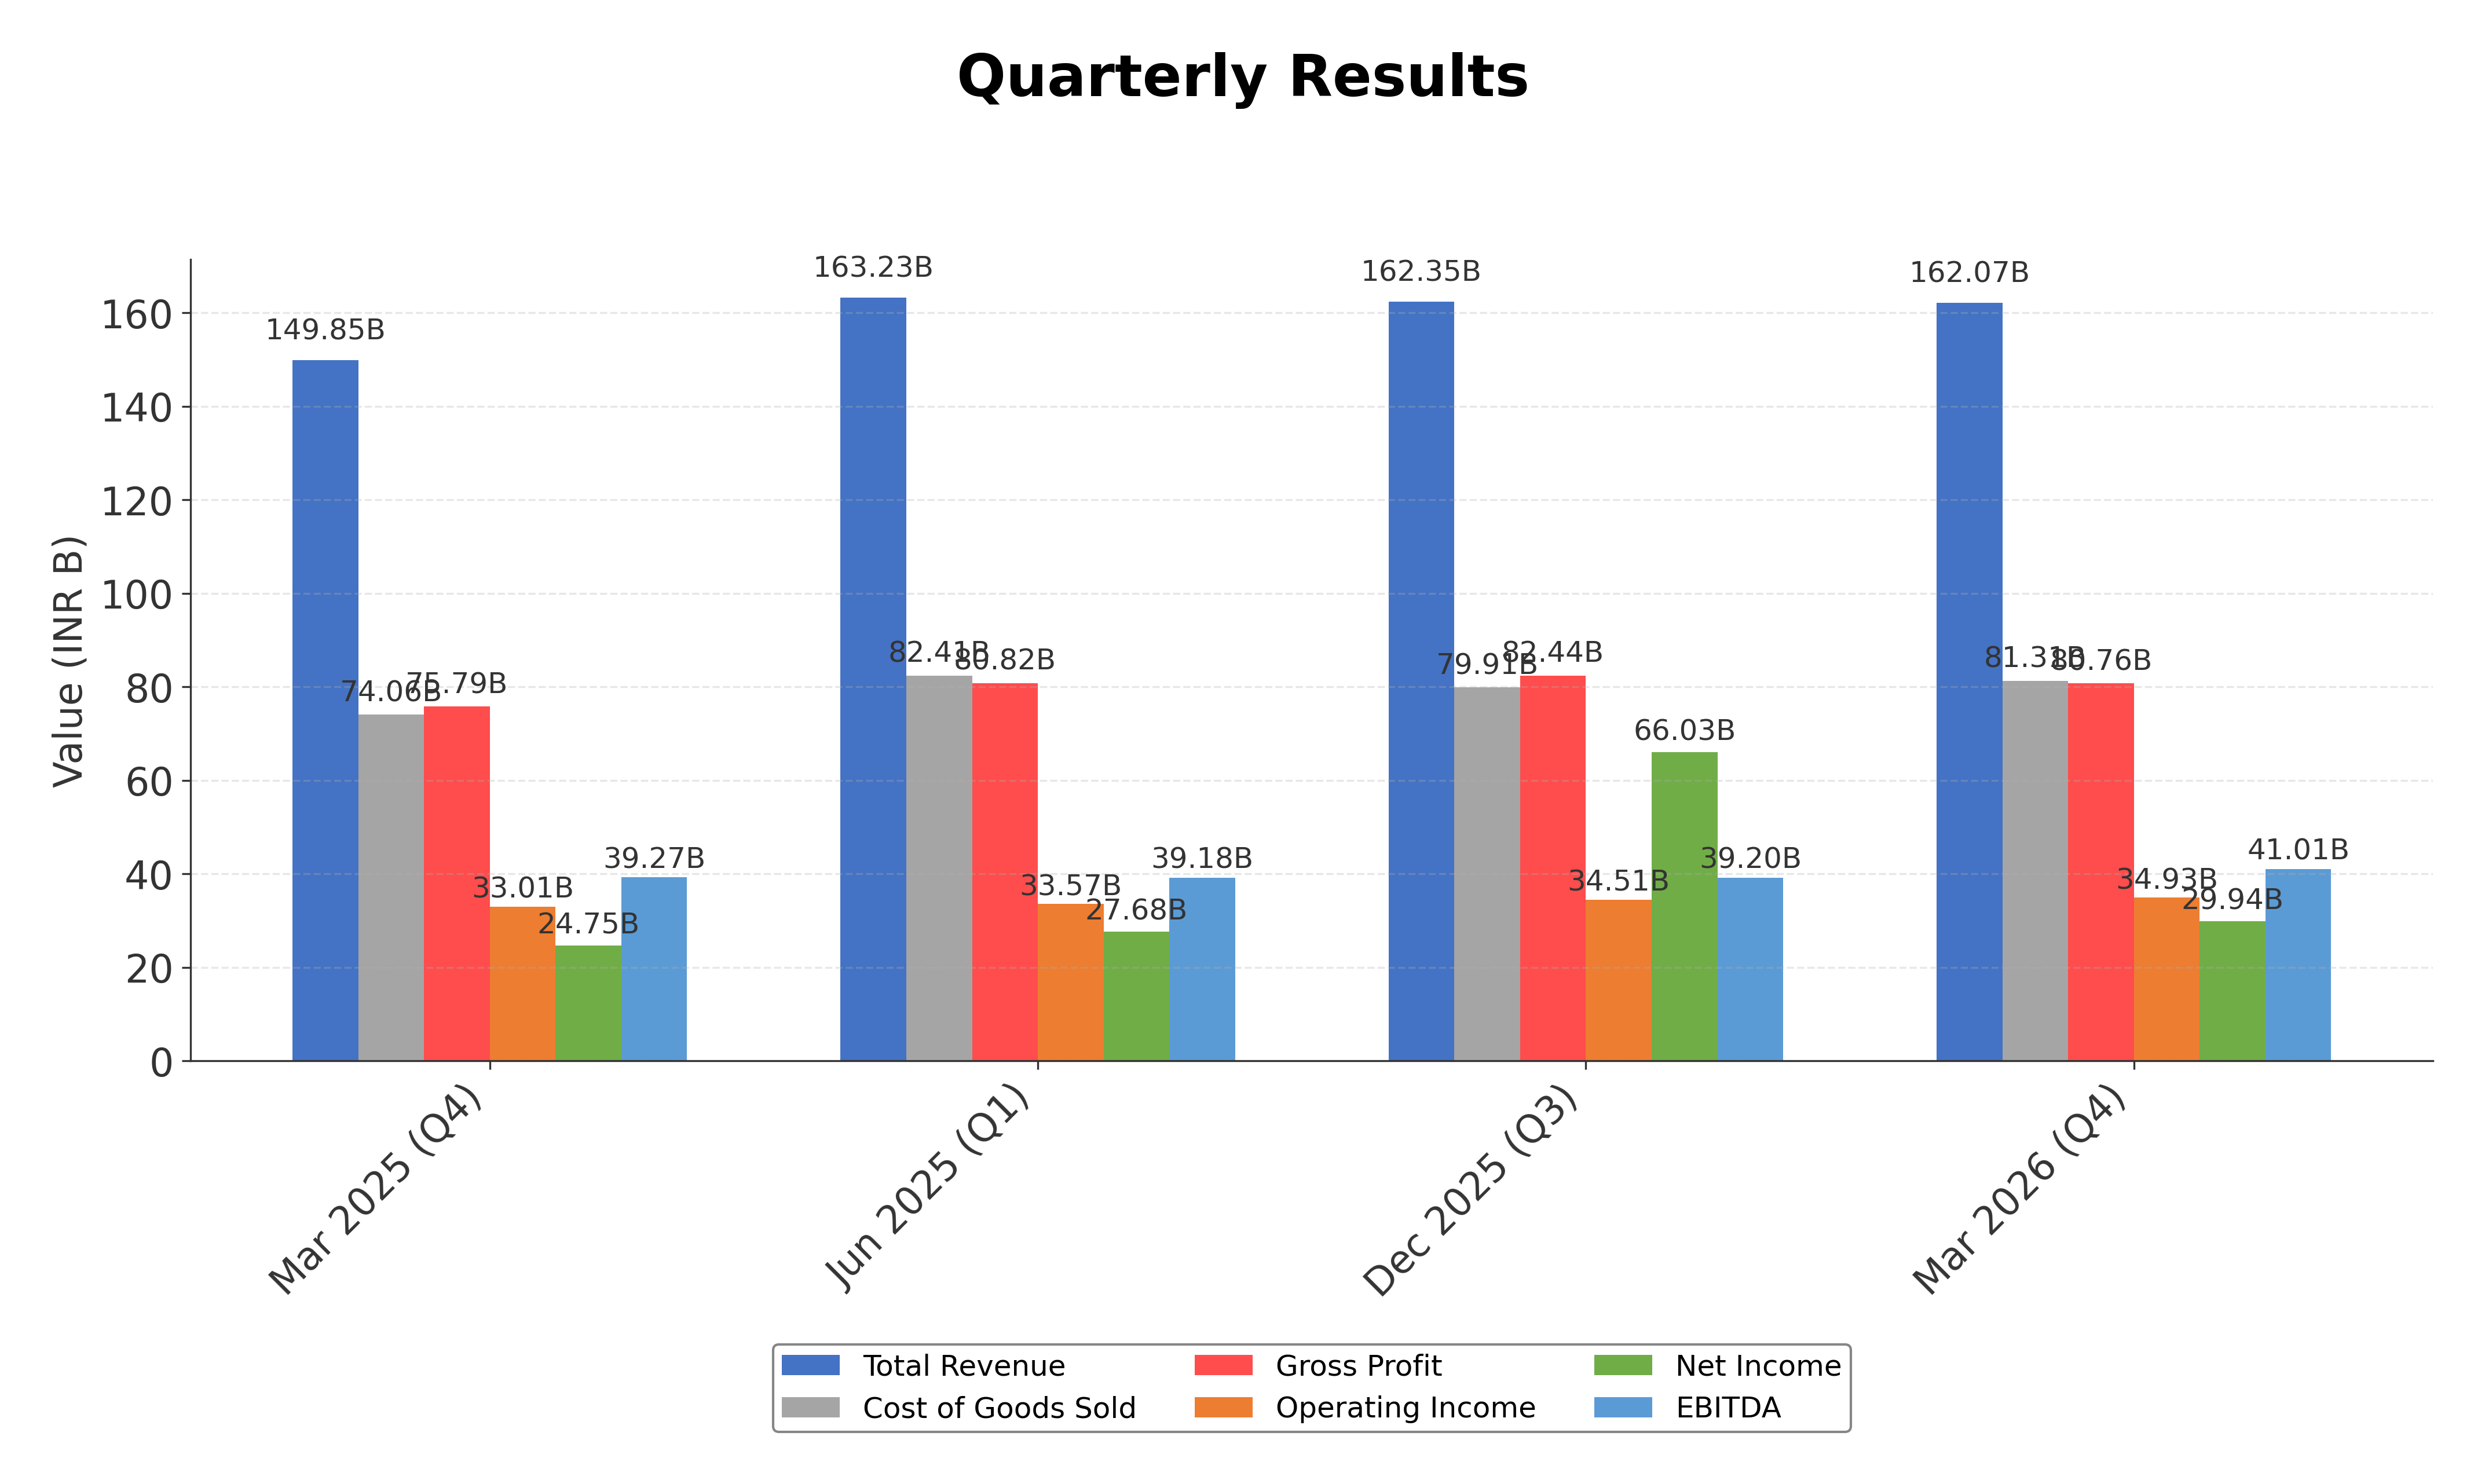
Financially, HUL reported trailing twelve months (TTM) revenue of approximately ₹644.68 billion with a gross margin near 49.83%, an operating margin of 21.14%, and a net profit margin of 23.33%. The company’s return on equity (ROE) stands at 21.60%, while return on assets (ROA) is 10.71%, reflecting efficient asset utilization and strong profitability. The operating cash flow for the TTM period was ₹109.99 billion, supporting a levered free cash flow of ₹65.25 billion, indicating robust cash generation capacity.
Valuation metrics show a trailing price-to-earnings (P/E) ratio of 48.54 and a forward P/E of 40.92, with a price-to-book (P/B) ratio of 10.58 and an enterprise value to EBITDA (EV/EBITDA) multiple of 35.07. The market capitalization is approximately ₹5.16 trillion. The stock trades at ₹2,202, within a 52-week range of ₹2,750 (high) to ₹2,022.50 (low), suggesting it is closer to the lower end of its annual price range. These multiples indicate a premium valuation relative to some peers, reflecting market expectations of sustained growth and brand strength.
HUL’s strengths include strong cash flows, low debt levels with a debt-to-equity ratio of 0.03, and market leadership in key categories such as laundry powders and body wash. Key risks involve competitive pressures in the FMCG sector, regulatory challenges related to product safety and labeling, and macroeconomic factors affecting consumer spending. Recent strategic initiatives include portfolio premiumization, omni-channel expansion, and targeted investments in high-growth segments, alongside a proposed final dividend of ₹22 per share for FY26.
Technically, the stock is trading near its 50-day moving average of ₹2,217.88 and below the 200-day moving average of ₹2,327.23, with a beta of 0.36 indicating relatively low volatility. Momentum indicators suggest mixed signals across daily and weekly timeframes. Recent news highlights steady earnings growth, dividend announcements, and strategic brand repositioning. Overall, the data suggests a balanced outlook where market participants may consider monitoring developments closely while evaluating valuation and growth prospects.
Company and Industry Overview
Company Basics
Price Performance
Company Size
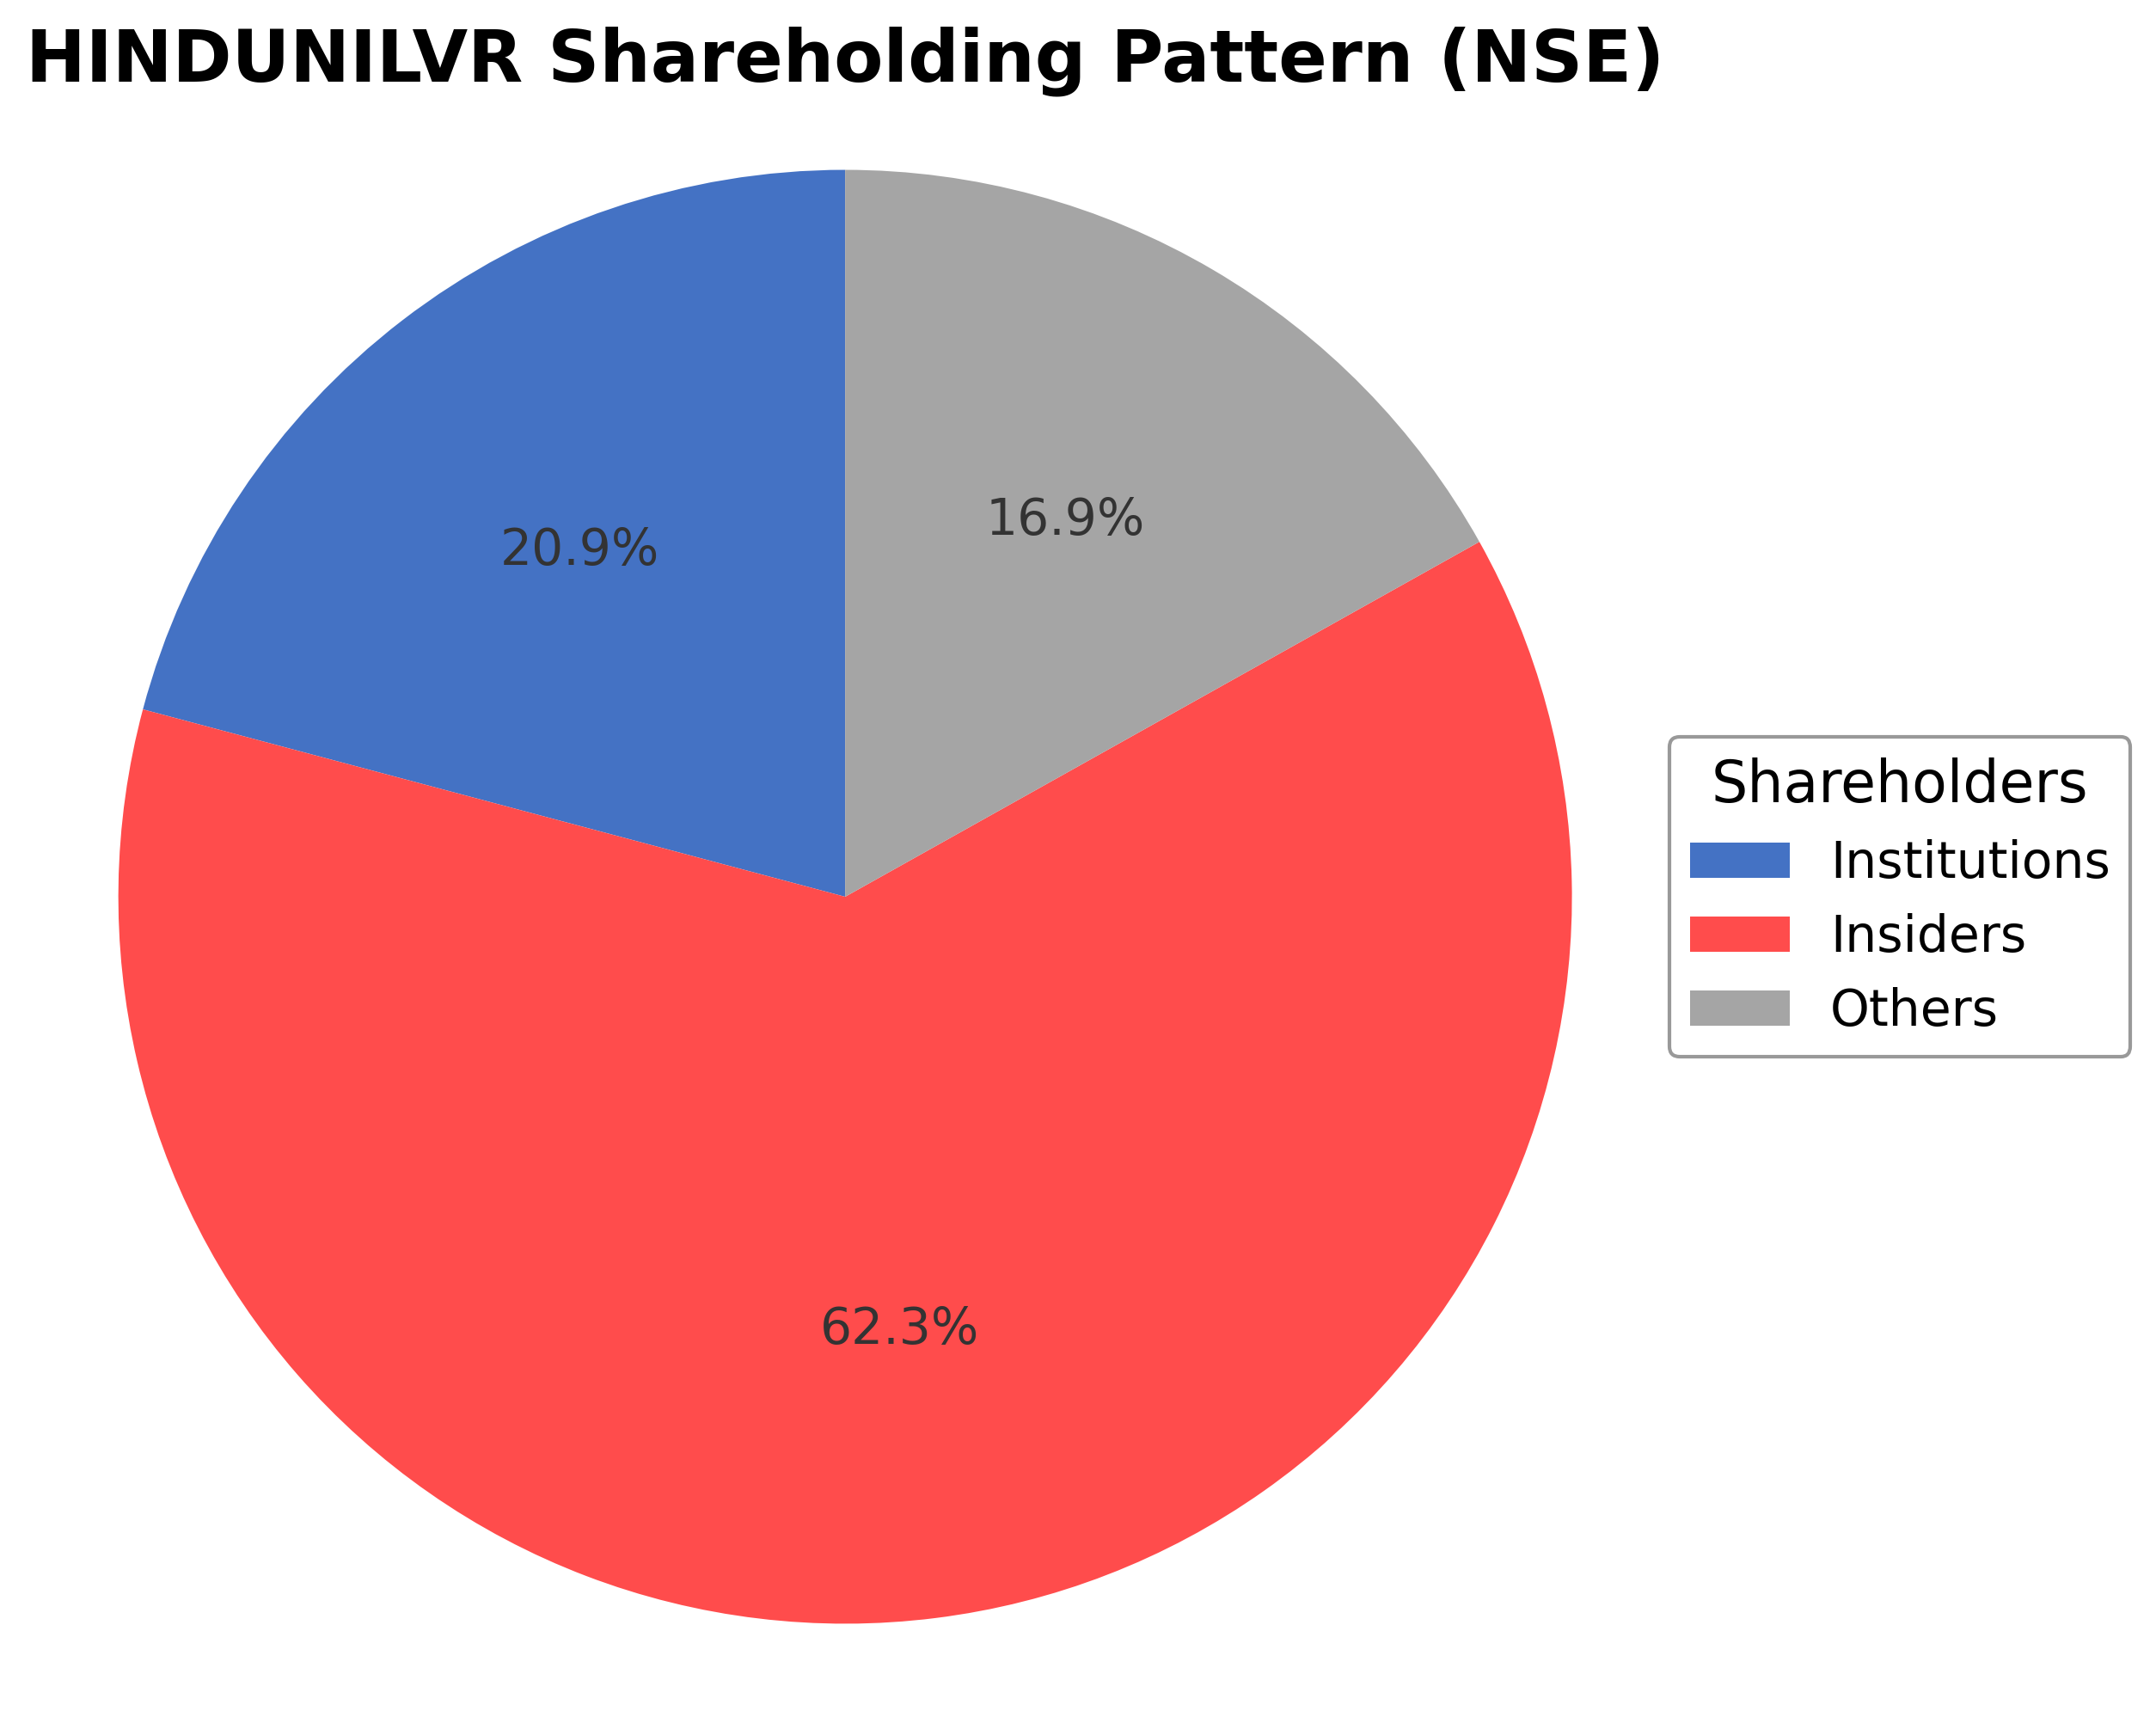
Shareholding Pattern
Sector and Industry Analysis
The Fast-Moving Consumer Goods (FMCG) sector in India is a large and rapidly evolving market, encompassing categories such as home care, personal care, and food & refreshment. The sector has demonstrated steady growth, driven by rising consumer incomes, urbanization, and increased penetration in rural areas. Major players include Hindustan Unilever Ltd, Nestlé India, and Dabur, with Hindustan Unilever commanding a significant market share supported by a diverse portfolio of over 50 brands.
Industry trends reveal a shift towards premiumization, health and wellness products, and digital engagement with consumers. Competitive dynamics are shaped by strong brand loyalty, extensive distribution networks, and innovation in product offerings. Barriers to entry remain high due to the need for large-scale manufacturing, brand building, and supply chain capabilities, which favor established incumbents like Hindustan Unilever with robust operational efficiencies and market reach.
The regulatory environment for FMCG companies in India involves compliance with food safety standards, environmental regulations, and advertising norms. Recent emphasis on consumer protection and quality assurance has led to stricter monitoring and labeling requirements. These regulations impact product formulation, packaging, and marketing strategies, requiring companies to adapt continuously while maintaining compliance to sustain growth and consumer trust.
Note: Analysis synthesized from industry research, market reports, and regulatory filings. Information is subject to change based on market conditions.
Financial Ratios Dashboard
Illustrative Scenario Analysis
DCF Assumptions:
Method: Two-Stage EPS-Priority Model
Financials
Peer Analysis
| Company Name | Market Cap | P/E Ratio | P/B Ratio | EV/EBITDA | Price to CFO |
|---|---|---|---|---|---|
| Hindustan Unilever Ltd. | ₹5.16T | 48.54 | 10.58 | 35.07 | 46.88 |
| Colgate-Palmolive (India) Ltd. | ₹543.37B | 41.67 | 34.81 | 29.75 | 30.08 |
| Dabur India Ltd. | ₹751.27B | 40.18 | 6.65 | 30.05 | 29.13 |
| Godrej Consumer Products Ltd. | ₹1.02T | 54.95 | 8.08 | 33.99 | 41.14 |
| Procter & Gamble Hygiene Limited | ₹301.06B | 35.09 | 39.96 | 25.23 | 32.58 |
| Emami Ltd. | ₹180.49B | 23.26 | 6.17 | 18.33 | 22.55 |
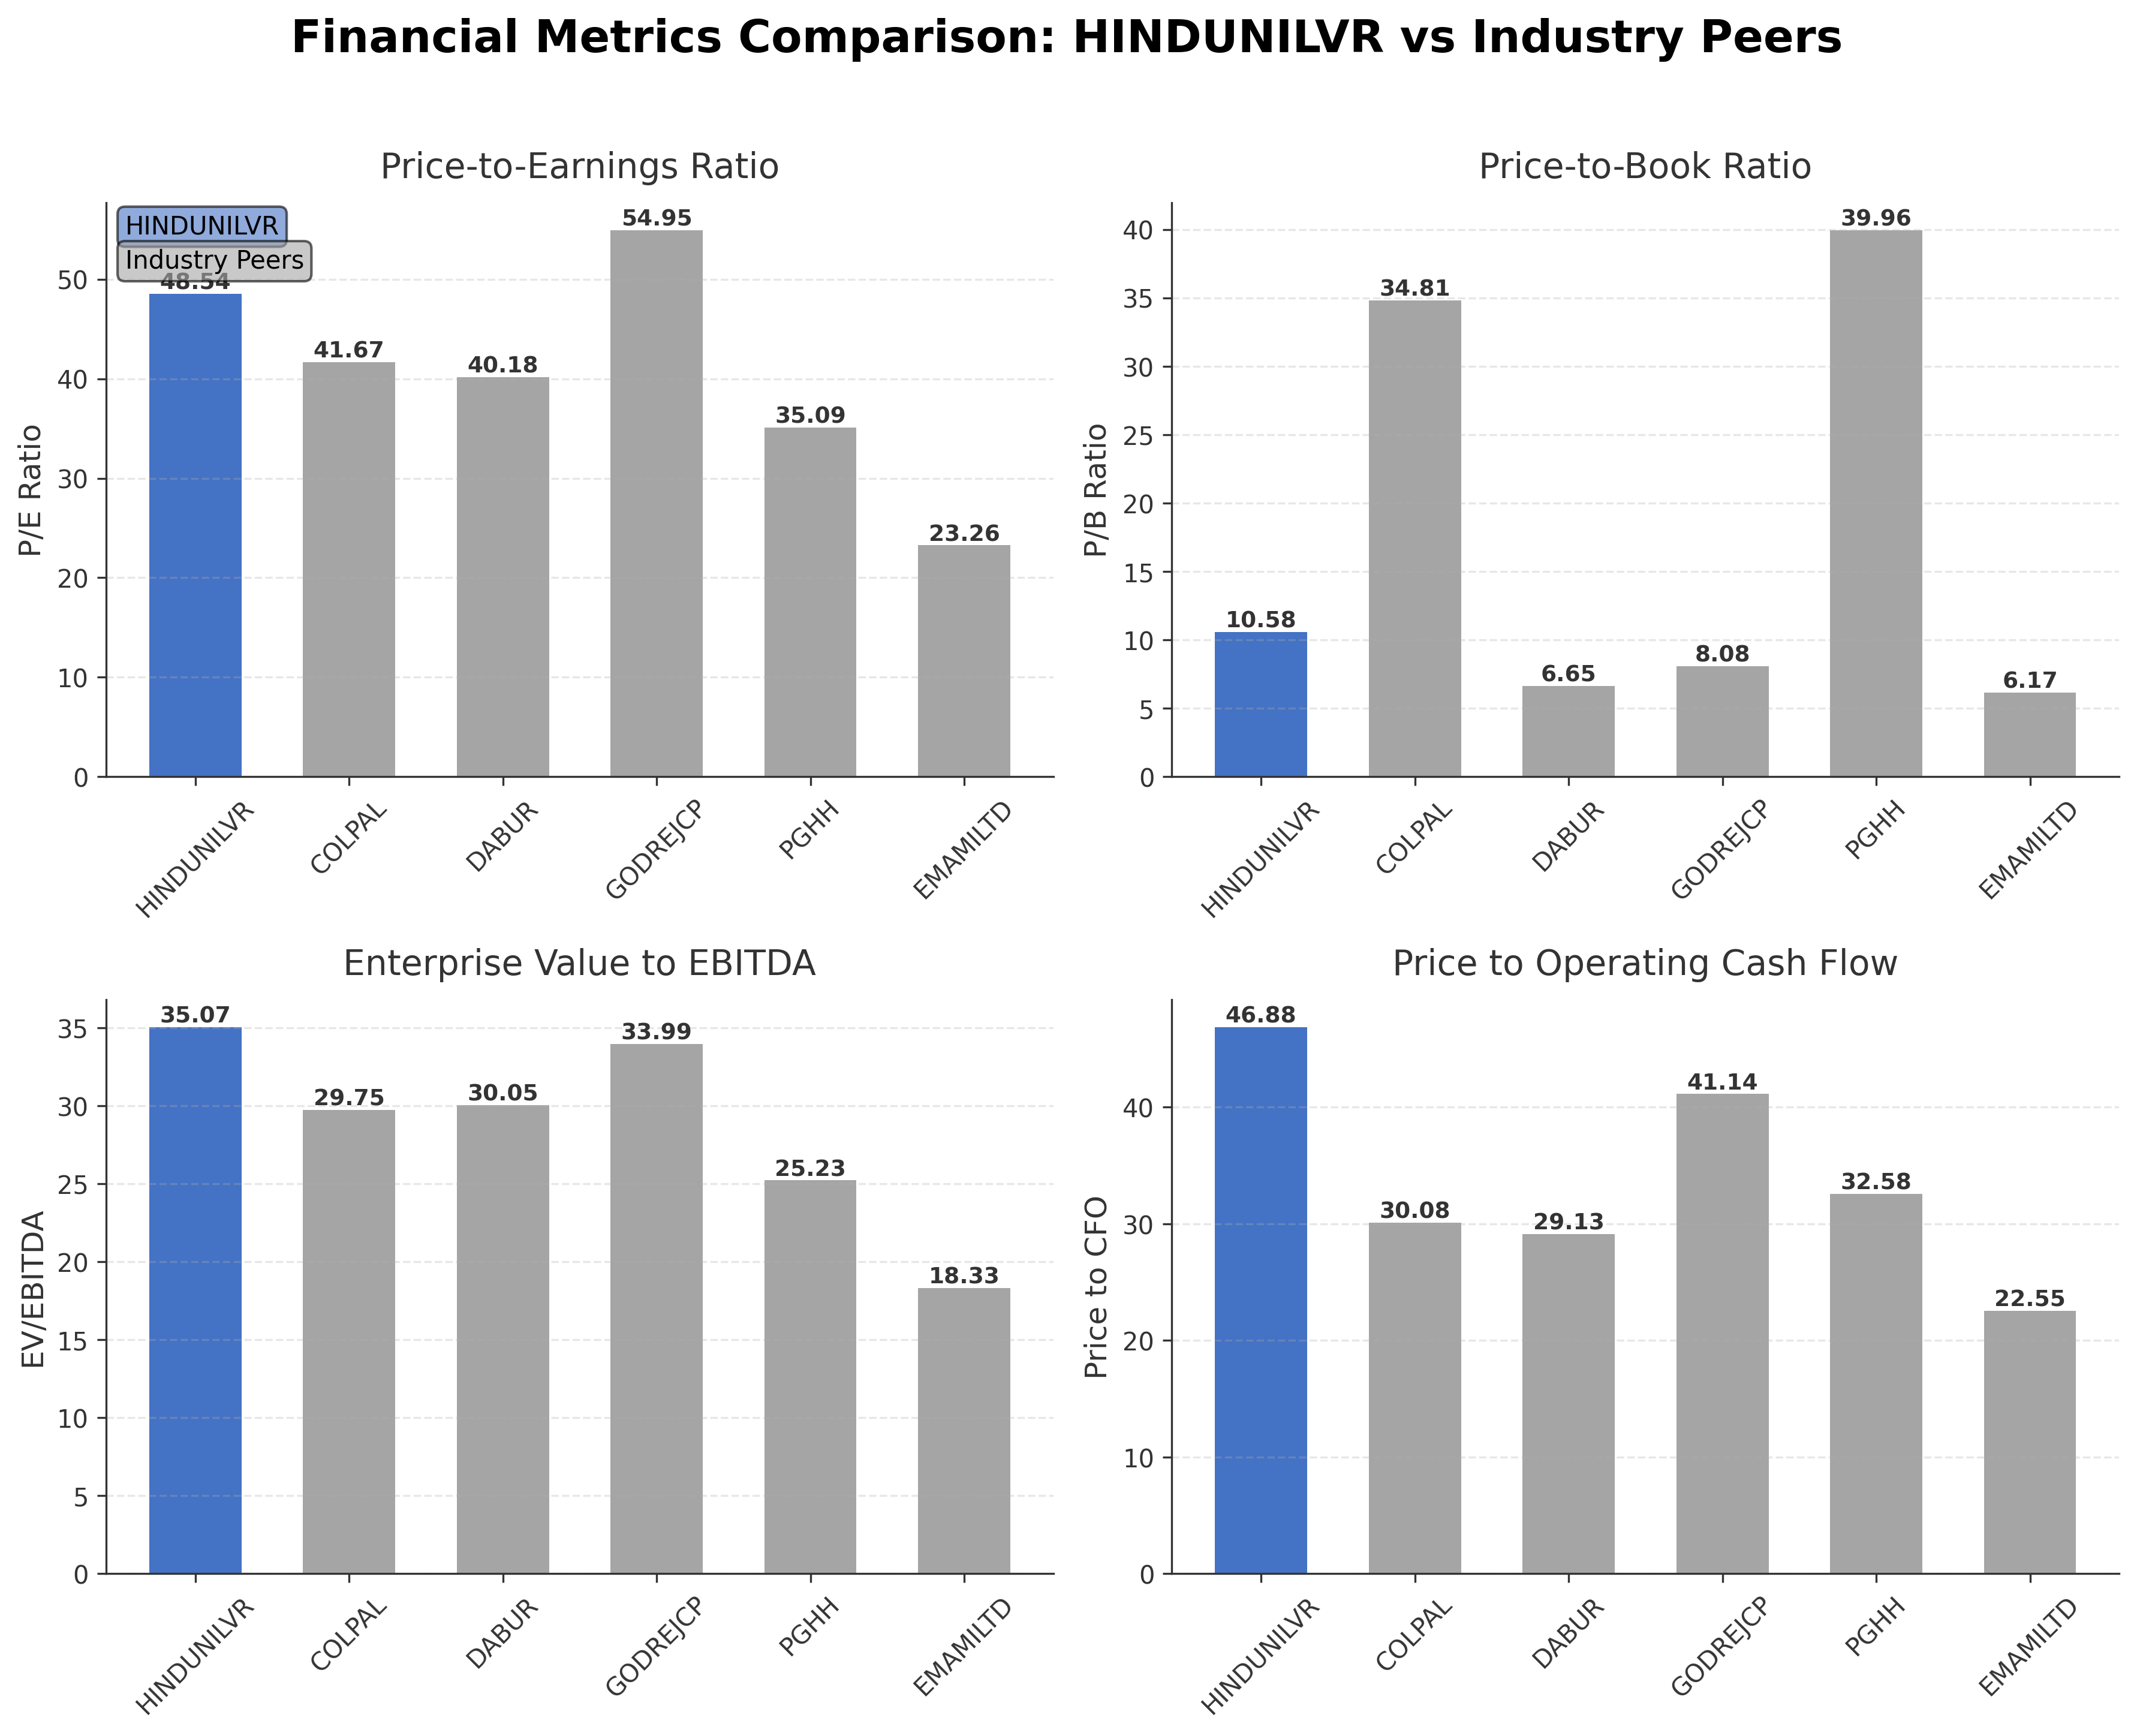
Comparison Analysis: Hindustan Unilever Ltd. commands the largest market capitalization among its peers at ₹5.16 trillion, reflecting its dominant market position. Its P/E ratio of 48.54 is higher than most peers, indicating a premium valuation, while its P/B ratio of 10.58 is moderate compared to extremely high ratios seen in Colgate-Palmolive (34.81) and Procter & Gamble Hygiene (39.96). The EV/EBITDA multiple of 35.07 is also at the upper end, suggesting expectations of strong earnings quality. HUL’s return on equity of 21.60% is solid but lower than Colgate-Palmolive’s 81.59% and Emami’s 27.61%, indicating room for efficiency improvement. Overall, HUL balances scale and profitability with premium valuation metrics relative to its Indian FMCG peers.
Financial Metrics Comparison with Peers
Financial Statements
Comprehensive financial data including income, balance sheet, and cash flow metrics
Income Statement
| fiscal_date | 2026-03-31 | 2025-03-31 | 2024-03-31 | 2023-03-31 | 2022-03-31 |
|---|---|---|---|---|---|
| Sales | 637.63B | 605.73B | 609.66B | 595.49B | 515.48B |
| Cost Of Goods | 316.65B | 297.70B | 308.92B | 327.19B | 265.87B |
| Gross Profit | 320.98B | 308.03B | 300.74B | 268.30B | 249.61B |
| Operating Expense Selling General And Administrative | 62.61B | 59.89B | 84.94B | 68.79B | 66.18B |
| Operating Expense Other Operating Expenses | 83.13B | 79.11B | 47.57B | 39.01B | 37.57B |
| Operating Income | 137.21B | 134.53B | 134.47B | 130.10B | 117.66B |
| Non Operating Interest Expense | 4.10B | 3.81B | 3.34B | 1.14B | 1.04B |
| Pretax Income | 138.12B | 144.28B | 139.26B | 133.44B | 118.74B |
| Income Tax | 31.60B | 37.48B | 36.44B | 32.01B | 29.87B |
| Net Income | 150.59B | 106.71B | 102.82B | 101.43B | 88.92B |
| Eps Basic | 64.01 | 45.32 | 43.74 | 43.07 | 37.79 |
| Eps Diluted | 64.00 | 45.32 | 43.74 | 43.07 | 37.79 |
| Basic Shares Outstanding | 2.35B | 2.35B | 2.35B | 2.35B | 2.35B |
| Diluted Shares Outstanding | 2.35B | 2.35B | 2.35B | 2.35B | 2.35B |
| Ebit | 142.22B | 148.09B | 142.60B | 134.58B | 119.78B |
| Ebitda | 158.93B | 158.25B | 152.21B | 145.75B | 130.69B |
| Net Income Continuous Operations | 181.48B | 144.15B | 139.26B | 133.45B | 118.74B |
| Minority Interests | -190.00M | -220.00M | -50.00M | -230.00M | -130.00M |
| Preferred Stock Dividends | 0.00 | 0.00 | 0.00 | 0.00 | 0.00 |
| Non Operating Interest Income | N/A | 7.55B | 5.46B | 4.11B | 1.98B |
Data provided by Twelve Data
Balance Sheet
| fiscal_date | 2026-03-31 | 2025-03-31 | 2024-03-31 | 2023-03-31 | 2022-03-31 |
|---|---|---|---|---|---|
| Cash And Cash Equivalents | 25.83B | 60.71B | 8.25B | 7.14B | 11.47B |
| Accounts Receivable | 33.79B | 38.19B | 29.97B | 30.79B | 22.36B |
| Total Assets | 797.52B | 798.80B | 784.99B | 730.87B | 705.17B |
| Total Liabilities | 307.44B | 302.71B | 270.76B | 225.65B | 214.30B |
| Long Term Debt | 11.04B | 12.43B | 11.06B | 8.07B | 7.41B |
| Shareholders Equity | 490.08B | 496.09B | 514.23B | 505.22B | 490.87B |
Data provided by Twelve Data
Cash Flow Statement
| fiscal_date | 2026-03-31 | 2025-03-31 | 2024-03-31 | 2023-03-31 | 2022-03-31 |
|---|---|---|---|---|---|
| Operating Activities Net Income | 181.48B | 144.15B | 139.26B | 133.45B | 118.74B |
| Operating Activities Stock Based Compensation | 160.00M | 110.00M | 0.00 | 10.00M | -10.00M |
| Operating Activities Other Non Cash Items | -1.22B | -9.78B | -5.20B | -2.97B | -1.01B |
| Operating Activities Other Assets Liabilities | 6.86B | -7.88B | 13.13B | -9.60B | -10.00B |
| Operating Activities Operating Cash Flow | 187.28B | 126.60B | 147.19B | 120.89B | 107.72B |
| Investing Activities Capital Expenditures | -12.29B | -12.41B | -14.48B | -10.53B | -10.79B |
| Investing Activities Net Intangibles | -1.03B | -210.00M | -90.00M | 420.00M | 260.00M |
| Investing Activities Net Acquisitions | -31.87B | 5.95B | -40.00M | -3.76B | -410.00M |
| Investing Activities Purchase Of Investments | -274.83B | -254.56B | -305.07B | -263.17B | -522.34B |
| Investing Activities Sale Of Investments | 278.84B | 317.61B | 262.15B | 259.50B | 514.42B |
| Investing Activities Investing Cash Flow | -40.15B | 56.59B | -57.44B | -17.98B | -19.12B |
| Financing Activities Long Term Debt Payments | -460.00M | 0.00 | -850.00M | -2.08B | -550.00M |
| Financing Activities Common Dividends | -101.24B | -124.73B | -94.16B | -84.74B | -75.26B |
| Financing Activities Financing Cash Flow | -101.70B | -124.73B | -96.71B | -85.14B | -75.81B |
| End Cash Position | 25.83B | 60.70B | 8.12B | 7.01B | 11.47B |
| Free Cash Flow | 96.38B | 106.11B | 139.92B | 87.99B | 78.20B |
| Financing Activities Short Term Debt Issuance | N/A | 0.00 | -850.00M | 850.00M | 0.00 |
| Financing Activities Common Stock Issuance | N/A | N/A | 0.00 | -20.00M | 0.00 |
| Financing Activities Other Financing Charges | N/A | N/A | -850.00M | 850.00M | N/A |
| Investing Activities Other Investing Activity | N/A | N/A | N/A | -20.00M | N/A |
Data provided by Twelve Data
Technical Analysis
Key Insights
- Hindustan Unilever Ltd. is currently exhibiting a sideways to mildly bullish trend with price action consolidating near the ₹2,200 level after recent declines from the 52-week high of ₹2,750.
- Key support levels are identified near ₹2,020 (52-week low) and ₹2,180 (near-term option strike), while resistance is observed around ₹2,320 (200-day moving average) and ₹2,750 (52-week high).
- The stock is trading slightly below the 200-day moving average at ₹2,327 and near the 50-day moving average at ₹2,217, indicating a neutral to cautious technical stance.
- Momentum indicators show the Relative Strength Index (RSI) hovering around neutral levels near 50, MACD lines converging with no clear crossover, and Stochastic oscillators reflecting consolidation, suggesting limited directional momentum.
- Multi-timeframe analysis reveals daily charts showing consolidation, weekly charts indicating a potential base formation, and monthly charts maintaining a long-term uptrend despite short-term volatility.
- Potential market scenarios include a breakout above the 200-day moving average signaling renewed upward momentum or a breakdown below ₹2,020 support triggering further consolidation or correction.
Trending News
1. Headline: Mcap of nine of top-10 most valued firms jumps ₹2.15 lakh crore; Airtel biggest winner - The HinduBusinessLine
Summary: The market valuation of Bharti Airtel surged by ₹52,432.67 crore to ₹11,62,963.30 crore, the most among the top-10 firms
Sentiment: positive
Summary: Several companies, including Asian Paints Ltd., Hindustan Unilever Ltd., Life Insurance Corporation of India, Tata Power Co. Ltd. and Supreme Industries Ltd., are set to trade ex-dividend this week, with record dates falling between June 22 and June 27. The ex-dividend date is the day a stock ...
Sentiment: neutral
3. Headline: 3 MMMUT students bag ₹45 lakh packages | Varanasi News - The Times of India
Summary: Gorakhpur: Three students from ... India Ltd (EIL). The university recorded its best-ever placement performance, securing more than 1,100 job offers from over 120 companies during the 2025–26 placement season.Major recruiters included TCS, IBM, Accenture, Amazon, HCL, Larsen & Toubro, Ericsson, BNP Paribas India Solutions, Tata Advanced Systems, Reliance Industries, Aditya Birla Group, Hindustan Unilever Ltd, Bharat ...
Sentiment: positive
4. Headline: Hindustan Unilever Shares - Thursday chart picture and key levels
Summary: The shares of Hindustan Unilever (INE030A01027) trade on the National Stock Exchange of India at approximately ?2,217.70 as of 06/18/2026, 15:55 IST. Company: Hindustan Unilever Ltd.
Sentiment: neutral
5. Headline: Testing times - Brand Wagon News | The Financial Express
Summary: Since acquiring Horlicks in 2020, Hindustan Unilever Ltd (HUL) has made many tweaks to the brand. It expanded the portfolio into “high science” nutrition and shifted the brand narrative from “health food drinks” to “functional nutritional drinks” to meet evolving regulations.
Sentiment: positive
Powered by Brave
Recent Updates
News Summary
As of 2026-05-29. Hindustan Unilever Ltd announced a proposed final dividend of ₹22 per share for the fiscal year 2025-26, subject to shareholder approval at the upcoming annual general meeting scheduled for June 30, 2026, with payment expected on or after July 3, 2026. The company reported consolidated revenue growth of 8% year-over-year in Q4 FY26 and 5% for the full year, with EBITDA margins maintained around 23.6%-23.7%. Profit after tax before exceptional items rose 4% year-on-year, while reported PAT increased 20% including divestment gains. Strategic initiatives highlighted include premiumization, omni-channel execution, and portfolio expansion, with advertising and promotion expenses rising by ₹270 crore year-over-year. The company maintains midterm margin guidance of 22.5%-23.5% and plans pricing actions to offset input cost inflation. Overall, the updates reflect steady financial performance and continued focus on growth and shareholder returns.
News Sentiment
The overall sentiment from recent updates is moderately positive, driven by consistent revenue and profit growth, strategic portfolio management, and a clear dividend policy reinforcing shareholder value. Neutral tones arise from cautious market reactions to the dividend proposal and stable but unspectacular share price movements. Positive developments such as premiumization and omni-channel expansion support growth prospects, while the company’s margin guidance and cost management efforts indicate prudent financial stewardship. The balance of these factors suggests a stable outlook with measured optimism based on operational execution and market conditions.
Source List
- https://www.alphaspread.com/security/nse/hindunilvr/investor-relations
Analytical Overview
Analysis Summary
Hindustan Unilever Ltd’s valuation metrics, including a trailing P/E of 48.54 and forward P/E of 40.92, are elevated relative to the industry average P/E of 48.54, reflecting premium pricing consistent with its market leadership and brand strength. Revenue growth of 4.3% quarterly and 5% annually, combined with strong operating cash flow of ₹109.99 billion, indicate a stable growth trajectory supported by efficient cash generation. The company maintains a conservative financial profile with a low debt-to-equity ratio of 0.03 and a current ratio of 1.22, underscoring solid liquidity and manageable leverage. Sector-specific challenges include competitive intensity and regulatory compliance in the Indian FMCG market, while opportunities arise from premiumization, omni-channel expansion, and portfolio diversification. Given the Indian market context, regulatory environment, consumer trends favoring branded products, and economic outlook support continued demand for essential consumer goods.
Overall Business and Market Assessment
Supporting Factors: HUL’s strong brand portfolio and market leadership, consistent revenue and profit growth, and robust cash flow generation
Risk Factors: competitive pressures, input cost inflation, and regulatory developments impacting product categories
SWOT Analysis
Strengths
- Hindustan Unilever Ltd. has a diversified and well-recognized brand portfolio across multiple consumer product categories.
- The company demonstrates strong profitability with a net profit margin of 23.33% and return on equity of 21.60%.
- Robust cash flow generation supports dividend payments and strategic investments.
- Low debt levels with a debt-to-equity ratio of 0.03 enhance financial stability.
Weaknesses
- High valuation multiples such as P/E of 48.54 and EV/EBITDA of 35.07 may limit upside potential.
- Dependence on the Indian market exposes the company to regional economic and regulatory risks.
- Operating margins at 21.14% could face pressure from input cost inflation.
- Limited international diversification compared to some global FMCG peers.
Opportunities
- Expansion into premium product segments and functional nutrition categories.
- Increased penetration through omni-channel retail and e-commerce platforms.
- Portfolio rotation and acquisitions to capture high-growth market segments.
- Growing consumer demand in India’s evolving FMCG sector.
Threats
- Intense competition from domestic and multinational FMCG companies.
- Regulatory changes impacting product formulations and labeling requirements.
- Macroeconomic factors such as inflation and rural demand fluctuations.
- Supply chain disruptions affecting raw material availability and costs.
Company Description
Hindustan Unilever Ltd. is a prominent consumer goods company in India, known for its extensive range of products in segments like food, personal care, and home care. The company's primary function is to manufacture and market a diverse array of goods that cater to everyday needs, thus playing a critical role in the fast-moving consumer goods (FMCG) sector. Notable features of Hindustan Unilever Ltd. include its popular brands such as Surf Excel, Dove, Lux, Lipton, and Knorr, which have become household names across India. The company employs sustainable practices and innovation to meet consumer demands, with a focus on enhancing product quality and accessibility. As a key player in the Indian FMCG market, Hindustan Unilever Ltd. influences both local economies and consumer trends, supported by its robust distribution network and strategic marketing initiatives. Headquartered in Mumbai, its operations contribute significantly to the economic landscape by providing essential products, creating employment opportunities, and investing in community development programs.