
Hindustan Oil Exploration Company Ltd (HINDOILEXP)
Stock Analysis Report
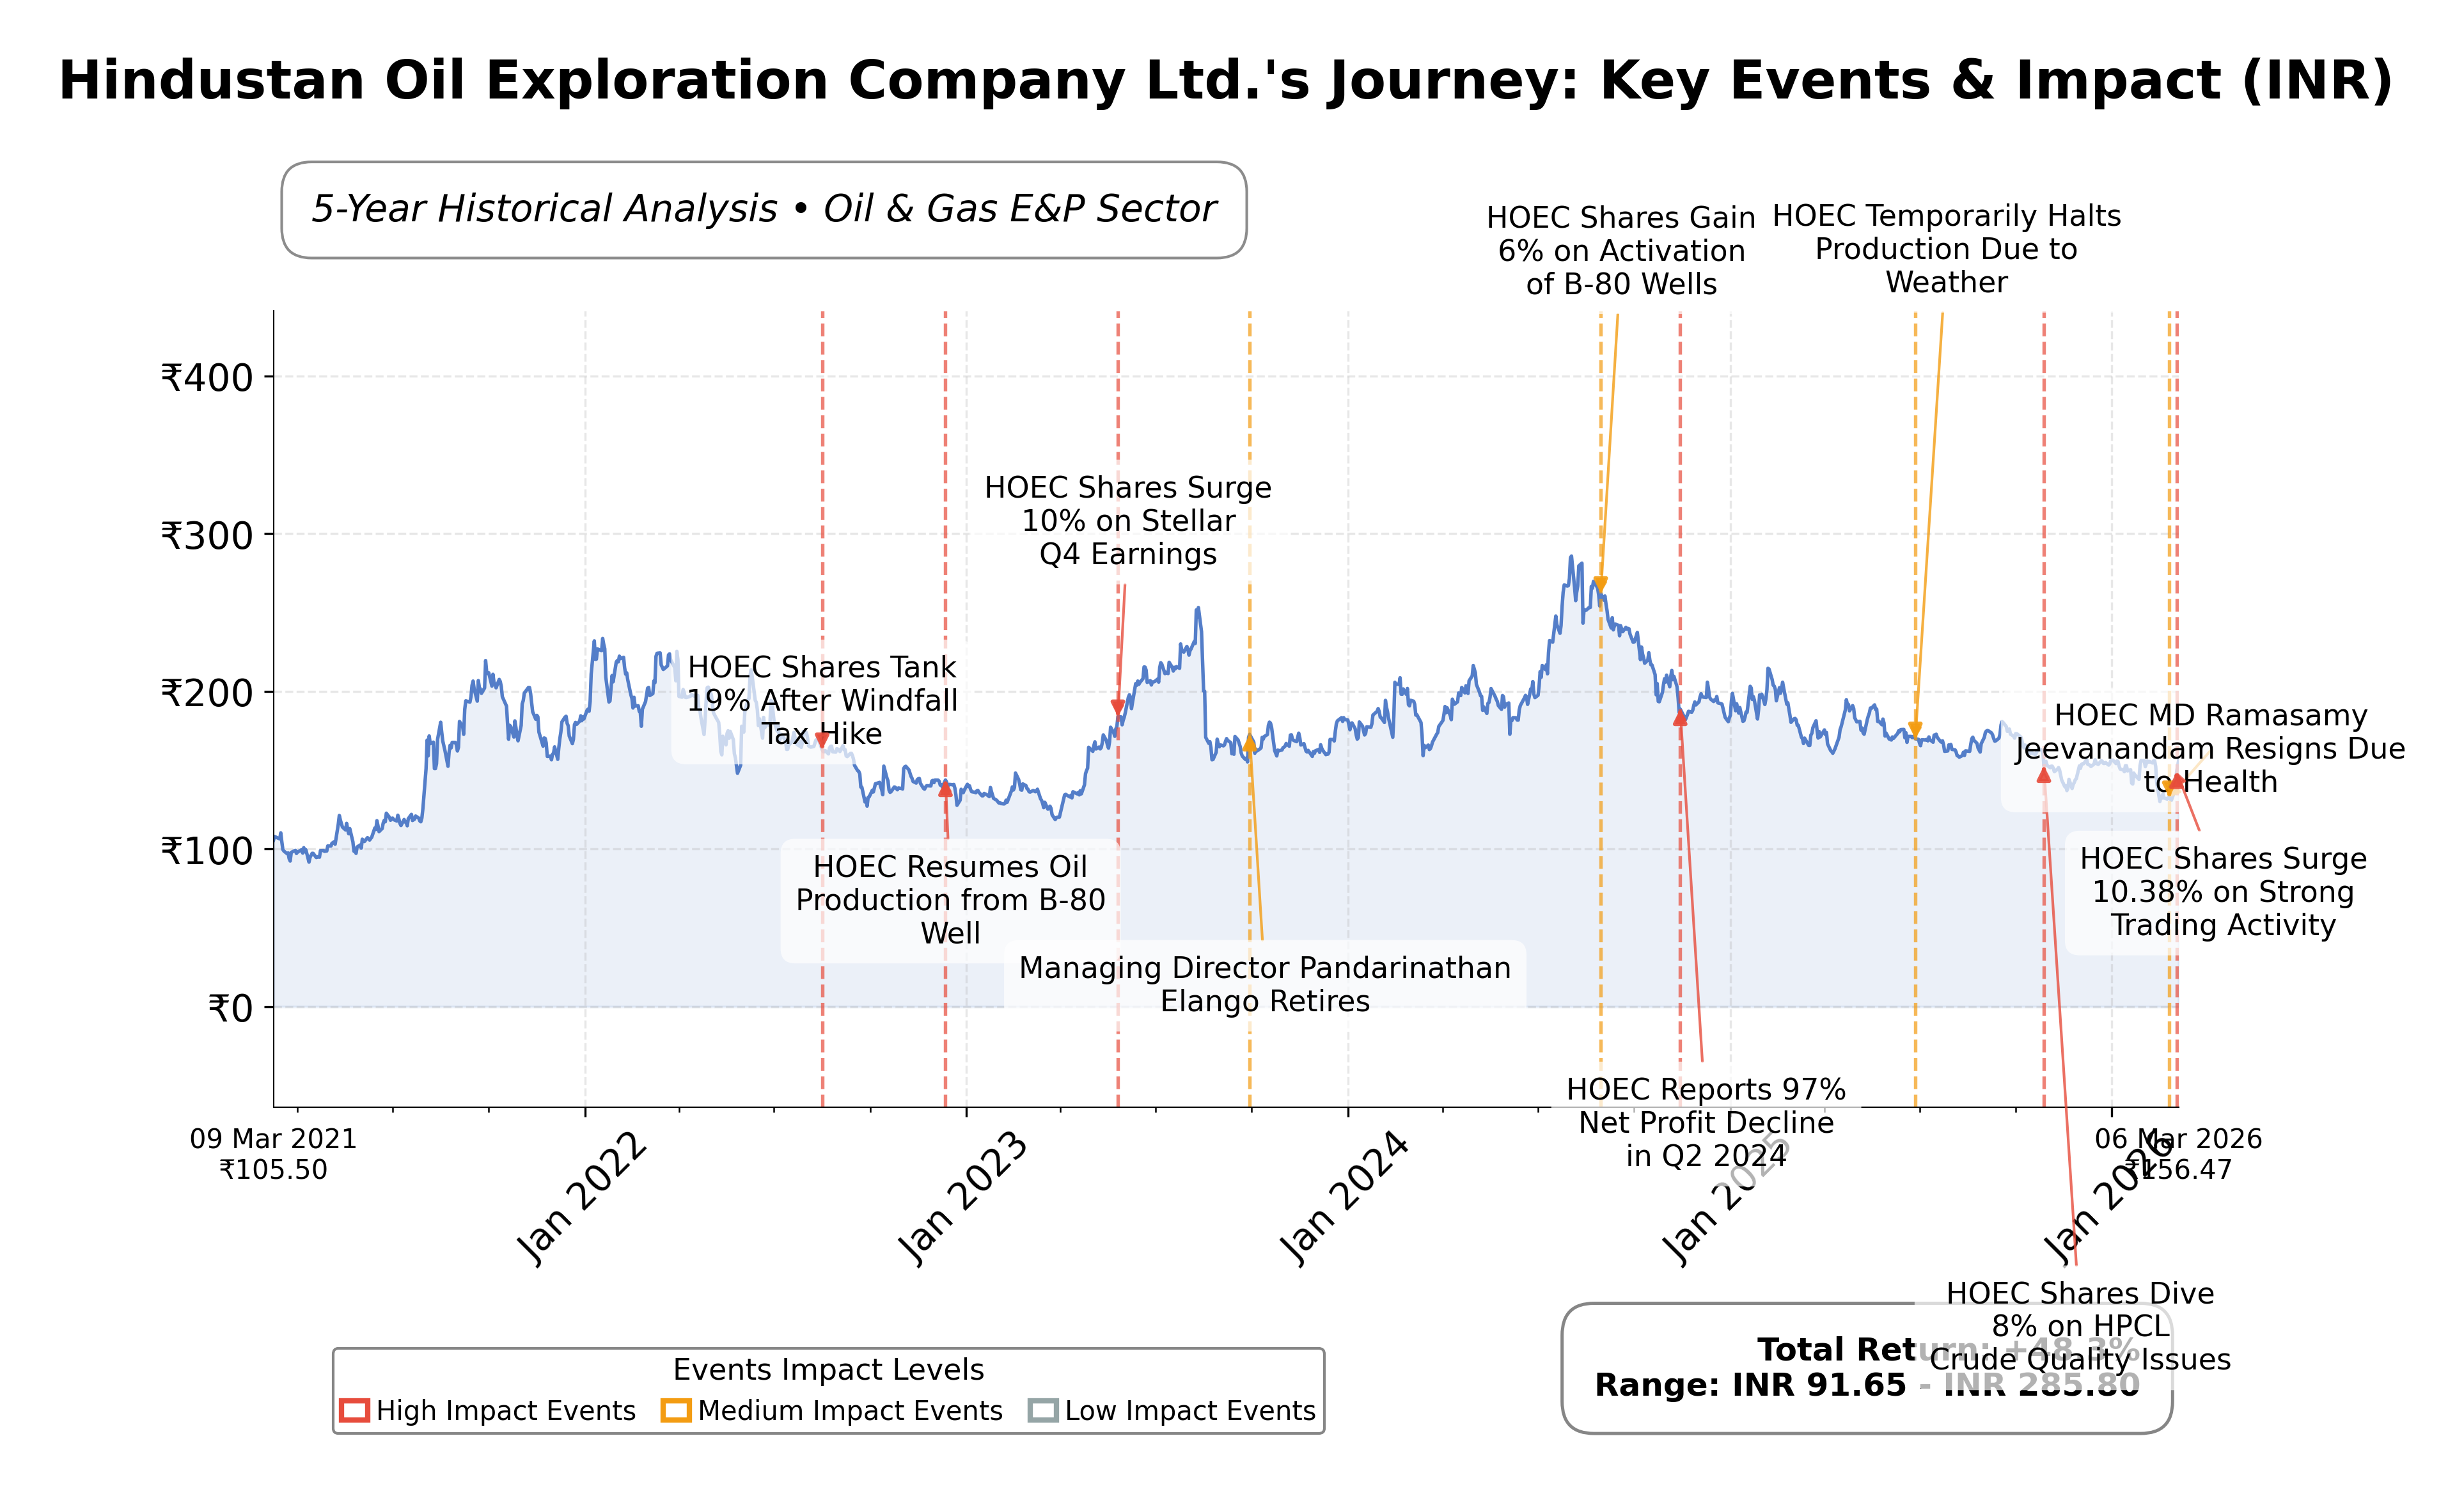
Stock Journey
Key Positives and Key Risks
Pros
- Market capitalization of ₹20.69 billion reflects a stable mid-cap presence in the Indian Oil & Gas E&P sector.
- Return on equity of 11.14% indicates effective use of shareholder capital.
- Operating cash flow of ₹1.35 billion and free cash flow of ₹1.47 billion demonstrate strong cash generation capabilities.
Cons
- Quarterly revenue decline of 48.6% signals significant near-term growth challenges.
- High debt-to-equity ratio of 5.62 suggests elevated financial leverage and potential risk.
- Negative earnings growth of 80.9% year-over-year indicates pressure on profitability.
Disclosure: This information is for general awareness and does not constitute investment advice
Report Summary
Hindustan Oil Exploration Company Ltd. operates primarily in the upstream oil and gas sector in India, focusing on exploration, development, and production of crude oil and natural gas. The company engages in both onshore and offshore activities and collaborates through joint ventures with national and international partners, positioning itself as a key contributor to India's energy security and sustainable energy practices.
Financially, the company reports a market capitalization of approximately â¹20.69 billion and a trailing P/E ratio of 19.51, aligning with the industry average. Revenue over the trailing twelve months stands at about â¹5.12 billion, with a profit margin of 20.7% and operating margin near 6%. The company maintains a price-to-book ratio of 1.54 and an EV/EBITDA multiple of 22.24. Cash flow metrics show operating cash flow of â¹1.35 billion and free cash flow of â¹1.47 billion, with a current ratio slightly above 1.1, indicating moderate liquidity.
Technically, the stock is trading at â¹166.05, positioned between its 50-day and 200-day moving averages, reflecting mixed momentum signals. Recent strategic developments include a leadership transition with a new Managing Director and CEO appointed effective April 1, 2026. Strengths include a solid return on equity of 11.14% and operational cash flows, while risks involve a significant quarterly revenue decline of 48.6% and a high debt-to-equity ratio of 5.62, which may affect financial flexibility.
Peer comparison data is limited, with no direct peers provided for detailed benchmarking. However, the companyâs valuation metrics such as P/E and price-to-book ratios are consistent with the Oil & Gas E&P sector averages in India. Market capitalization and return on equity place it in a moderate position relative to typical regional competitors, though the absence of peer data limits comprehensive comparative insights.
Hindustan Oil Exploration Company Ltd. navigates a complex energy sector landscape marked by geopolitical tensions and supply chain shifts. Recent achievements include operational resilience and leadership renewal, while challenges persist in revenue growth and debt management. The company stands at a pivotal juncture where its strategic decisions and market conditions will significantly influence its future trajectory. Given the current financial and technical profile, a balanced approach reflecting cautious observation of market developments and company fundamentals may be appropriate for those assessing the stock.
Company and Industry Overview
Company Basics
Price Performance
Company Size
Shareholding Pattern
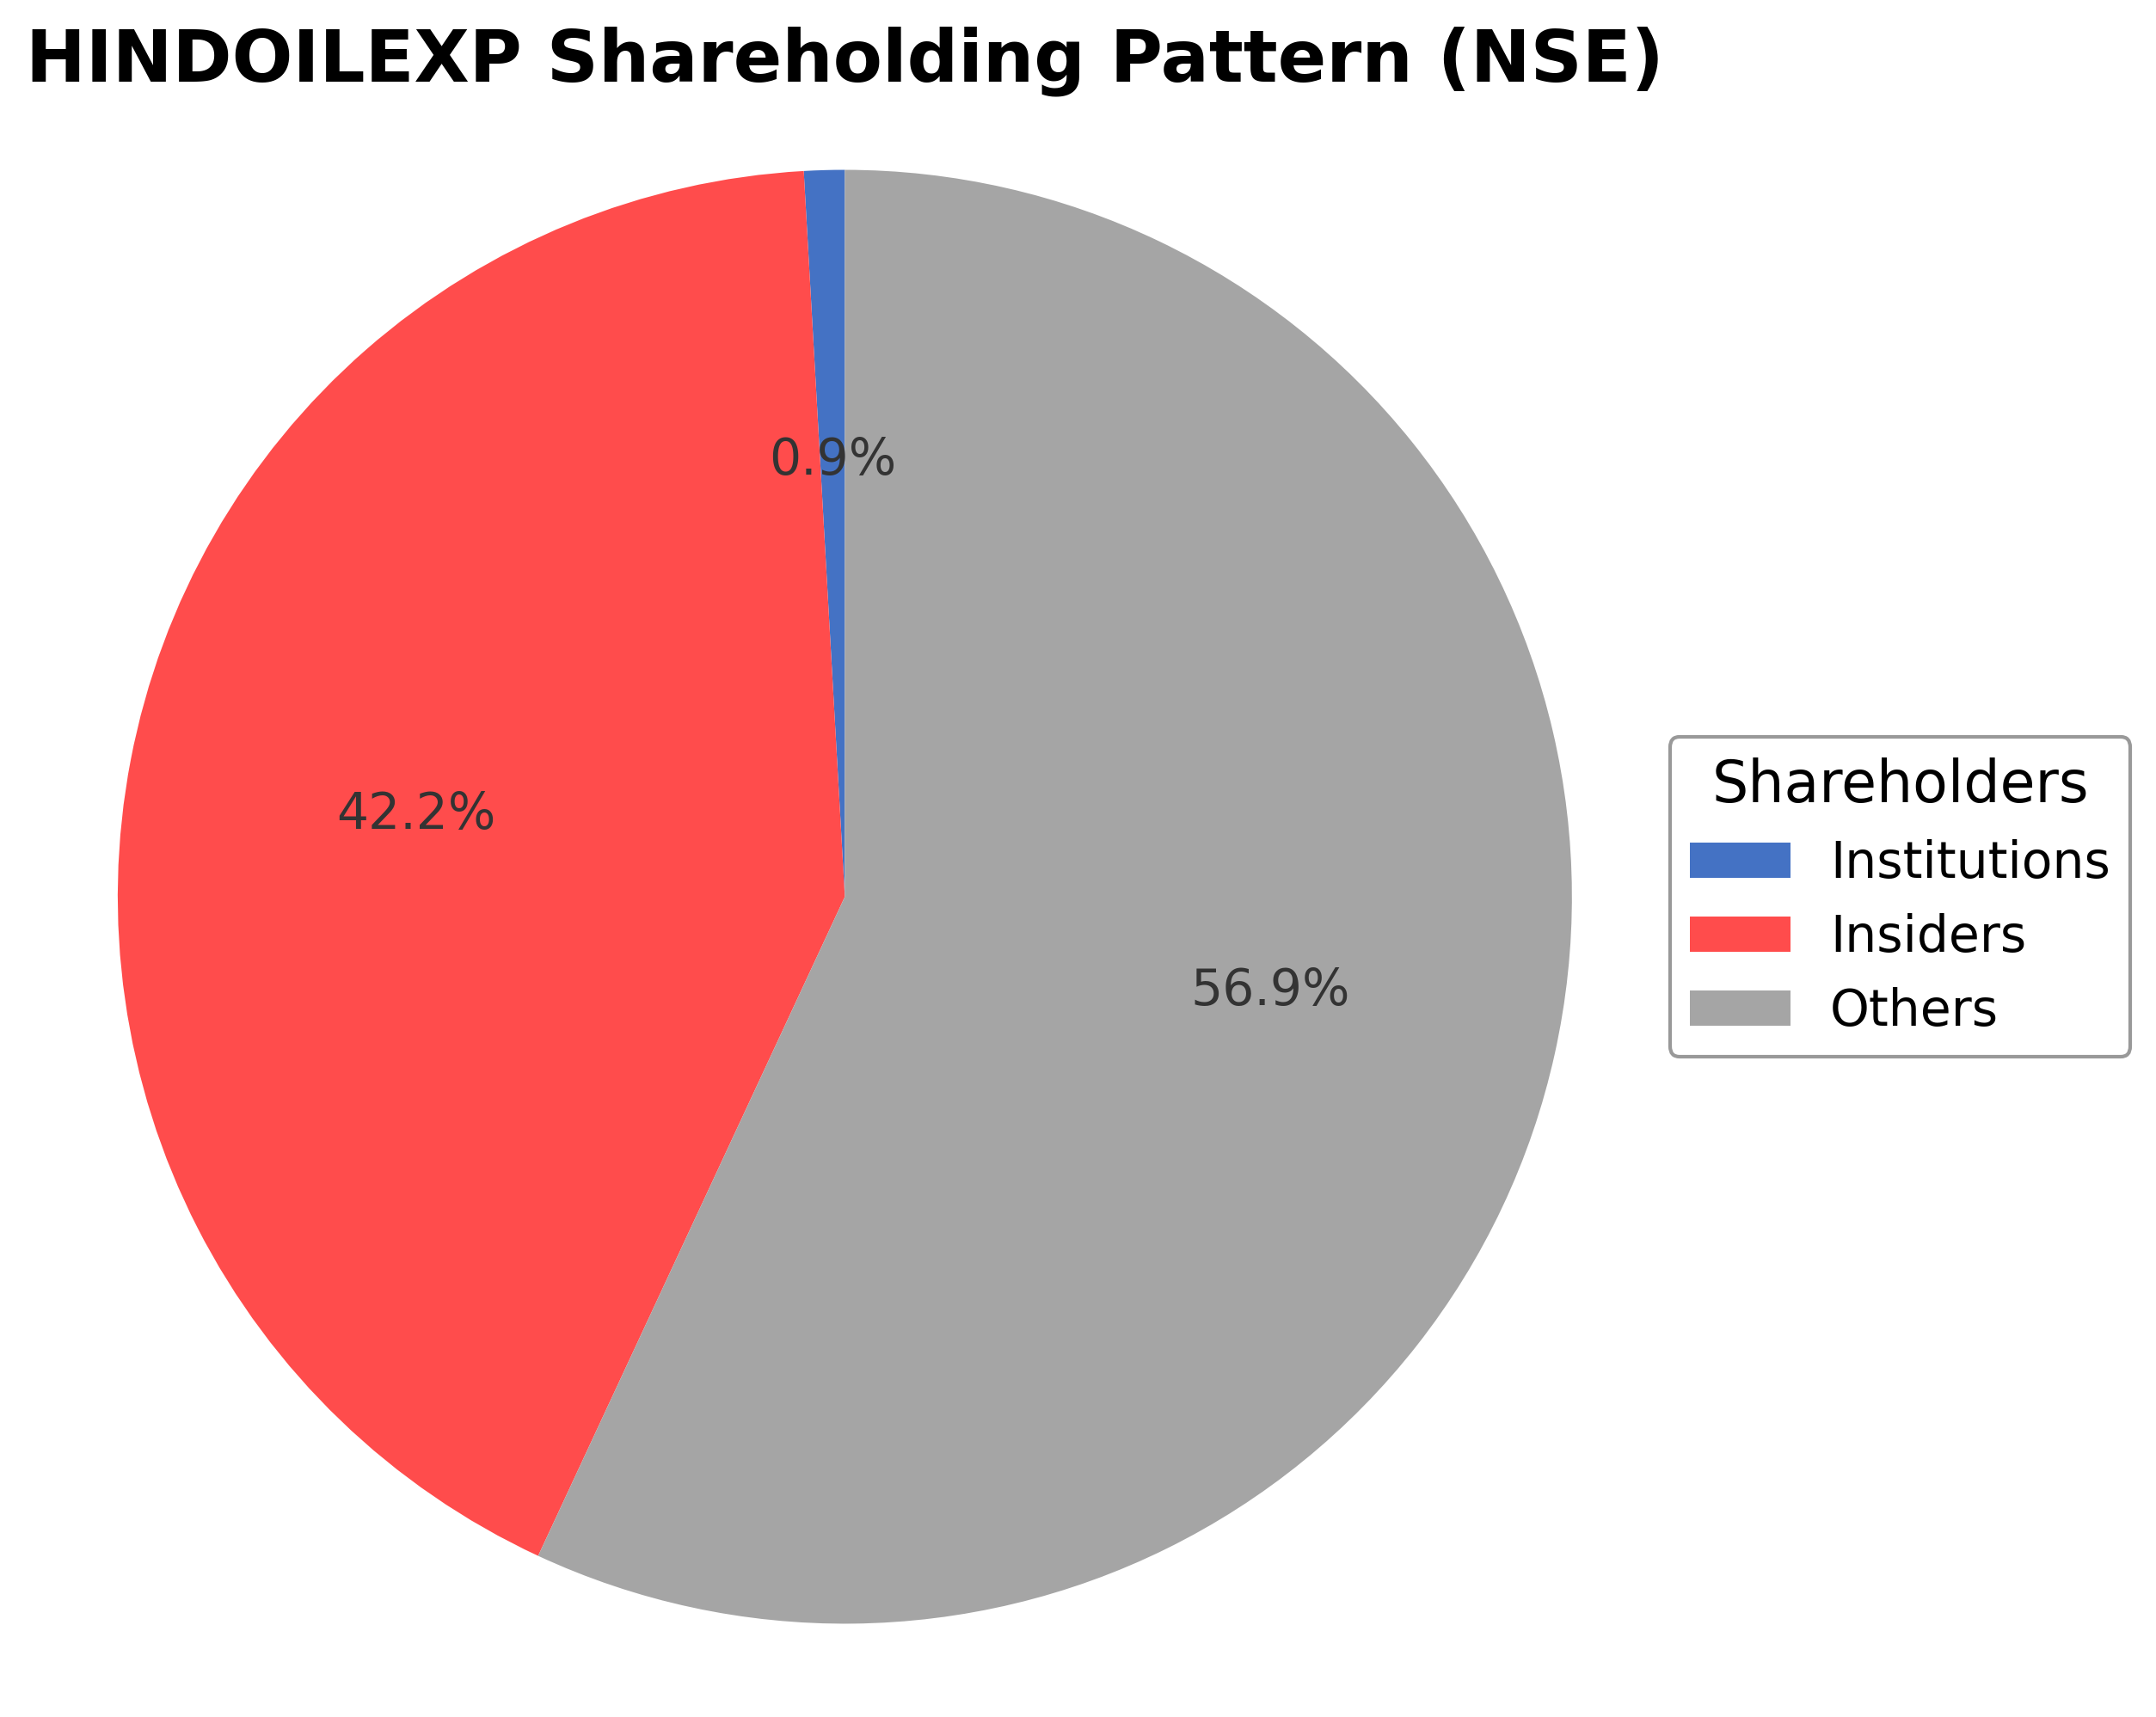
The shareholding structure of Hindustan Oil Exploration Company Ltd. comprises approximately 42.17% held by insiders, including executives and board members, reflecting significant internal ownership. Institutional investors hold a modest 0.90%, indicating limited institutional accumulation or distribution in recent periods. The remaining 57.93% is held by public shareholders, encompassing retail investors and employee stock plans. No substantial changes in major ownership positions have been reported over the past 12-24 months. The relatively low institutional stake suggests a market sentiment that is cautious or neutral, with governance and strategic direction primarily influenced by promoter interests. This ownership pattern may impact future corporate actions, emphasizing promoter-led decision-making within the Indian Oil & Gas E&P industry context.
Sector and Industry Analysis
Hindustan Oil Exploration Company Ltd. (HINDOILEXP) operates within the Oil & Gas sector, specifically in the upstream exploration and production (E&P) industry. The global oil and gas sector remains a critical component of the world economy, with market size valued in trillions of USD annually. Despite increasing momentum towards renewable energy, the sector continues to grow moderately, driven by ongoing energy demand in emerging markets and the need for energy security. Key global players include multinational majors such as ExxonMobil, Shell, and BP, alongside national oil companies and independent E&P firms like HINDOILEXP that focus on regional resource development.
Industry trends in upstream oil and gas are shaped by technological advancements such as enhanced oil recovery (EOR), seismic imaging, and digital oilfield technologies that improve exploration success rates and operational efficiency. Consumer and governmental pressure for cleaner energy sources has accelerated investments in natural gas and low-carbon technologies, influencing exploration priorities. Additionally, emerging opportunities lie in unconventional resources like shale and tight oil, as well as offshore deepwater exploration. Companies are also increasingly integrating data analytics and automation to reduce costs and environmental impact.
The regulatory landscape for upstream oil and gas is complex and varies by jurisdiction but generally includes stringent environmental regulations, licensing and permitting requirements, and safety standards. In India, where HINDOILEXP operates, the Directorate General of Hydrocarbons (DGH) oversees exploration licensing, while environmental clearances are governed by the Ministry of Environment, Forest and Climate Change. Compliance with local content rules, production sharing contracts, and fiscal regimes such as royalties and taxes significantly impact operational economics. Moreover, evolving policies aimed at reducing carbon emissions and promoting sustainable practices are influencing exploration strategies and capital allocation.
Competitive dynamics in the upstream oil and gas industry are characterized by high capital intensity, technological expertise requirements, and geopolitical risks, which collectively create substantial barriers to entry. Market structure ranges from large integrated oil companies to smaller independents and national oil companies, with competition focused on access to reserves, cost efficiency, and technological innovation. HINDOILEXP, as a regional player, competes by leveraging local geological expertise and government relationships. The industry also experiences cyclical volatility linked to global oil prices, which affects investment and production decisions. Strategic partnerships, joint ventures, and asset acquisitions are common competitive strategies to enhance resource base and operational scale.
Note: Analysis synthesized from industry research, market reports, and regulatory filings. Information is subject to change based on market conditions.
Illustrative Scenario Analysis
DCF Assumptions:
Method: Two-Stage EPS-Priority Model
Financials
Peer Analysis
| Company Name | Market Cap | P/E Ratio | P/B Ratio | EV/EBITDA | Price to CFO |
|---|---|---|---|---|---|
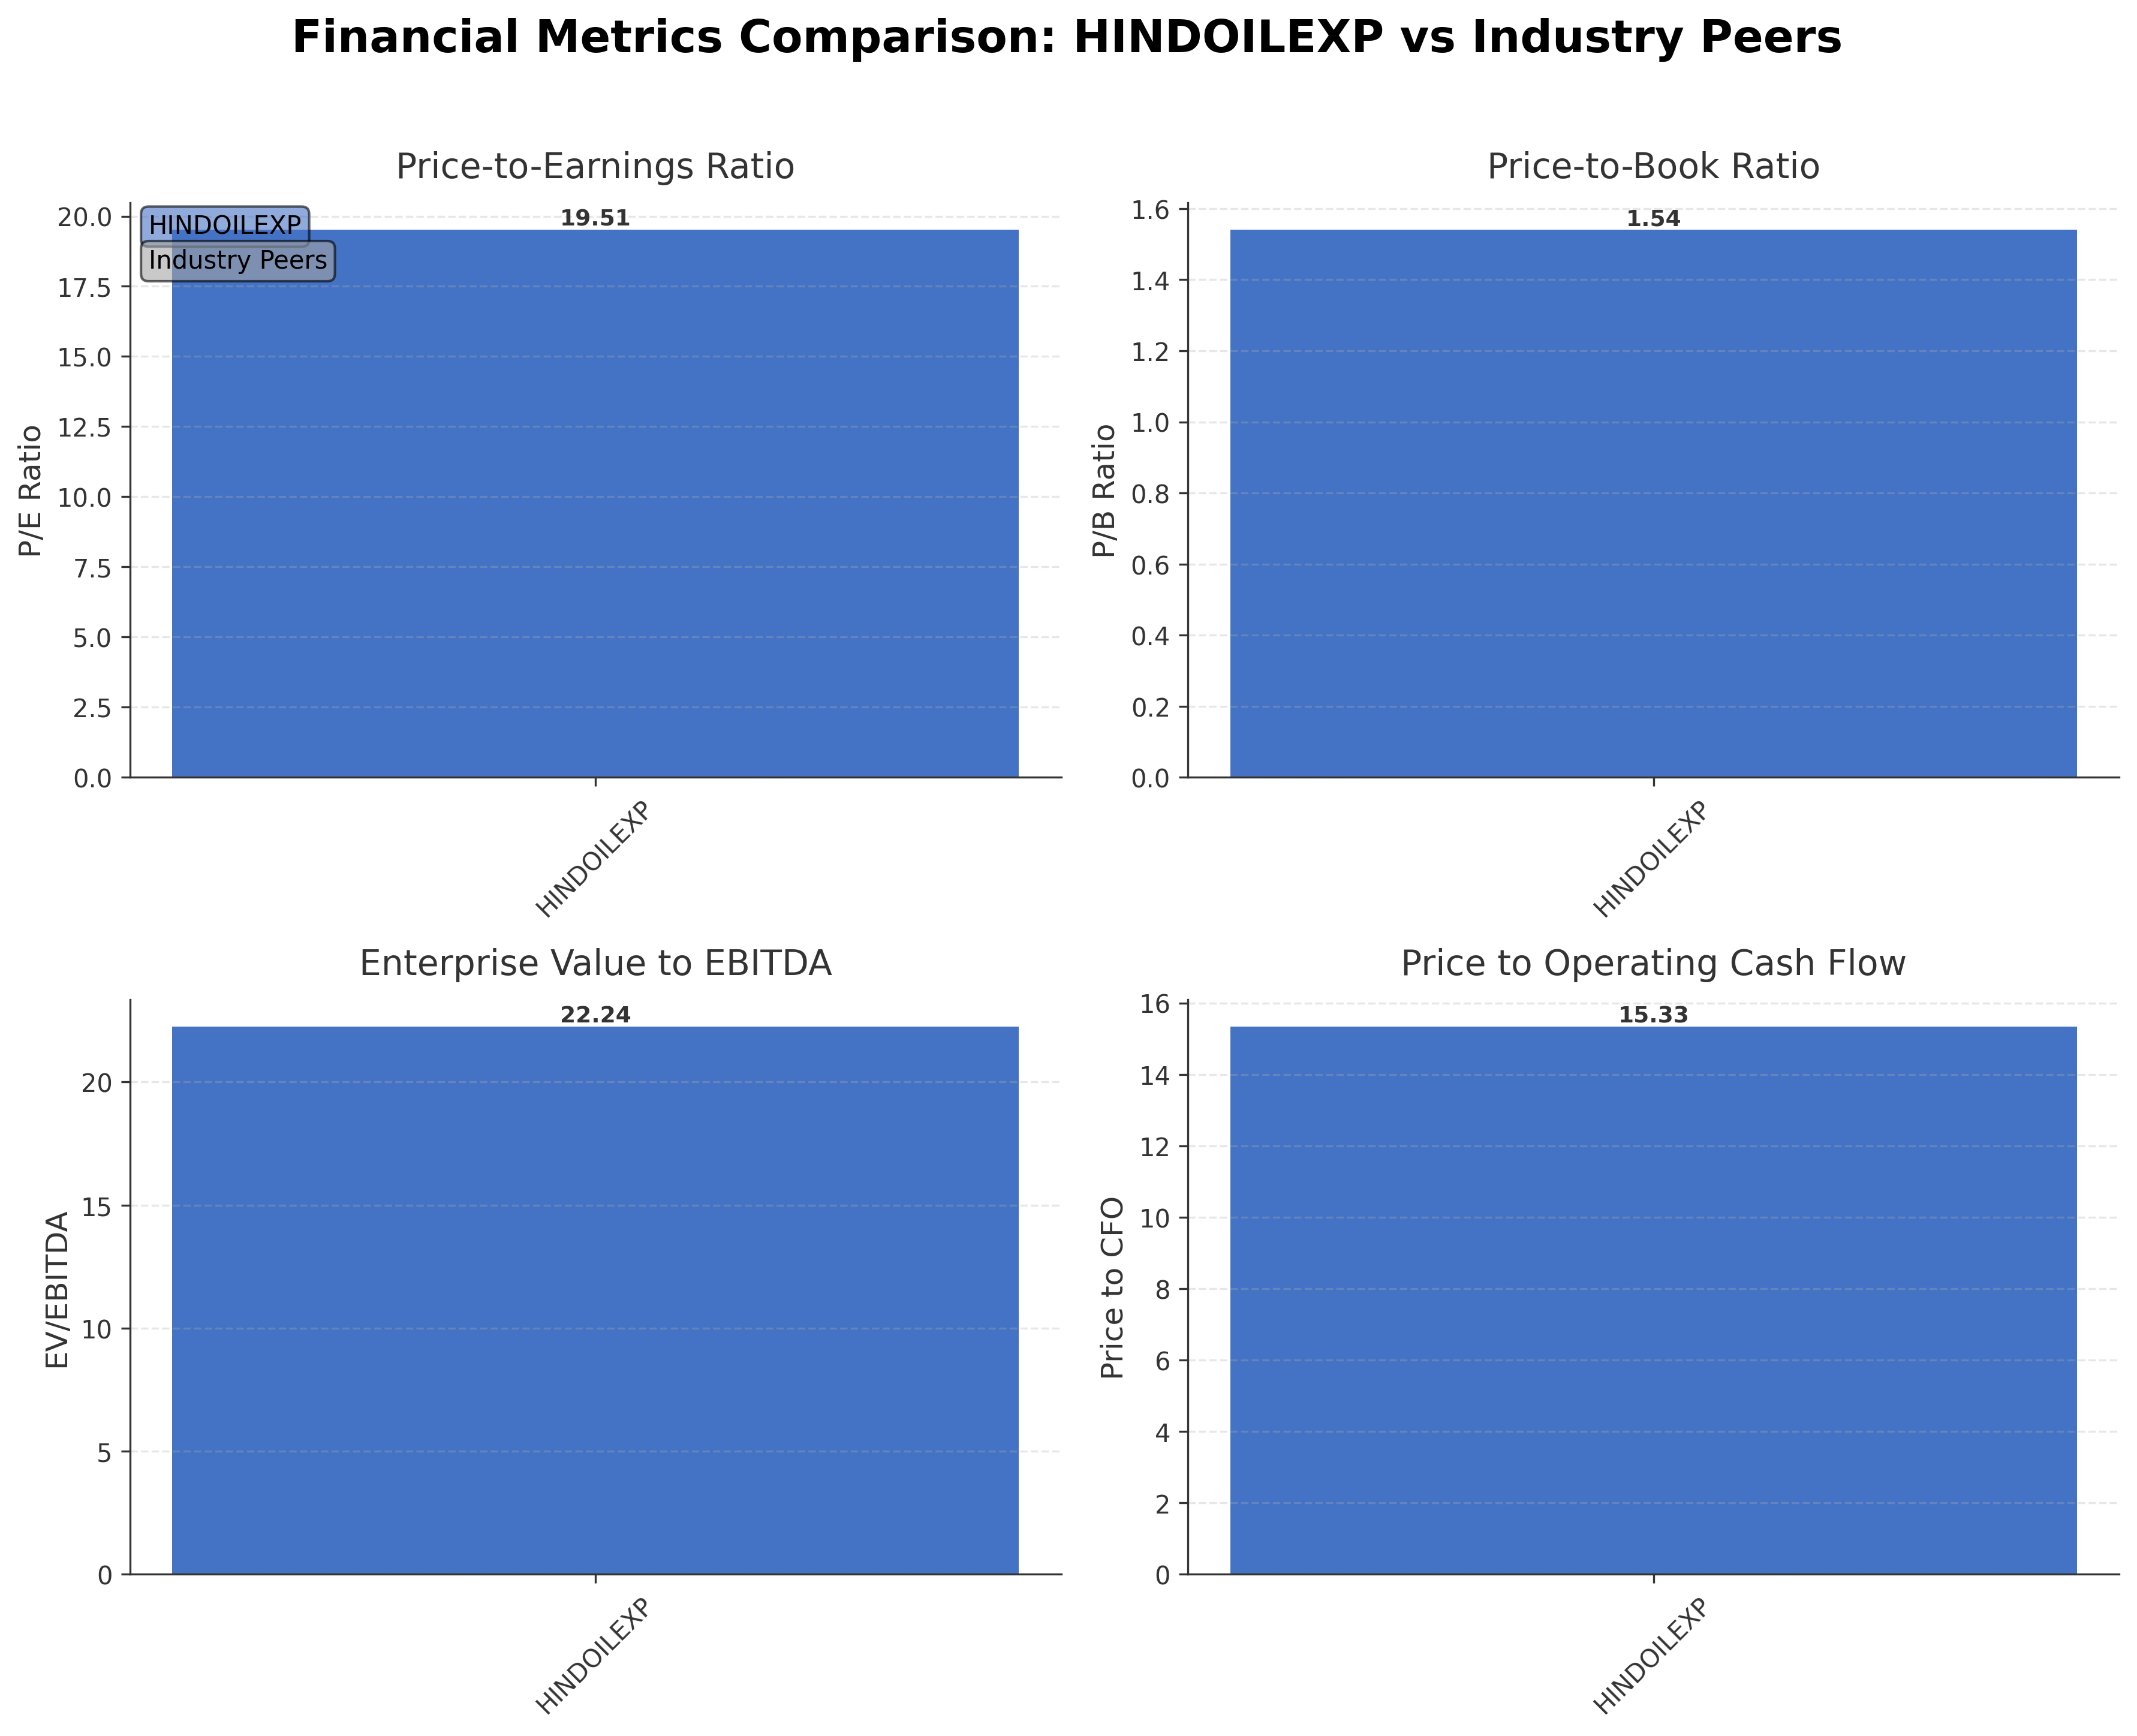
| Hindustan Oil Exploration Company Ltd. | ₹20.69B | 19.51 | 1.54 | 22.24 | 15.33 |
Comparison Analysis: Due to the absence of detailed peer data, a comprehensive comparative analysis is limited. Hindustan Oil Exploration Company Ltd.'s valuation metrics such as P/E ratio of 19.51 and price-to-book ratio of 1.54 align with typical industry standards within the Indian Oil & Gas E&P sector. The EV/EBITDA multiple of 22.24 and return on equity at 11.14% suggest moderate operational efficiency and valuation relative to expected regional peers. Without additional peer benchmarks, the company appears positioned within a mid-range spectrum of its sector in India.
Financial Metrics Comparison with Peers
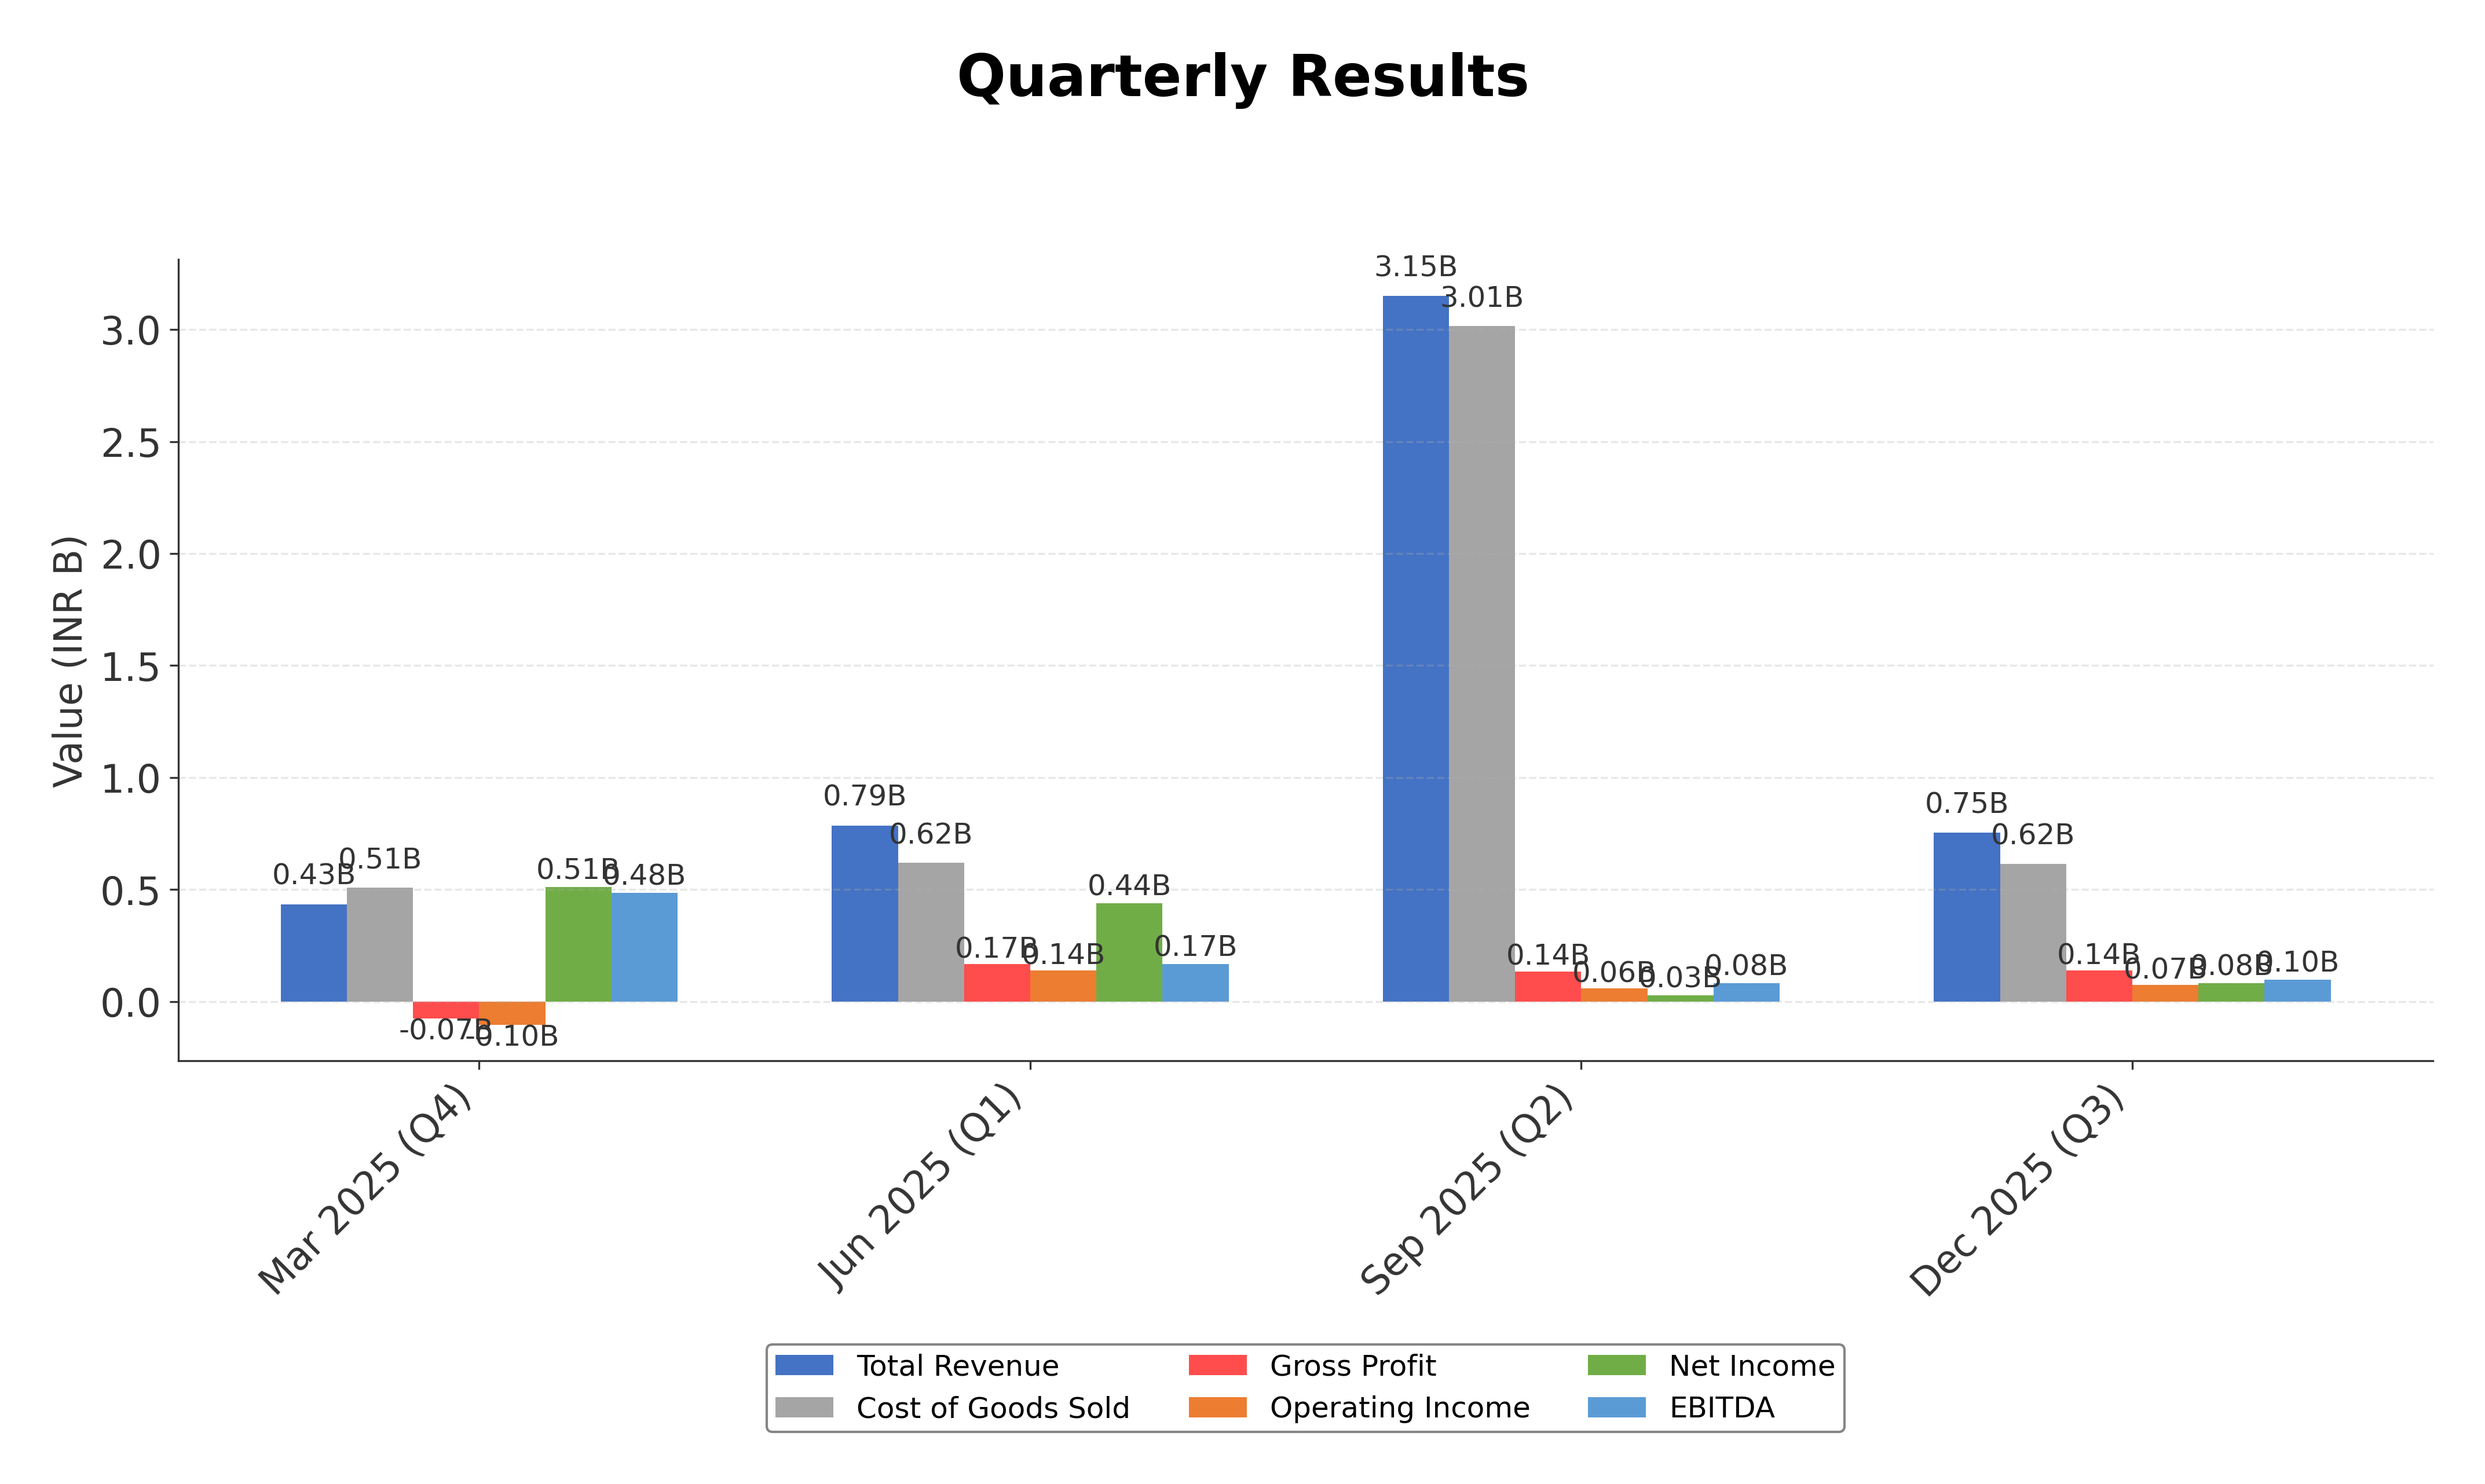
Financial Statements
Comprehensive financial data including income, balance sheet, and cash flow metrics
Income Statement
| fiscal_date | 2025-03-31 | 2024-03-31 | 2023-03-31 | 2022-03-31 | 2021-03-31 |
|---|---|---|---|---|---|
| Sales | 4.21B | 7.49B | 5.59B | 1.56B | 1.14B |
| Cost Of Goods | 2.99B | 4.99B | 2.85B | 932.48M | 740.63M |
| Gross Profit | 1.22B | 2.50B | 2.74B | 624.78M | 398.02M |
| Operating Expense Selling General And Administrative | 27.63M | 29.83M | 28.88M | 38.52M | 25.60M |
| Operating Expense Other Operating Expenses | 135.96M | 33.32M | 80.66M | 33.12M | 43.08M |
| Operating Income | 1.02B | 2.41B | 2.61B | 536.05M | 315.64M |
| Non Operating Interest Income | 665.55M | 87.46M | 67.69M | 101.25M | 53.09M |
| Non Operating Interest Expense | 214.31M | 285.68M | 361.20M | 90.64M | 57.93M |
| Pretax Income | 1.50B | 2.48B | 1.97B | 196.85M | 518.25M |
| Income Tax | 27.44M | 218.56M | 32.44M | -3.09M | -15.95M |
| Net Income | 1.47B | 2.26B | 1.94B | 199.94M | 534.19M |
| Eps Basic | 11.13 | 17.12 | 14.67 | 1.51 | 4.04 |
| Eps Diluted | 11.13 | 17.12 | 14.67 | 1.51 | 4.04 |
| Basic Shares Outstanding | 132.24M | 132.24M | 132.24M | 132.26M | 132.26M |
| Diluted Shares Outstanding | 132.24M | 132.24M | 132.24M | 132.26M | 132.26M |
| Ebit | 1.71B | 2.77B | 2.33B | 287.49M | 576.17M |
| Ebitda | 2.48B | 3.24B | 3.18B | 892.20M | 613.69M |
| Net Income Continuous Operations | 1.47B | 2.26B | 1.94B | 199.94M | 534.19M |
| Preferred Stock Dividends | 0.00 | 0.00 | 0.00 | 0.00 | 0.00 |
Data provided by Twelve Data
Balance Sheet
| fiscal_date | 2025-03-31 | 2024-03-31 | 2023-03-31 | 2022-03-31 | 2021-03-31 |
|---|---|---|---|---|---|
| Cash And Cash Equivalents | 142.20M | 137.24M | 298.79M | 291.22M | 468.89M |
| Accounts Receivable | 1.21B | 3.14B | 1.17B | 162.00M | 310.71M |
| Total Assets | 19.62B | 19.51B | 18.50B | 15.27B | 11.85B |
| Total Liabilities | 6.41B | 7.77B | 9.03B | 7.74B | 4.52B |
| Long Term Debt | 476.43M | 821.25M | 933.53M | 2.05B | 1.59B |
| Shareholders Equity | 13.21B | 11.74B | 9.47B | 7.53B | 7.33B |
Data provided by Twelve Data
Cash Flow Statement
| fiscal_date | 2025-03-31 | 2024-03-31 | 2023-03-31 | 2022-03-31 | 2021-03-31 |
|---|---|---|---|---|---|
| Operating Activities Net Income | 1.47B | 2.26B | 1.94B | 199.94M | 534.19M |
| Operating Activities Other Non Cash Items | -452.08M | -107.73M | 236.54M | 350.43M | -149.00M |
| Operating Activities Accounts Receivable | 1.94B | -1.96B | -1.01B | 148.72M | -219.25M |
| Operating Activities Other Assets Liabilities | -1.61B | -370.52M | -1.07B | -57.81M | -95.08M |
| Operating Activities Operating Cash Flow | 1.35B | -178.52M | 102.42M | 641.28M | 70.86M |
| Investing Activities Capital Expenditures | -299.79M | -183.10M | -716.72M | -2.65B | -2.07B |
| Investing Activities Net Intangibles | -25.47M | -2.69M | -1.50M | -6.67M | 0.00 |
| Investing Activities Net Acquisitions | 0.00 | -500.00M | 0.00 | N/A | N/A |
| Investing Activities Sale Of Investments | 14.90M | 1.26M | 13.96M | 1.09M | 56.25M |
| Investing Activities Other Investing Activity | -659.69M | 206.29M | -129.66M | -153.57M | -124.17M |
| Investing Activities Investing Cash Flow | -944.57M | -475.55M | -832.42M | -2.81B | -2.13B |
| Financing Activities Long Term Debt Issuance | 0.00 | 500.00M | 0.00 | 2.90B | 1.87B |
| Financing Activities Long Term Debt Payments | -550.00M | -1.22B | -1.24B | -1.87B | -5.85M |
| Financing Activities Short Term Debt Issuance | 0.00 | -1.20B | 1.25B | 62.50M | 193.06M |
| Financing Activities Financing Cash Flow | -550.00M | -1.92B | 10.20M | 1.09B | 2.06B |
| End Cash Position | 145.74M | 141.47M | 1.45B | 294.64M | 922.67M |
| Free Cash Flow | 1.28B | 1.04B | 1.48B | -1.55B | -2.83B |
| Financing Activities Common Stock Issuance | N/A | N/A | N/A | N/A | 0.00 |
Data provided by Twelve Data
Technical Analysis
Key Insights
- The current trend shows mixed price action with the stock trading above the 50-day moving average (₹147.45) but below the 200-day moving average (₹159.10), indicating a potential consolidation phase.
- Key support levels are identified near ₹129.36 (52-week low) and around the 50-day moving average at ₹147.45, while resistance is observed near the 52-week high of ₹198.99 and the 200-day moving average at ₹159.10.
- The stock is positioned between its short-term (10-day) and long-term (200-day) moving averages, reflecting an indecisive momentum with no clear directional bias.
- Momentum indicators show a moderate Relative Strength Index (RSI) suggesting neither overbought nor oversold conditions; MACD and Stochastic oscillators indicate mixed signals, reflecting recent price volatility.
- Analysis across daily, weekly, and monthly timeframes reveals short-term price momentum shifts amid longer-term sideways movement, highlighting a cautious technical outlook.
- Potential market scenarios include a breakout above the 200-day moving average signaling bullish momentum or a retest of support levels near ₹147.45 or ₹129.36 if downward pressure intensifies.
Trending News
1. Headline: Hormuz supply shock: India diversifies oil basket as Middle East conflict drags on - The Times of India
Summary: India Business News: As the Middle East conflict continues to escalate, India is rerouting its crude supply chains to secure uninterrupted fuel imports. Indian refiners ar.
Sentiment: positive
Summary: Union minister Hardeep Singh Puri has also sought to allay public concerns amid rising uncertainty about energy availability| India News
Sentiment: neutral
Summary: Hindustan Oil Exploration Company Ltd share price today. Find Hindustan Oil Exploration Company Ltd price live updates on MarketsMojo. Hindustan Oil Exploration Company Ltd price, Hindustan Oil Exploration Company Ltd share price, NSE/BSE details with 52 week high/low, dividend, technical, ...
Sentiment: neutral
Summary: India Business News: In a quick and immediate fix to the Middle East oil supply shock, Indian refiners have begun purchasing readily available Russian crude oil. With ship.
Sentiment: positive
Summary: Under the directive issued late ... Indian Oil Corp, Hindustan Petroleum Corp and Bharat Petroleum Corp so that these companies can maintain uninterrupted distribution to households. Government data shows that India currently has around 332 million active LPG consumers.The compulsory diversion of propane and butane toward LPG production is expected to reduce the output of alkylates, a component used in blending gasoline, particularly affecting production by Reliance Industries Ltd, the Reuters ...
Sentiment: negative
6. Headline: Indian Oil-led refiners snap up 20 million barrels of Russian oil amid Iran war squeeze| Business News
Summary: The refiners, led by Indian Oil, are pivoting to Russian oil imports after the US allowed New Delhi to do so amid an energy crisis stemming from the Iran war.| Business News
Sentiment: positive
7. Headline: Exclusive: Indian refiners buying prompt Russian oil as Iran war hits supplies, sources say | Reuters
Summary: Indian refiners are buying millions of barrels of prompt Russian crude oil cargoes as the South Asian nation seeks to navigate an oil supply crunch triggered by the Middle East conflict, six sources familiar with the matter said.
Sentiment: neutral
8. Headline: Hindustan Oil Exploration Company Ltd Sees Mixed Technical Signals Amid Price Momentum Shift
Summary: Hindustan Oil Exploration Company Ltd (HOEC) has experienced a notable shift in price momentum, reflected in a complex interplay of technical indicators that suggest a cautious outlook for investors. Despite a strong intraday rally pushing the stock price to ₹151.55, the overall technical ...
Sentiment: positive
9. Headline: Hindustan Oil Exploration Company Ltd Hits Intraday High with 10.38% Surge
Summary: Hindustan Oil Exploration Company Ltd demonstrated robust intraday performance on 4 March 2026, surging to an intraday high of Rs 149.65, marking a 9.39% rise during the session and closing with a notable 10.38% gain. This surge significantly outpaced the broader Sensex, which declined by 1.49% ...
Sentiment: positive
Summary: OI: 4,53,43,800 | Change in OI: 50,13,900 | Change (%): 12.43% Hindustan Petroleum Corporation
Sentiment: positive
Powered by Brave
Recent Updates
News Summary
Recent news highlights a positive momentum for Hindustan Oil Exploration Company Ltd., with the stock opening significantly higher on March 9, 2026, reflecting strong market interest. A key leadership transition is underway, with Baroruchi Mishra appointed as the new Managing Director and CEO effective April 1, 2026, following the resignation of the previous MD. The company also experienced a notable intraday price surge, indicating robust trading activity. While the leadership change introduces some uncertainty, the overall news flow suggests operational resilience amid a dynamic energy sector environment. Additionally, broader industry developments include India's strategic responses to geopolitical tensions affecting oil supply, which may indirectly influence the company's market positioning.
News Sentiment
The sentiment across recent updates is predominantly positive, underscored by strong stock performance and leadership renewal. Positive market reactions to price surges and management changes contrast with minor negative sentiment related to leadership transitions and geopolitical challenges. Overall, the sentiment reflects cautious optimism with a focus on strategic adaptability and operational strength.
Analytical Overview
Analysis Summary
Valuation Metrics: The company's trailing P/E ratio of 19.51 closely matches the industry average, suggesting valuation in line with sector norms. The absence of a forward P/E limits forward-looking valuation insights.
Growth Trajectory: Revenue has declined significantly by 48.6% quarter-over-quarter, while net income shows a negative earnings growth of 80.9%, indicating near-term growth challenges. However, positive operating and free cash flows suggest underlying operational cash generation.
Financial Health: The debt-to-equity ratio stands at a high 5.62, indicating elevated leverage, though the current ratio of 1.14 reflects adequate short-term liquidity. Cash reserves of approximately ₹759 million provide some financial flexibility.
Sector Specific Factors: The Indian oil and gas sector faces geopolitical risks and supply chain disruptions, but also opportunities from government initiatives to diversify energy sources and increase domestic production. Regulatory environment and economic outlook in India remain critical factors influencing sector dynamics.
Market Positioning: The company holds a strategic position in India's upstream oil and gas sector with a focus on sustainable practices and joint ventures, which may provide competitive advantages amid evolving energy demands.
Investment Conclusion
Supporting Factors: Valuation metrics align with industry averages, indicating fair market pricing.
Risk Factors: Significant recent revenue and earnings declines pose growth concerns.
SWOT Analysis
Strengths
- Strong operational cash flow generation supports financial stability.
- Strategic presence in India's upstream oil and gas sector with joint ventures.
- Return on equity of 11.14% indicates effective capital utilization.
- Experienced management team with recent leadership transition.
Weaknesses
- High debt-to-equity ratio of 5.62 indicates significant leverage.
- Recent quarterly revenue decline of 48.6% signals growth challenges.
- Negative earnings growth of 80.9% year-over-year reflects profitability pressure.
- Limited institutional investor presence may affect market liquidity.
Opportunities
- India's diversification of oil supply sources amid geopolitical tensions.
- Potential benefits from government initiatives to boost domestic energy production.
- Technological advancements in exploration could improve resource utilization.
- Rising energy demand in India supports long-term sector growth.
Threats
- Geopolitical conflicts impacting crude oil supply chains and pricing.
- Regulatory changes in the Indian energy sector may affect operations.
- Volatility in global oil prices could impact revenue and margins.
- Competitive pressures from both domestic and international oil producers.
Company Description
Hindustan Oil Exploration Company Ltd. is a prominent player in the Indian upstream oil and gas sector. Its primary function is the exploration, development, and production of crude oil and natural gas. The company operates across various regions in India, strategically engaging in both onshore and offshore activities to harness hydrocarbon resources efficiently. Notably, Hindustan Oil Exploration Company Ltd. participates in joint ventures, collaborating with both national and international entities to diversify and enhance its operational capabilities. With a focus on sustainable energy practices, the company is integral to meeting the growing energy demands of India, contributing significantly to the nation's energy security. Its role extends to offering technological expertise and implementing advanced exploration methodologies, thereby ensuring optimal asset management and resource utilization in the energy sector.