


Hindustan Aeronautics Ltd (HAL)
Stock Analysis Report
Stock Journey
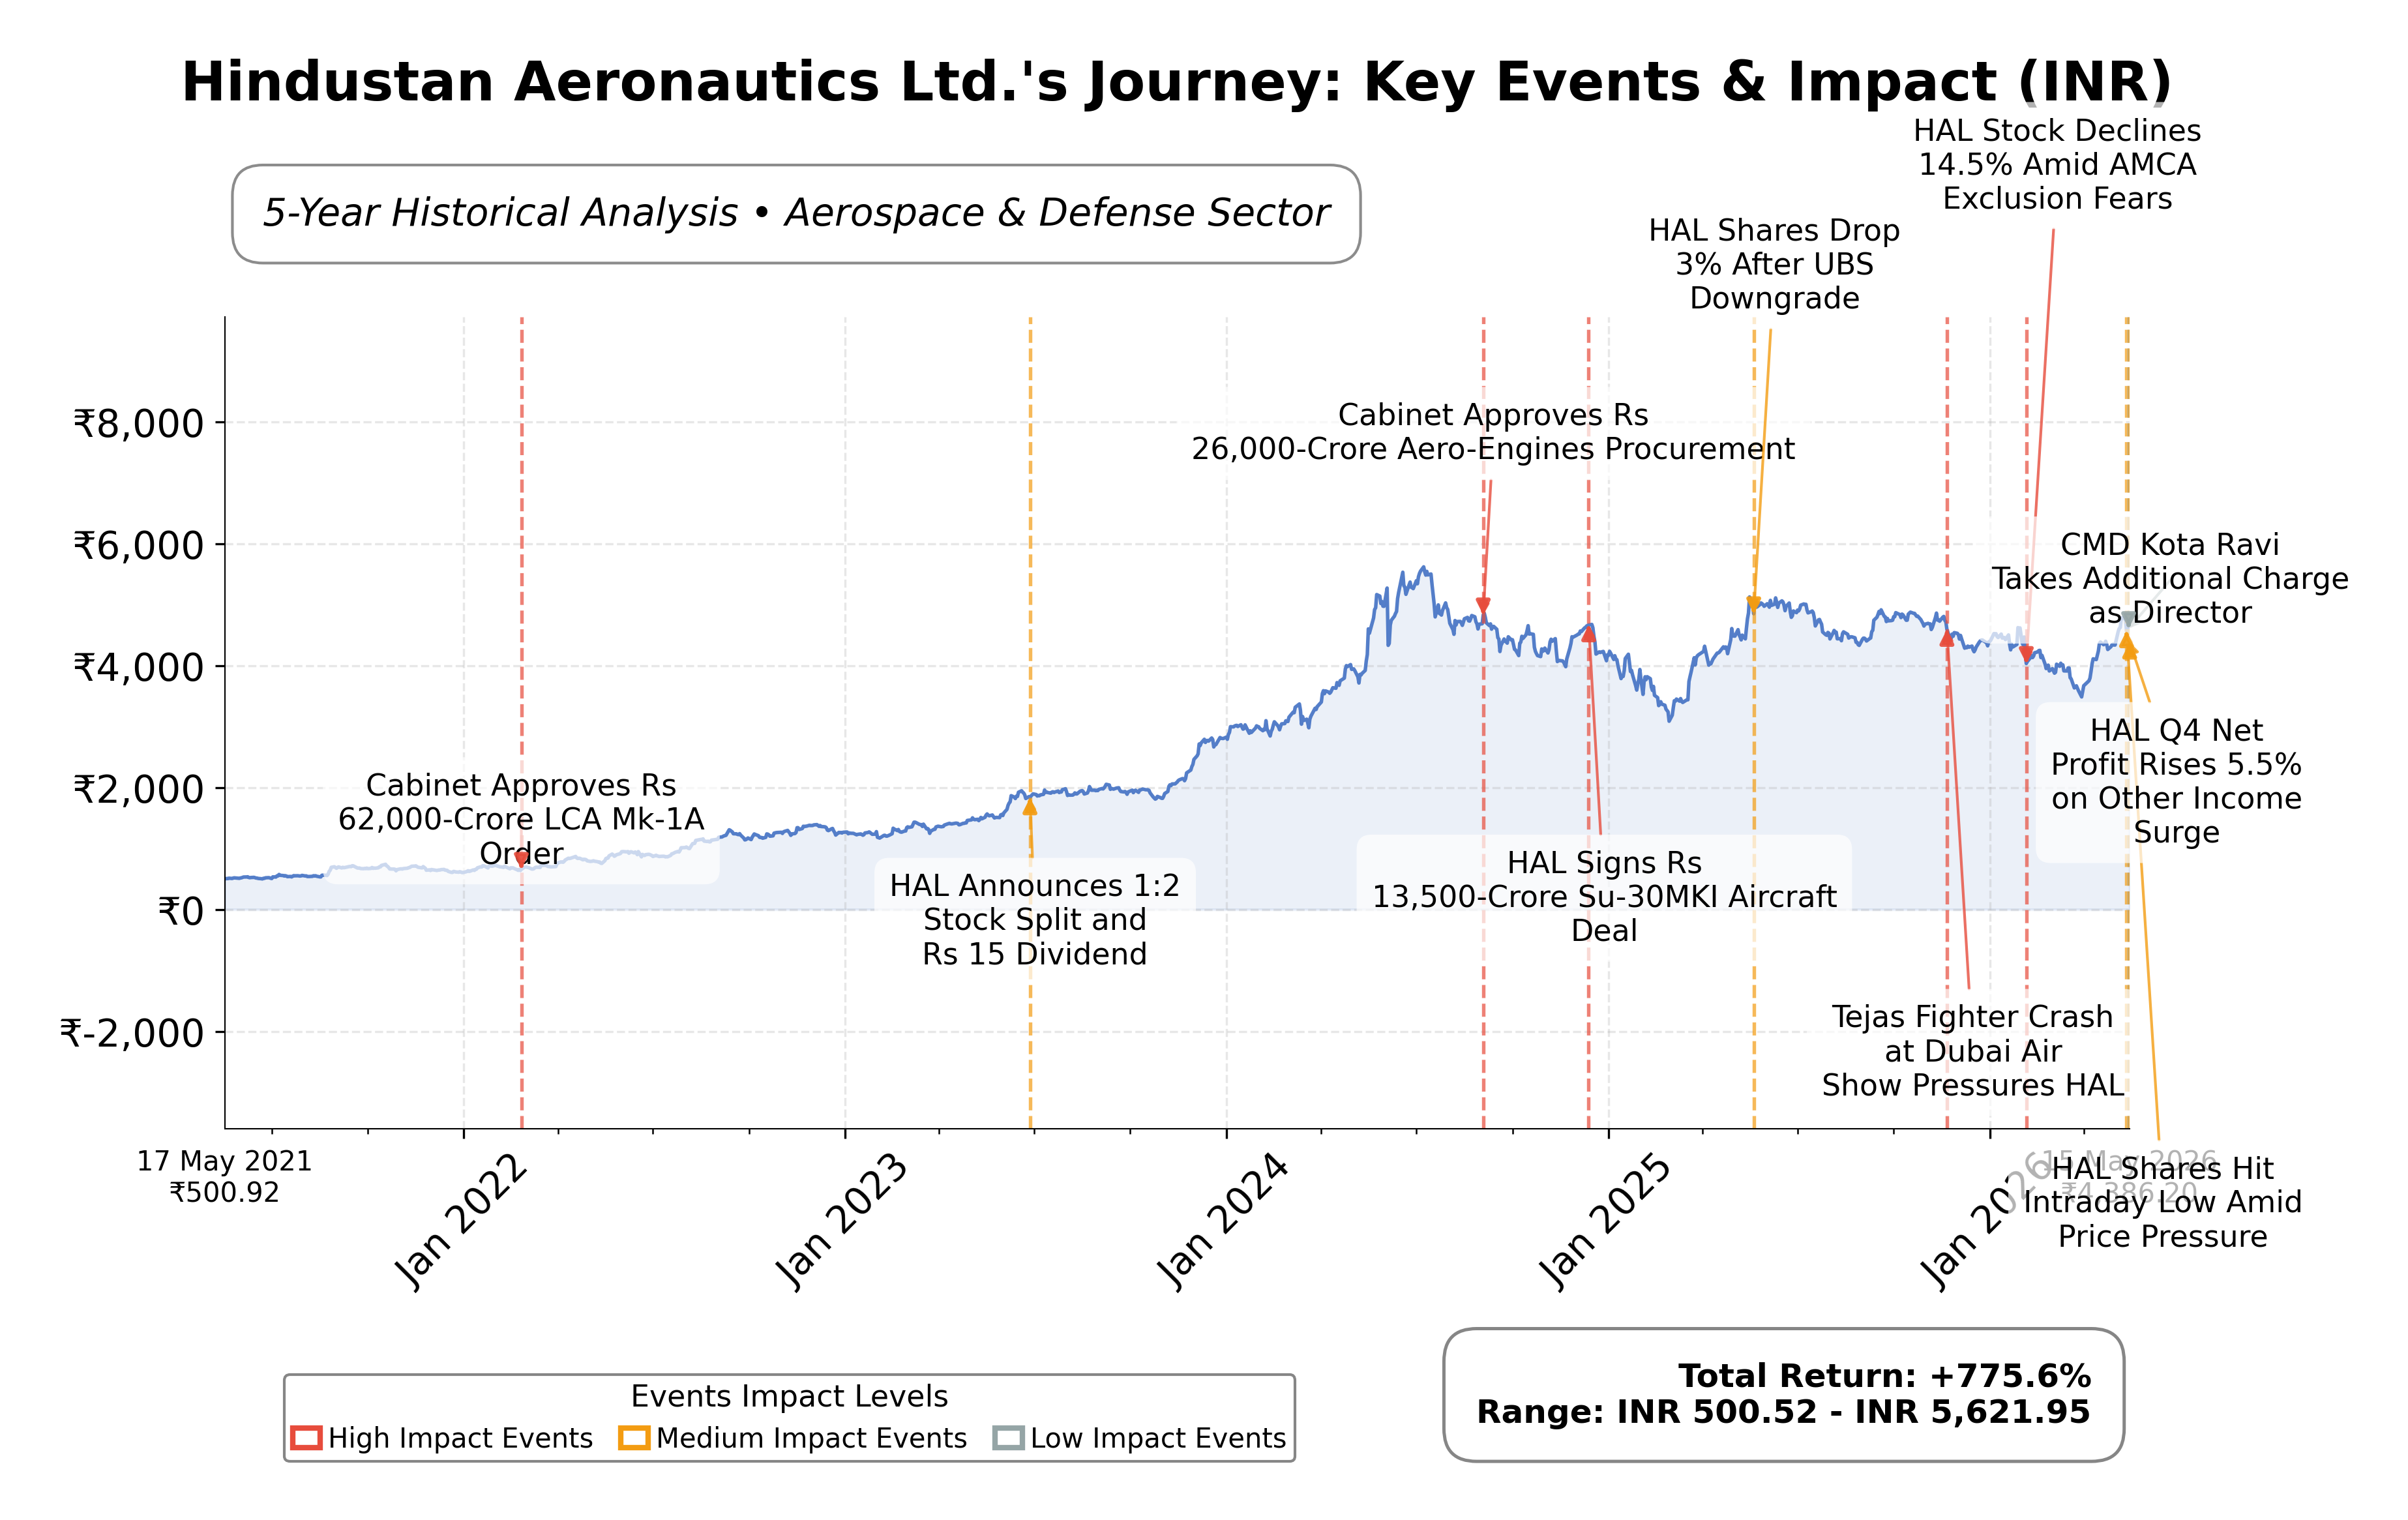
Key Positives and Key Risks
Pros
- Strong profitability with a net profit margin of 27.08% and return on equity of 23.91%, indicating efficient capital utilization.
- Robust cash position of ₹444.7 billion and low debt-to-equity ratio of 0.031, reflecting financial strength and liquidity.
- Attractive valuation relative to peers with a trailing P/E of 35.74 and forward P/E of 32.48, below many industry competitors.
Cons
- EBITDA margin contracted by 235 basis points in Q4 FY26, signaling operational challenges and margin pressure.
- High price-to-book ratio of 8.56 suggests the stock trades at a significant premium to book value.
- Dependence on government defense contracts exposes the company to regulatory and procurement risks.
Disclosure: This information is for general awareness and does not constitute investment advice
Report Summary
Hindustan Aeronautics Ltd. (HAL) is a prominent aerospace and defense company headquartered in India, listed on the NSE under the symbol HAL. Established in 1940, HAL specializes in the design, manufacture, and assembly of aircraft, helicopters, avionics, and related equipment primarily for the Indian defense sector. The company operates within the Industrials sector, focusing on aerospace and defense, and plays a critical role in supporting India’s military self-reliance and indigenization initiatives. It also engages in civilian aircraft production and provides overhaul and repair services, positioning itself as a key player in the Indian aerospace industry.
Financially, HAL reported a trailing twelve months (TTM) revenue of approximately ₹3.28 trillion with a gross margin of 30.78%, operating margin of 15.11%, and a net profit margin of 27.08%, indicating strong profitability. The company’s return on equity (ROE) stands at 23.91%, and return on assets (ROA) at 7.87%, reflecting efficient use of equity and assets to generate earnings. Its operating cash flow for the TTM is ₹91.47 billion, with a levered free cash flow of ₹83.64 billion, underscoring robust cash generation capabilities. The debt-to-equity ratio is very low at 0.031, highlighting a conservative capital structure.
HAL’s valuation metrics show a trailing P/E ratio of 35.74 and a forward P/E of 32.48, with a price-to-book ratio of 8.56 and an enterprise value to EBITDA ratio of 33.50. The market capitalization is approximately ₹3.20 trillion. The stock price currently trades at ₹4,377, within a 52-week range of ₹3,479 to ₹5,165, indicating it is closer to the mid-to-upper range of its recent trading band. The PEG ratio of 1.21 suggests valuation is somewhat aligned with expected earnings growth.
The company’s strengths include a strong order book of ₹2.54 lakh crore, solid cash reserves of ₹444.7 billion, and a low debt burden, alongside strategic partnerships such as the joint venture with Rolls-Royce to expand aerospace manufacturing in India. Risks include potential margin pressure as evidenced by a 235 basis point decline in EBITDA margin in Q4 FY26, competitive pressures, and regulatory factors inherent in defense procurement. Recent leadership and strategic expansions reinforce HAL’s commitment to innovation and capacity enhancement.
Technically, HAL’s stock is trading above its 50-day moving average (₹4,040) but below its 200-day moving average (₹4,397), with momentum indicators showing mixed signals. Recent news highlights a 5.7% rise in Q4 net profit and a 2% revenue growth, though the stock faced intraday price pressure. Overall, the data suggests a balanced outlook with factors supporting accumulation tempered by valuation and margin considerations, warranting a measured approach.
Company and Industry Overview
Company Basics
Price Performance
Company Size
Shareholding Pattern
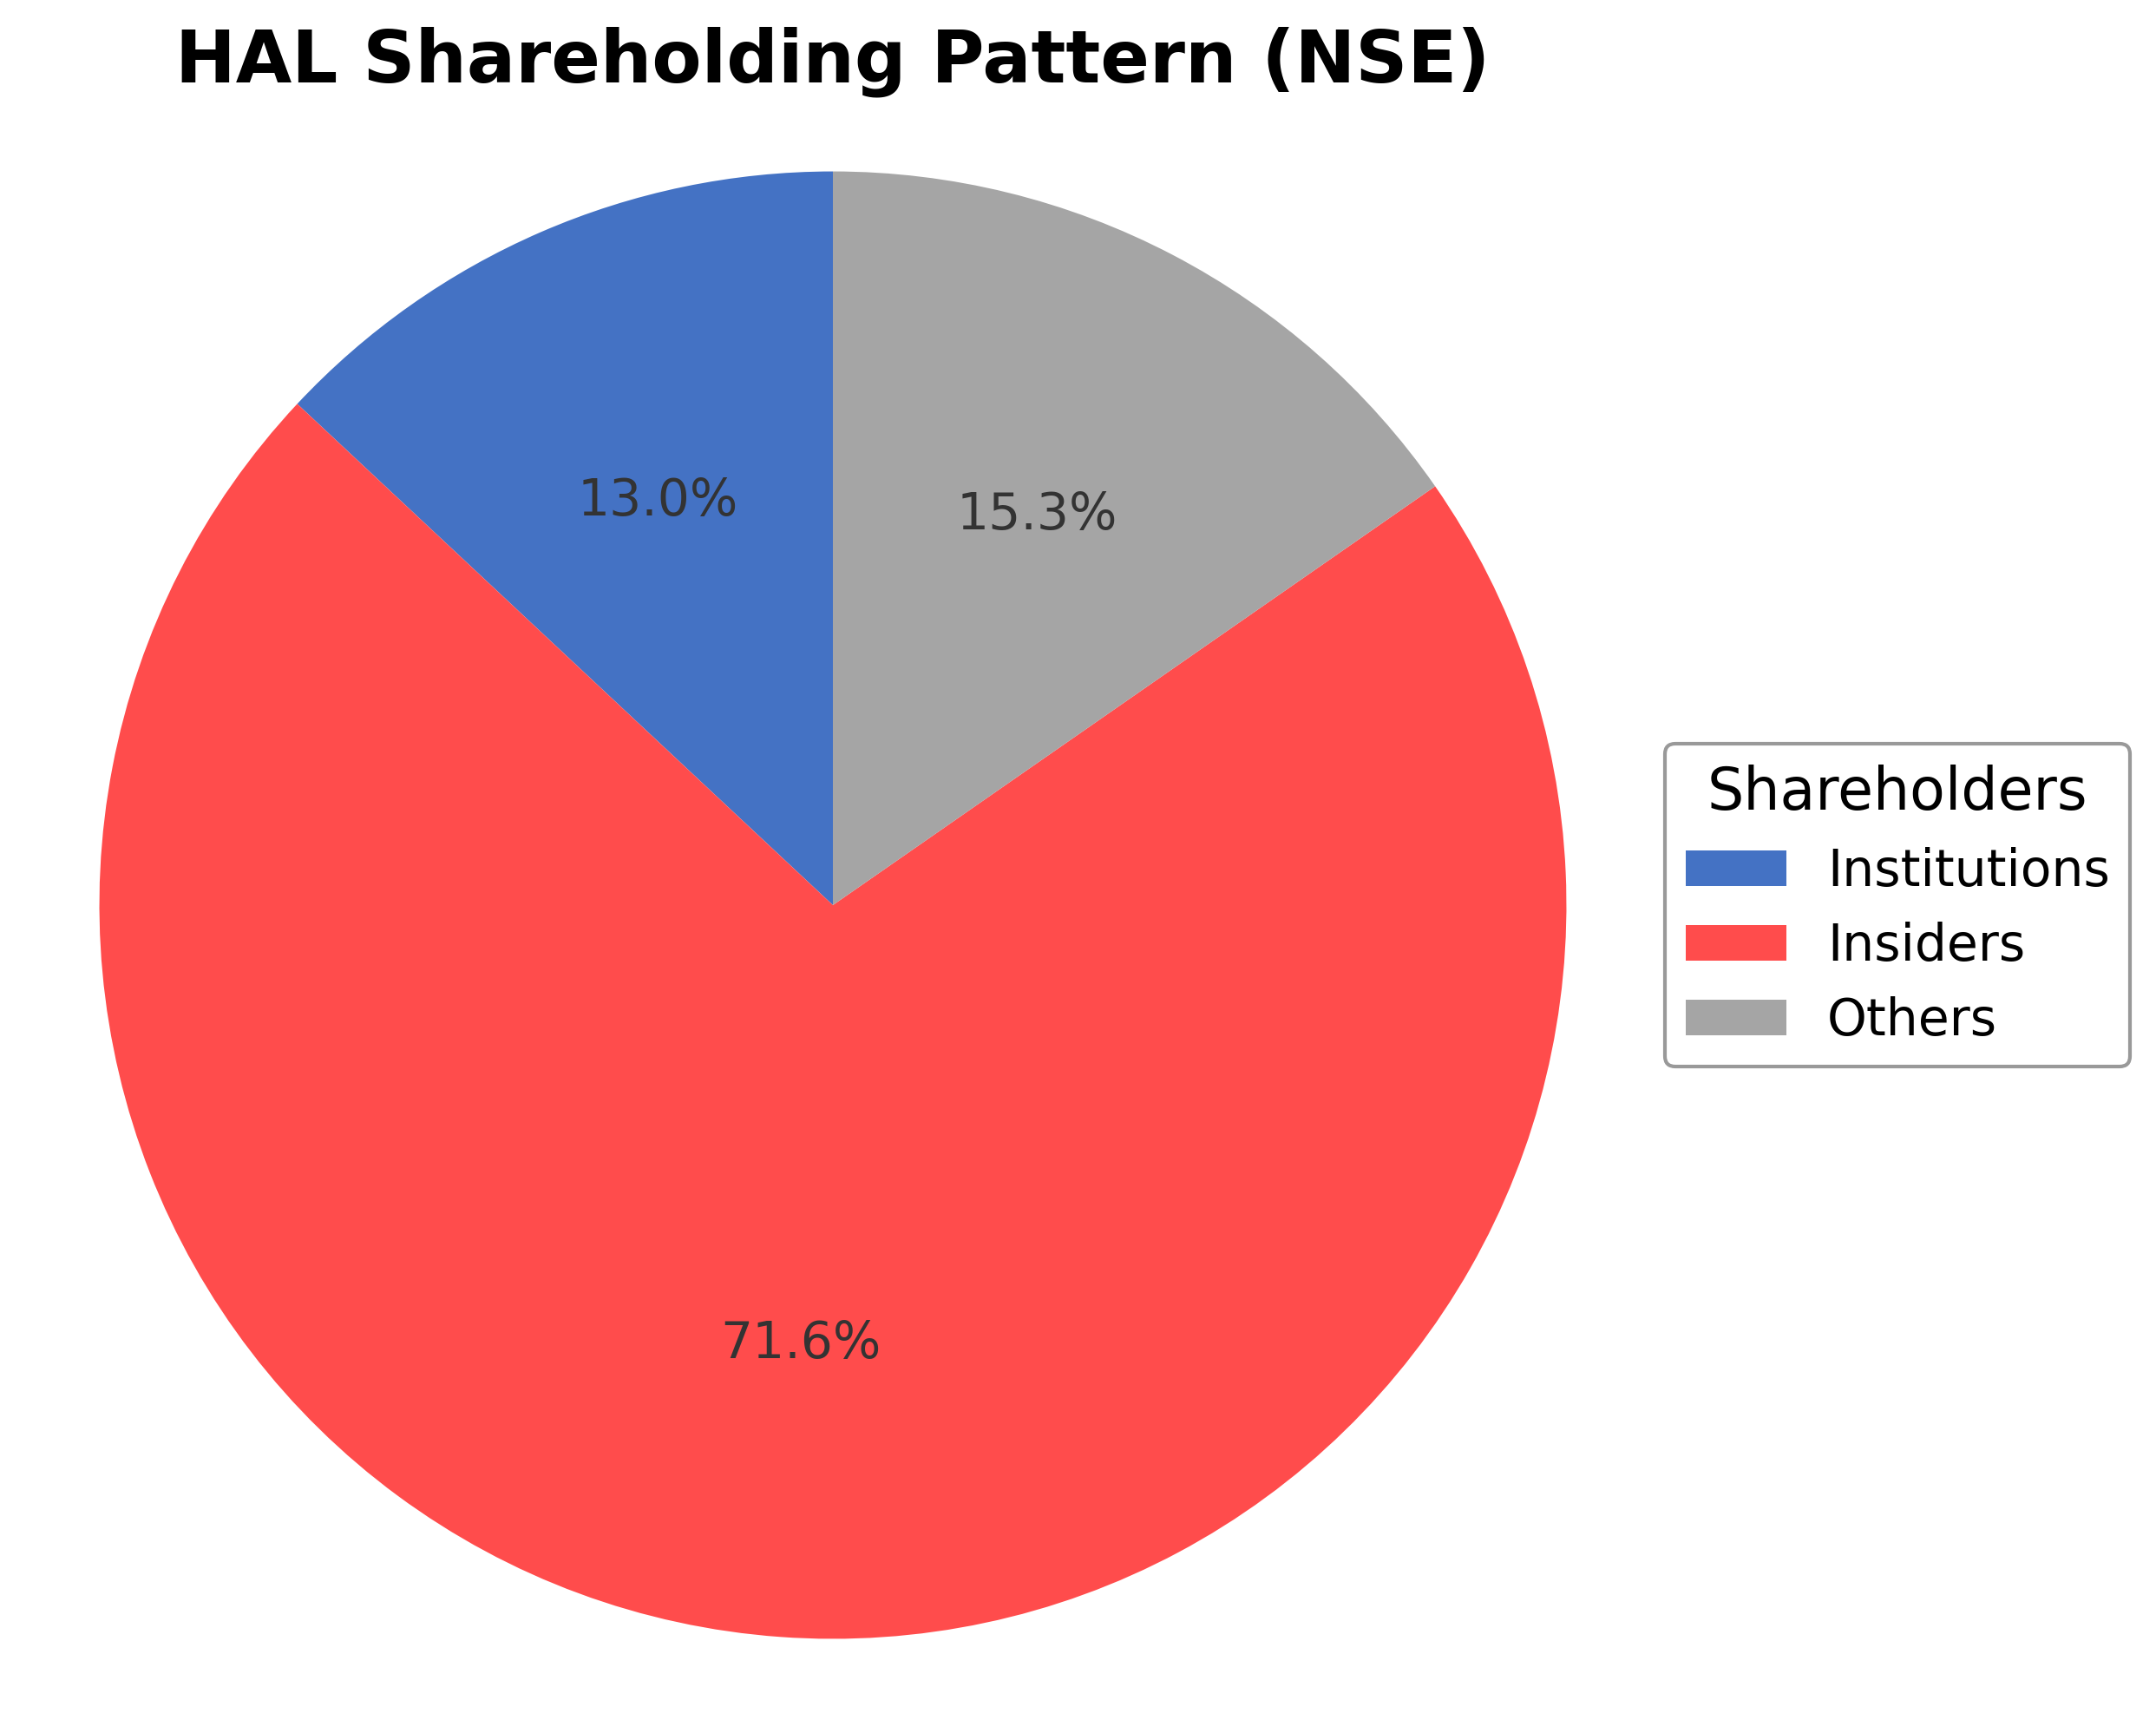
Hindustan Aeronautics Ltd. exhibits a dominant insider ownership structure with promoters holding 71.64% of shares, reflecting strong government control and strategic alignment. Institutional investors hold 13.03%, indicating moderate institutional interest, while public and other shareholders constitute approximately 15.33%. Over the past 12-24 months, insider ownership has remained stable, while institutional holdings have shown modest accumulation, suggesting confidence in the company’s long-term prospects. Major institutional investors include mutual funds and pension funds with a focus on defense and industrial sectors. This ownership pattern underscores a governance framework influenced by government oversight and institutional scrutiny, which may impact strategic decisions and reinforce the company’s role in national defense initiatives.
Sector and Industry Analysis
The Aerospace and Defence (A&D) sector is a large and diverse industry encompassing military aircraft, commercial aviation, space systems, and ground defense. The global market was valued at $884 billion in 2023 and is projected to grow to around $1.23 trillion by 2028, driven by rising defense budgets and recovery in civil aviation post-pandemic. Major players include established Original Equipment Manufacturers (OEMs) and national defense firms, with India emerging as a significant market due to its large armed forces and increasing procurement needs.
Industry trends highlight a resurgence in air travel boosting civil aerospace demand, alongside sustained defense spending amid geopolitical tensions. Supply chain resilience, cost efficiency, and workforce management remain critical challenges, prompting OEMs to adopt digital manufacturing and local sourcing strategies. Competitive dynamics favor companies with strong technological capabilities, diversified product portfolios, and government backing, creating high barriers to entry for new players.
Regulatory frameworks heavily influence the sector, with governments prioritizing defense modernization and self-reliance. In India, revised Maintenance, Repair, and Overhaul (MRO) policies aim to develop domestic capabilities and position the country as a regional MRO hub. These regulations support increased local production and exports, while defense procurement policies focus on advanced platforms and indigenous development, shaping the sector’s growth trajectory and competitive landscape.
Note: Analysis synthesized from industry research, market reports, and regulatory filings. Information is subject to change based on market conditions.
Financial Ratios Dashboard
Illustrative Scenario Analysis
DCF Assumptions:
Method: Two-Stage EPS-Priority Model
Financials
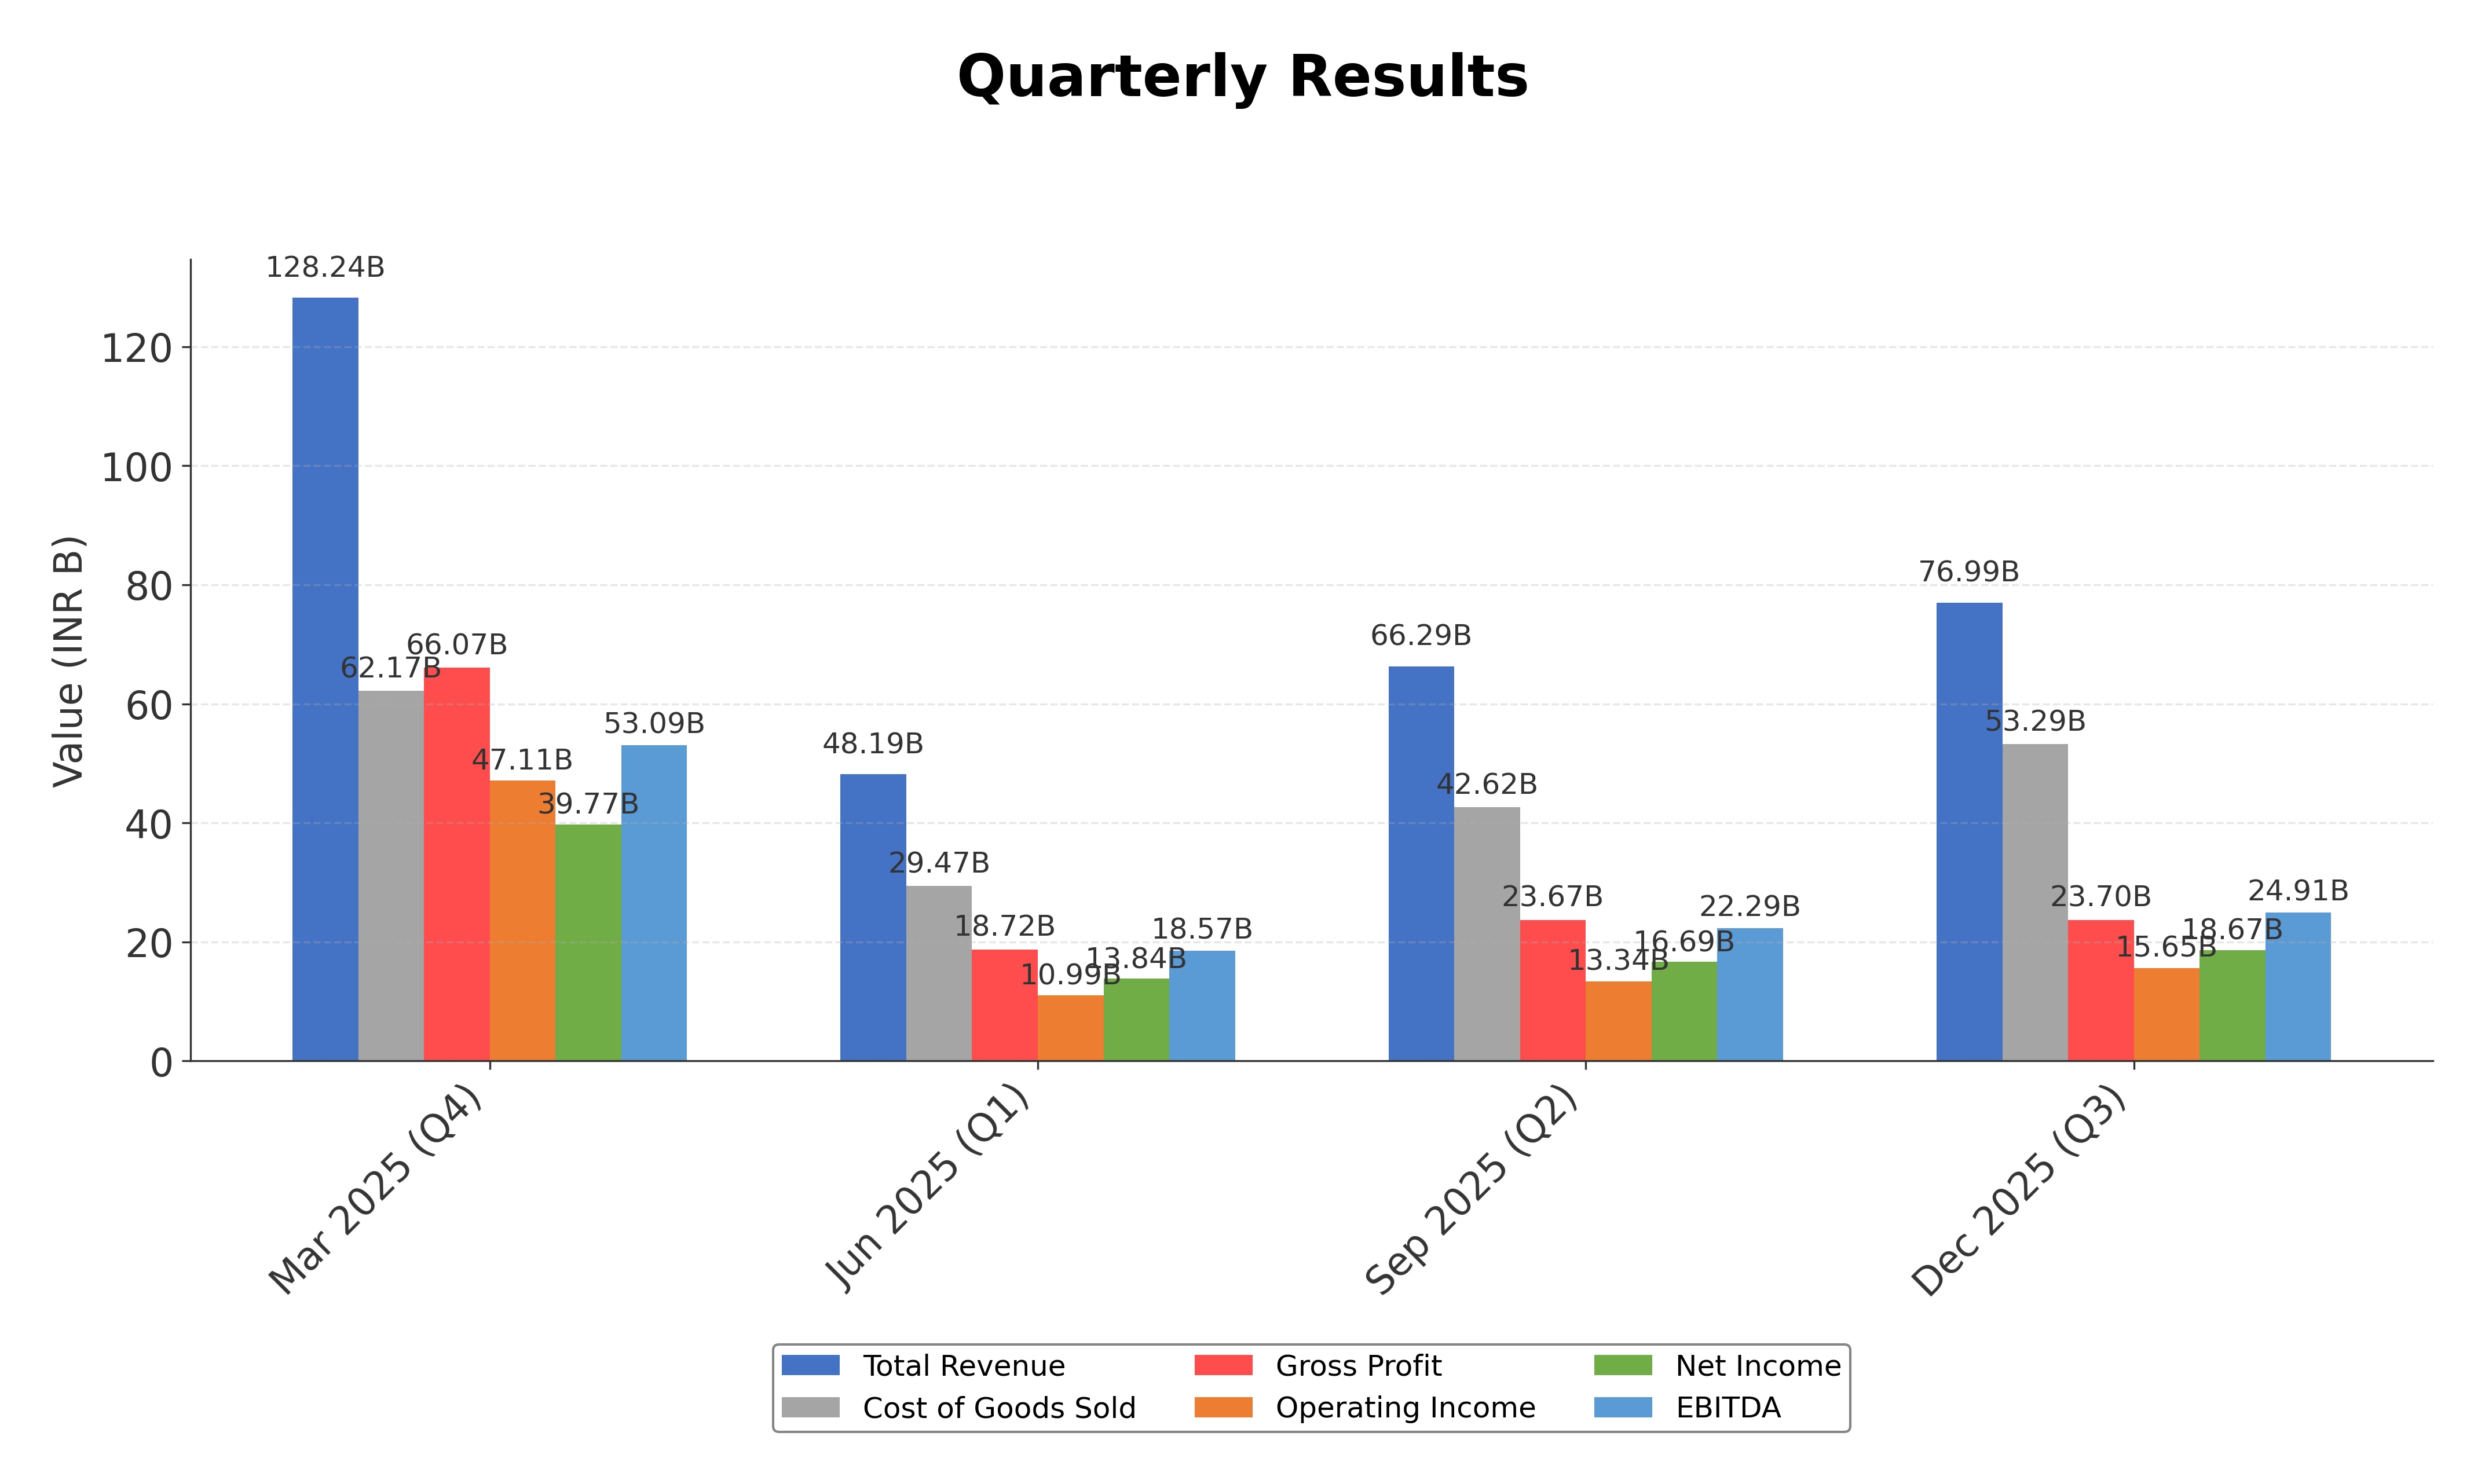
Peer Analysis
| Company Name | Market Cap | P/E Ratio | P/B Ratio | EV/EBITDA | Price to CFO |
|---|---|---|---|---|---|
| Hindustan Aeronautics Ltd. | ₹3.20T | 35.74 | 8.56 | 33.50 | 35.01 |
| Bharat Dynamics Ltd. | ₹531.00B | 91.45 | 12.59 | 105.88 | -95.73 |
| Bharat Electronics Limited | ₹3.21T | 53.82 | 14.92 | 40.04 | 147.92 |
| Data Patterns (India) Ltd. | ₹229.72B | 92.84 | 14.93 | 73.27 | -518.10 |
| Cochin Shipyard Limited | ₹467.42B | 64.42 | 8.20 | 49.33 | -52.90 |
| Garden Reach Shipbuilders & Engineers Ltd. | ₹349.53B | 50.84 | 13.31 | 39.73 | -120.64 |
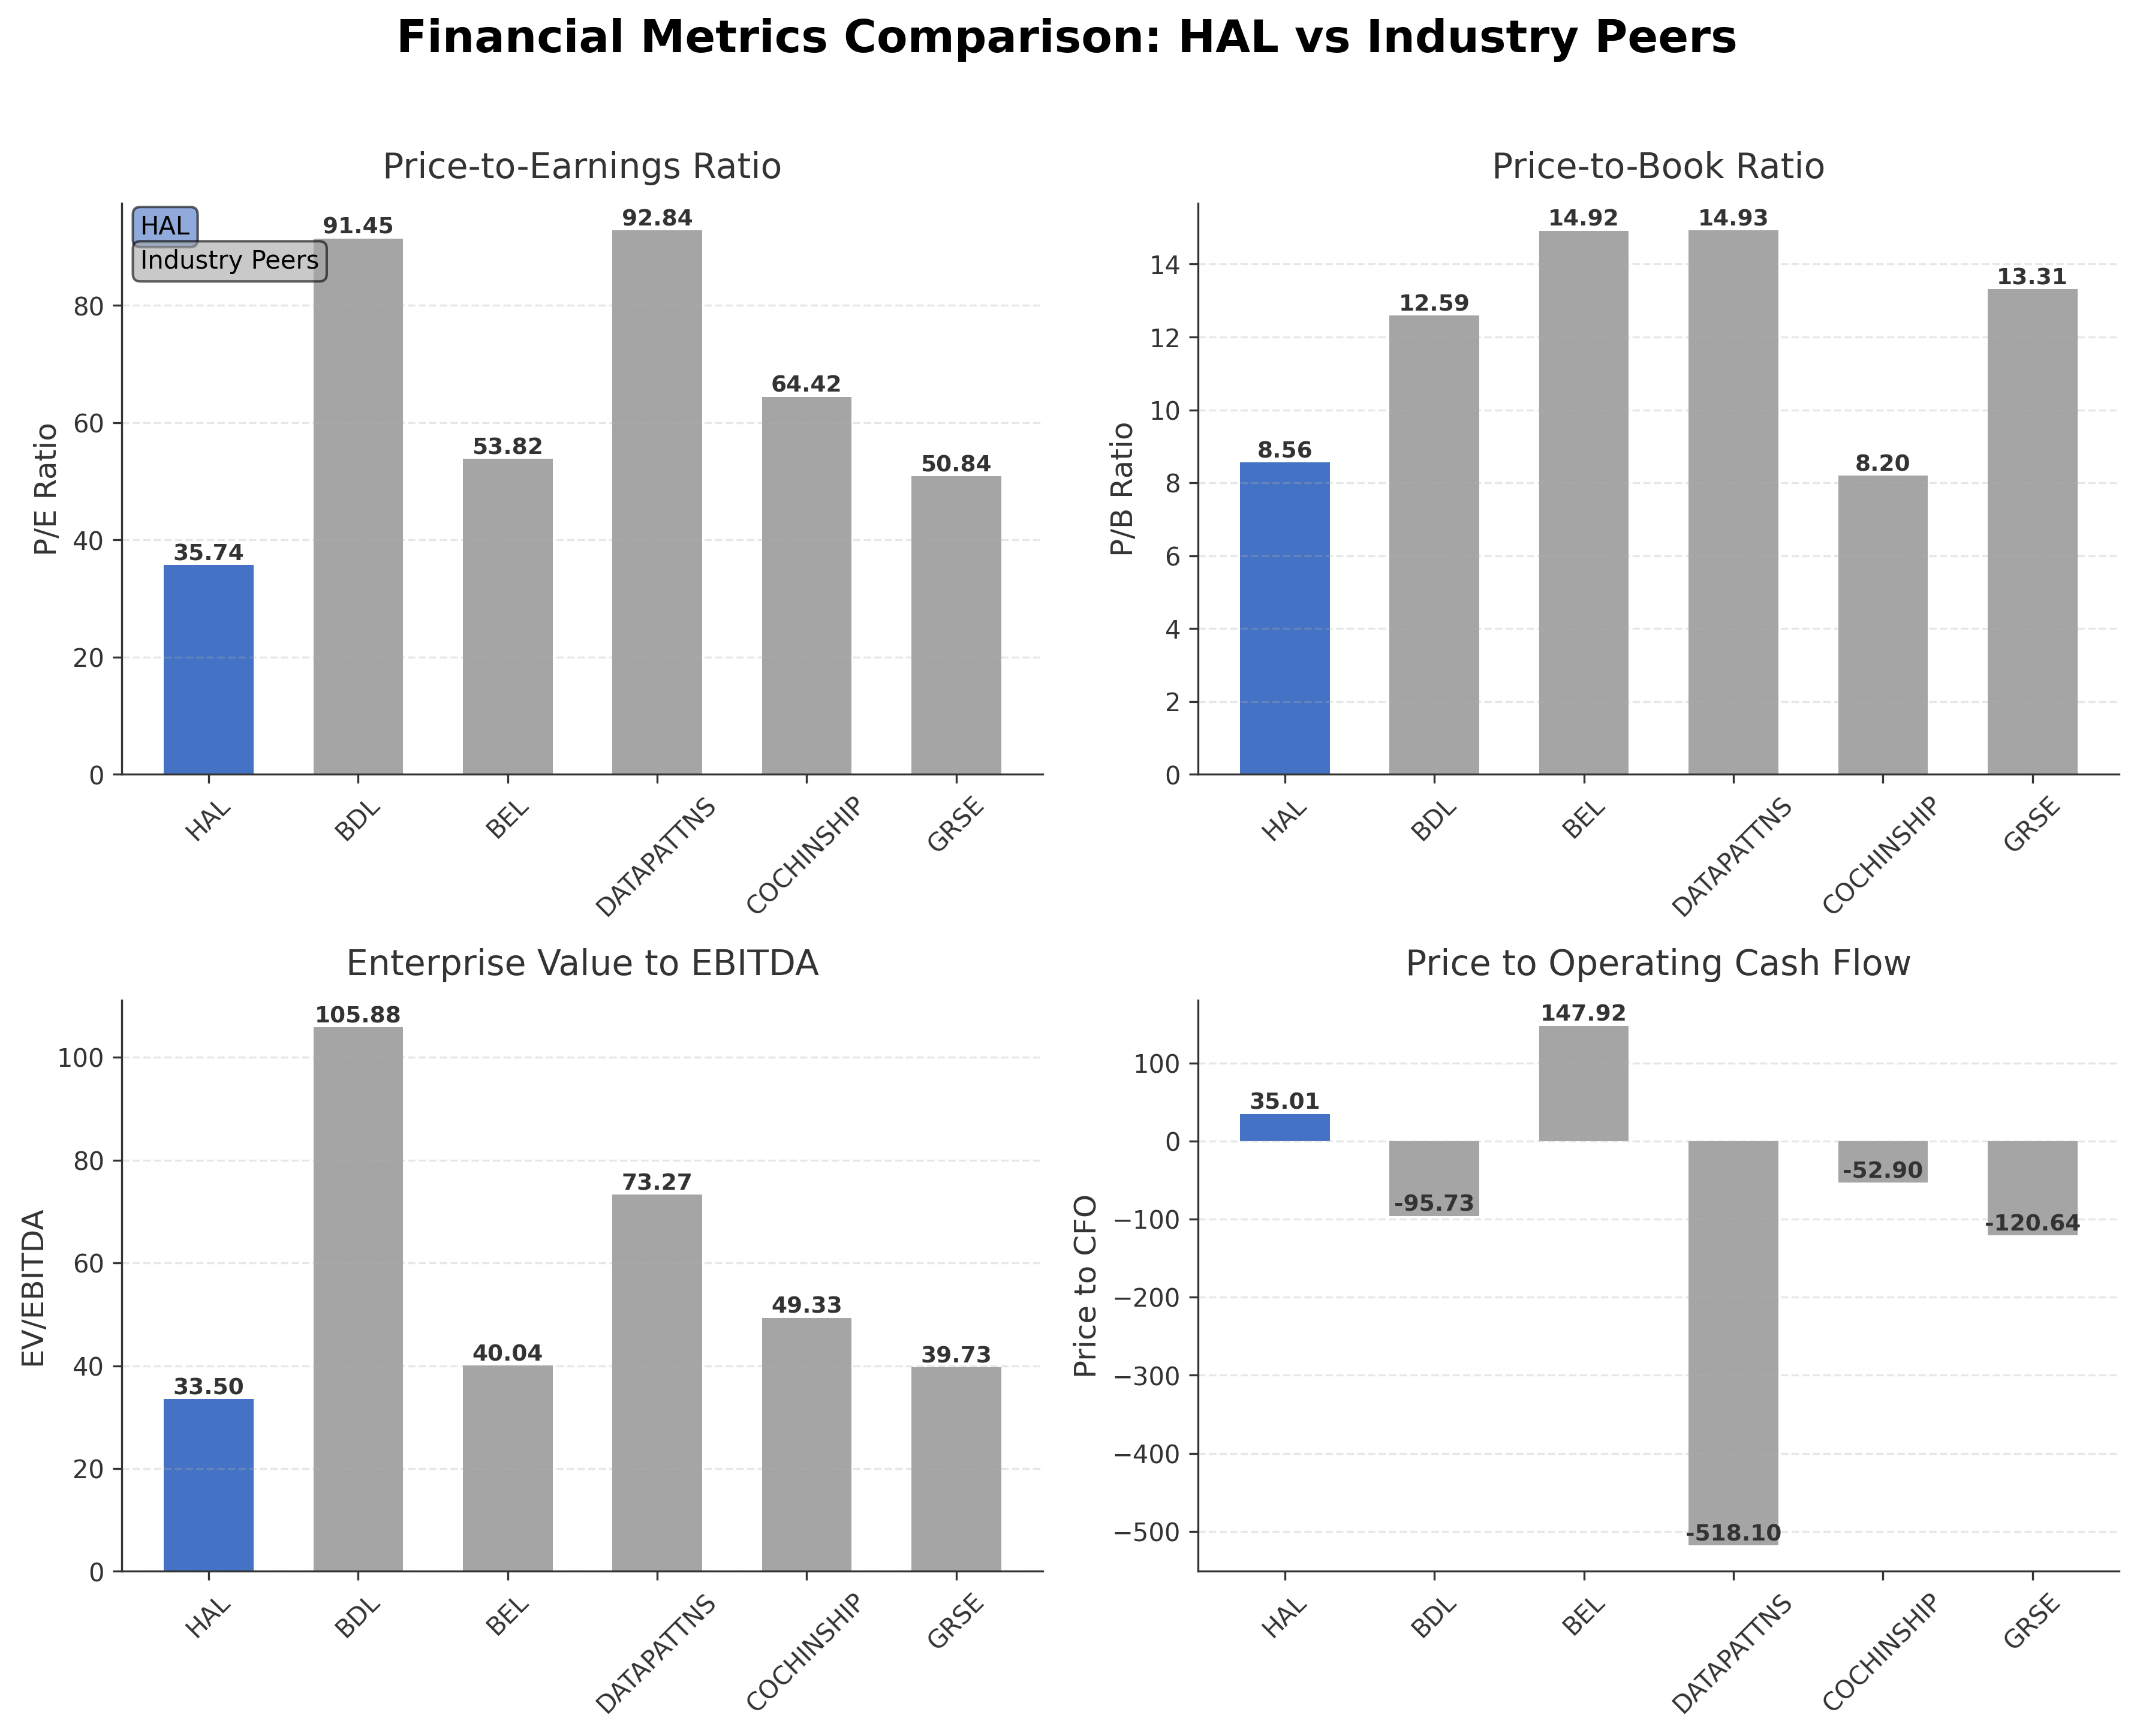
Comparison Analysis: Hindustan Aeronautics Ltd. (HAL) stands out among its Indian aerospace and defense peers with a market capitalization of ₹3.20 trillion, comparable to Bharat Electronics Limited (₹3.21 trillion). HAL’s P/E ratio of 35.74 is significantly lower than most peers, which range from approximately 50 to over 90, indicating relatively more attractive valuation levels. Its price-to-book ratio of 8.56 is also lower than several peers, suggesting a more moderate premium over book value. HAL’s EV/EBITDA ratio of 33.50 is below the elevated multiples seen in peers, reflecting comparatively better earnings relative to enterprise value. Return on equity at 24% is competitive, demonstrating strong profitability. However, HAL’s price to CFO ratio is high but positive, contrasting with negative cash flow multiples among some peers, indicating healthier operating cash flow generation.
Financial Metrics Comparison with Peers
Financial Statements
Comprehensive financial data including income, balance sheet, and cash flow metrics
Income Statement
| fiscal_date | 2025-03-31 | 2024-03-31 | 2023-03-31 | 2022-03-31 | 2021-03-31 |
|---|---|---|---|---|---|
| Sales | 301.05B | 281.62B | 263.61B | 243.61B | 225.01B |
| Cost Of Goods | 174.56B | 162.18B | 154.44B | 94.90B | 105.17B |
| Gross Profit | 126.49B | 119.43B | 109.16B | 148.71B | 119.84B |
| Operating Expense Selling General And Administrative | 1.23B | 902.30M | 994.00M | 718.00M | 858.00M |
| Operating Expense Other Operating Expenses | 32.11B | 26.02B | 44.38B | 45.89B | 21.24B |
| Operating Income | 84.35B | 84.05B | 57.09B | 45.32B | 43.44B |
| Non Operating Interest Income | 22.87B | 16.34B | 14.99B | 6.88B | 1.37B |
| Non Operating Interest Expense | 86.80M | 321.10M | 579.70M | 582.00M | 2.59B |
| Pretax Income | 108.67B | 102.25B | 65.09B | 52.25B | 42.83B |
| Income Tax | 25.03B | 26.04B | 6.82B | 1.45B | 10.38B |
| Net Income | 83.64B | 76.21B | 58.28B | 50.80B | 32.46B |
| Eps Basic | 125.07 | 113.95 | 87.14 | 75.96 | 48.53 |
| Eps Diluted | 125.07 | 113.95 | 87.14 | 75.96 | 48.53 |
| Basic Shares Outstanding | 668.77M | 668.77M | 668.77M | 668.77M | 668.77M |
| Diluted Shares Outstanding | 668.77M | 668.77M | 668.77M | 668.77M | 668.77M |
| Ebit | 108.76B | 102.57B | 65.67B | 52.83B | 45.43B |
| Ebitda | 123.29B | 117.03B | 96.00B | 67.74B | 58.14B |
| Net Income Continuous Operations | 83.64B | 76.21B | 58.28B | 50.80B | 32.46B |
| Minority Interests | 800.00K | 1.00M | 100.00K | 1.60M | 4.00M |
| Preferred Stock Dividends | 0.00 | 0.00 | 0.00 | 0.00 | 0.00 |
Source: Financial statements and regulatory filings
Balance Sheet
| fiscal_date | 2025-03-31 | 2024-03-31 | 2023-03-31 | 2022-03-31 | 2021-03-31 |
|---|---|---|---|---|---|
| Cash And Cash Equivalents | 45.49B | 42.55B | 44.41B | 30.70B | 71.46B |
| Accounts Receivable | 46.48B | 46.17B | 47.19B | 46.42B | 56.68B |
| Total Assets | 1062.67B | 780.95B | 672.04B | 583.92B | 517.64B |
| Total Liabilities | 712.82B | 489.53B | 436.28B | 390.75B | 363.36B |
| Long Term Debt | 11.40M | 10.80M | 25.10M | 24.10M | 23.10M |
| Shareholders Equity | 349.85B | 291.42B | 235.76B | 193.17B | 154.28B |
Source: Financial statements and regulatory filings
Cash Flow Statement
| fiscal_date | 2025-03-31 | 2024-03-31 | 2023-03-31 | 2022-03-31 | 2021-03-31 |
|---|---|---|---|---|---|
| Operating Activities Net Income | 83.64B | 76.21B | 58.28B | 50.80B | 32.46B |
| Operating Activities Other Non Cash Items | -22.80B | -16.00B | -14.76B | -6.29B | 1.16B |
| Operating Activities Accounts Receivable | -67.97B | -38.36B | -33.74B | 6.11B | 48.91B |
| Operating Activities Other Assets Liabilities | 98.60B | 4.33B | 16.24B | 6.76B | 61.93B |
| Operating Activities Operating Cash Flow | 91.47B | 26.18B | 26.01B | 57.39B | 144.46B |
| Investing Activities Capital Expenditures | -9.27B | -9.08B | -7.77B | -7.96B | -6.53B |
| Investing Activities Net Intangibles | -8.27B | -8.39B | -9.99B | -7.01B | -5.54B |
| Investing Activities Net Acquisitions | -128.90M | -105.00M | 0.00 | -100.00M | 0.00 |
| Investing Activities Purchase Of Investments | -115.64B | -64.01B | -46.93B | -114.81B | -666.60M |
| Investing Activities Other Investing Activity | -4.10M | N/A | N/A | N/A | 100.00M |
| Investing Activities Investing Cash Flow | -125.04B | -73.20B | -54.71B | -122.87B | -7.04B |
| Financing Activities Common Dividends | -25.41B | -19.73B | -16.72B | -13.38B | -10.03B |
| Financing Activities Financing Cash Flow | -25.41B | -19.73B | -16.72B | -13.56B | -127.23B |
| End Cash Position | 45.49B | 42.55B | 44.41B | 30.70B | 71.46B |
| Free Cash Flow | 118.87B | 64.68B | 70.48B | 86.73B | 139.08B |
| Financing Activities Long Term Debt Payments | N/A | 0.00 | 0.00 | -90.70M | -58.60B |
| Financing Activities Short Term Debt Issuance | N/A | 0.00 | 0.00 | -90.70M | -58.60B |
| Investing Activities Sale Of Investments | N/A | N/A | N/A | N/A | 60.40M |
| Financing Activities Common Stock Repurchase | N/A | N/A | N/A | N/A | N/A |
Source: Financial statements and regulatory filings
Technical Analysis
Key Insights
- The current trend shows HAL trading above its 50-day moving average (₹4,040) but below the 200-day moving average (₹4,397), indicating mixed medium-term momentum.
- Key support levels are identified near ₹3,479 (52-week low) and ₹4,000, while resistance is observed around ₹5,165 (52-week high) and ₹4,700.
- The stock is positioned above the 10-day moving average but faces resistance near the 200-day moving average, suggesting consolidation within a range.
- Momentum indicators show the RSI near neutral levels, MACD indicates weakening bullish momentum, and Stochastic oscillators reflect short-term oversold conditions.
- Multi-timeframe analysis reveals daily charts with sideways movement, weekly charts showing consolidation, and monthly charts indicating a longer-term uptrend.
- Potential market scenarios include a range-bound movement between support and resistance with possible volatility spikes near earnings or sector news.
Trending News
Summary: Explore more price target data and ratings for Hindustan Aeronautics Limited on the Forecasts tab, and track all previous and future analyst recommendations for Hindustan Aeronautics Limited in the dedicated News Flow.Select reference data provided by FactSet.
Sentiment: positive
2. Headline: 6,413 Call Contracts Traded on Hindustan Aeronautics Ltd as Stock Dips 2.4% Amid Mixed Signals
Summary: On 15 May 2026, 6,413 call contracts on Hindustan Aeronautics Ltd changed hands at the Rs 4,700 strike price, while the stock closed at Rs 4,480, down 2.4% on the day. This divergence between heavy call activity and a declining cash price raises questions about the underlying directional conviction ...
Sentiment: negative
3. Headline: Hindustan Aeronautics Ltd Hits Intraday Low Amid Price Pressure
Summary: Hindustan Aeronautics Ltd (HAL) experienced a notable decline today, touching an intraday low of Rs 4,470.25, reflecting a 3.04% drop amid significant price pressure. The stock underperformed its sector and broader market indices despite a generally positive market environment.
Sentiment: negative
4. Headline: HAL Q4 FY26: Profit Rises YoY; Nomura Buys, Goldman Sachs Neutral
Summary: Will other major brokerages follow ... on the stock?fuzz it · How could India's increasing defence procurement budget and indigenization push under 'Make in India' offset the internal weaknesses cited by UBS in the medium term?fuzz it ... Hindustan Aeronautics Ltd Schedules ...
Sentiment: positive
5. Headline: Hindustan Aeronautics Limited Q4 profit rises 5.5% on surge in other income
Summary: Originally founded as Hindustan Aircraft Limited in 1940, the company was renamed Hindustan Aeronautics Limited in 1964 after merging with Aeronautics India Limited. ... News and alerts! By signing up, you agree to our privacy policy. Most ReadRelated News Stock markets Cryptocurrency Economy ...
Sentiment: positive
Recent Updates
News Summary
As of 14 May 2026. Hindustan Aeronautics Ltd. reported its Q4 FY26 financial results with a net profit increase of 5.7% to ₹4,184 crore and revenue growth of 1.8% year-on-year. EBITDA declined by 4.4%, with margins compressing by 235 basis points to 36.28%, reflecting some operational pressures. The company’s order book remains robust at ₹2.54 lakh crore, supporting future revenue visibility. Additionally, the joint venture with Rolls-Royce expanded its manufacturing footprint in Hosur, Tamil Nadu, enhancing aerospace production capabilities in India. These developments underscore HAL’s strategic focus on growth and capacity expansion amid a supportive defense procurement environment.
News Sentiment
The overall sentiment from recent updates is cautiously positive, driven by steady profit and revenue growth alongside strategic manufacturing expansions. The margin contraction introduces a note of caution, indicating some operational challenges. Positive analyst adjustments and institutional interest reflect confidence in HAL’s long-term prospects, while neutral tones around joint venture expansions suggest measured optimism. The balance of growth and margin pressures shapes a nuanced outlook grounded in tangible business developments.
Source List
- https://www.livemint.com/market/stock-market-news/hal-q4-results-2026-live-hindustan-aeronautics-q4-earnings-hal-share-price-psu-defence-stock-tejas-aircraft-14-may-2026-11778737291455.html
- https://economictimes.indiatimes.com/news/defence/rolls-royce-hal-joint-venture-doubles-down-on-india-manufacturing/articleshow/131068494.cms
Analytical Overview
Analysis Summary
Hindustan Aeronautics Ltd.’s valuation metrics, including a trailing P/E of 35.74 and forward P/E of 32.48, are below many industry peers, indicating relatively attractive pricing compared to the aerospace and defense sector average. The PEG ratio of 1.21 suggests reasonable valuation aligned with earnings growth expectations. The company’s revenue growth of 10.7% quarterly and positive cash flow trends, with operating cash flow of ₹91.47 billion and free cash flow of ₹83.64 billion, demonstrate a solid growth trajectory and strong cash generation. Financial health is robust, with a very low debt-to-equity ratio of 0.031 and a current ratio above 2, reflecting liquidity strength and conservative leverage. Sector-specific opportunities include India’s increasing defense budget and 'Make in India' initiatives, which favor HAL’s indigenous manufacturing capabilities, though challenges such as margin pressures and competitive dynamics remain.
Overall Business and Market Assessment
Supporting Factors: HAL’s strong order book of ₹2.54 lakh crore, robust profitability with a 27.08% net margin, and strategic partnerships like the Rolls-Royce joint venture enhancing manufacturing capacity
Risk Factors: EBITDA margin compression noted in Q4 FY26 and potential regulatory or competitive pressures in the defense sector
SWOT Analysis
Strengths
- Strong market position as a leading aerospace and defense manufacturer in India.
- Robust financial performance with a net profit margin of 27.08% and ROE of 23.91%.
- Low debt-to-equity ratio of 0.031 indicating conservative leverage and financial stability.
- Strategic partnerships, including a joint venture with Rolls-Royce, enhancing manufacturing capabilities.
Weaknesses
- EBITDA margin contraction by 235 basis points in Q4 FY26 indicating operational pressures.
- High price-to-book ratio of 8.56 suggesting premium valuation relative to book value.
- Dependence on government defense procurement exposes revenue to regulatory risks.
- Limited diversification outside the Indian defense sector.
Opportunities
- Growing Indian defense budget and 'Make in India' initiative supporting indigenous production.
- Expansion of manufacturing facilities through joint ventures to increase capacity and product range.
- Potential to increase exports as global demand for aerospace and defense products rises.
- Technological advancements and innovation in aerospace components and systems.
Threats
- Competitive pressures from domestic and international aerospace and defense companies.
- Regulatory changes or delays in defense procurement impacting order flow and revenues.
- Geopolitical tensions affecting defense budgets and international collaborations.
- Economic fluctuations potentially impacting government spending priorities.
Company Description
Hindustan Aeronautics Ltd. is a leading aerospace and defense company based in India. Established in 1940, the company plays a vital role in the design, manufacture, and assembly of aircraft, helicopters, avionics, and related equipment. As a government-owned corporation, its primary function is to support India's defense sector by providing indigenously developed aircraft and maintenance services. Hindustan Aeronautics Ltd. significantly impacts various industries, including defense, aerospace, and aviation, by contributing crucial technologies and services to India's armed forces. The company also engages in civilian aircraft production and offers aircraft overhaul and repair services. Given its strategic importance, Hindustan Aeronautics Ltd. is a key player in the Indian aerospace sector, facilitating the nation’s self-reliance in defense production and contributing to the broader aerospace market.