
Hindustan Aeronautics Ltd (HAL)
Stock Analysis Report
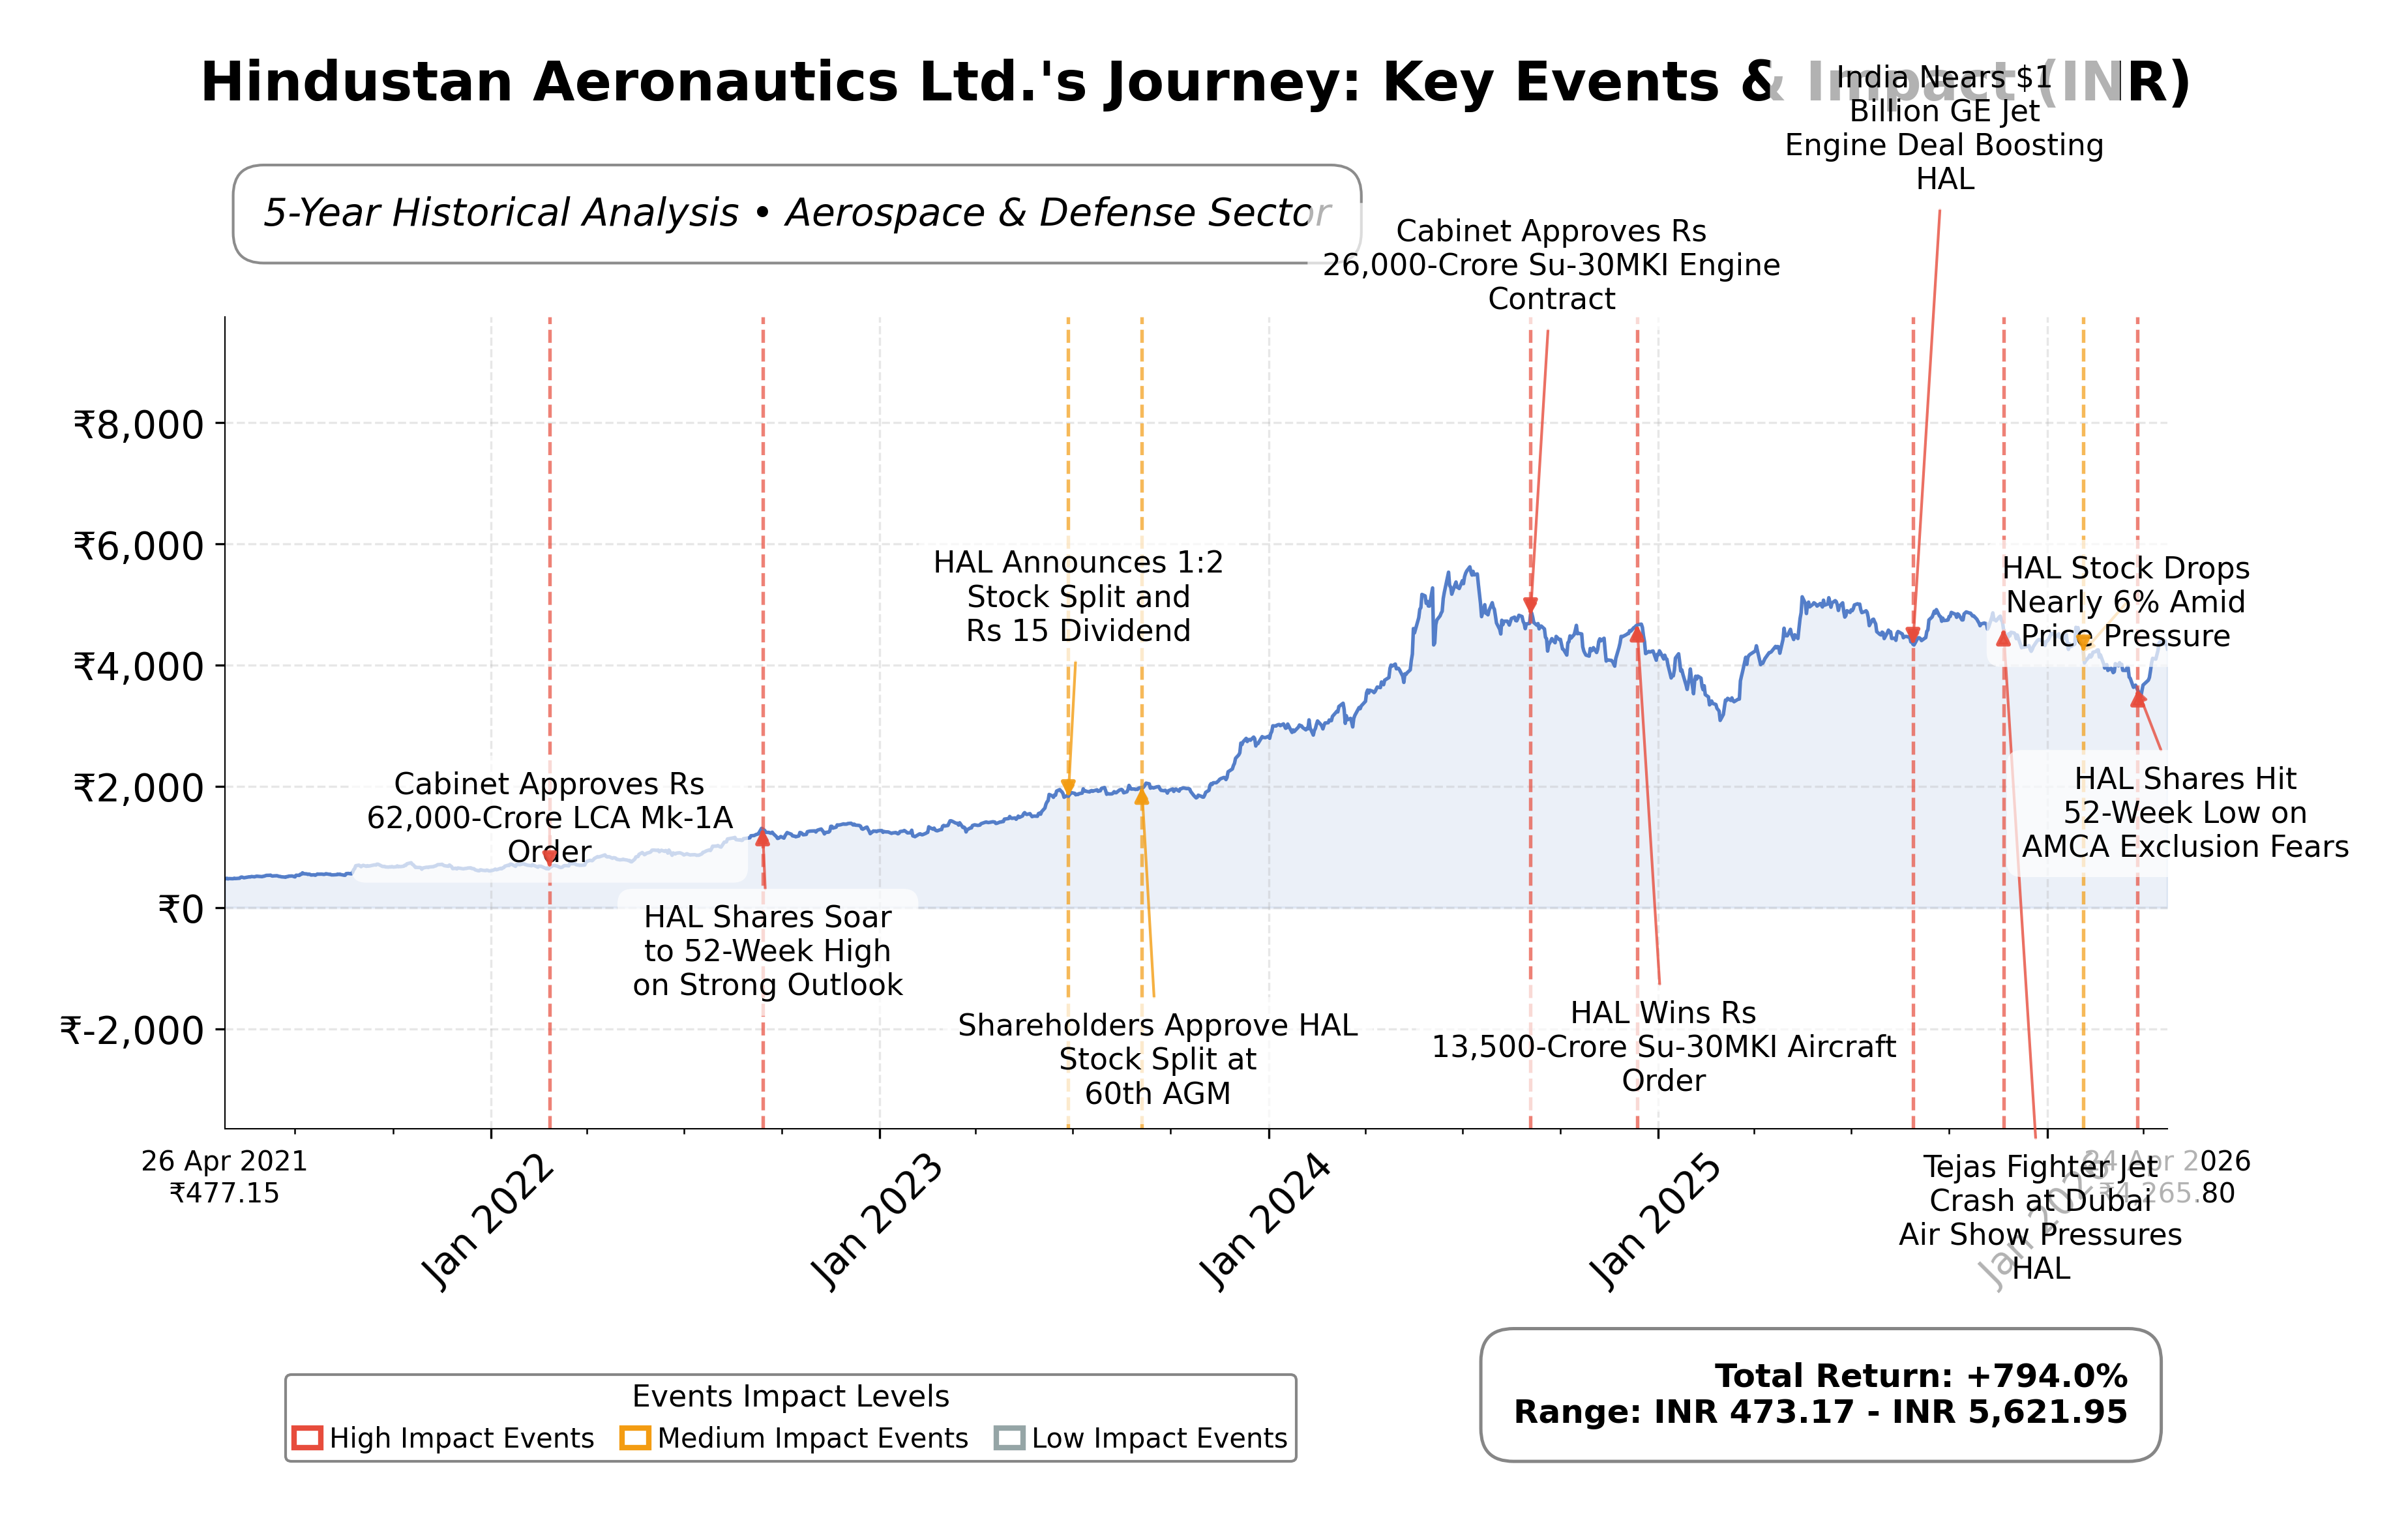
Stock Journey
Key Positives and Key Risks
Pros
- Hindustan Aeronautics Ltd. maintains a strong balance sheet with total cash of ₹444.7 billion and minimal debt of ₹114 million, supporting financial stability.
- The company exhibits solid profitability with a net profit margin of 27.08% and a return on equity of 23.91%, indicating efficient capital utilization.
- HAL’s order book stands at a record ₹2.54 trillion, reflecting strong demand and future revenue visibility.
Cons
- Execution delays and supply chain disruptions, particularly in engine deliveries from General Electric, have constrained revenue growth and operational performance.
- The stock trades at a relatively high valuation with a trailing P/E of 32.75 and EV/EBITDA of 30.00, which may limit upside potential.
- Recent stock performance has lagged the sector, with a price decline of approximately 11% in 2026 amid market and execution challenges.
Disclosure: This information is for general awareness and does not constitute investment advice
Report Summary
Hindustan Aeronautics Ltd. (HAL) is a prominent aerospace and defense company based in India, primarily engaged in the design, manufacture, and assembly of aircraft, helicopters, avionics, and related equipment. Listed on the NSE under the industrials sector, HAL plays a crucial role in supporting India's defense sector with indigenously developed products and maintenance services. The company also participates in civilian aircraft production and aircraft overhaul, positioning itself as a key player in India's aerospace and defense industry.
Financially, HAL reported trailing twelve months (TTM) revenue of approximately ₹328.46 billion with a gross margin of 30.78%, operating margin of 15.11%, and a strong net profit margin of 27.08%. The company’s return on equity (ROE) stands at 23.91%, indicating efficient utilization of shareholder capital, while return on assets (ROA) is 7.87%, reflecting solid asset productivity. Its operating cash flow over the TTM is ₹91.47 billion, with free cash flow at ₹83.64 billion, underscoring healthy cash generation capabilities.
From a valuation perspective, HAL’s trailing price-to-earnings (P/E) ratio is 32.75, slightly above the industry average of 32.75, with a forward P/E of 29.75 and a price-to-book (P/B) ratio of 7.84. The enterprise value to EBITDA ratio is elevated at 30.00, suggesting a premium valuation relative to earnings. The stock trades at ₹4,270 within a 52-week range of ₹3,479 to ₹5,165, currently closer to the lower end of this range, indicating some price consolidation.
HAL’s strengths include a robust balance sheet with total cash of ₹444.7 billion against minimal debt of ₹114 million, a high current ratio of 2.19, and a strong order book valued at ₹2.54 trillion. Key risks involve execution delays, notably in engine supplies from General Electric, which have impacted revenue growth and stock performance. Recent strategic developments include government plans to transform HAL’s Bengaluru campus into a mega aviation hub, reflecting long-term growth initiatives.
Technically, HAL’s price is below its 200-day moving average of ₹4,405 and 50-day average of ₹3,970, with momentum indicators showing mixed signals. The stock has experienced increased open interest in derivatives, suggesting heightened market activity despite recent underperformance. Overall, the data suggests a cautious stance with attention to execution risks and valuation premiums, warranting close monitoring of operational developments and market dynamics.
Company and Industry Overview
Company Basics
Price Performance
Company Size
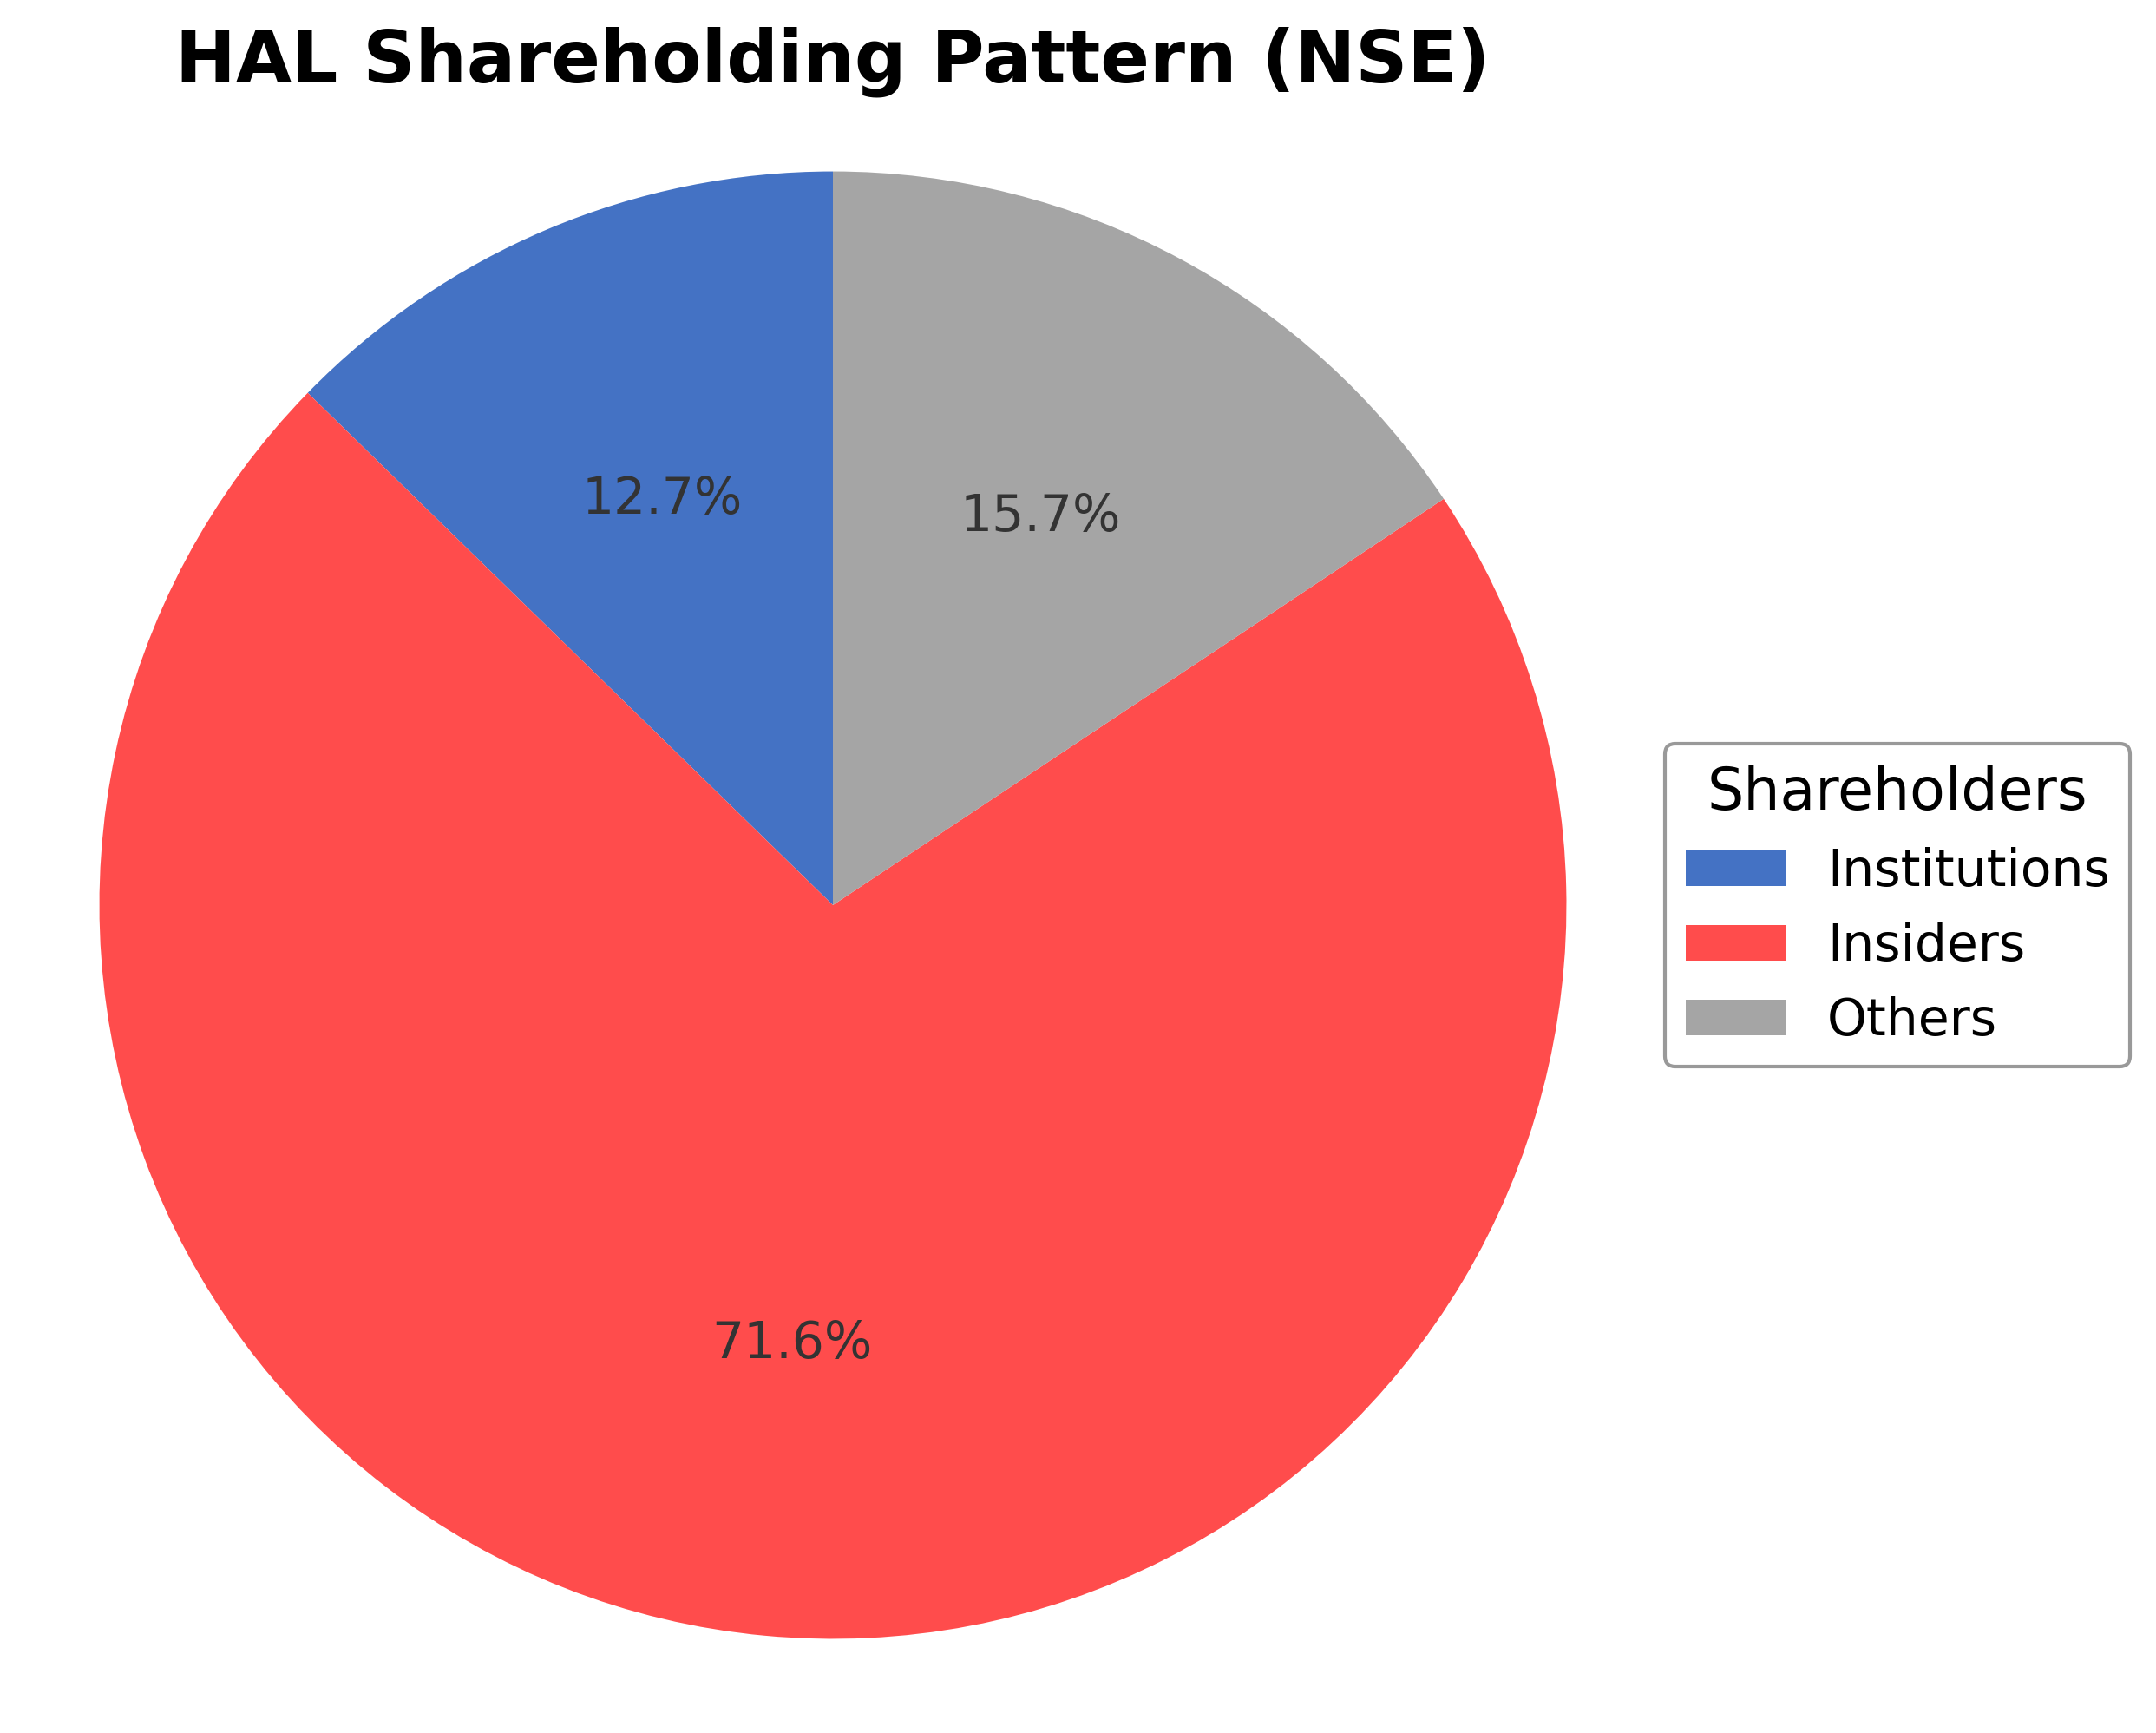
Shareholding Pattern
Sector and Industry Analysis
The aerospace and defense sector, encompassing companies like Hindustan Aeronautics Ltd. (HAL), is characterized by significant government spending and strategic importance, with a global market size reaching several hundred billion dollars. The sector is expected to grow steadily, driven by modernization programs, increased defense budgets, and rising demand for both military and civil aircraft. Key players include established national and international firms such as Boeing, Lockheed Martin, Airbus, and HAL, which dominate through extensive product portfolios and government contracts.
Industry trends highlight a shift toward advanced technologies including stealth, unmanned systems, and digital integration in aerospace manufacturing. Competitive dynamics are shaped by high entry barriers due to capital intensity, technological complexity, and stringent quality standards. Companies like HAL leverage long-standing government relationships and indigenous development capabilities to maintain competitive positioning, while partnerships and joint ventures are increasingly common to access new technologies and markets.
The regulatory landscape is heavily influenced by national security policies, export controls, and defense procurement regulations, which govern production, technology transfer, and international collaborations. In India, government initiatives to promote indigenous defense manufacturing under policies like "Make in India" impact HAL’s operations and growth prospects. Compliance with international arms control agreements and evolving defense standards also shapes the sector’s strategic direction and investment decisions.
Note: Analysis synthesized from industry research, market reports, and regulatory filings. Information is subject to change based on market conditions.
Financial Ratios Dashboard
Illustrative Scenario Analysis
DCF Assumptions:
Method: Two-Stage EPS-Priority Model
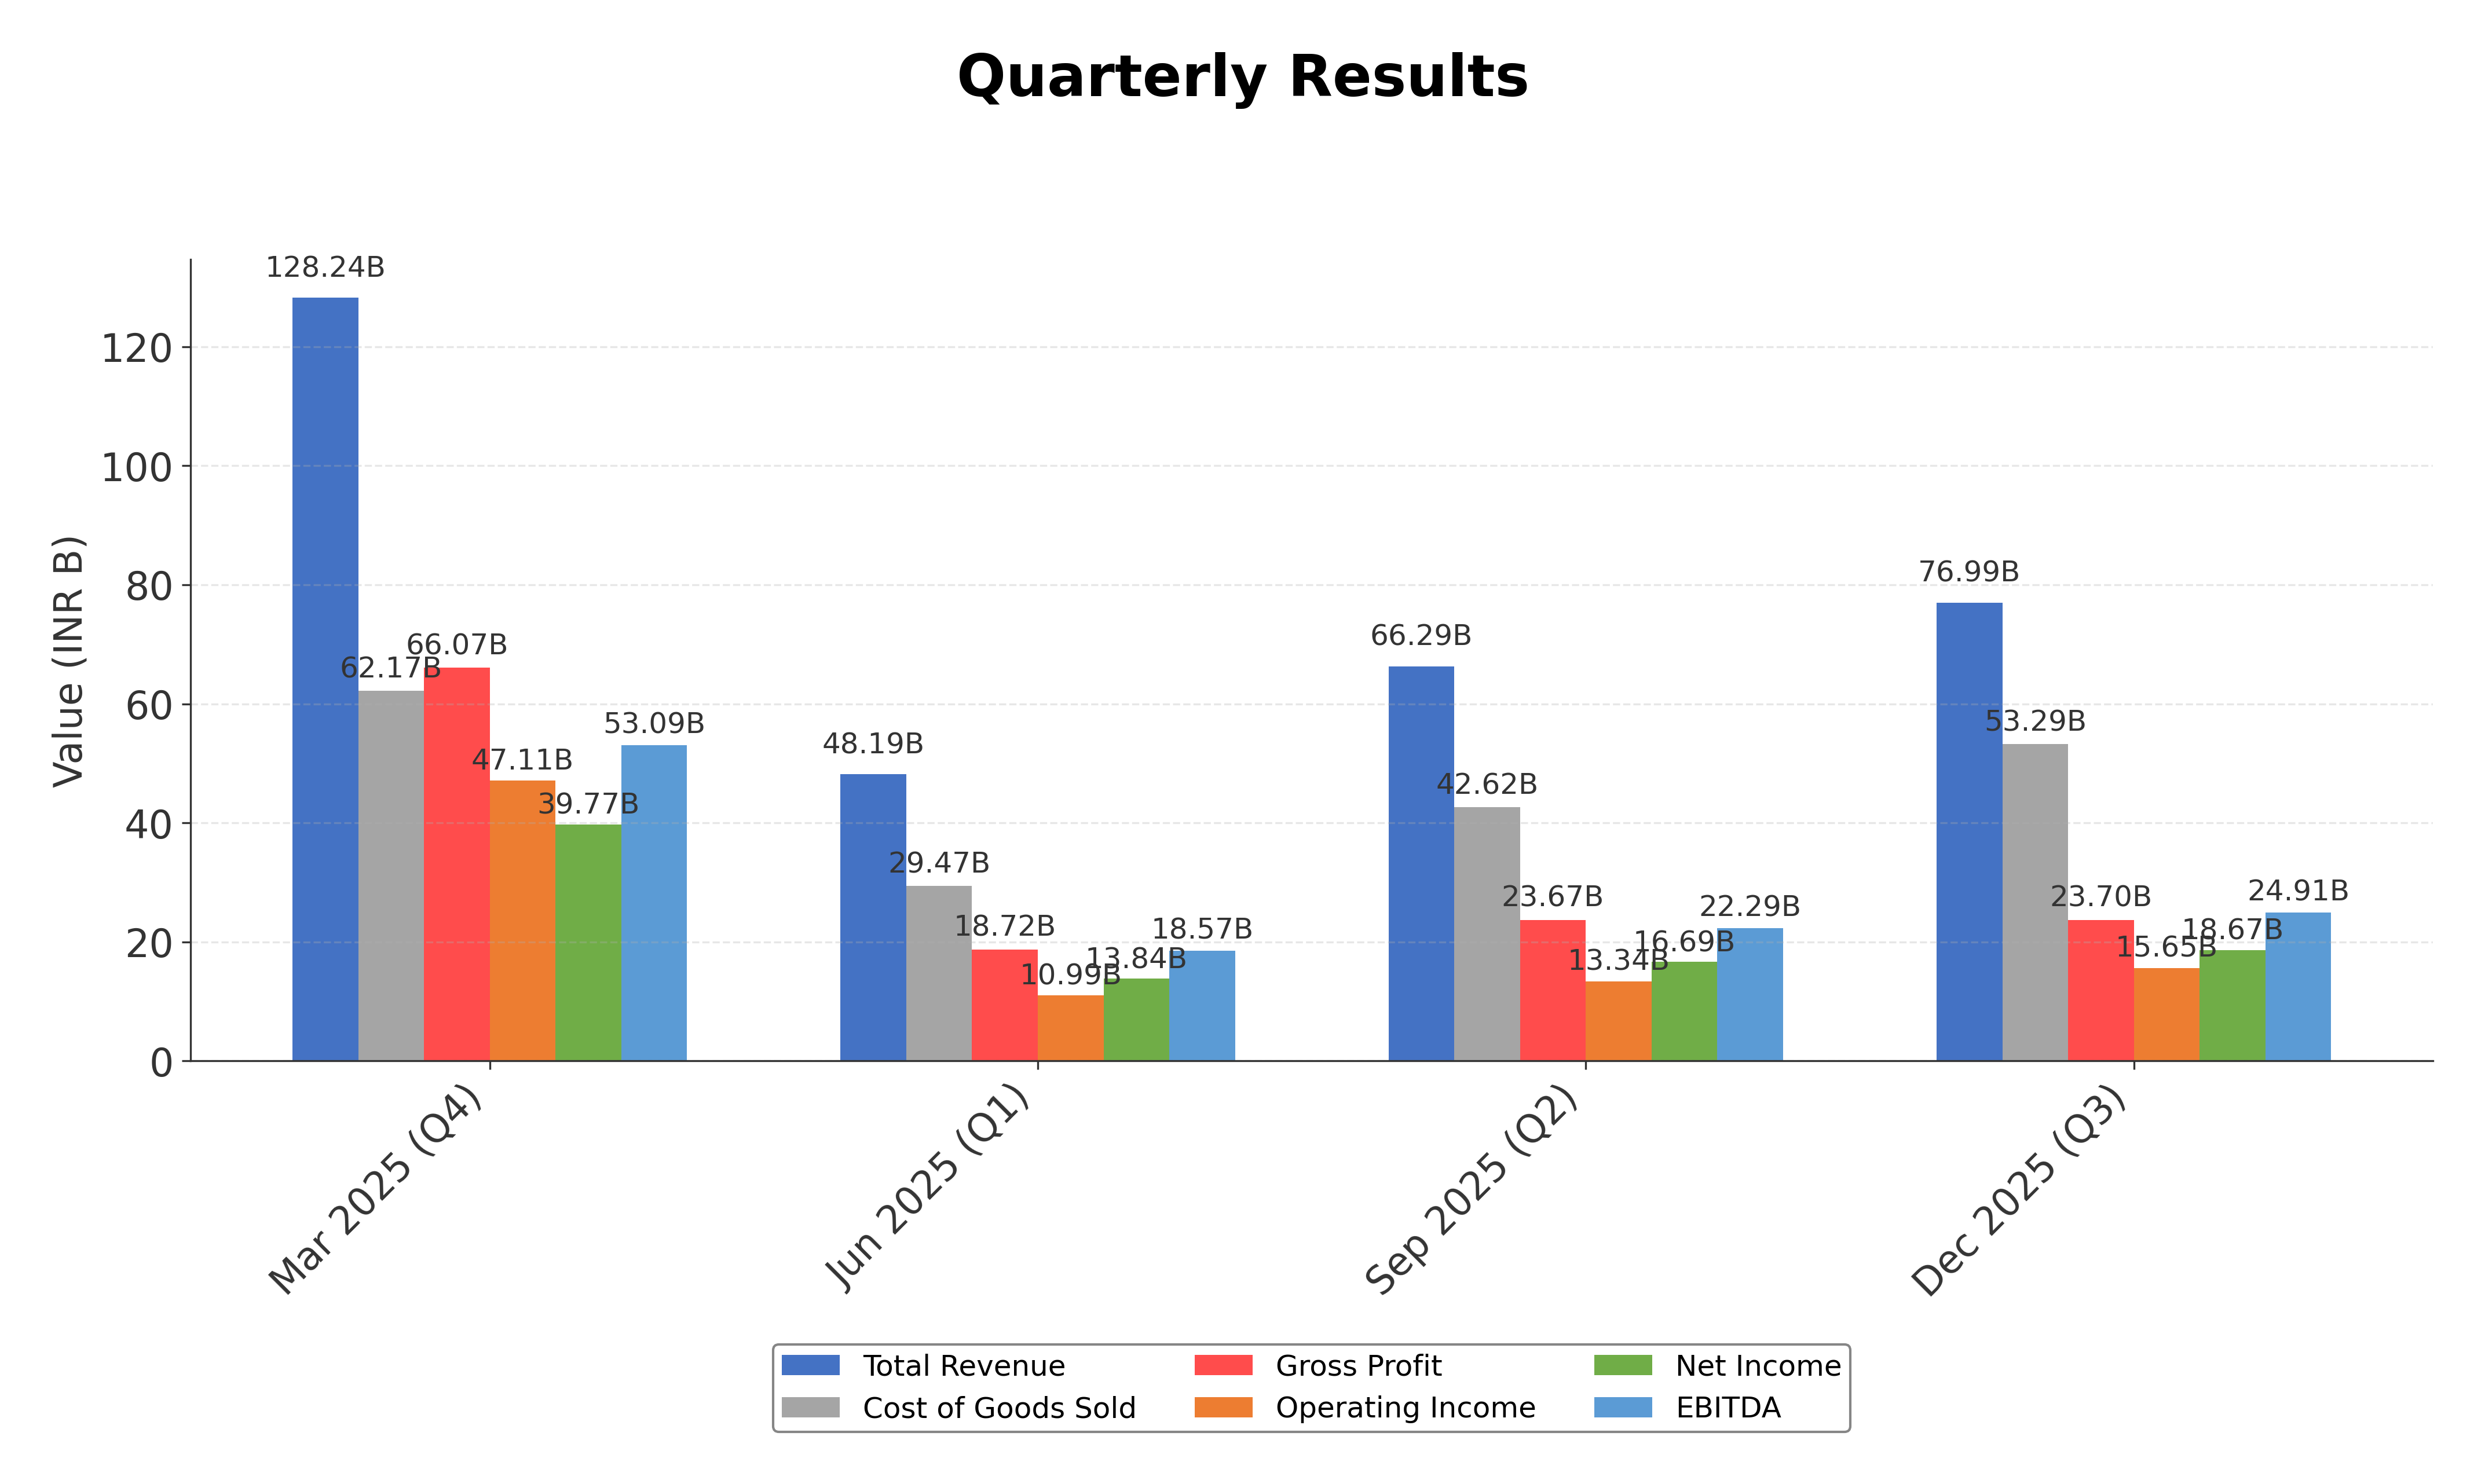
Financials
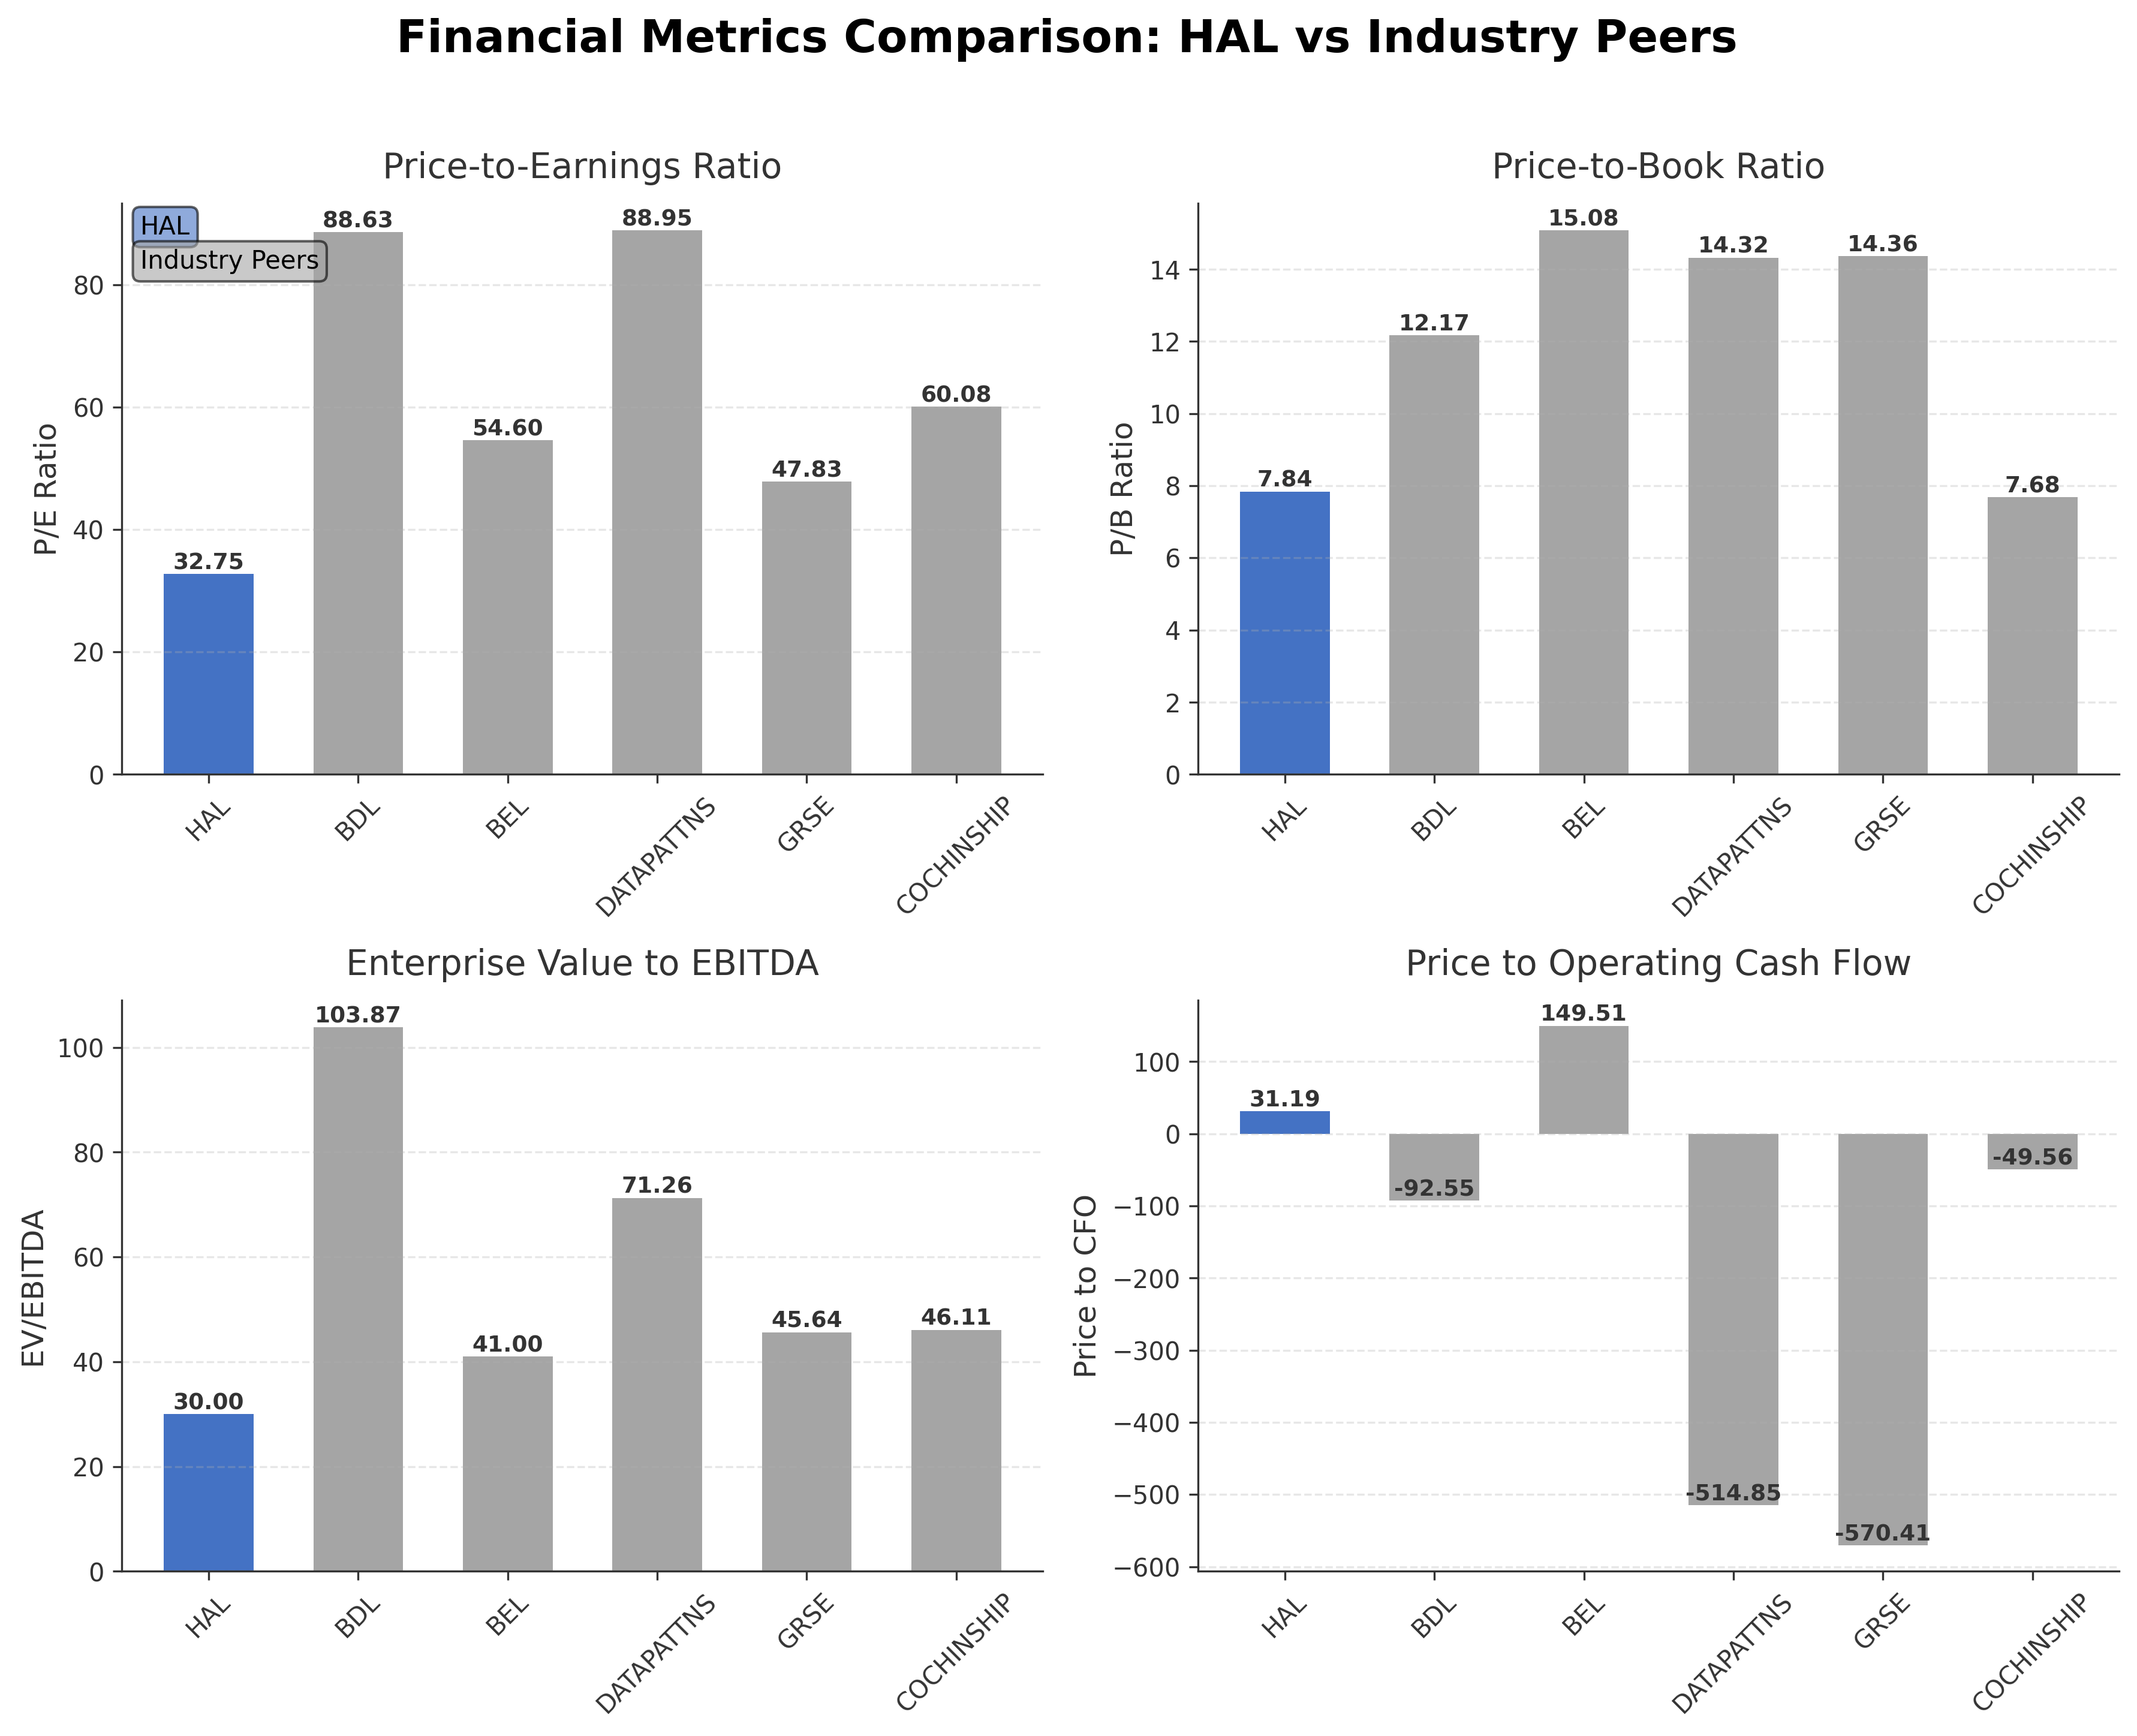
Peer Analysis
| Company Name | Market Cap | P/E Ratio | P/B Ratio | EV/EBITDA | Price to CFO |
|---|---|---|---|---|---|
| Hindustan Aeronautics Ltd. | ₹2.85T | 32.75 | 7.84 | 30.0 | 31.19 |
| Bharat Dynamics Ltd. | ₹513.33B | 88.63 | 12.17 | 103.87 | -92.55 |
| Bharat Electronics Limited | ₹3.25T | 54.6 | 15.08 | 41.0 | 149.51 |
| Data Patterns (India) Ltd. | ₹228.29B | 88.95 | 14.32 | 71.26 | -514.85 |
| Garden Reach Shipbuilders & Engineers Ltd. | ₹329.76B | 47.83 | 14.36 | 45.64 | -570.41 |
| Cochin Shipyard Limited | ₹437.95B | 60.08 | 7.68 | 46.11 | -49.56 |
Comparison Analysis: Hindustan Aeronautics Ltd. stands as one of the largest companies in the Indian aerospace and defense sector with a market capitalization of ₹2.85 trillion, closely trailing Bharat Electronics Limited at ₹3.25 trillion. HAL’s valuation metrics, including a P/E ratio of 32.75 and EV/EBITDA of 30.00, are significantly lower than many peers such as Bharat Dynamics and Data Patterns, which exhibit higher P/E ratios above 80 and EV/EBITDA multiples exceeding 70, indicating a relatively more moderate valuation. The company’s return on equity of 24% is competitive within the peer group, surpassing several peers who report ROEs below 25%. HAL’s price-to-cash-flow ratio of 31.19 contrasts with negative or volatile cash flow multiples among peers, reflecting stronger cash generation. Overall, HAL presents a balanced profile of size, profitability, and valuation compared to its regional industry counterparts.
Financial Metrics Comparison with Peers
Financial Statements
Comprehensive financial data including income, balance sheet, and cash flow metrics
Income Statement
| fiscal_date | 2025-03-31 | 2024-03-31 | 2023-03-31 | 2022-03-31 | 2021-03-31 |
|---|---|---|---|---|---|
| Sales | 301.05B | 281.62B | 263.61B | 243.61B | 225.01B |
| Cost Of Goods | 174.56B | 162.18B | 154.44B | 94.90B | 105.17B |
| Gross Profit | 126.49B | 119.43B | 109.16B | 148.71B | 119.84B |
| Operating Expense Selling General And Administrative | 1.23B | 902.30M | 994.00M | 718.00M | 858.00M |
| Operating Expense Other Operating Expenses | 32.11B | 26.02B | 44.38B | 45.89B | 21.24B |
| Operating Income | 84.35B | 84.05B | 57.09B | 45.32B | 43.44B |
| Non Operating Interest Income | 22.87B | 16.34B | 14.99B | 6.88B | 1.37B |
| Non Operating Interest Expense | 86.80M | 321.10M | 579.70M | 582.00M | 2.59B |
| Pretax Income | 108.67B | 102.25B | 65.09B | 52.25B | 42.83B |
| Income Tax | 25.03B | 26.04B | 6.82B | 1.45B | 10.38B |
| Net Income | 83.64B | 76.21B | 58.28B | 50.80B | 32.46B |
| Eps Basic | 125.07 | 113.95 | 87.14 | 75.96 | 48.53 |
| Eps Diluted | 125.07 | 113.95 | 87.14 | 75.96 | 48.53 |
| Basic Shares Outstanding | 668.77M | 668.77M | 668.77M | 668.77M | 668.77M |
| Diluted Shares Outstanding | 668.77M | 668.77M | 668.77M | 668.77M | 668.77M |
| Ebit | 108.76B | 102.57B | 65.67B | 52.83B | 45.43B |
| Ebitda | 123.29B | 117.03B | 96.00B | 67.74B | 58.14B |
| Net Income Continuous Operations | 83.64B | 76.21B | 58.28B | 50.80B | 32.46B |
| Minority Interests | 800.00K | 1.00M | 100.00K | 1.60M | 4.00M |
| Preferred Stock Dividends | 0.00 | 0.00 | 0.00 | 0.00 | 0.00 |
Source: Financial statements and regulatory filings
Balance Sheet
| fiscal_date | 2025-03-31 | 2024-03-31 | 2023-03-31 | 2022-03-31 | 2021-03-31 |
|---|---|---|---|---|---|
| Cash And Cash Equivalents | 45.49B | 42.55B | 44.41B | 30.70B | 71.46B |
| Accounts Receivable | 46.48B | 46.17B | 47.19B | 46.42B | 56.68B |
| Total Assets | 1062.67B | 780.95B | 672.04B | 583.92B | 517.64B |
| Total Liabilities | 712.82B | 489.53B | 436.28B | 390.75B | 363.36B |
| Long Term Debt | 11.40M | 10.80M | 25.10M | 24.10M | 23.10M |
| Shareholders Equity | 349.85B | 291.42B | 235.76B | 193.17B | 154.28B |
Source: Financial statements and regulatory filings
Cash Flow Statement
| fiscal_date | 2025-03-31 | 2024-03-31 | 2023-03-31 | 2022-03-31 | 2021-03-31 |
|---|---|---|---|---|---|
| Operating Activities Net Income | 83.64B | 76.21B | 58.28B | 50.80B | 32.46B |
| Operating Activities Other Non Cash Items | -22.80B | -16.00B | -14.76B | -6.29B | 1.16B |
| Operating Activities Accounts Receivable | -67.97B | -38.36B | -33.74B | 6.11B | 48.91B |
| Operating Activities Other Assets Liabilities | 98.60B | 4.33B | 16.24B | 6.76B | 61.93B |
| Operating Activities Operating Cash Flow | 91.47B | 26.18B | 26.01B | 57.39B | 144.46B |
| Investing Activities Capital Expenditures | -9.27B | -9.08B | -7.77B | -7.96B | -6.53B |
| Investing Activities Net Intangibles | -8.27B | -8.39B | -9.99B | -7.01B | -5.54B |
| Investing Activities Net Acquisitions | -128.90M | -105.00M | 0.00 | -100.00M | 0.00 |
| Investing Activities Purchase Of Investments | -115.64B | -64.01B | -46.93B | -114.81B | -666.60M |
| Investing Activities Other Investing Activity | -4.10M | N/A | N/A | N/A | 100.00M |
| Investing Activities Investing Cash Flow | -125.04B | -73.20B | -54.71B | -122.87B | -7.04B |
| Financing Activities Common Dividends | -25.41B | -19.73B | -16.72B | -13.38B | -10.03B |
| Financing Activities Financing Cash Flow | -25.41B | -19.73B | -16.72B | -13.56B | -127.23B |
| End Cash Position | 45.49B | 42.55B | 44.41B | 30.70B | 71.46B |
| Free Cash Flow | 118.87B | 64.68B | 70.48B | 86.73B | 139.08B |
| Financing Activities Long Term Debt Payments | N/A | 0.00 | 0.00 | -90.70M | -58.60B |
| Financing Activities Short Term Debt Issuance | N/A | 0.00 | 0.00 | -90.70M | -58.60B |
| Investing Activities Sale Of Investments | N/A | N/A | N/A | N/A | 60.40M |
| Financing Activities Common Stock Repurchase | N/A | N/A | N/A | N/A | N/A |
Source: Financial statements and regulatory filings
Technical Analysis
Key Insights
- Hindustan Aeronautics Ltd. is currently exhibiting a sideways to slightly bearish trend with price action consolidating below the 200-day moving average of ₹4,405 and the 50-day moving average of ₹3,970, indicating resistance at higher levels.
- Key support levels are identified near ₹3,479 (52-week low) and intermediate support around ₹3,900, while resistance is observed near ₹4,400 and the recent 52-week high of ₹5,165.
- The stock price is trading below the 200-day moving average and slightly above the 50-day moving average, suggesting mixed momentum with potential short-term volatility.
- Momentum indicators show the Relative Strength Index (RSI) hovering near neutral levels around 50, the MACD indicator is near the signal line indicating lack of strong directional momentum, and the Stochastic oscillator reflects a neutral stance without clear overbought or oversold conditions.
- Across daily, weekly, and monthly timeframes, the stock shows consolidation with no decisive breakout, reflecting indecision among market participants.
- Potential market scenarios include a continuation of consolidation with possible retests of support levels or a breakout above resistance contingent on resolution of operational execution risks and broader market sentiment.
Trending News
1. Headline: Hindustan Aeronautics Ltd Sees Sharp Open Interest Surge Amid Mixed Market Signals
Summary: Hindustan Aeronautics Ltd (HAL) has witnessed a notable 11.23% increase in open interest in its derivatives segment, signalling heightened market activity despite the stock’s recent underperformance. This surge in open interest, coupled with volume patterns and price movements, offers insights ...
Sentiment: positive
2. Headline: Infosys, HCLTech, Tech Mahindra drag indices; Sensex, Nifty drop 2% this week - CNBC TV18
Summary: Also Read: Stock Crash: Asset manager falls 10%, the most since its listing, after Q4 net loss From the Sensex basket, Coal India Ltd, Shriram Finance Ltd, Nestle India Ltd, State Bank Of India, Eicher Motors Ltd and Bajaj Auto Ltd were the major gainers. Infosys Ltd, HCL Technologies Ltd, Tata Consultancy Services Ltd, Tech Mahindra Ltd, Sun Pharmaceutical Industries Ltd and Hindustan Aeronautics ...
Sentiment: negative
Summary: Hindustan Aeron Share Price: Find the latest news on Hindustan Aeron Stock Price. Get all the information on Hindustan Aeron with historic price charts for NSE / BSE. Experts & Broker view also get the Hindustan Aeron Ltd. buy/sell tips detailed news, announcements, Forecasts, Analysts, Valuation, ...
Sentiment: neutral
4. Headline: Dynamatic Tech, Aerodata Forge India Drone Surveillance Pact | Whalesbook Corporate News
Summary: Dynamatic Technologies inks MoU with Aerodata AG to develop advanced drone surveillance for India, integrating AeroForce X tech. Key investor watch points.
Sentiment: neutral
5. Headline: State plans to turn HAL into mega aviation hub, but awaits Centre’s nod | Bengaluru News - The Times of India
Summary: Bengaluru: The state govt is preparing a 10-year blueprint to turn Hindustan Aeronautics Ltd (HAL) airport campus in Bengaluru into an integrated defe.
Sentiment: neutral
Recent Updates
News Summary
As of April 21, 2026. Hindustan Aeronautics Ltd. has encountered growth challenges despite a record order book valued at ₹2.54 trillion. The company’s provisional fiscal year 2026 revenue was ₹32,250 crore, marginally higher than the previous fiscal year’s ₹30,981 crore, reflecting delivery delays in key products such as the Light Combat Aircraft Tejas Mk1A and Hindustan Turbo Trainer-40. These delays are attributed to supply chain disruptions and engine supply issues from General Electric, which have prompted some analysts to reduce growth estimates. Concurrently, the Karnataka state government is advancing plans to develop HAL’s Bengaluru campus into a mega aviation hub, pending central government approval, signaling long-term infrastructure expansion. These developments highlight operational execution risks alongside strategic growth initiatives.
News Sentiment
The overall sentiment from recent updates is mixed, with positive aspects including a record order book and government-backed infrastructure plans, while concerns persist around execution delays and supply chain bottlenecks impacting near-term revenue growth. The market reaction has been cautious, reflecting these contrasting factors. Institutional and analyst outlooks have tempered expectations due to operational challenges, though strategic initiatives provide a foundation for future growth. The sentiment balance underscores the importance of monitoring execution progress and regulatory approvals.
Source List
- https://www.livemint.com/market/stock-market-news/hal-share-price-hindustan-aeronautics-limited-11775657939099.html
- https://timesofindia.indiatimes.com/city/bengaluru/state-plans-to-turn-hal-into-mega-aviation-hub-but-awaits-centres-nod/articleshow/130424262.cms
Analytical Overview
Analysis Summary
Hindustan Aeronautics Ltd.’s valuation metrics, including a trailing P/E of 32.75 and forward P/E of 29.75, are broadly in line with the aerospace and defense industry average of 32.75, suggesting the stock is fairly valued relative to peers. The company demonstrates a positive growth trajectory with a quarterly revenue growth rate of 10.7% and a year-over-year earnings growth of 29.6%, supported by a strong order book. Financial health is robust, evidenced by a low debt-to-equity ratio of 0.031 and substantial cash reserves of ₹444.7 billion, which underpin liquidity and operational flexibility. Sector-specific challenges include supply chain disruptions and delays in engine deliveries, while opportunities arise from government initiatives to expand aviation infrastructure and increasing defense spending in India. Considering India’s regulatory environment and growing defense budget, HAL is well positioned to benefit from national priorities and evolving market dynamics.
Overall Business and Market Assessment
Supporting Factors: HAL’s strong order book valued at ₹2.54 trillion, solid profitability metrics with a net margin of 27.08%, and a healthy balance sheet with minimal debt and high cash reserves
Risk Factors: execution delays related to supply chain and engine deliveries, which have already impacted recent revenue growth and stock performance
SWOT Analysis
Strengths
- Hindustan Aeronautics Ltd. has a dominant market position in India’s aerospace and defense sector.
- The company maintains a strong balance sheet with high cash reserves and minimal debt.
- Robust profitability with a net profit margin exceeding 27% and a return on equity of 24%.
- Government ownership provides strategic advantages and stable order flow.
Weaknesses
- Execution delays and supply chain disruptions have impacted recent revenue growth.
- Dependence on external suppliers like General Electric for critical components.
- High valuation multiples relative to some industry peers may limit near-term upside.
- Limited diversification outside defense and aerospace sectors.
Opportunities
- Government plans to develop HAL’s Bengaluru campus into a mega aviation hub.
- Increasing defense spending and modernization initiatives in India.
- Potential to expand civilian aircraft production and maintenance services.
- Growing global demand for indigenous aerospace technologies.
Threats
- Geopolitical tensions and regulatory changes could affect supply chains and contracts.
- Competitive pressures from domestic and international aerospace firms.
- Delays in critical component deliveries may continue to hamper execution.
- Economic volatility impacting government defense budgets and spending.
Company Description
Hindustan Aeronautics Ltd. is a leading aerospace and defense company based in India. Established in 1940, the company plays a vital role in the design, manufacture, and assembly of aircraft, helicopters, avionics, and related equipment. As a government-owned corporation, its primary function is to support India's defense sector by providing indigenously developed aircraft and maintenance services. Hindustan Aeronautics Ltd. significantly impacts various industries, including defense, aerospace, and aviation, by contributing crucial technologies and services to India's armed forces. The company also engages in civilian aircraft production and offers aircraft overhaul and repair services. Given its strategic importance, Hindustan Aeronautics Ltd. is a key player in the Indian aerospace sector, facilitating the nation’s self-reliance in defense production and contributing to the broader aerospace market.