
Hindalco Industries Ltd (HINDALCO)
Stock Analysis Report
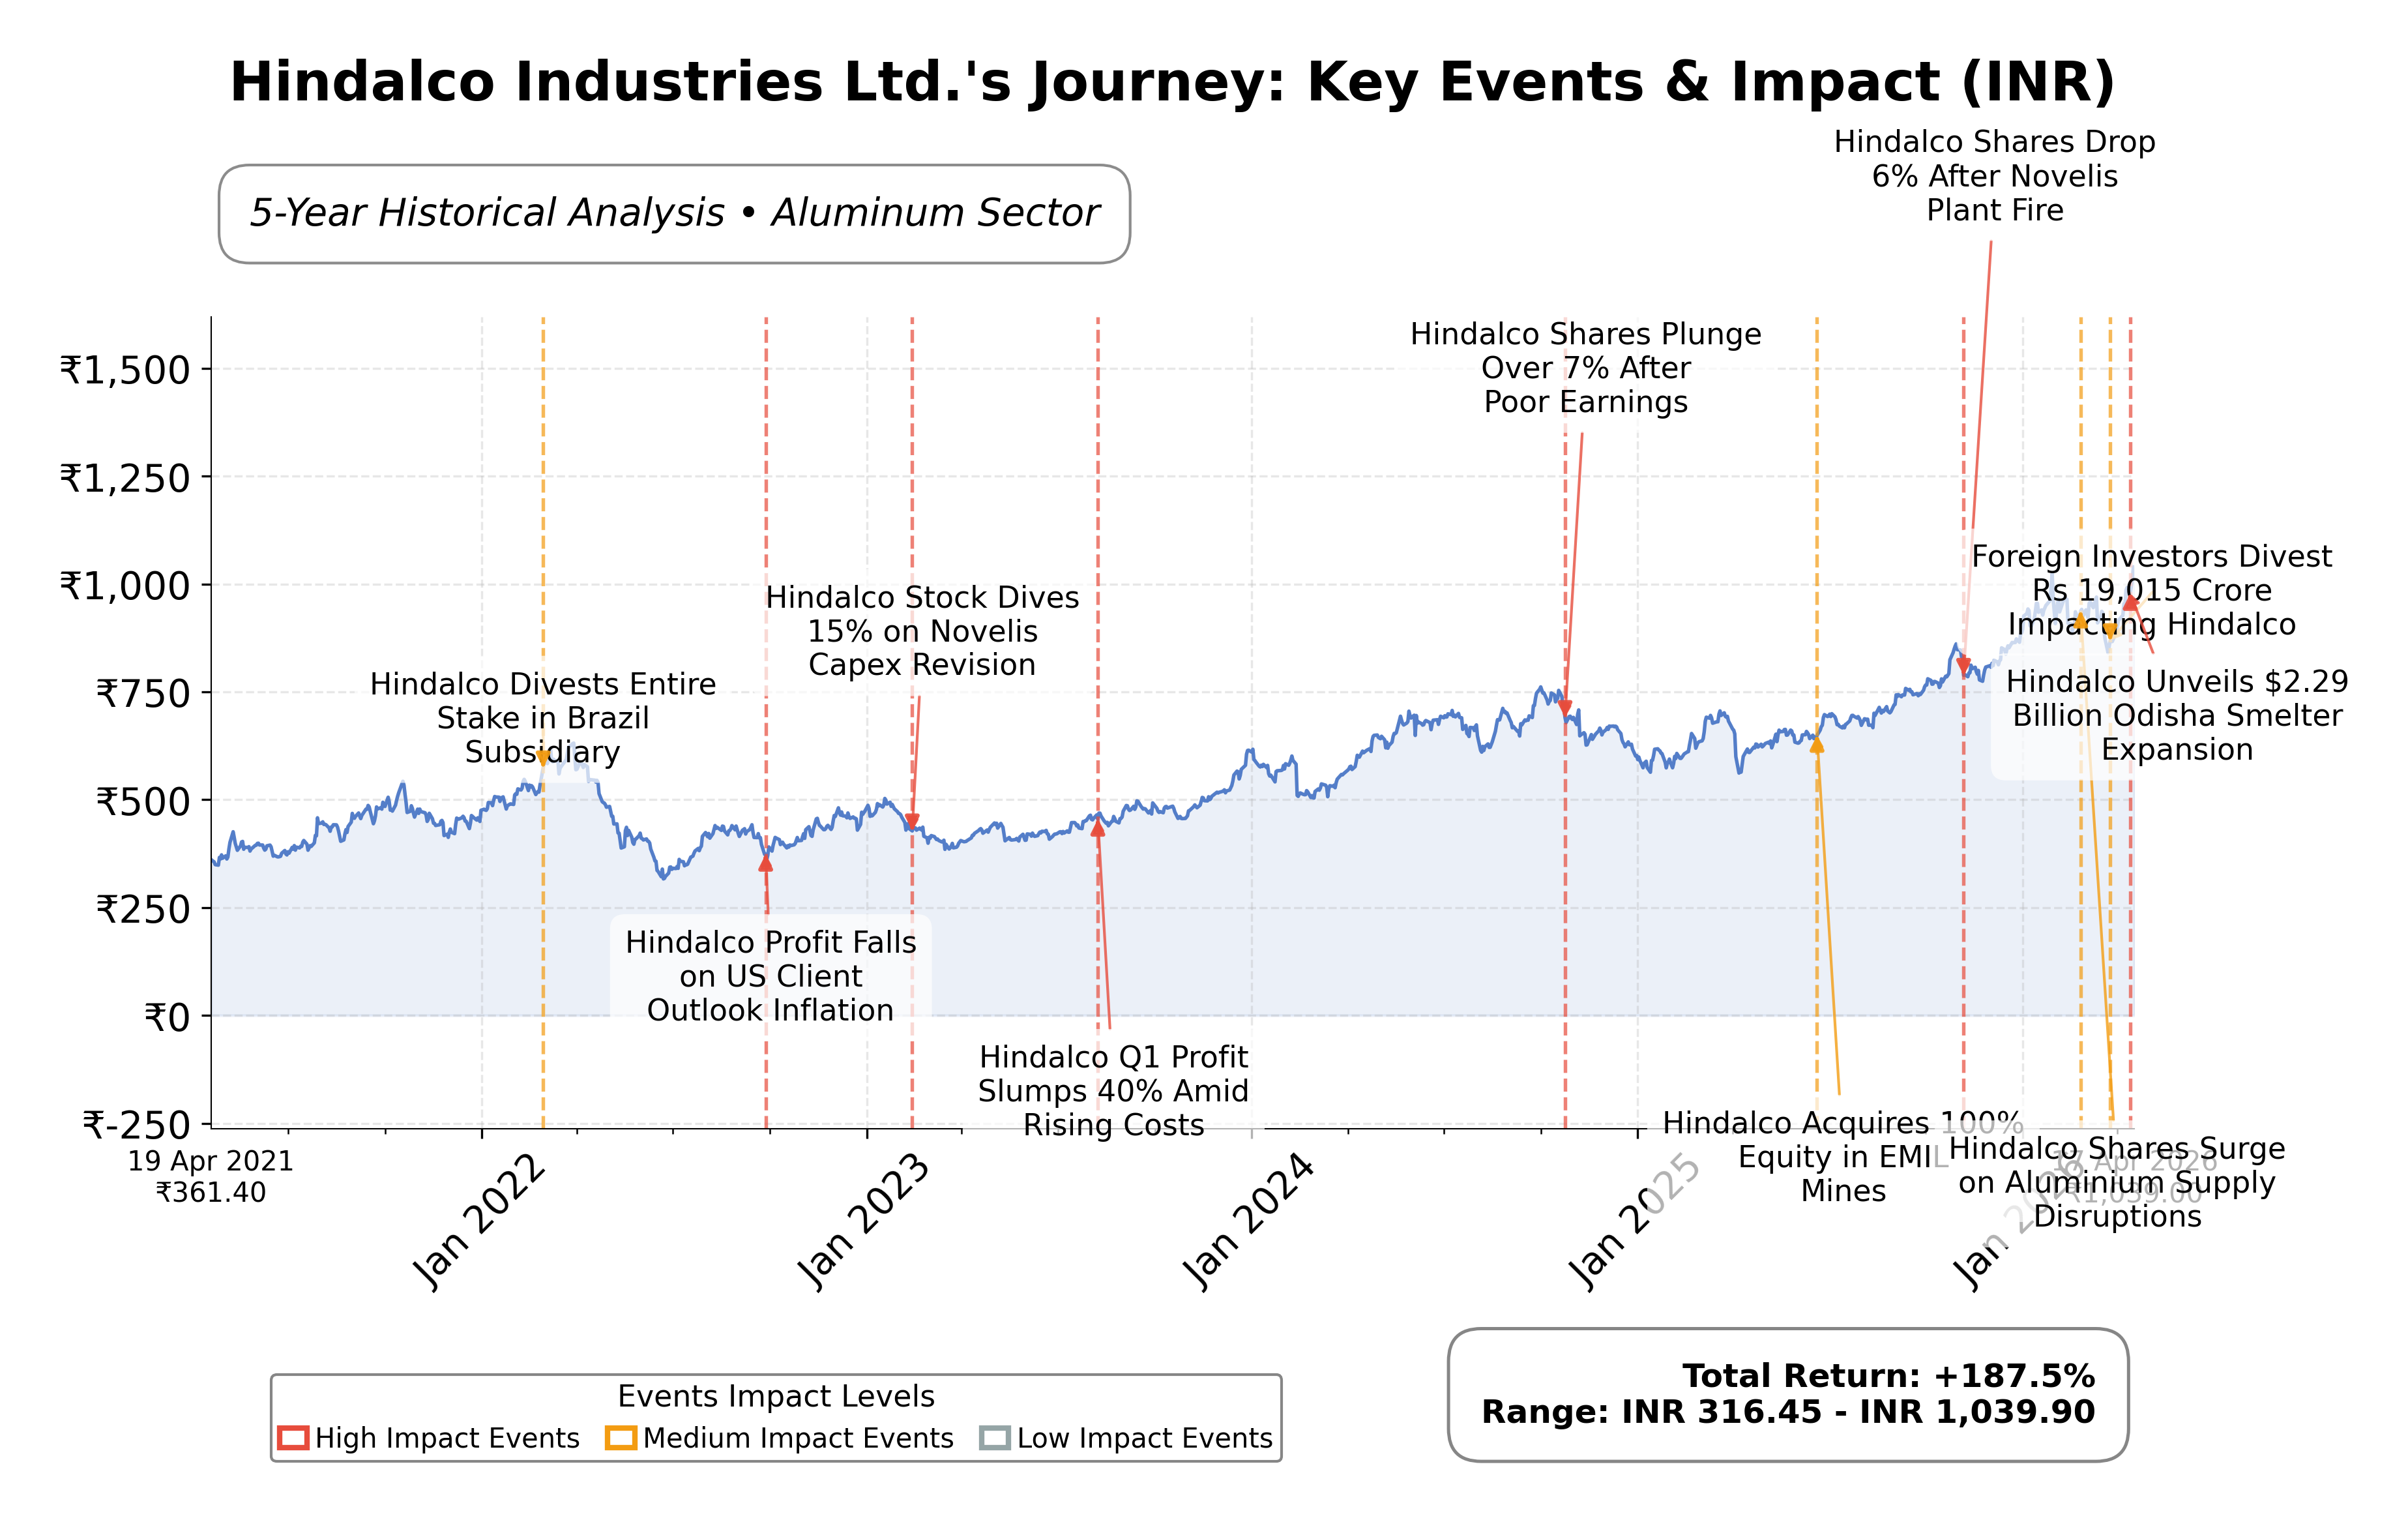
Stock Journey
Key Positives and Key Risks
Pros
- Hindalco’s trailing P/E ratio of 14.37 aligns with industry averages, indicating reasonable valuation.
- The company generated strong free cash flow of INR 160.01 billion, supporting financial flexibility.
- Hindalco’s revenue grew 13.9% year-over-year, demonstrating solid growth momentum.
Cons
- Execution risks related to aluminum expansion could impact future profitability.
- Debt-to-equity ratio of 57.57% reflects moderate leverage that may constrain capital allocation.
- Profit margins remain moderate at 6.14%, below some peer benchmarks.
Disclosure: This information is for general awareness and does not constitute investment advice
Report Summary
Hindalco Industries Ltd. operates as a leading entity in the metals and mining industry, primarily engaged in the production of aluminum and copper products. Listed on the NSE under the Basic Materials sector, the company is a flagship of the Aditya Birla Group and serves diverse industries including automotive, packaging, construction, electrical, and telecommunications. Its integrated operations span mining, smelting, and downstream processing, positioning Hindalco as a significant player in both the Indian and global metals markets.
Financially, Hindalco reported trailing twelve months revenue of approximately INR 2.62 trillion, with a gross margin of 32.77%, an operating margin of 8.68%, and a net profit margin of 6.14%. The company’s return on equity (ROE) stands at 12.93%, while return on assets (ROA) is 6.02%, reflecting moderate profitability and efficient asset utilization. Operating cash flow totaled INR 146.66 billion, and free cash flow was INR 160.01 billion, indicating solid cash generation capabilities.
Valuation metrics show a trailing price-to-earnings (P/E) ratio of 14.37 and a forward P/E of 11.81, suggesting the stock is reasonably priced relative to earnings expectations. The price-to-book (P/B) ratio is 1.71, and the enterprise value to EBITDA (EV/EBITDA) multiple is 8.31. The market capitalization is approximately INR 2.32 trillion. The stock trades near its 52-week high of INR 1,048.70, currently priced at INR 1,039.05, indicating limited upside from recent highs.
Hindalco’s strengths include strong cash flow generation, a manageable debt-to-equity ratio of 57.57%, and a diversified product portfolio with market leadership in aluminum and copper segments. Key risks involve execution challenges related to its aluminum expansion, commodity price volatility, and regulatory factors impacting the metals sector. Recent strategic actions include securing a significant Rs 24 crore order from Texmaco Rail, underscoring ongoing investments in logistics infrastructure.
Technically, the stock exhibits strong momentum with price levels above its 50-day and 200-day moving averages, supported by positive market participation and recent all-time highs. However, valuation multiples are somewhat stretched relative to peers, suggesting a cautious stance. Overall, the data points to a balanced outlook where market participants may consider accumulation opportunities while monitoring execution risks and sector dynamics.
Company and Industry Overview
Company Basics
Price Performance
Company Size
Shareholding Pattern
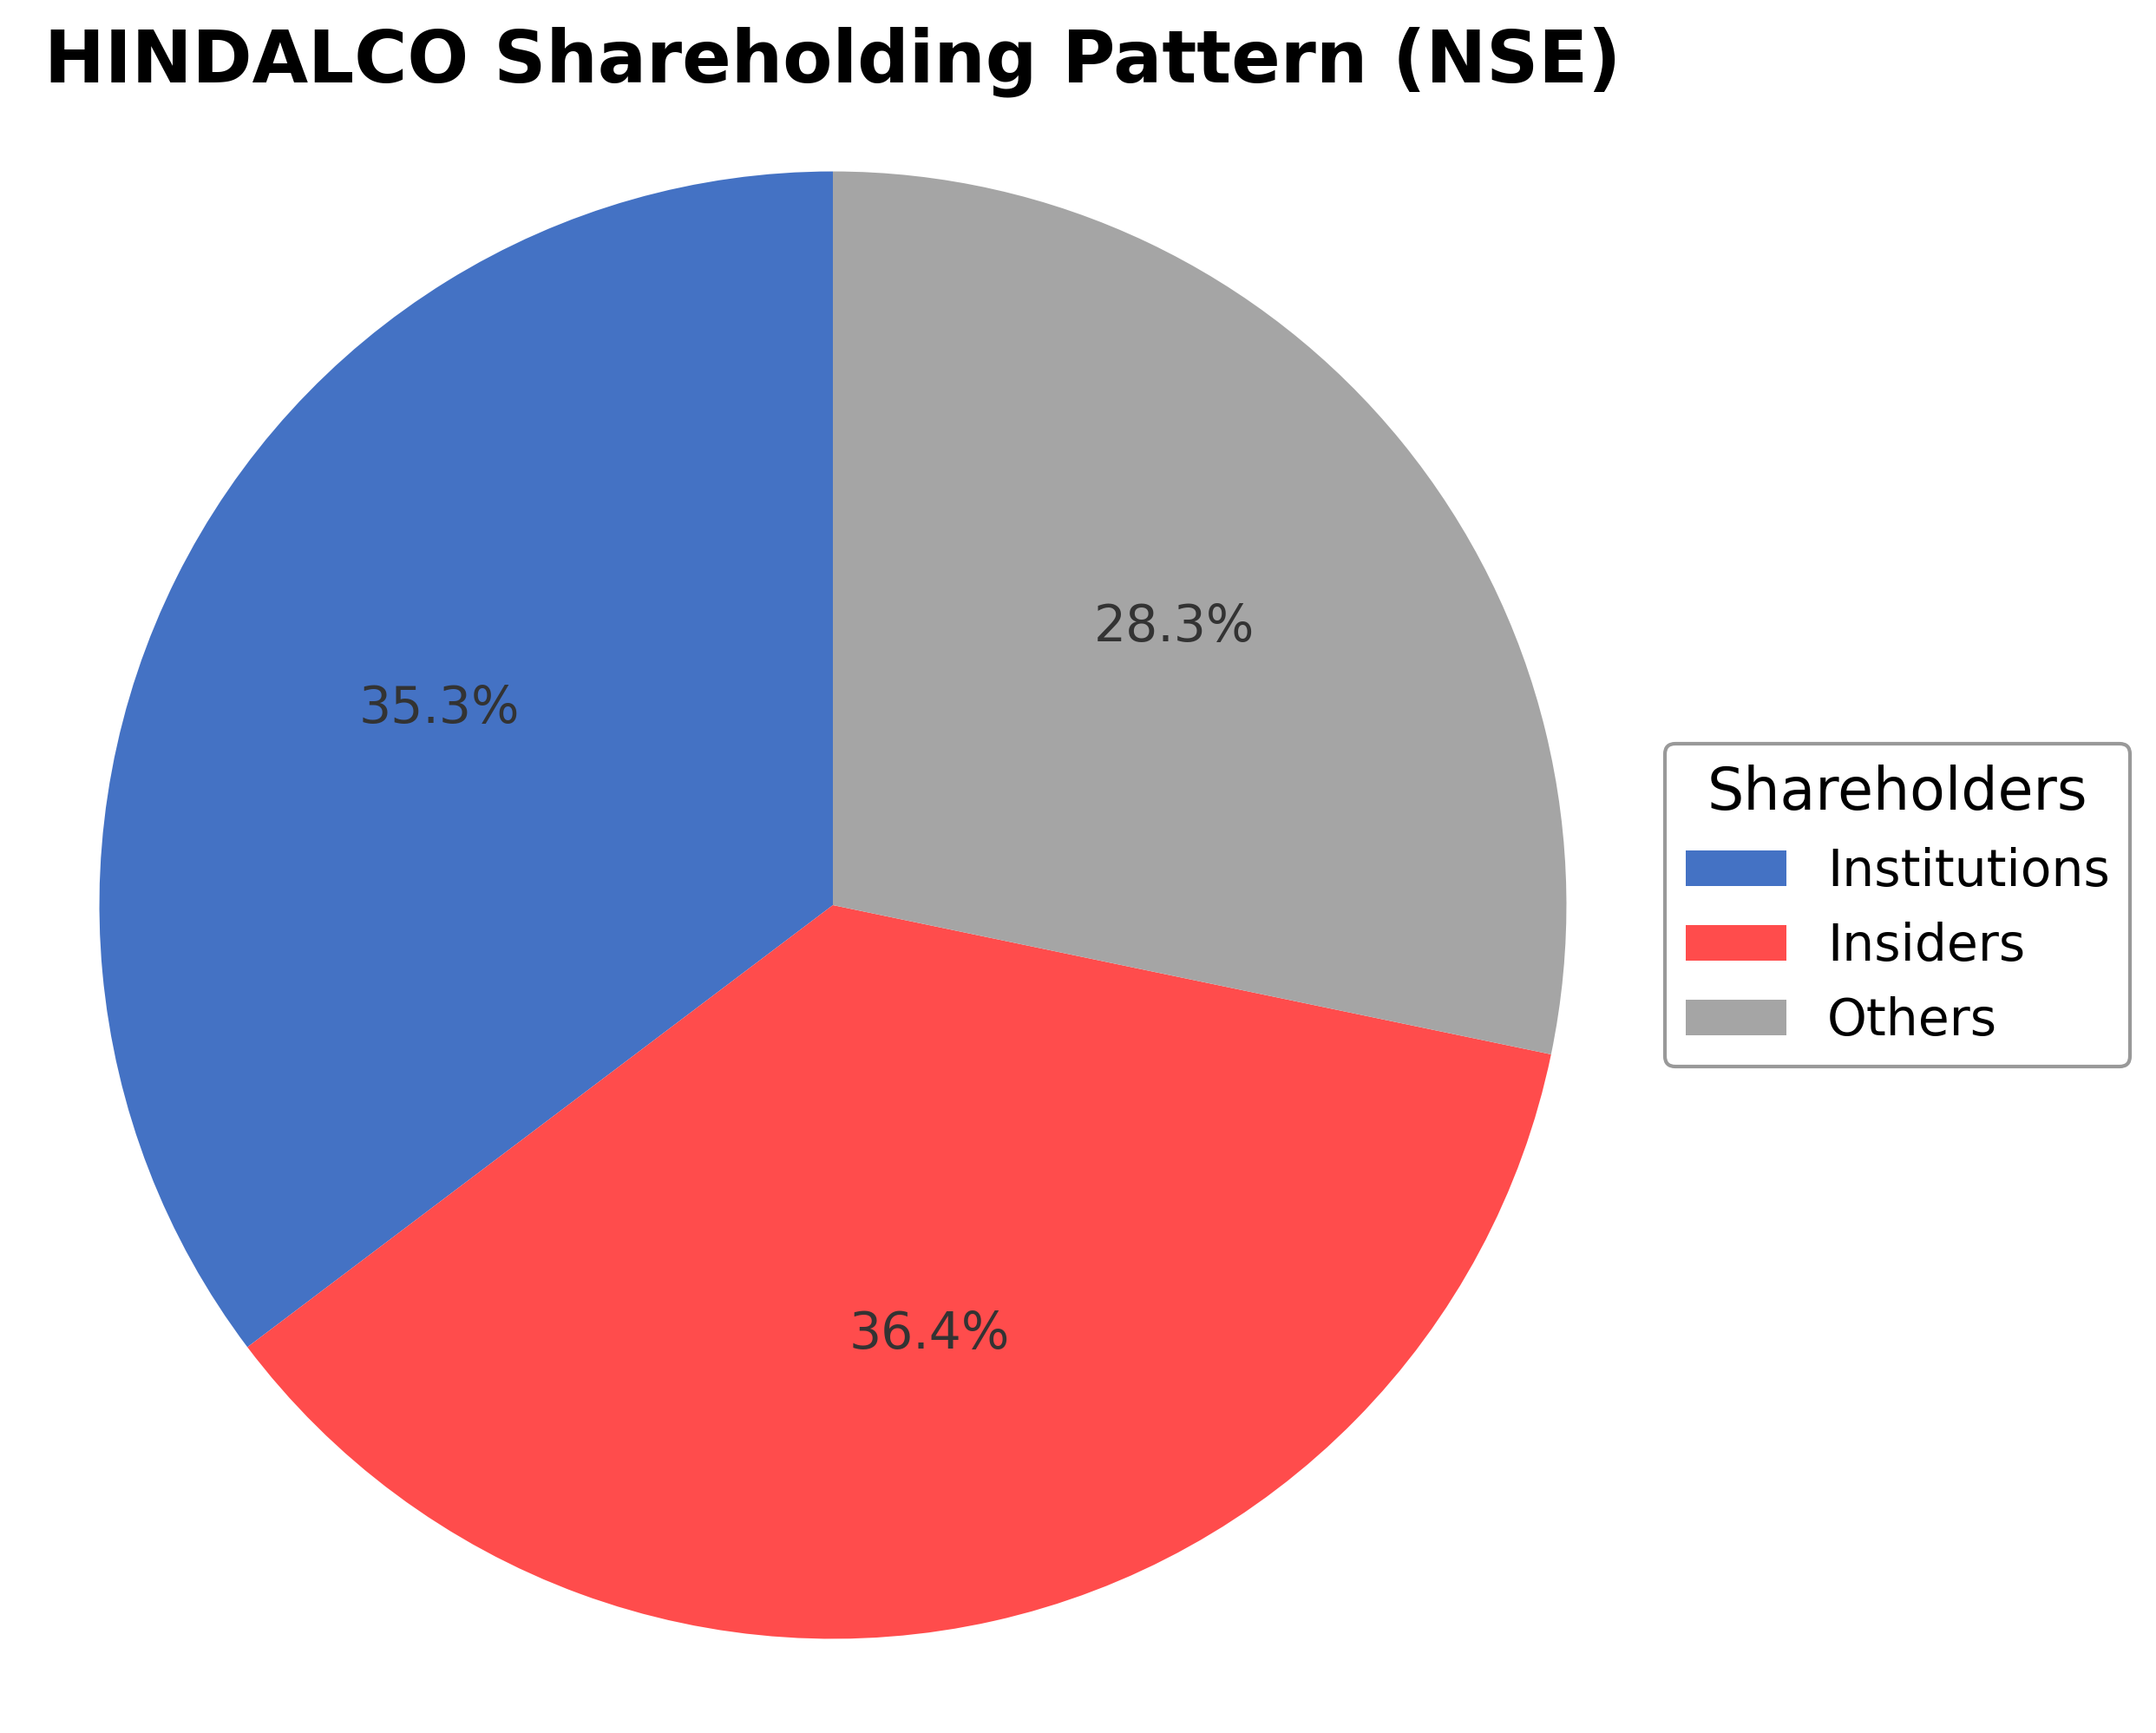
Hindalco Industries Ltd.'s ownership structure comprises approximately 36.45% held by insiders including executives and board members, 35.29% by institutional investors such as mutual funds and pension funds, and the remaining 28.26% by public shareholders including retail investors and employee stock plans. Over the past 12-24 months, institutional holdings have shown moderate accumulation, reflecting confidence from major funds. Prominent institutional investors have maintained or slightly increased their stakes, indicating stable market sentiment. This balanced shareholding pattern supports effective governance and strategic decision-making, with no significant recent shifts that could disrupt corporate direction. The ownership distribution aligns with the company's position as a major player in the aluminum industry, facilitating sustained operational focus and market responsiveness.
Sector and Industry Analysis
The metals and mining sector, encompassing aluminum and copper production, is a significant contributor to the global industrial economy with a market size valued in hundreds of billions of dollars. Growth is driven by demand from automotive, packaging, construction, and electrical industries, with emerging markets fueling consumption increases. Major players include diversified conglomerates and specialized producers such as Hindalco Industries, Novelis, Rio Tinto, and Alcoa, which dominate through scale and integrated operations.
Industry trends highlight a shift toward sustainability, with increased recycling and energy-efficient production methods gaining prominence, exemplified by Novelis as the world’s largest aluminum recycler. Competitive dynamics are shaped by high capital intensity, technological innovation, and supply chain integration, creating substantial barriers to entry. Companies focus on product diversification and vertical integration to maintain margins amid fluctuating raw material costs and global trade uncertainties.
The regulatory environment is increasingly stringent, emphasizing environmental compliance, emissions reduction, and resource management, impacting operational costs and capital expenditure. Policies promoting circular economy principles and carbon footprint reduction influence strategic investments in recycling and cleaner technologies. Governments in key markets also impose tariffs and trade regulations that affect export-import dynamics, shaping the sector’s growth trajectory and competitive positioning.
Note: Analysis synthesized from industry research, market reports, and regulatory filings. Information is subject to change based on market conditions.
Financial Ratios Dashboard
Illustrative Scenario Analysis
DCF Assumptions:
Method: Two-Stage EPS-Priority Model
Financials
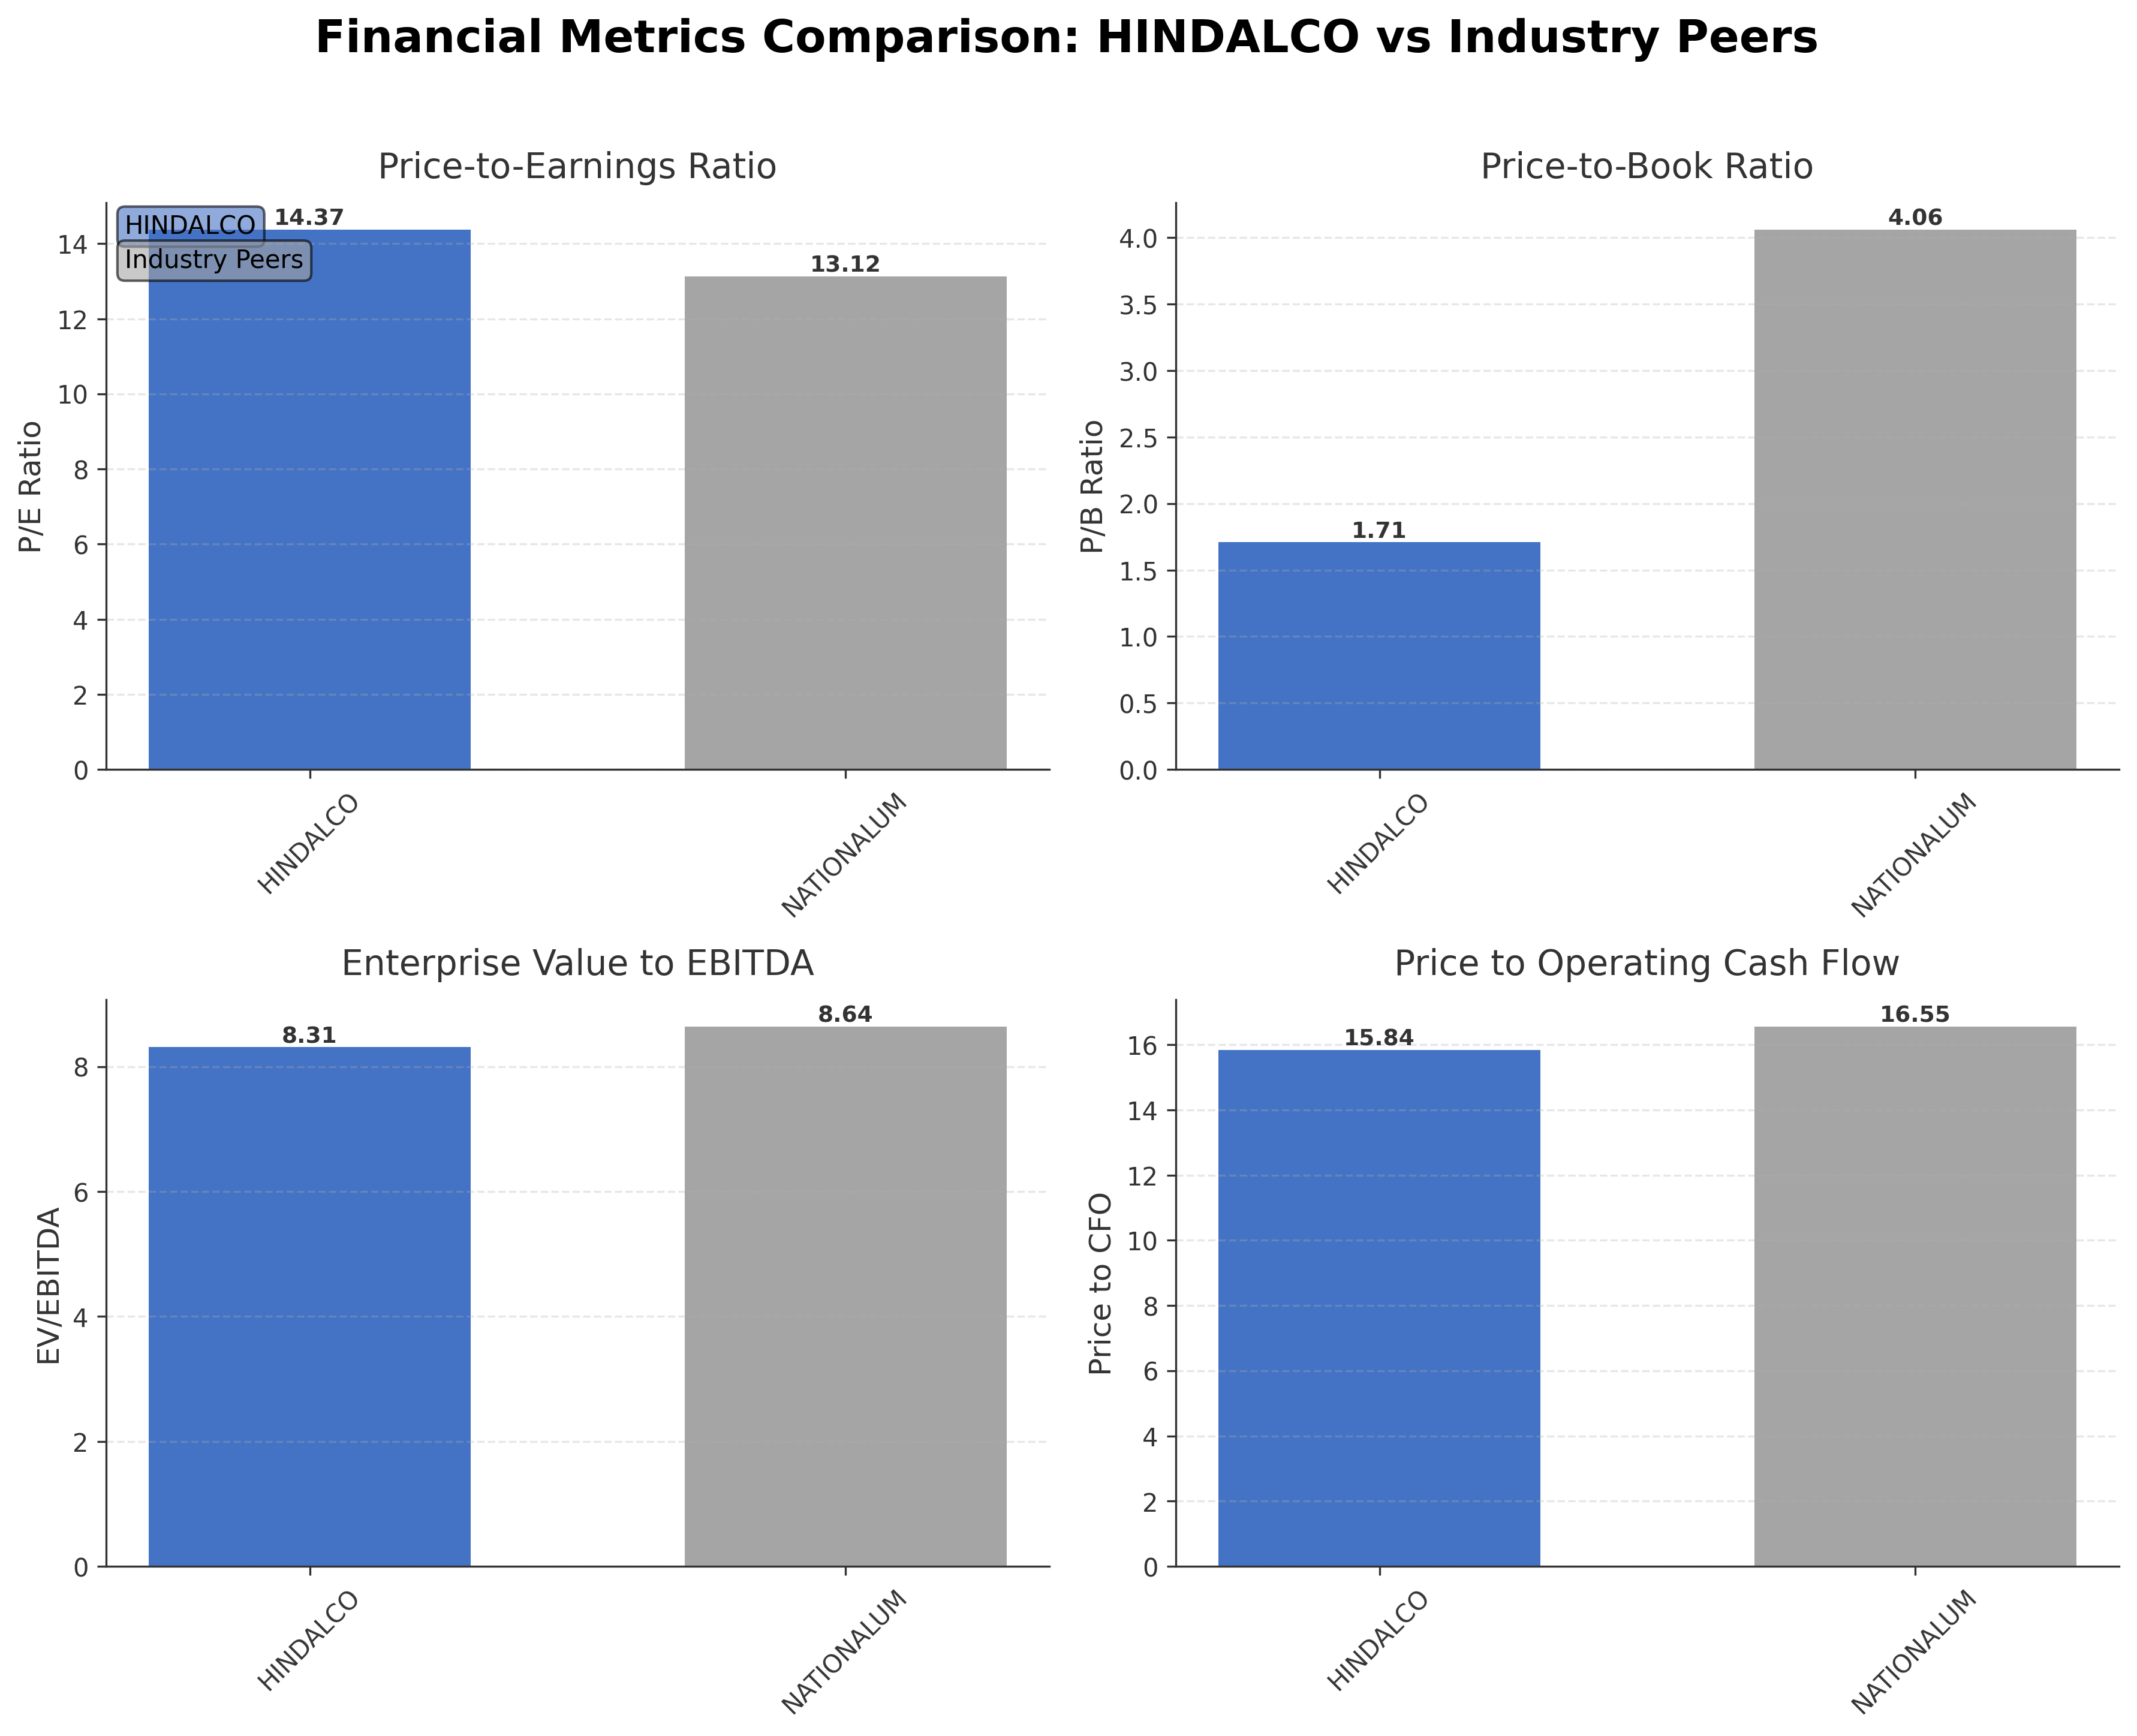
Peer Analysis
| Company Name | Market Cap | P/E Ratio | P/B Ratio | EV/EBITDA | Price to CFO |
|---|---|---|---|---|---|
| Hindalco Industries Ltd. | ₹2.32T | 14.37 | 1.71 | 8.31 | 15.84 |
| National Aluminium Co Ltd. | ₹806.72B | 13.12 | 4.06 | 8.64 | 16.55 |
Comparison Analysis: Hindalco Industries Ltd. exhibits a larger market capitalization at ₹2.32 trillion compared to National Aluminium Co Ltd.'s ₹806.72 billion. Hindalco’s P/E ratio of 14.37 is slightly higher than National Aluminium’s 13.12, while its P/B ratio of 1.71 is significantly lower than National Aluminium’s 4.06, indicating a more conservative valuation relative to book value. The EV/EBITDA multiple of 8.31 for Hindalco is marginally below National Aluminium’s 8.64, suggesting comparable operational valuation. Hindalco’s return on equity at 12.93% trails National Aluminium’s 30%, highlighting differences in profitability efficiency. Overall, Hindalco maintains competitive valuation metrics with a larger scale but comparatively moderate profitability among its regional peers.
Financial Metrics Comparison with Peers
Financial Statements
Comprehensive financial data including income, balance sheet, and cash flow metrics
Income Statement
| fiscal_date | 2025-03-31 | 2024-03-31 | 2023-03-31 | 2022-03-31 | 2021-03-31 |
|---|---|---|---|---|---|
| Sales | 2370.22B | 2148.07B | 2219.37B | 1938.88B | 1310.09B |
| Cost Of Goods | 1576.57B | 1462.23B | 1526.57B | 1287.36B | 866.16B |
| Gross Profit | 793.65B | 685.84B | 692.80B | 651.52B | 443.93B |
| Operating Expense Research And Development | 9.07B | 8.48B | 7.96B | 7.16B | 6.38B |
| Operating Expense Selling General And Administrative | 85.01B | 78.11B | 83.91B | 70.96B | 49.81B |
| Operating Expense Other Operating Expenses | 303.84B | 294.04B | 312.66B | 225.57B | 173.22B |
| Operating Income | 254.74B | 167.49B | 168.07B | 239.13B | 115.93B |
| Non Operating Interest Income | 9.71B | 7.86B | 5.59B | 2.25B | 1.81B |
| Non Operating Interest Expense | 33.29B | 37.77B | 36.02B | 32.21B | 35.60B |
| Pretax Income | 223.37B | 140.12B | 132.41B | 195.74B | 79.05B |
| Income Tax | 63.35B | 38.57B | 31.44B | 53.73B | 27.23B |
| Net Income | 160.02B | 101.55B | 100.97B | 137.30B | 34.83B |
| Eps Basic | 72.05 | 45.71 | 45.42 | 61.73 | 15.66 |
| Eps Diluted | 71.91 | 45.65 | 45.36 | 61.65 | 15.65 |
| Basic Shares Outstanding | 2.22B | 2.22B | 2.22B | 2.22B | 2.22B |
| Diluted Shares Outstanding | 2.22B | 2.22B | 2.22B | 2.22B | 2.22B |
| Ebit | 256.66B | 177.89B | 168.43B | 227.95B | 114.65B |
| Ebitda | 345.38B | 251.68B | 244.84B | 311.59B | 186.50B |
| Net Income Continuous Operations | 223.37B | 140.12B | 132.41B | 195.74B | 79.05B |
| Minority Interests | -10.00M | 0.00 | 0.00 | 0.00 | 0.00 |
| Preferred Stock Dividends | 0.00 | 0.00 | 0.00 | 0.00 | 0.00 |
Source: Financial statements and regulatory filings
Balance Sheet
| fiscal_date | 2025-03-31 | 2024-03-31 | 2023-03-31 | 2022-03-31 | 2021-03-31 |
|---|---|---|---|---|---|
| Cash And Cash Equivalents | 98.08B | 118.16B | 128.40B | 116.39B | 83.39B |
| Accounts Receivable | 198.34B | 164.04B | 162.14B | 210.76B | 129.59B |
| Total Assets | 2659.91B | 2319.07B | 2248.17B | 2230.62B | 1897.46B |
| Total Liabilities | 1422.70B | 1257.50B | 1300.00B | 1448.60B | 1232.03B |
| Long Term Debt | 578.40B | 488.26B | 529.25B | 526.07B | 472.13B |
| Shareholders Equity | 1237.21B | 1061.57B | 948.17B | 782.02B | 665.43B |
Source: Financial statements and regulatory filings
Cash Flow Statement
| fiscal_date | 2025-03-31 | 2024-03-31 | 2023-03-31 | 2022-03-31 | 2021-03-31 |
|---|---|---|---|---|---|
| Operating Activities Net Income | 223.37B | 140.12B | 132.41B | 195.74B | 79.05B |
| Operating Activities Stock Based Compensation | 620.00M | 570.00M | 480.00M | 350.00M | 150.00M |
| Operating Activities Other Non Cash Items | 20.96B | 26.64B | 27.72B | 31.64B | 32.11B |
| Operating Activities Accounts Receivable | -31.39B | 10.00M | 57.51B | -78.86B | -20.01B |
| Operating Activities Other Assets Liabilities | -66.90B | 36.74B | 3.19B | -139.29B | -38.40B |
| Operating Activities Operating Cash Flow | 146.66B | 204.08B | 221.31B | 9.58B | 52.90B |
| Investing Activities Capital Expenditures | -204.04B | -156.78B | -96.37B | -53.55B | -55.17B |
| Investing Activities Net Acquisitions | -120.00M | -300.00M | 70.00M | -3.47B | -195.24B |
| Investing Activities Purchase Of Investments | -72.78B | -430.00M | -2.71B | N/A | -28.18B |
| Investing Activities Other Investing Activity | 2.19B | 140.00M | 130.00M | 90.00M | 22.55B |
| Investing Activities Investing Cash Flow | -274.75B | -138.38B | -98.88B | -11.04B | -256.04B |
| Financing Activities Long Term Debt Issuance | 187.28B | 39.90B | 7.01B | 141.97B | 141.05B |
| Financing Activities Long Term Debt Payments | -107.65B | -57.50B | -96.25B | -179.44B | -165.28B |
| Financing Activities Short Term Debt Issuance | -17.26B | -26.33B | 7.37B | -8.52B | 15.28B |
| Financing Activities Common Stock Issuance | -1.04B | -990.00M | -1.25B | -730.00M | 50.00M |
| Financing Activities Common Dividends | -7.78B | -6.67B | -8.90B | -6.67B | -2.22B |
| Financing Activities Other Financing Charges | -27.30B | -12.46B | 32.14B | 21.61B | 2.39B |
| Financing Activities Financing Cash Flow | 26.25B | -64.05B | -61.19B | -32.72B | -8.73B |
| End Cash Position | 97.95B | 118.10B | 128.38B | 116.39B | 83.39B |
| Free Cash Flow | 37.61B | 83.28B | 94.71B | 114.12B | 116.67B |
| Investing Activities Sale Of Investments | N/A | 18.99B | N/A | 45.89B | N/A |
| Financing Activities Common Stock Repurchase | N/A | N/A | -1.31B | -940.00M | 0.00 |
Source: Financial statements and regulatory filings
Technical Analysis
Key Insights
- Hindalco’s current trend shows a strong upward momentum with price action sustaining near all-time highs, indicating bullish sentiment in the near term.
- Key support levels are identified around ₹930 and ₹830, corresponding to the 50-day and 200-day moving averages respectively, while resistance is near the 52-week high of ₹1,048.70.
- The stock price is trading above its 10-day, 50-day (₹932.7), and 200-day (₹832.84) moving averages, reflecting a positive medium- and long-term trend.
- Momentum indicators show the RSI in a moderately overbought zone, MACD remains positive with a bullish crossover, and Stochastic oscillators indicate sustained buying pressure.
- Multi-timeframe analysis reveals consistent strength across daily, weekly, and monthly charts, supporting the current upward trajectory.
- Potential market scenarios include continuation of the uptrend if support levels hold, while a break below the 50-day moving average could signal consolidation or correction.
Trending News
1. Headline: Hindalco Share Price Highlights: Hindalco Stock Price History - The Economic Times
Summary: Welcome to the Hindalco Stock Liveblog, your real-time source for the latest updates and comprehensive analysis on a prominent stock. Dive into the current details of Hindalco, including: Last traded price 1039.0, Market capitalization: 233486.84, Volume: 4301884, Price-to-earnings ratio 14.52, ...
Sentiment: neutral
2. Headline: Indices are hovering in indecisiveness
Summary: Below 78,500-78700, it could retest 77,300-77,000 levels; above 78,700, it may rise up to 79,000-79,200
Sentiment: negative
3. Headline: Hindustan Copper, NALCO to SAIL: Why are mining and mineral stocks skyrocketing? Explained | Stock Market News
Summary: Indian metal stocks have shown significant recovery in April, with the Nifty Metal index rising 14.4%. Contributing factors include easing Middle East tensions, a weaker US dollar, and rising base metal prices, notably aluminium, which reached a four-year high amid supply concerns.
Sentiment: positive
4. Headline: LME aluminium to hit $4,000/ton? Indian stocks Vedanta, Hindalco upgraded
Summary: In the near term, Hindalco's stock has also performed well, comfortably exceeding the NIFTY 50 benchmark. On Thursday, shares of Vedanta closed nearly 2% at INR 781.10, while Hindalco closed at INR 1,040.25, up 2.9%. ... News and alerts!
Sentiment: positive
5. Headline: Strong Momentum Meets Stretched Valuations as Hindalco Industries Ltd Reaches All-Time High
Summary: On 15 April 2026, delivery volume reached 68.84 lakh shares, accounting for 59.73% of total volume, well above the trailing one-month average of 39.97 lakh shares. This heightened activity reflects strong market participation in the stock. ... Hindalco Industries Ltd is classified as a large-cap ...
Sentiment: positive
Recent Updates
News Summary
As of 2026-04-13. Hindalco Industries has recently placed a significant order with Texmaco Rail & Engineering valued at Rs 23.57 crore for rail equipment, reflecting the company's commitment to strengthening its logistics infrastructure. Concurrently, Hindalco is pursuing an expansion in its high-value aluminum product portfolio to capitalize on global supply shifts and rising demand from American manufacturing and green energy sectors. This strategic expansion aligns the company with sustainability trends but carries execution risks that could influence future growth. These developments highlight Hindalco's focus on operational efficiency and market positioning amid evolving industry dynamics.
News Sentiment
The overall sentiment from recent updates is cautiously positive, driven by strategic investments in infrastructure and product expansion initiatives. The Texmaco Rail order signals operational strengthening, while the aluminum portfolio growth aligns with favorable market trends. However, the noted execution risks associated with the expansion temper enthusiasm, suggesting measured optimism. The balance of these factors indicates a constructive but vigilant outlook on Hindalco's near-term prospects.
Analytical Overview
Analysis Summary
Hindalco’s valuation metrics, including a trailing P/E of 14.37 and forward P/E of 11.81, are broadly in line with the aluminum industry average of 14.37, indicating fair market pricing relative to earnings. The company’s revenue growth rate of 13.9% and positive operating cash flow trends demonstrate a solid growth trajectory supported by strong cash generation. Financial health appears stable with a total debt to equity ratio of 57.57% and robust free cash flow of INR 160.01 billion, suggesting manageable leverage and liquidity. Sector-specific opportunities include rising aluminum prices and demand driven by green energy and manufacturing shifts, while challenges encompass commodity price volatility and execution risks in expansion projects. Considering India-specific factors, regulatory environment stability and increasing domestic industrial demand support the company’s growth prospects.
Overall Business and Market Assessment
Supporting Factors: No data
Risk Factors: execution challenges in new product lines and sensitivity to commodity price fluctuations
SWOT Analysis
Strengths
- Hindalco has a diversified product portfolio across aluminum and copper segments.
- The company demonstrates strong cash flow generation and solid operating margins.
- Integrated operations from mining to downstream processing provide competitive advantage.
- Market leadership in India’s metals industry supports brand strength and scale.
Weaknesses
- Execution risks exist related to aluminum product expansion initiatives.
- Moderate debt levels with a debt-to-equity ratio of 57.57% may constrain flexibility.
- Profit margins are moderate compared to some industry peers.
- Dependence on commodity price cycles introduces earnings volatility.
Opportunities
- Rising global demand for lightweight and sustainable aluminum products.
- Expansion into high-value aluminum segments aligned with green energy trends.
- Favorable domestic industrial growth and infrastructure development in India.
- Potential for strategic partnerships to enhance supply chain efficiency.
Threats
- Volatility in global commodity prices could impact profitability.
- Regulatory changes in environmental and mining policies may increase costs.
- Competitive pressures from domestic and international metals producers.
- Execution delays or cost overruns in expansion projects could affect growth.
Company Description
Hindalco Industries Ltd. is a leading player in the metals and mining industry, known for its comprehensive operations in aluminum and copper production. As a flagship entity of the Aditya Birla Group, Hindalco plays a crucial role in the manufacture of aluminum products including ingots, billets, and rolled products, catering to diverse sectors such as automotive, packaging, and construction. Additionally, its copper division produces copper cathodes and continuous cast copper rods, serving industries like electrical and telecommunications. Hindalco's robust market presence is bolstered by its significant capacity and efficient processes, making it a vital contributor to India's industrial landscape. Its integrated value chain, from mining to smelting and downstream capabilities, underscores its strategic importance in the global metals market.