
Himadri Speciality Chemical Ltd (HSCL)
Stock Analysis Report
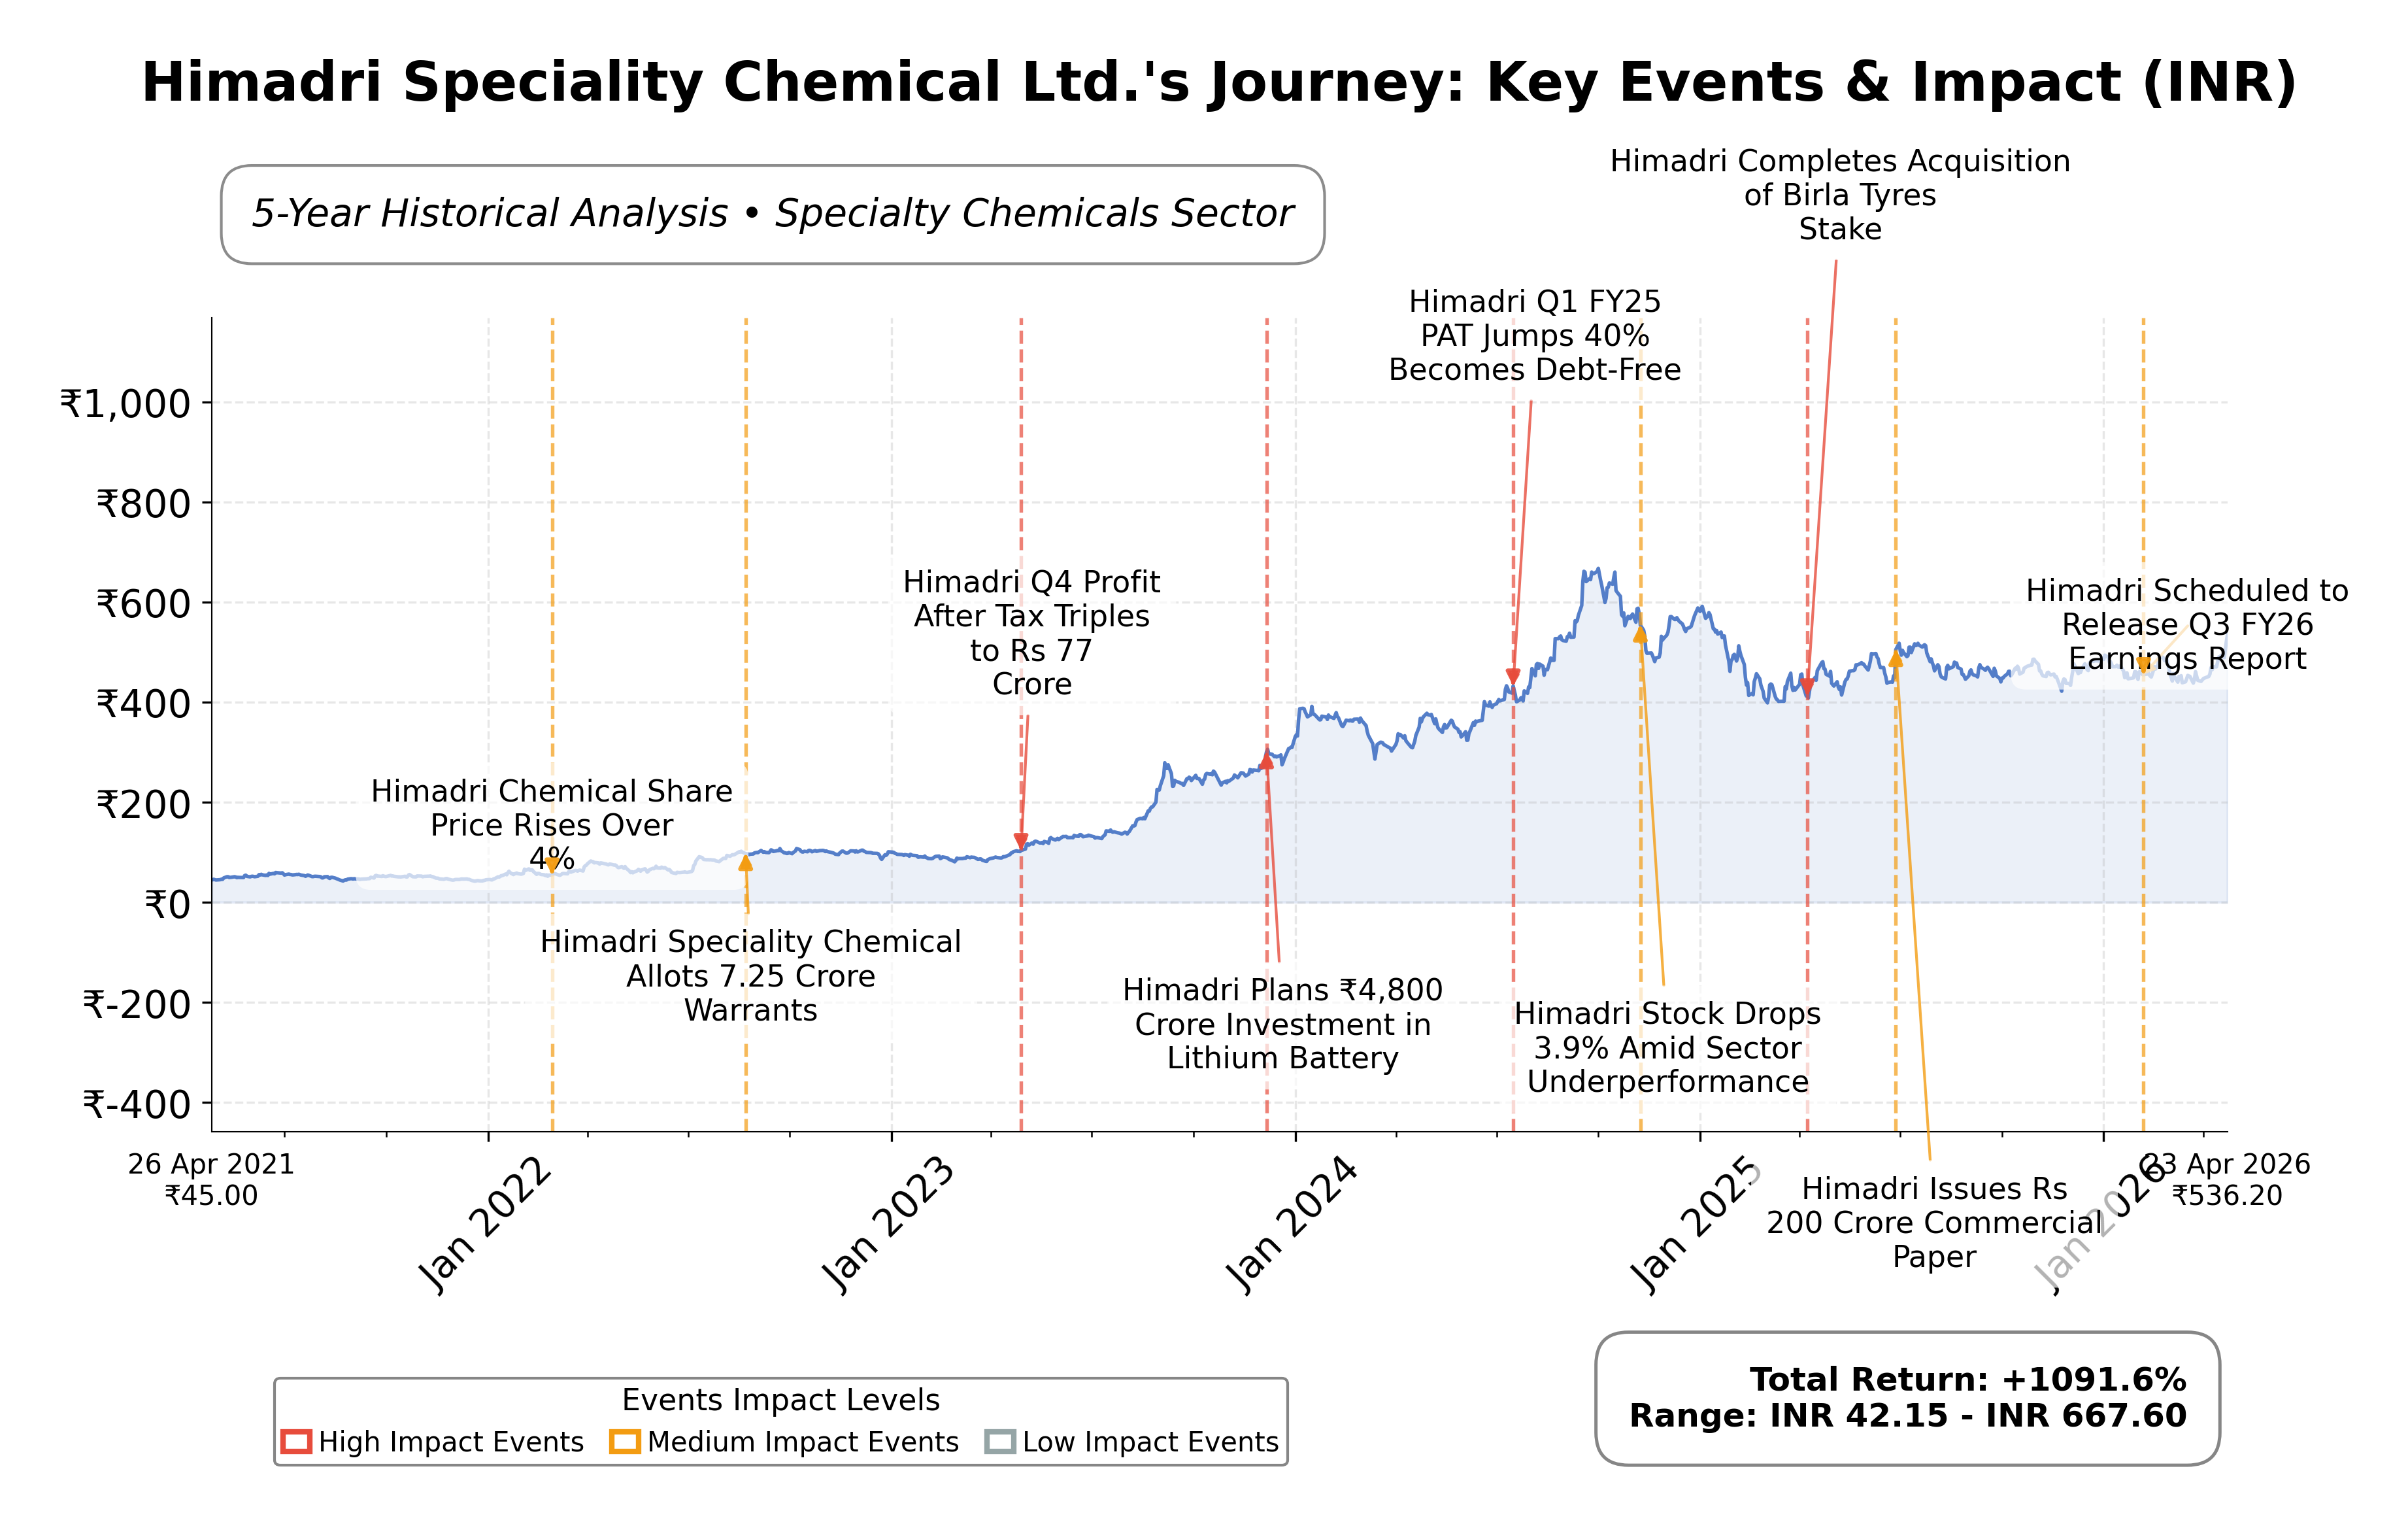
Stock Journey
Key Positives and Key Risks
Pros
- Net profit margin of 15.67% indicating strong profitability.
- Low debt-to-equity ratio of 0.21 reflecting financial stability.
- Return on equity of 14.73% demonstrating efficient capital use.
Cons
- High P/E ratio of 34.86 suggests premium valuation.
- Price-to-book ratio near 6.00 indicates expensive stock relative to book value.
- Limited institutional ownership at 6.19% may reduce external oversight.
Disclosure: This information is for general awareness and does not constitute investment advice
Report Summary
Himadri Speciality Chemical Ltd. (HSCL) is a diversified chemical manufacturing company listed on the NSE in India, operating within the Basic Materials sector, specifically the Specialty Chemicals industry. The company produces a broad range of carbon materials and chemical derivatives, serving key industries such as automotive, construction, aluminum smelting, and renewable energy. Its product portfolio includes carbon black, coal tar pitch, and specialty oils, with recent strategic expansion into lithium-ion battery components, reflecting its innovative and sustainability-focused market positioning.
Financially, Himadri reported trailing twelve months (TTM) revenue of approximately INR 45.08 billion, with a gross margin of 37.39%, operating margin of 19.87%, and net profit margin of 15.67%, indicating solid profitability and operational efficiency. The company’s return on equity (ROE) stands at 14.73%, and return on assets (ROA) at 11.93%, demonstrating effective capital utilization and asset management. Its EBITDA for the TTM is INR 10.35 billion, supported by robust operating cash flow of INR 8.67 billion and free cash flow of INR 5.56 billion, underscoring healthy cash generation.
Valuation metrics show a trailing price-to-earnings (P/E) ratio of 34.86 and a forward P/E of 29.38, with a price-to-book (P/B) ratio near 6.00 and an enterprise value to EBITDA (EV/EBITDA) multiple of 25.96. The market capitalization is approximately INR 249.02 billion. The stock currently trades at INR 563.70, near its 52-week high of INR 534.45, reflecting a premium relative to its fundamentals but supported by growth prospects and recent strong earnings performance.
Key strengths include a strong balance sheet with a current ratio of 3.56, low debt-to-equity ratio of 0.21, and significant cash reserves of INR 6.94 billion. The company’s leadership in specialty chemicals, recent capacity expansions in lithium-ion battery anode materials, and consistent earnings growth are notable positives. Risks involve sector-specific regulatory challenges, competitive pressures in specialty chemicals, and macroeconomic factors affecting raw material costs. Recent strategic actions include launching a new anode material facility and reappointing independent directors, reflecting governance stability.
Technically, the stock shows a positive momentum with recent price surges to record highs, supported by strong volume and favorable quarterly earnings. The price is above key moving averages, and momentum indicators suggest sustained strength across multiple timeframes. Market conditions appear conducive to continued interest, warranting close observation of evolving technical signals and fundamental developments.
Company and Industry Overview
Company Basics
Price Performance
Company Size
Shareholding Pattern
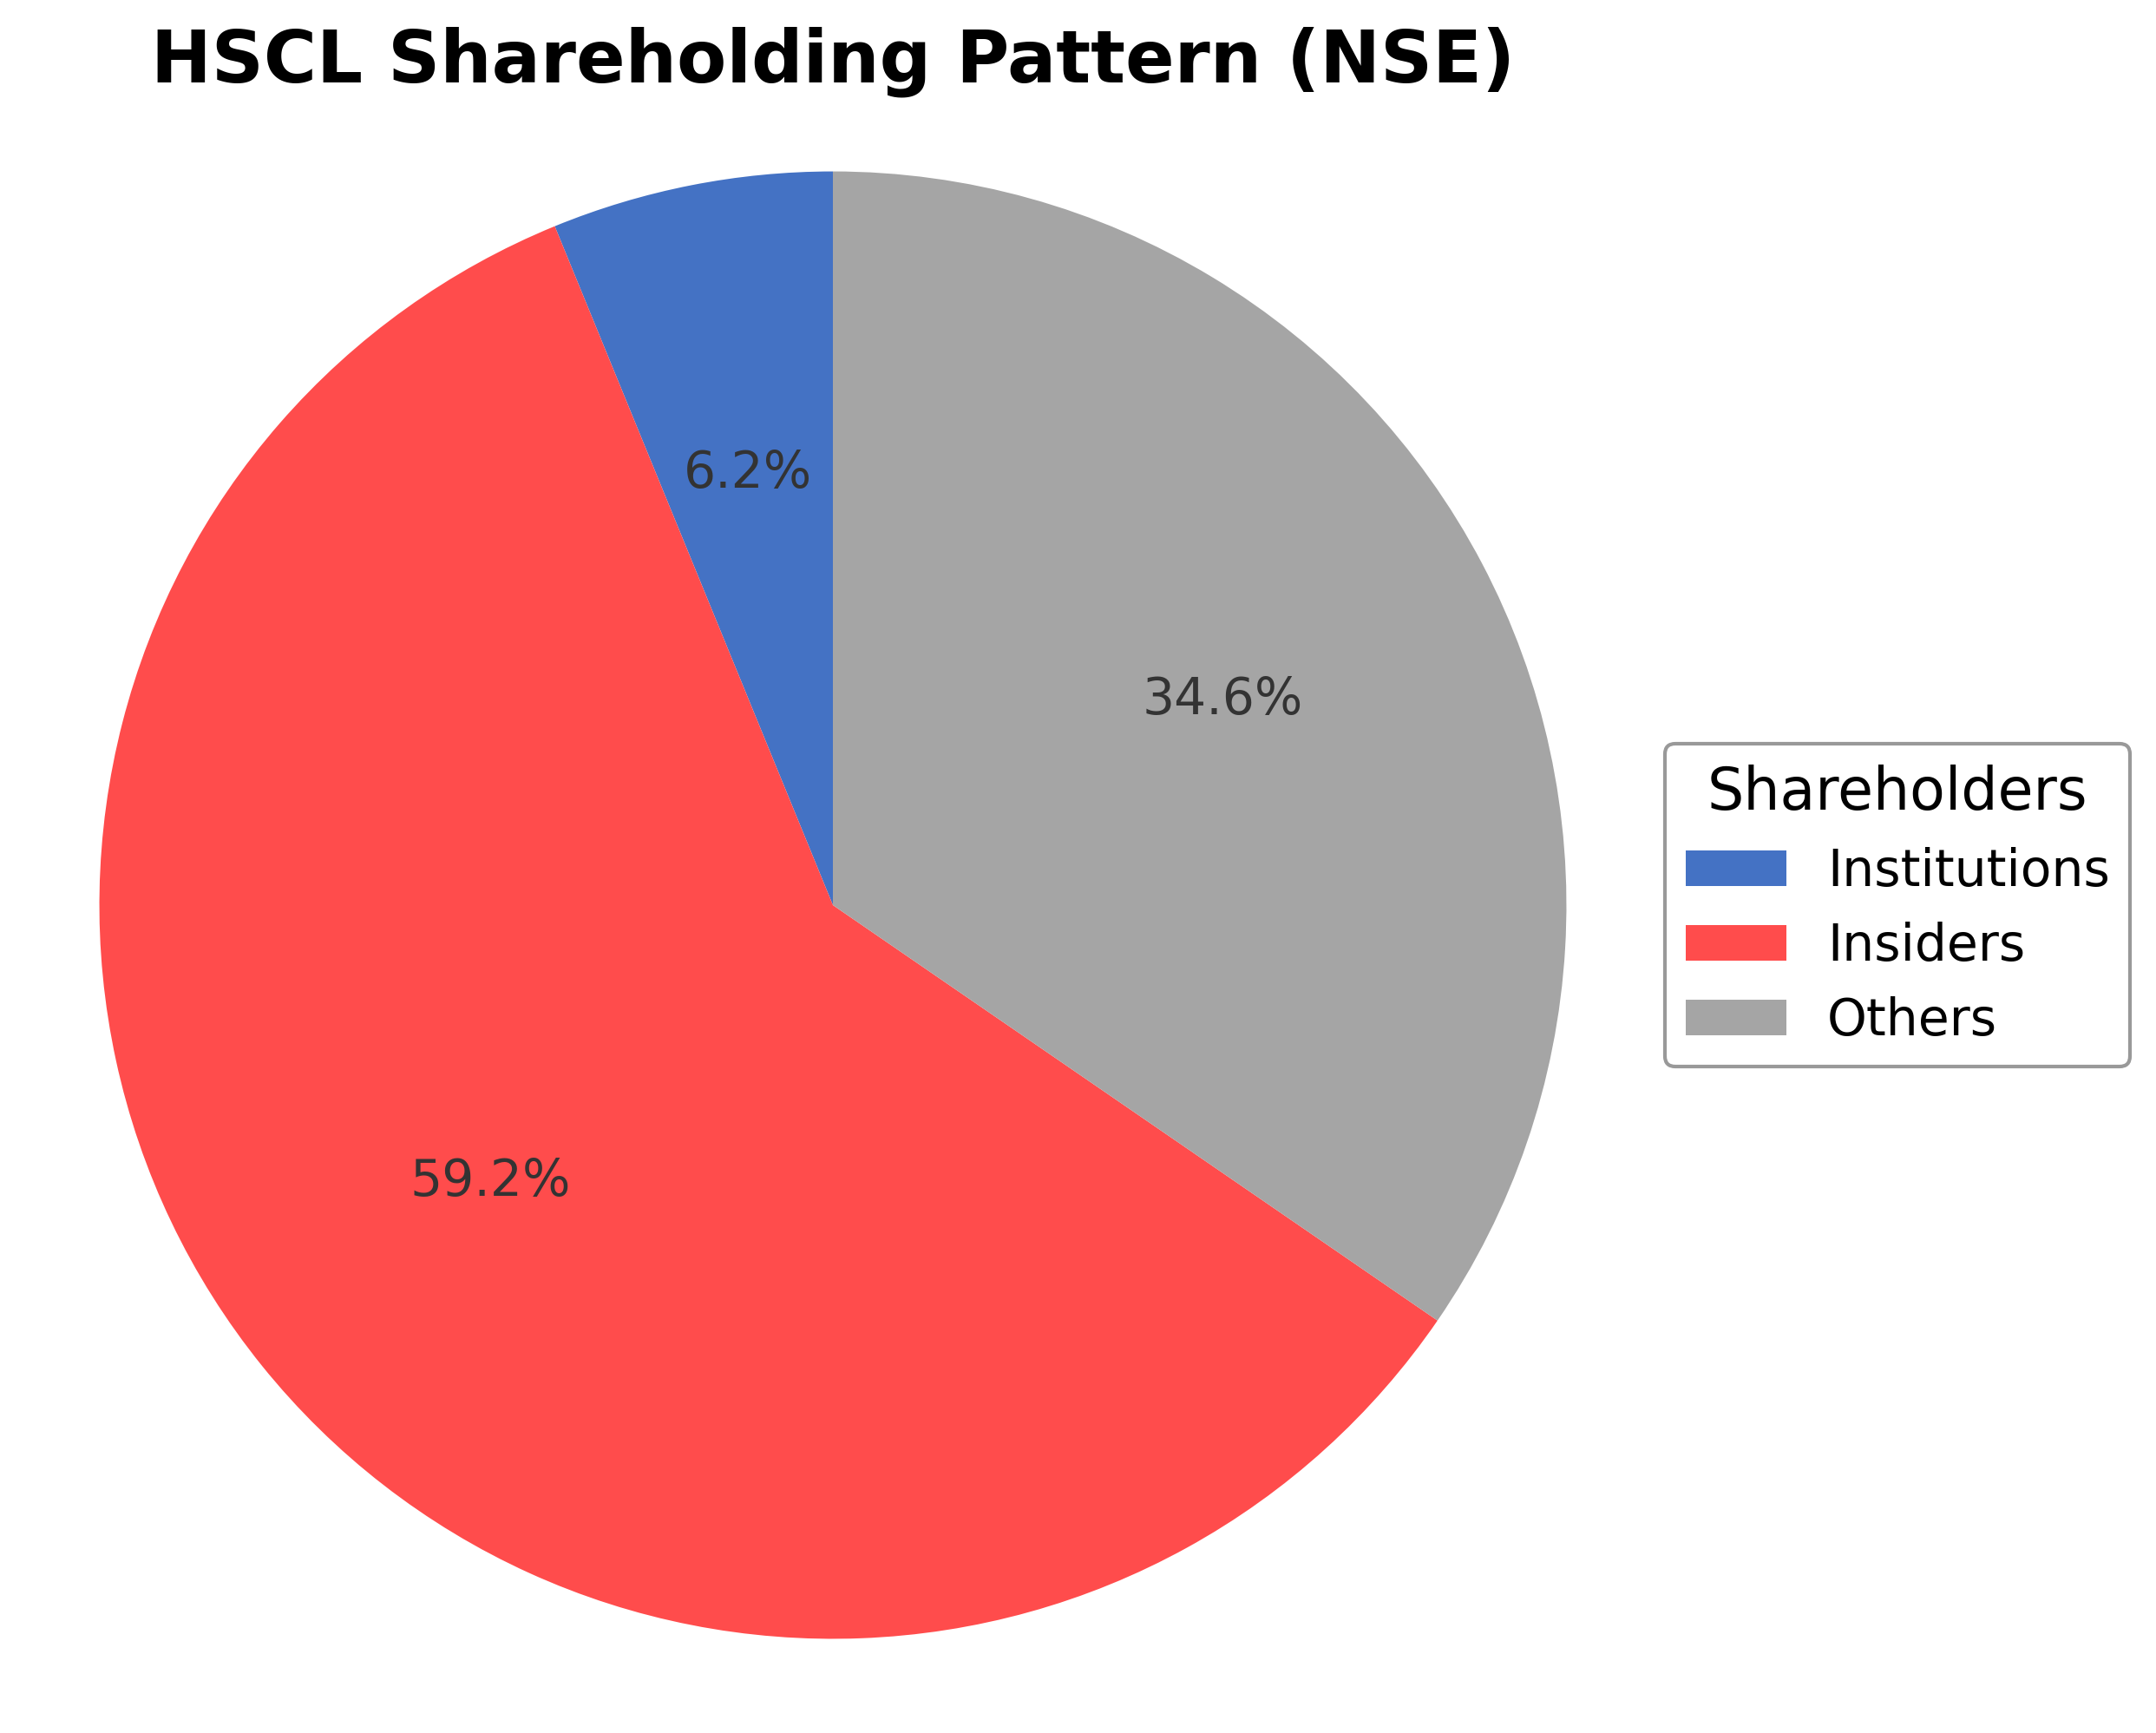
Himadri Speciality Chemical Ltd.'s ownership structure is predominantly held by insiders, including executives and board members, accounting for approximately 59.23% of shares, reflecting strong promoter control. Institutional investors hold about 6.19%, indicating moderate institutional interest, while the public and other shareholders constitute the remaining 34.58%. Over the past 12 to 24 months, there has been a modest increase in promoter holdings, suggesting confidence in the company's strategic direction. Institutional accumulation has been steady but limited, with no significant shifts reported among major mutual funds or asset managers. This shareholding pattern indicates a governance framework with concentrated promoter influence balanced by a diverse public shareholder base, which may support consistent strategic execution and shareholder alignment.
Sector and Industry Analysis
The specialty chemicals sector in India has witnessed robust growth driven by increasing demand from end-user industries such as automotive, electronics, construction, and agriculture. The market size has expanded significantly over the past decade, supported by rising industrialization and export opportunities. Key players include companies specializing in carbon materials, battery chemicals, and performance additives, with Himadri Speciality Chemical Ltd. being a notable participant given its diversified product portfolio and strong market capitalization.
Industry trends highlight a shift towards high-value specialty chemicals like battery materials and carbon black, catering to emerging sectors such as lithium-ion batteries and electric vehicles. Competitive dynamics are shaped by technological innovation, scale of operations, and integration across the value chain, which create significant barriers to entry. Companies with established R&D capabilities and diversified end-market exposure, such as Himadri, are positioned to capitalize on evolving demand patterns and maintain profitability amid fluctuating raw material costs.
The regulatory environment for specialty chemicals in India involves stringent environmental and safety standards, impacting manufacturing processes and product formulations. Compliance with hazardous waste management and emissions norms is critical, influencing capital expenditure and operational costs. Government initiatives promoting domestic manufacturing and export incentives provide a supportive backdrop, while ongoing regulatory scrutiny ensures adherence to global quality and sustainability benchmarks, shaping the sector’s growth trajectory.
Note: Analysis synthesized from industry research, market reports, and regulatory filings. Information is subject to change based on market conditions.
Financial Ratios Dashboard
Illustrative Scenario Analysis
DCF Assumptions:
Method: Two-Stage EPS-Priority Model
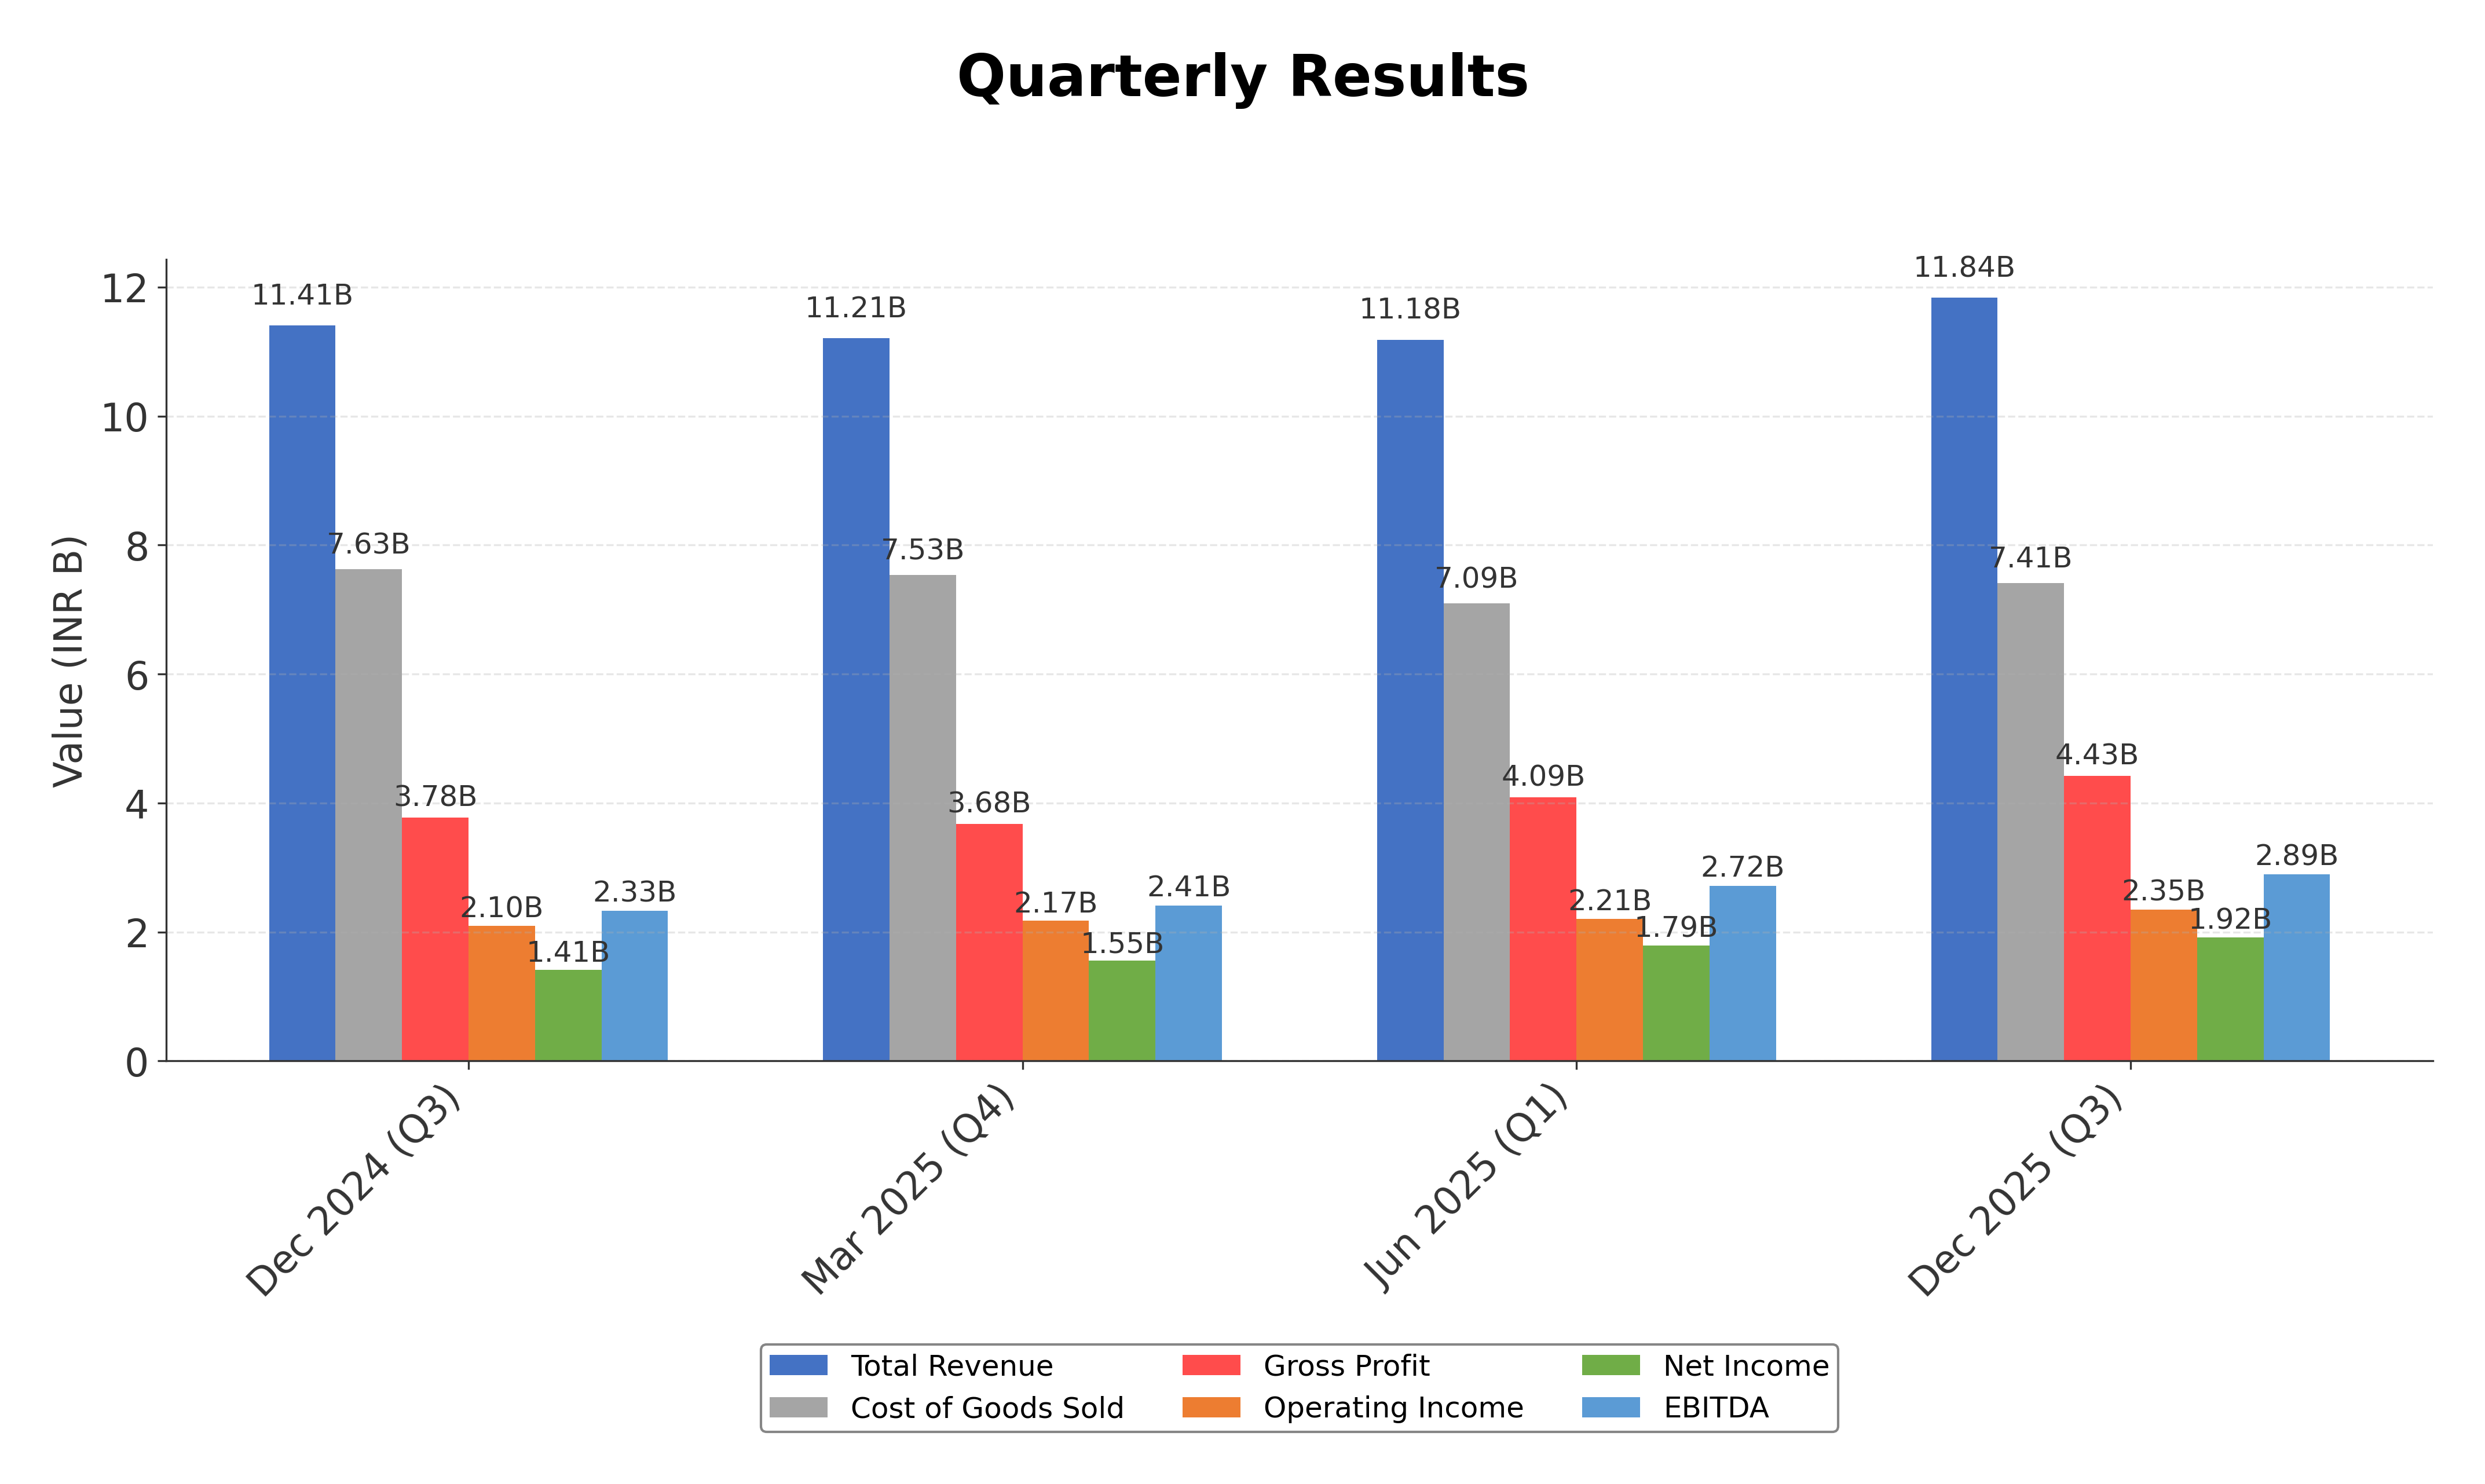
Financials
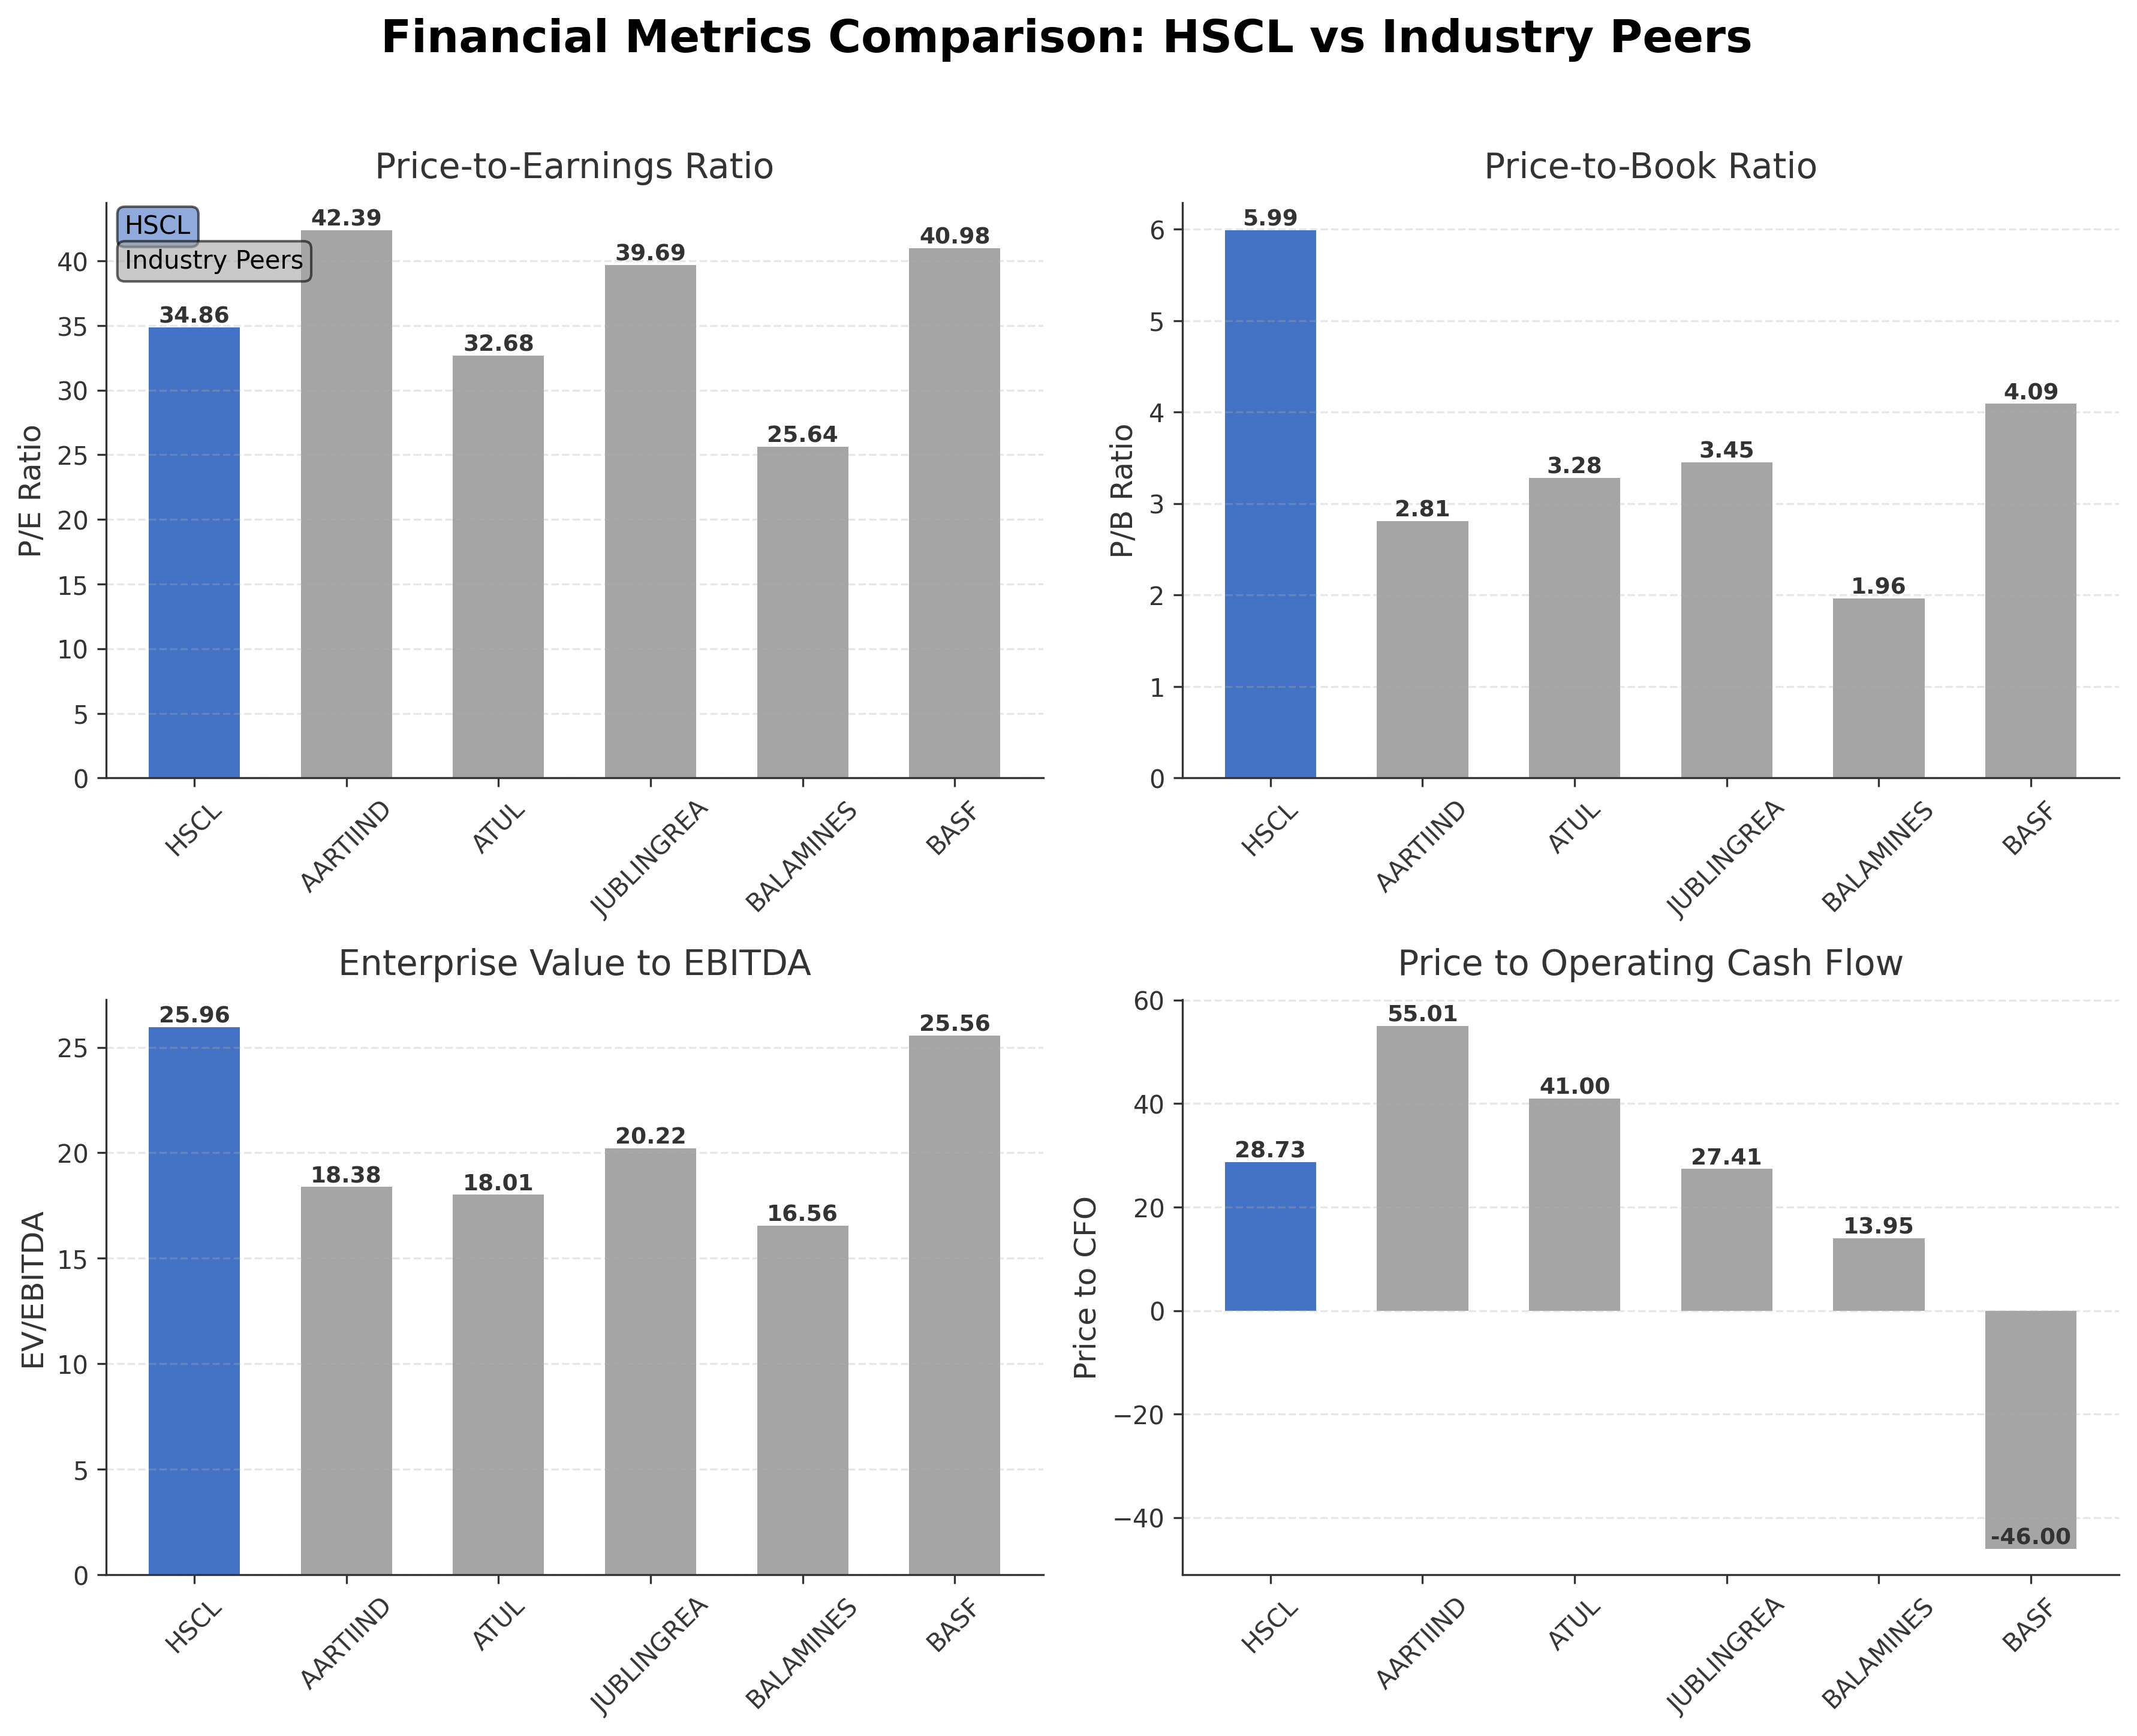
Peer Analysis
| Company Name | Market Cap | P/E Ratio | P/B Ratio | EV/EBITDA | Price to CFO |
|---|---|---|---|---|---|
| Himadri Speciality Chemical Ltd. | ₹249.02B | 34.86 | 5.99 | 25.96 | 28.73 |
| Aarti Industries Ltd. | ₹160.06B | 42.39 | 2.81 | 18.38 | 55.01 |
| Atul Ltd. | ₹194.32B | 32.68 | 3.28 | 18.01 | 41.00 |
| Jubilant Ingrevia Ltd. | ₹104.91B | 39.69 | 3.45 | 20.22 | 27.41 |
| Balaji Amines Ltd. | ₹36.91B | 25.64 | 1.96 | 16.56 | 13.95 |
| BASF India Ltd. | ₹160.27B | 40.98 | 4.09 | 25.56 | -46.00 |
Comparison Analysis: Himadri Speciality Chemical Ltd. exhibits a higher P/E ratio of 34.86 compared to several peers, reflecting a relatively premium valuation. Its P/B ratio at 5.99 is notably above the peer group average, indicating market expectations of strong asset productivity or growth. The EV/EBITDA multiple of 25.96 is among the highest, suggesting a premium on operating earnings. Return on equity at 14.73% surpasses most peers, highlighting superior profitability and capital efficiency. However, the price to CFO ratio of 28.73 is moderate relative to peers, with some like Aarti Industries showing significantly higher values. Overall, Himadri stands out for its profitability metrics but trades at a premium valuation relative to its industry counterparts.
Financial Metrics Comparison with Peers
Financial Statements
Comprehensive financial data including income, balance sheet, and cash flow metrics
Income Statement
| fiscal_date | 2025-03-31 | 2024-03-31 | 2023-03-31 | 2022-03-31 | 2021-03-31 |
|---|---|---|---|---|---|
| Sales | 45.99B | 41.85B | 41.72B | 27.91B | 16.79B |
| Cost Of Goods | 31.56B | 30.39B | 32.61B | 22.55B | 12.39B |
| Gross Profit | 14.43B | 11.45B | 9.11B | 5.36B | 4.40B |
| Operating Expense Selling General And Administrative | 2.59B | 71.07M | 64.06M | 55.70M | 51.02M |
| Operating Expense Other Operating Expenses | 1.84B | 3.76B | 3.89B | 2.84B | 2.24B |
| Operating Income | 7.92B | 5.86B | 3.68B | 1.13B | 839.49M |
| Non Operating Interest Income | 438.96M | 361.54M | 175.79M | 27.50M | 46.45M |
| Non Operating Interest Expense | 408.29M | 577.99M | 489.80M | 292.56M | 310.94M |
| Pretax Income | 8.06B | 5.74B | 2.80B | 534.65M | 645.61M |
| Income Tax | 2.51B | 1.63B | 643.91M | 144.10M | 172.95M |
| Net Income | 5.55B | 4.11B | 2.16B | 390.55M | 472.66M |
| Eps Basic | 11.26 | 9.16 | 5.13 | 0.98 | 1.13 |
| Eps Diluted | 11.17 | 9.16 | 5.13 | 0.98 | 1.13 |
| Basic Shares Outstanding | 493.51M | 448.36M | 420.91M | 418.97M | 418.81M |
| Diluted Shares Outstanding | 493.51M | 448.36M | 420.91M | 418.97M | 418.81M |
| Ebit | 8.47B | 6.32B | 3.29B | 827.22M | 956.56M |
| Ebitda | 8.98B | 6.78B | 4.05B | 1.56B | 1.41B |
| Net Income Continuous Operations | 8.06B | 5.74B | 2.80B | 534.65M | 645.61M |
| Minority Interests | 5.34M | 898.00K | 1.18M | 18.92M | 2.11M |
| Preferred Stock Dividends | 0.00 | 0.00 | 0.00 | 0.00 | 0.00 |
Source: Financial statements and regulatory filings
Balance Sheet
| fiscal_date | 2025-03-31 | 2024-03-31 | 2023-03-31 | 2022-03-31 | 2021-03-31 |
|---|---|---|---|---|---|
| Cash And Cash Equivalents | 501.06M | 2.15B | 2.00B | 1.73B | 526.74M |
| Accounts Receivable | 6.33B | 6.56B | 5.05B | 5.05B | 4.61B |
| Total Assets | 46.56B | 44.49B | 36.78B | 34.54B | 27.91B |
| Total Liabilities | 8.85B | 14.06B | 14.00B | 15.89B | 9.99B |
| Long Term Debt | 56.45M | 246.34M | 527.27M | 987.58M | 914.57M |
| Shareholders Equity | 37.71B | 30.43B | 22.78B | 18.65B | 17.92B |
Source: Financial statements and regulatory filings
Cash Flow Statement
| fiscal_date | 2025-03-31 | 2024-03-31 | 2023-03-31 | 2022-03-31 | 2021-03-31 |
|---|---|---|---|---|---|
| Operating Activities Net Income | 8.06B | 5.74B | 2.80B | 534.65M | 645.61M |
| Operating Activities Other Non Cash Items | 8.77M | 277.13M | 500.99M | 343.54M | 305.65M |
| Operating Activities Accounts Receivable | 270.05M | -1.50B | 24.90M | -425.57M | -1.66B |
| Operating Activities Other Assets Liabilities | 327.33M | -2.25B | 1.54B | -4.04B | 696.73M |
| Operating Activities Operating Cash Flow | 8.67B | 2.26B | 4.87B | -3.58B | -10.43M |
| Investing Activities Capital Expenditures | -1.71B | -522.55M | -756.71M | -230.87M | -349.93M |
| Investing Activities Net Intangibles | -2.50M | -3.87M | -6.28M | 0.00 | -1.32M |
| Investing Activities Purchase Of Investments | -6.29B | -9.38B | -4.18B | -932.71M | -3.50B |
| Investing Activities Sale Of Investments | 5.16B | 5.55B | 950.20M | 866.58M | 2.69B |
| Investing Activities Investing Cash Flow | -2.83B | -4.36B | -3.99B | -297.00M | -1.15B |
| Financing Activities Long Term Debt Issuance | 0.00 | 27.01M | 0.00 | 502.66M | 1.29B |
| Financing Activities Long Term Debt Payments | -328.51M | -616.82M | -393.61M | -1.94B | -1.95B |
| Financing Activities Short Term Debt Issuance | -2.62B | -1.81B | 2.79B | -1.51B | 2.79B |
| Financing Activities Common Stock Issuance | 924.43M | 3.19B | 1.98B | 0.00 | 2.99M |
| Financing Activities Common Dividends | -246.76M | -108.19M | -83.87M | -62.84M | -62.82M |
| Financing Activities Other Financing Charges | -323.00K | 37.49M | -1.41M | 19.43M | -45.48M |
| Financing Activities Financing Cash Flow | -2.28B | 715.80M | 4.29B | -2.98B | 2.03B |
| End Cash Position | 1.55B | 2.15B | 2.08B | 1.73B | 527.17M |
| Free Cash Flow | 2.76B | 3.52B | -291.90M | 3.08B | -755.51M |
| Operating Activities Stock Based Compensation | N/A | N/A | 0.00 | 3.02M | 5.09M |
Source: Financial statements and regulatory filings
Technical Analysis
Key Insights
- The current trend for Himadri Speciality Chemical Ltd. is bullish, with the stock price recently reaching new 52-week highs and exhibiting strong upward momentum.
- Key support levels are identified near ₹460, coinciding with the 50-day and 200-day moving averages, while resistance is currently around the recent high of ₹604.75.
- The stock price is trading above the 10-day, 50-day, and 200-day moving averages, indicating sustained positive momentum across short, medium, and long-term timeframes.
- Momentum indicators show the RSI in the upper range, suggesting strength but nearing overbought conditions; MACD remains positive, confirming upward momentum; stochastic oscillators also indicate bullish momentum.
- Analysis across daily, weekly, and monthly charts confirms a consistent uptrend with increasing volume, supporting the strength of the price movement.
- Potential market scenarios include continuation of the uptrend if support levels hold, while a break below key moving averages could signal consolidation or correction phases.
Trending News
1. Headline: Volumes soar at Himadri Speciality Chemical Ltd counter | Capital Market News - Business Standard
Summary: Himadri Speciality Chemical Ltd recorded volume of 682.29 lakh shares by 14:14 IST on NSE, a 17.34 times surge over two-week average daily volume of 39.35 lakh shares · Inventurus Knowledge Solutions Ltd, Atul Ltd, Cochin Shipyard Ltd, IDBI Bank Ltd are among the other stocks to see a surge ...
Sentiment: positive
Summary: Top Trending Stocks: SBI Share Price, Axis Bank Share Price, HDFC Bank Share Price, Infosys Share Price, Wipro Share Price, NTPC Share Price...moreless · (You can now subscribe to our ETMarkets WhatsApp channel) ... himadri specialityhimadri speciality chemicalhimadri speciality shareshimadri speciality share pricehimadri specialityhimadri speciality q4 resultsmarkets news...
Sentiment: positive
3. Headline: Why Himadri Speciality Chemical Share Price is Rising
Summary: Himadri Speciality Chemical surges 10% in a day. Here's why the stock is in focus.
Sentiment: positive
4. Headline: Himadri Speciality Chemical Ltd leads gainers in 'A' group | Capital Market News - Business Standard
Summary: Himadri Speciality Chemical Ltd soared 6.93% to Rs 573.4 at 11:47 IST. The stock was the biggest gainer in the BSE's 'A' group.
Sentiment: positive
Summary: Himadri Speciality said it has decided to remain firmly focused on disciplined capital allocation to drive sustainable returns and maintain a robust ROCE profile.
Sentiment: positive
Recent Updates
News Summary
As of April 24, 2026. Himadri Speciality Chemical Ltd reported strong Q4 FY26 financial results, with net profit rising 29% year-on-year to INR 201 crore and revenue increasing 13.5% to INR 1,288 crore. EBITDA for the quarter grew 21% to INR 280 crore, reflecting operational efficiency. The company also launched its first anode material production facility in West Bengal with an initial capacity of 200 MTA, marking a significant step in its lithium-ion battery components business. For the full fiscal year 2026, consolidated profit after tax attributable to shareholders reached INR 751 crore, a 35% increase from the prior year, alongside a modest revenue growth of over 1%. The board approved the reappointment of two independent directors and plans to establish a foreign wholly owned subsidiary in Guangzhou, China, subject to regulatory approvals. These developments underscore Himadri's strategic focus on capacity expansion, innovation, and governance stability.
News Sentiment
The overall sentiment from recent updates is predominantly positive, driven by strong quarterly and annual earnings growth, successful capacity expansion, and strategic initiatives such as the launch of a new anode material facility. The company's disciplined capital allocation and governance actions, including director reappointments and international expansion plans, contribute to a constructive outlook. Neutral tones arise from dividend declarations and routine corporate governance matters, while no significant negative news was reported. This balanced sentiment reflects confidence in the company’s operational execution and growth trajectory.
Source List
- https://m.economictimes.com/markets/stocks/news/himadri-speciality-shares-rally-13-to-fresh-record-high-after-q4-earnings-launch-of-new-facility-do-you-own/articleshow/130487851.cms
- https://www.cnbctv18.com/market/stocks/himadri-speciality-share-price-q4-results-net-profit-surges-29-on-higher-revenue-declares-dividend-ws-l-19892132.htm
- https://www.tipranks.com/news/company-announcements/himadri-speciality-chemical-posts-record-fy26-results-and-expands-mahistikry-capacity
Analytical Overview
Analysis Summary
Himadri Speciality Chemical Ltd.'s valuation metrics, including a trailing P/E of 34.86 and forward P/E of 29.38, are slightly elevated compared to the industry average P/E of 34.86, but the PEG ratio of 0.87 suggests reasonable valuation relative to growth. The company demonstrates a positive growth trajectory with a quarterly revenue growth of 3.8% and a 35% year-on-year increase in net income for FY26, supported by strong cash flow generation with operating cash flow of INR 8.67 billion and free cash flow of INR 5.56 billion. Financial health appears robust, with a low debt-to-equity ratio of 0.21, a high current ratio of 3.56, and substantial cash reserves of nearly INR 6.94 billion, indicating liquidity strength. Sector-specific opportunities include expanding demand for lithium-ion battery materials and specialty chemicals, while challenges may arise from regulatory compliance and raw material price volatility. Considering the Indian market context, regulatory frameworks and growing industrial demand for sustainable materials support the company’s strategic positioning.
Overall Business and Market Assessment
Supporting Factors: Key supporting factors include strong profitability with a 15.67% net margin, consistent revenue and earnings growth, and strategic capacity expansions in high-growth segments such as lithium-ion battery components. Risks to monitor involve potential regulatory changes and competitive pressures within the specialty chemicals sector. The appropriate investment timeframe aligns with medium to long-term horizons to capture benefits from ongoing capacity additions and market developments. Overall, the company presents a balanced risk-reward profile with solid fundamentals tempered by valuation premiums.
Risk Factors: No data
SWOT Analysis
Strengths
- Strong profitability with net profit margin of 15.67%.
- Robust balance sheet featuring a low debt-to-equity ratio of 0.21.
- Consistent revenue and earnings growth supported by operational efficiency.
- Strategic capacity expansions in lithium-ion battery materials and specialty chemicals.
Weaknesses
- Relatively high valuation multiples compared to industry peers.
- Limited institutional investor holding at 6.19%, indicating moderate external scrutiny.
- Dependence on raw material prices which may impact margins.
- Dividend yield is low at approximately 0.12%, limiting income appeal.
Opportunities
- Growing demand for lithium-ion battery components globally.
- Expansion into new geographic markets including China via subsidiary plans.
- Increasing industrial focus on sustainable and specialty chemical products.
- Potential to leverage in-house R&D for innovative product development.
Threats
- Regulatory risks related to environmental and chemical manufacturing standards.
- Competitive pressures from domestic and international specialty chemical producers.
- Macroeconomic factors affecting raw material availability and costs.
- Volatility in currency and trade policies impacting export potential.
Company Description
Himadri Speciality Chemical Ltd. is a diversified chemical manufacturing company known primarily for its production of carbon materials and chemical derivatives. Headquartered in India, the company's operations encompass a wide array of sectors, ranging from aluminum smelting to lithium-ion batteries, reflecting its integral role in various industrial applications. As a prominent player in the specialty chemicals sector, Himadri Speciality Chemical Ltd. leverages technologic expertise to offer a broad spectrum of products, including carbon black, coal tar pitch, and specialty oils. The company contributes significantly to the automotive, construction, and renewable energy industries, with its high-performance materials essential in the manufacture of tires, aluminum, and advanced energy storage solutions. Himadri's innovation-driven approach and sustainability initiatives have positioned it as a significant contributor to industrial development and environmental stewardship, both domestically and globally. It continues to enhance its capabilities and expand its footprint in the high-growth specialty chemicals market.