


HG Infra Engineering Ltd (HGINFRA)
Stock Analysis Report
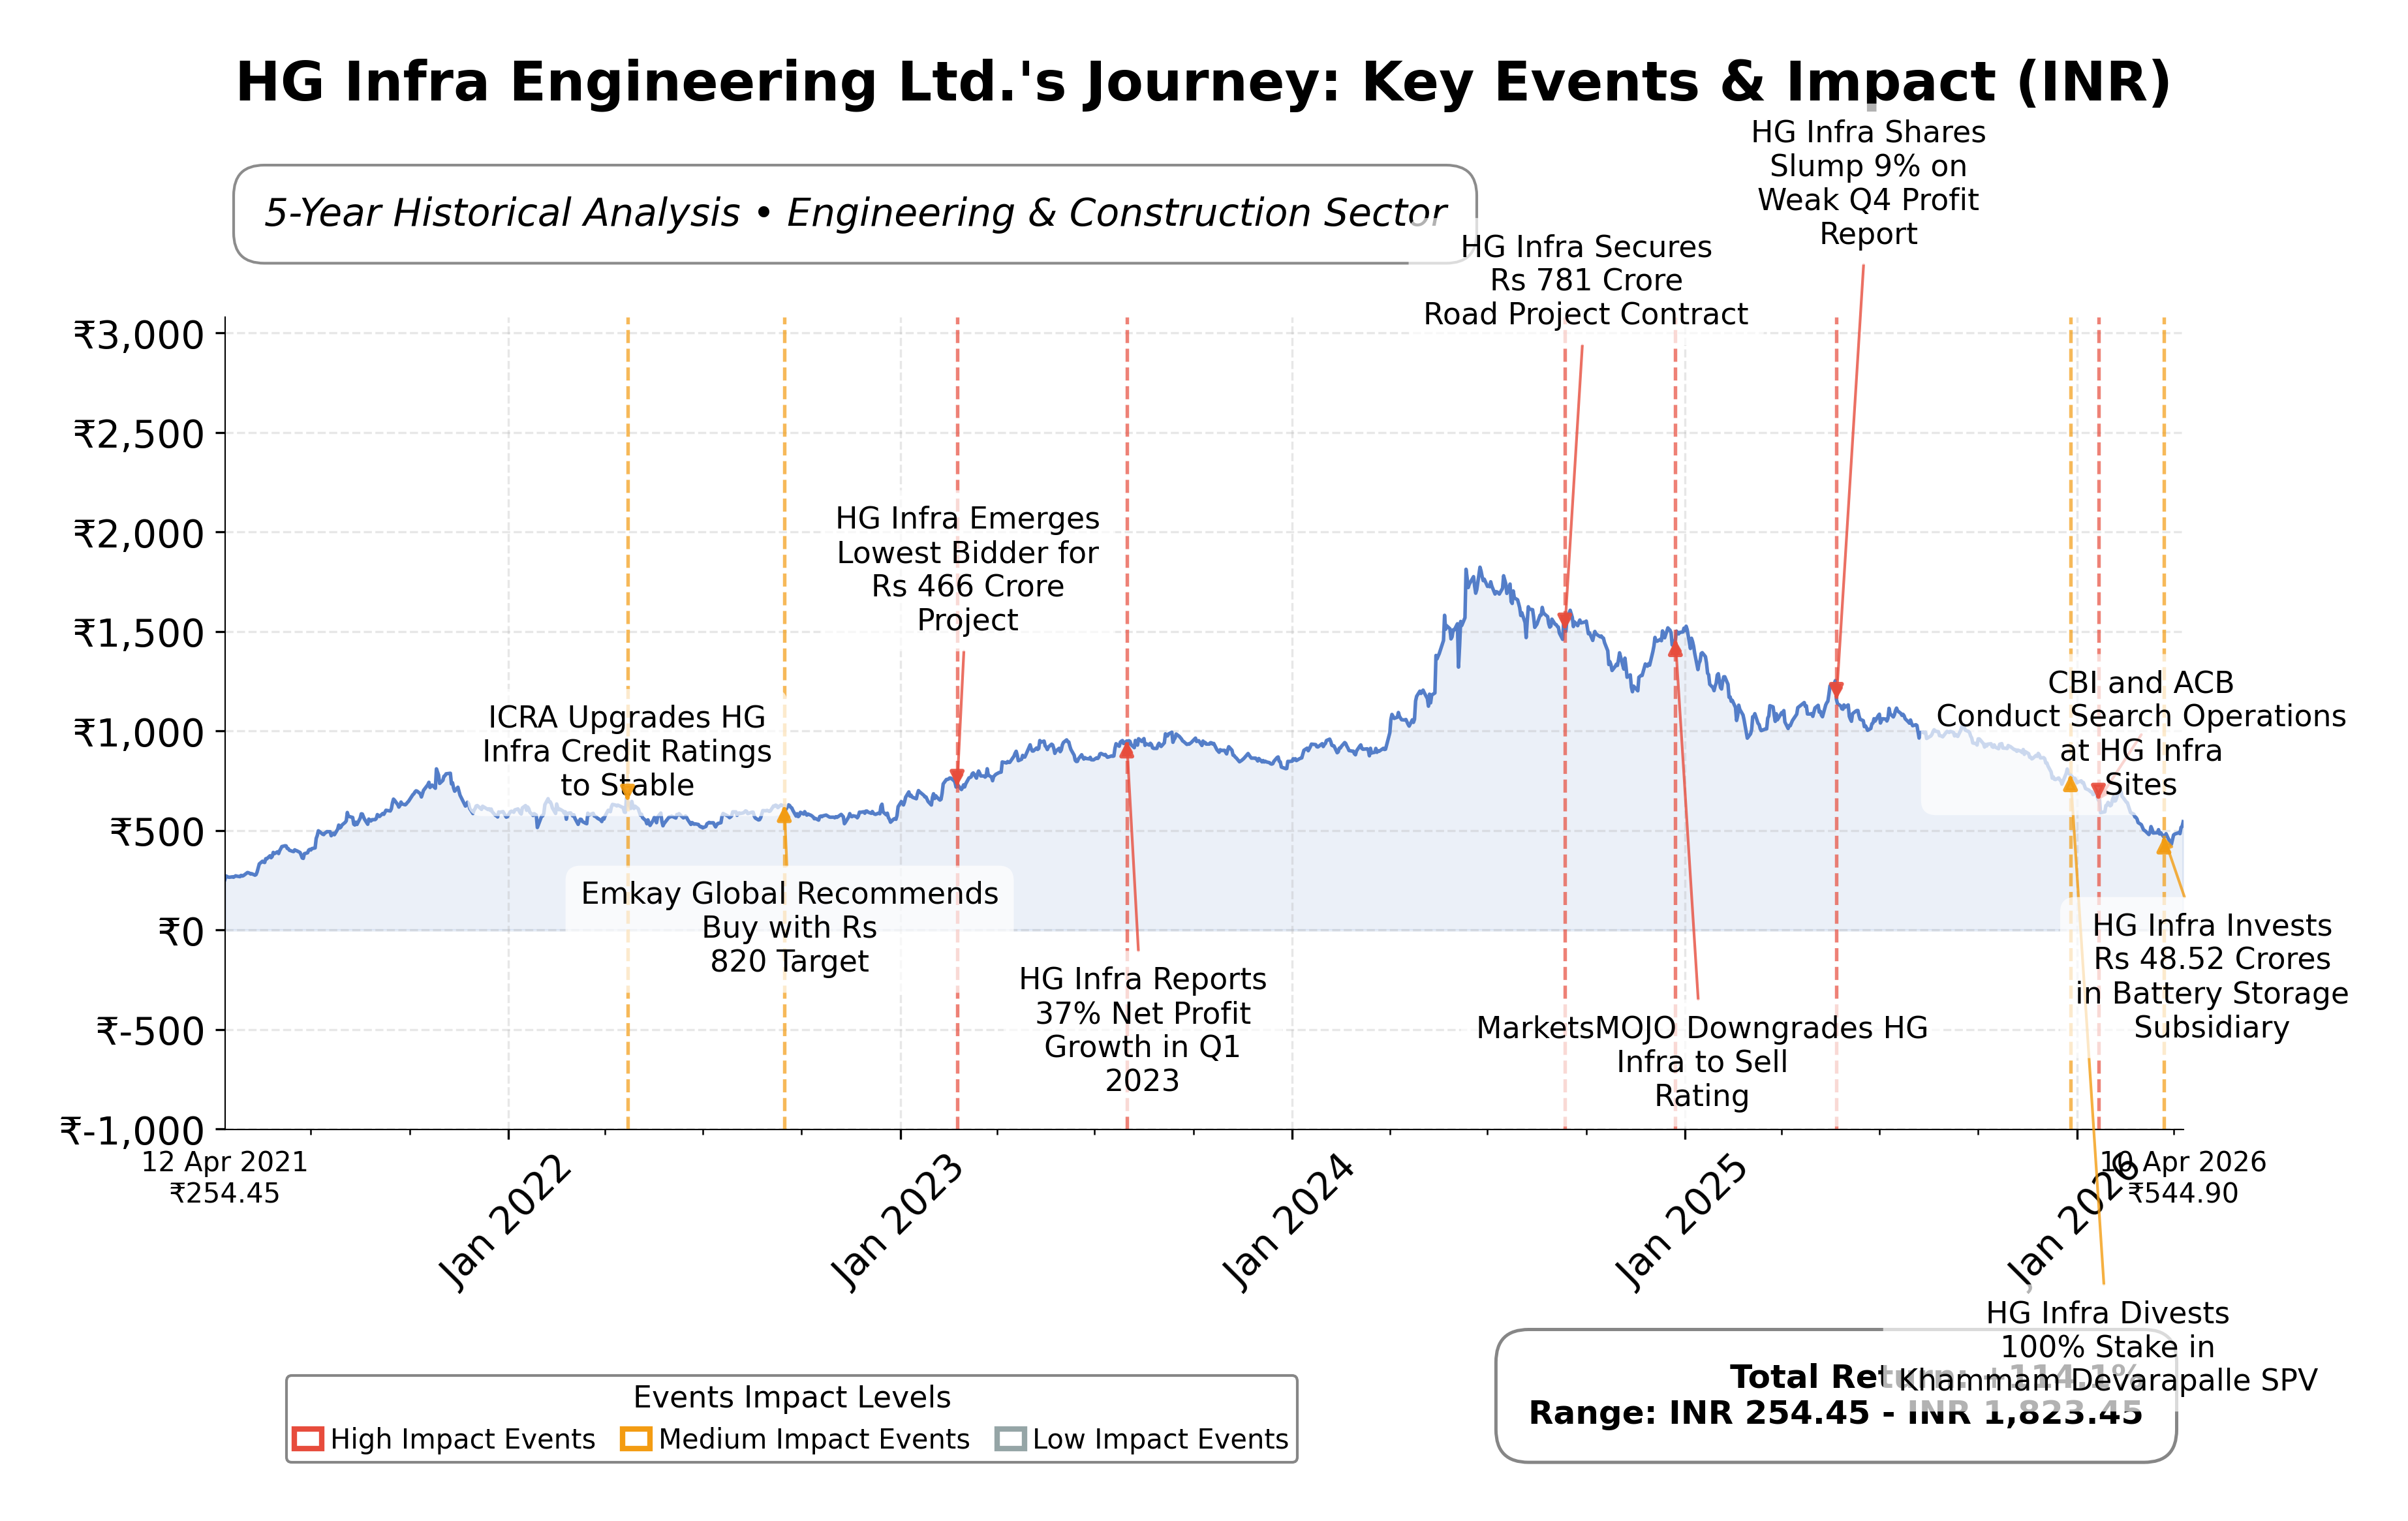
Stock Journey
Key Positives and Key Risks
Pros
- Attractive valuation with a trailing P/E of 9.04 and forward P/E of 6.48, below industry average of 9.04, indicating potential undervaluation.
- Strong return on equity at 17.14%, reflecting efficient use of shareholder capital.
- Consistent revenue growth with a quarterly increase of 12.4%, supporting business expansion.
Cons
- High debt-to-equity ratio of 182.68, indicating significant leverage and potential financial risk.
- Negative operating cash flow of INR -12.9 billion over the trailing twelve months, suggesting liquidity challenges.
- Price to cash flow ratio is negative (-2.76), highlighting operational cash flow concerns.
Disclosure: This information is for general awareness and does not constitute investment advice
Report Summary
HG Infra Engineering Ltd. is a prominent Indian infrastructure company specializing in the construction and development of roads, highways, water pipelines, airport runways, and railway projects. Operating primarily on the NSE exchange within the Industrials sector, the company delivers comprehensive engineering, procurement, and construction (EPC) services. Its strategic presence in Rajasthan and participation in both government tenders and private projects position it as a key player in India's infrastructure development landscape.
Financially, HG Infra reported trailing twelve months (TTM) revenue of approximately INR 51.69 billion with a gross margin of 29.17%, operating margin of 18.63%, and net profit margin of 7.59%. The company’s return on equity (ROE) stands at 17.14%, and return on assets (ROA) is 5.76%, indicating moderate profitability and efficient asset utilization. Its return on invested capital (ROIC) aligns with these metrics, reflecting solid operational performance despite some challenges in cash flow.
Valuation metrics reveal a trailing price-to-earnings (P/E) ratio of 9.04 and a forward P/E of 6.48, both below the industry average P/E of 9.04, suggesting the stock may be undervalued relative to earnings expectations. The price-to-book (P/B) ratio is 1.16, and the enterprise value to EBITDA (EV/EBITDA) ratio is 8.86, indicating reasonable valuation levels. The stock trades at INR 546, within a 52-week range of INR 429.5 to INR 1275, currently closer to the lower end of this range, reflecting recent price weakness.
HG Infra’s strengths include a strong market capitalization of approximately INR 35.54 billion, market leadership in infrastructure EPC services, and a stable credit rating with CARE AA reaffirmed for bank facilities. Key risks involve a high debt-to-equity ratio of 182.68, negative operating cash flow of INR -12.9 billion TTM, and sector-specific challenges such as competitive bidding and regulatory scrutiny. Recent strategic moves include the transfer of a 49% stake in a subsidiary to Neo Infra Income Opportunities Fund and investments in battery energy storage systems, signaling diversification efforts.
Technically, the stock shows a downward trend with price below the 200-day moving average (INR 814.37) and near the 50-day moving average (INR 548.18), with momentum indicators reflecting subdued buying interest. Recent news highlights a mix of positive operational developments and stock-specific volatility. The overall data suggests a cautious stance, with conditions warranting close monitoring of financial health and market dynamics before considering portfolio adjustments.
Company and Industry Overview
Company Basics
Price Performance
Company Size
Shareholding Pattern
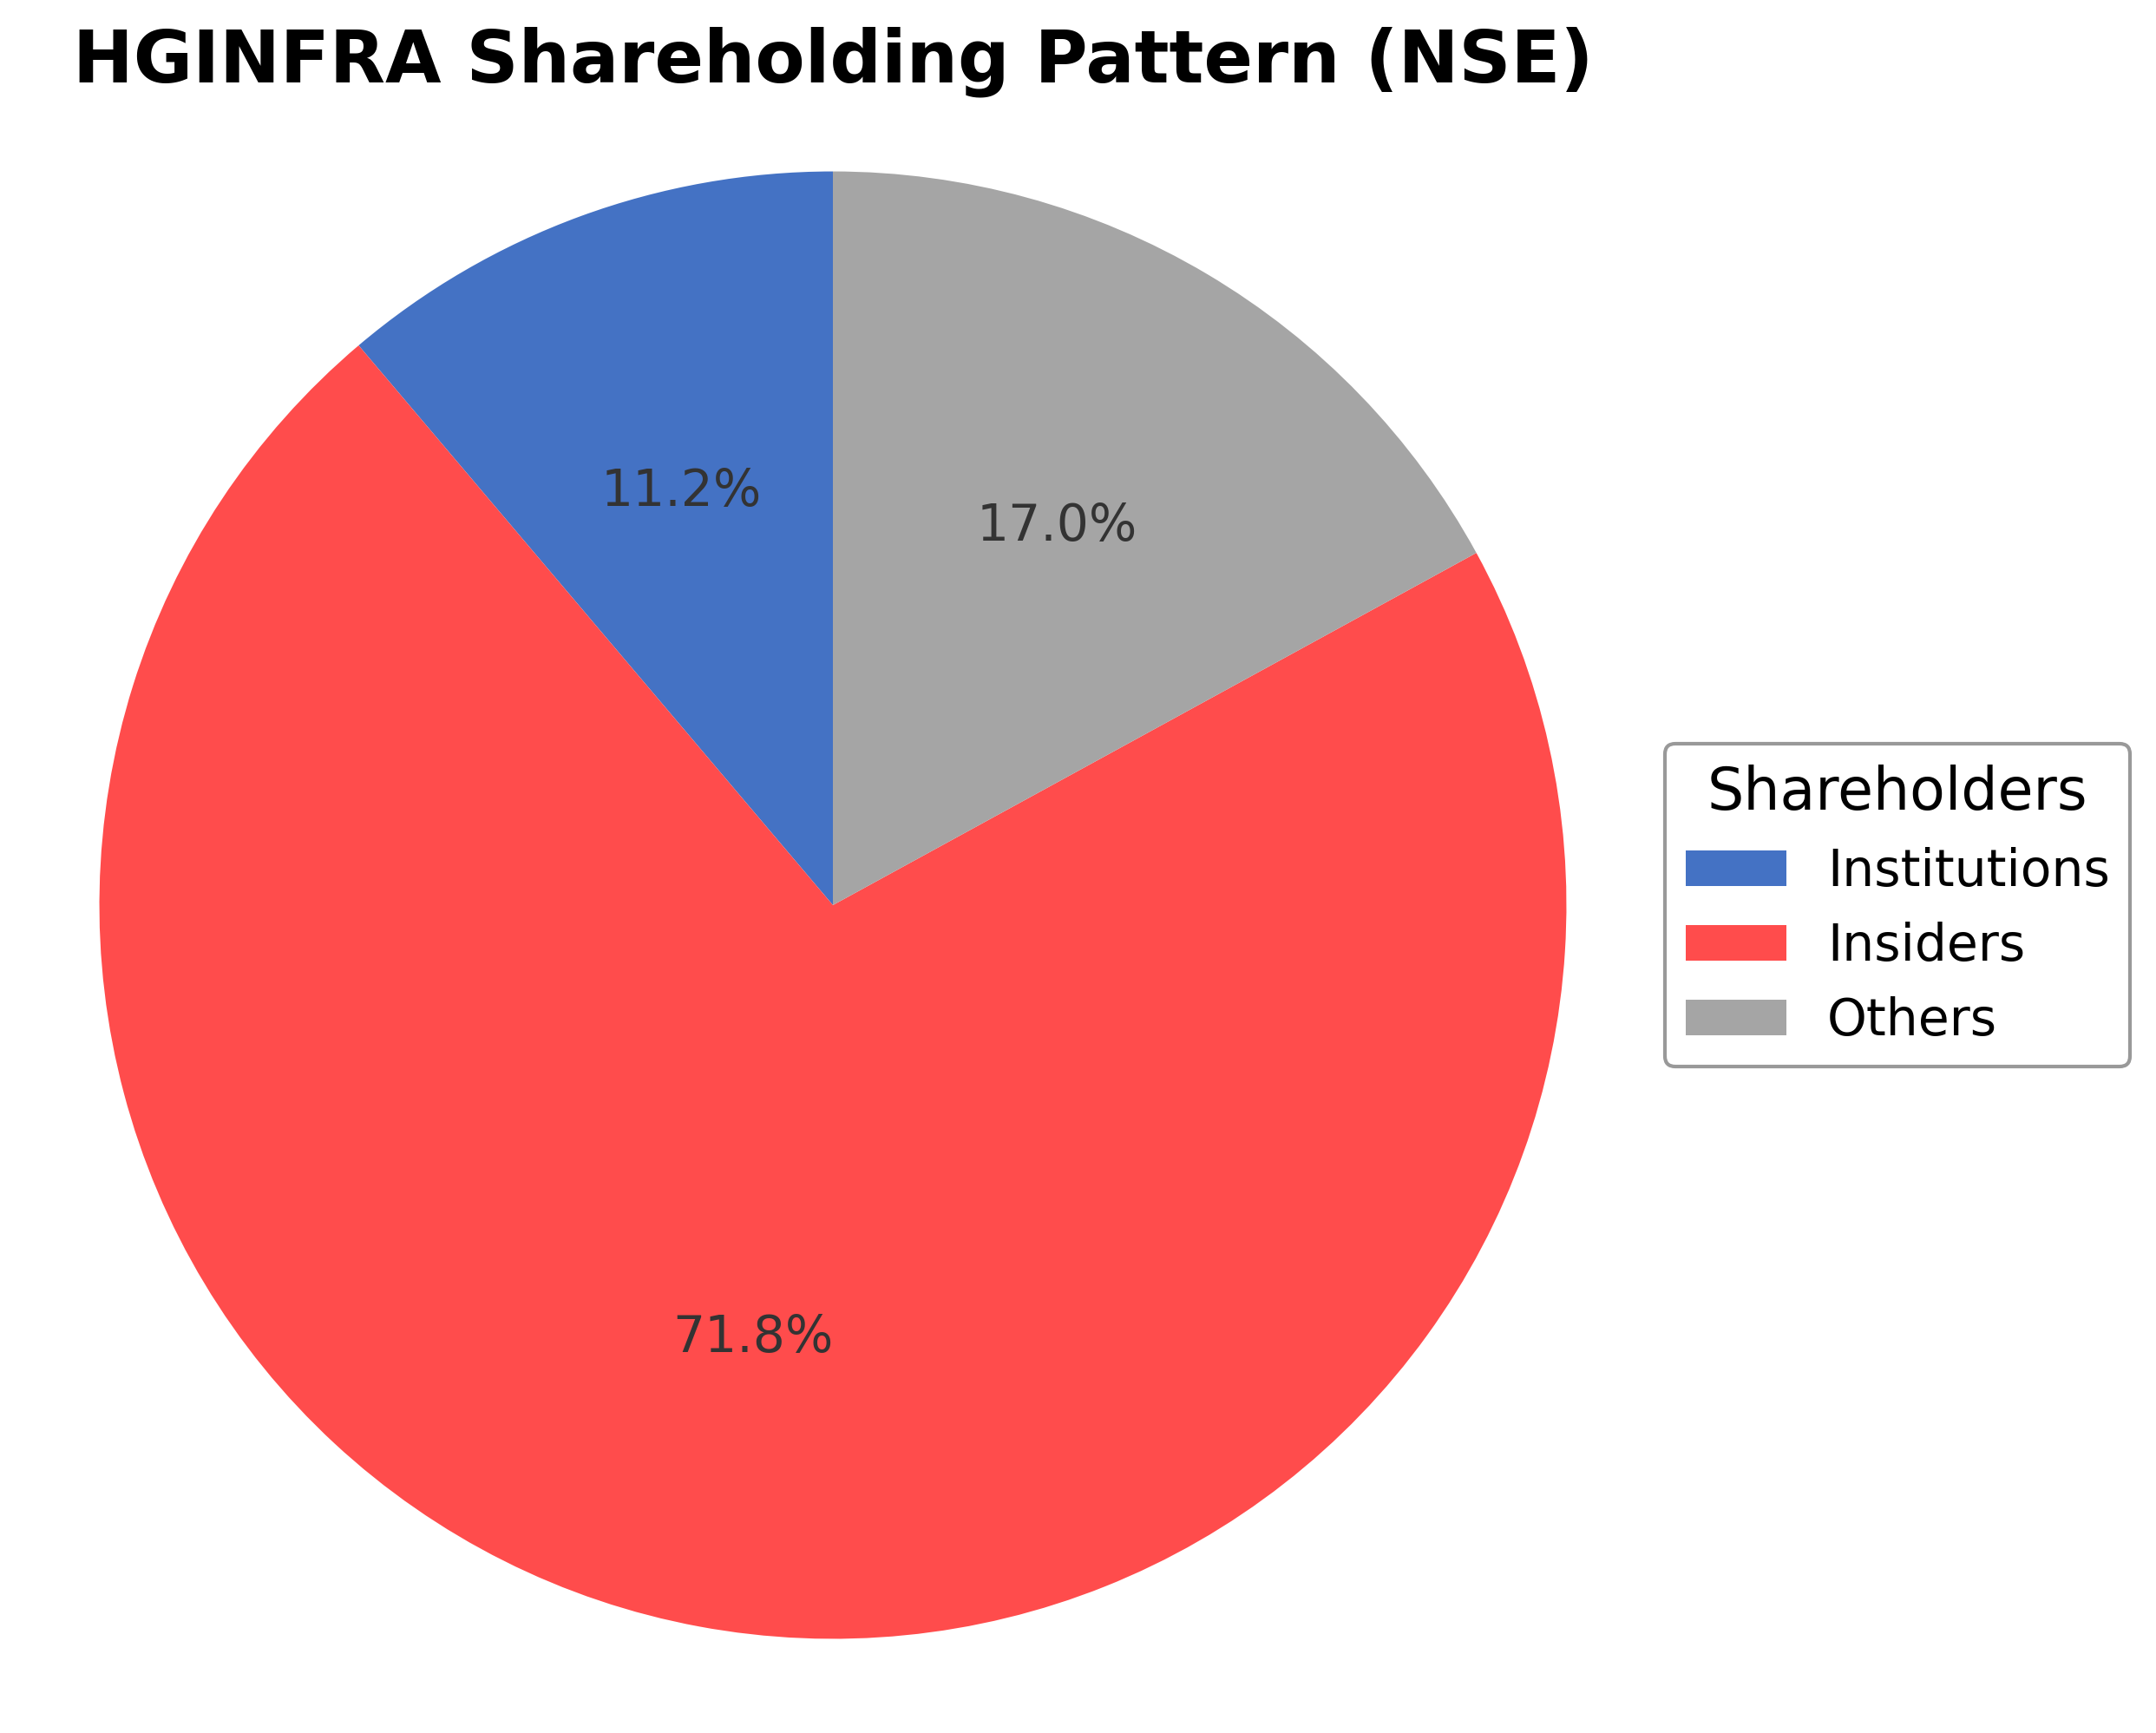
The shareholding structure of HG Infra Engineering Ltd. is dominated by insiders, including promoters and executives, holding approximately 71.78% of shares, reflecting strong internal control and alignment with company strategy. Institutional investors hold around 11.19%, indicating moderate external professional interest, while public shareholders account for about 17.03%, representing retail and other non-institutional investors. Over the past 12-24 months, there has been a slight increase in promoter stake, suggesting confidence in the company’s prospects, while institutional holdings have remained relatively stable with no significant accumulation or distribution trends. This ownership pattern suggests a governance framework with concentrated promoter influence, balanced by institutional oversight, which may impact strategic decisions and market sentiment in the infrastructure sector.
Sector and Industry Analysis
The infrastructure sector in India, encompassing construction and engineering services, is a critical driver of economic growth with a market size estimated in the hundreds of billions of dollars. It is experiencing steady expansion fueled by government initiatives like the National Infrastructure Pipeline and increased private sector participation. Key players include large established firms such as Larsen & Toubro, IRB Infrastructure, and HG Infra Engineering Ltd., which compete across segments like roads, railways, and urban infrastructure.
Within the infrastructure engineering industry, trends point to increased adoption of technology for project management and execution, along with a focus on sustainable and green construction practices. Competitive dynamics are shaped by high capital intensity and long project cycles, creating significant barriers to entry for smaller firms. Companies with strong balance sheets, diversified project portfolios, and government relationships tend to maintain advantageous positioning in bidding and execution.
The regulatory environment is characterized by stringent compliance requirements related to environmental clearances, labor laws, and safety standards, which can impact project timelines and costs. Recent reforms aim to streamline approvals and enhance transparency, such as the implementation of e-tendering and faster land acquisition processes. Continued government emphasis on infrastructure development suggests a supportive regulatory outlook, though firms must navigate evolving policies and potential delays in clearances.
Note: Analysis synthesized from industry research, market reports, and regulatory filings. Information is subject to change based on market conditions.
Financial Ratios Dashboard
Illustrative Scenario Analysis
DCF Assumptions:
Method: Two-Stage EPS-Priority Model
Financials
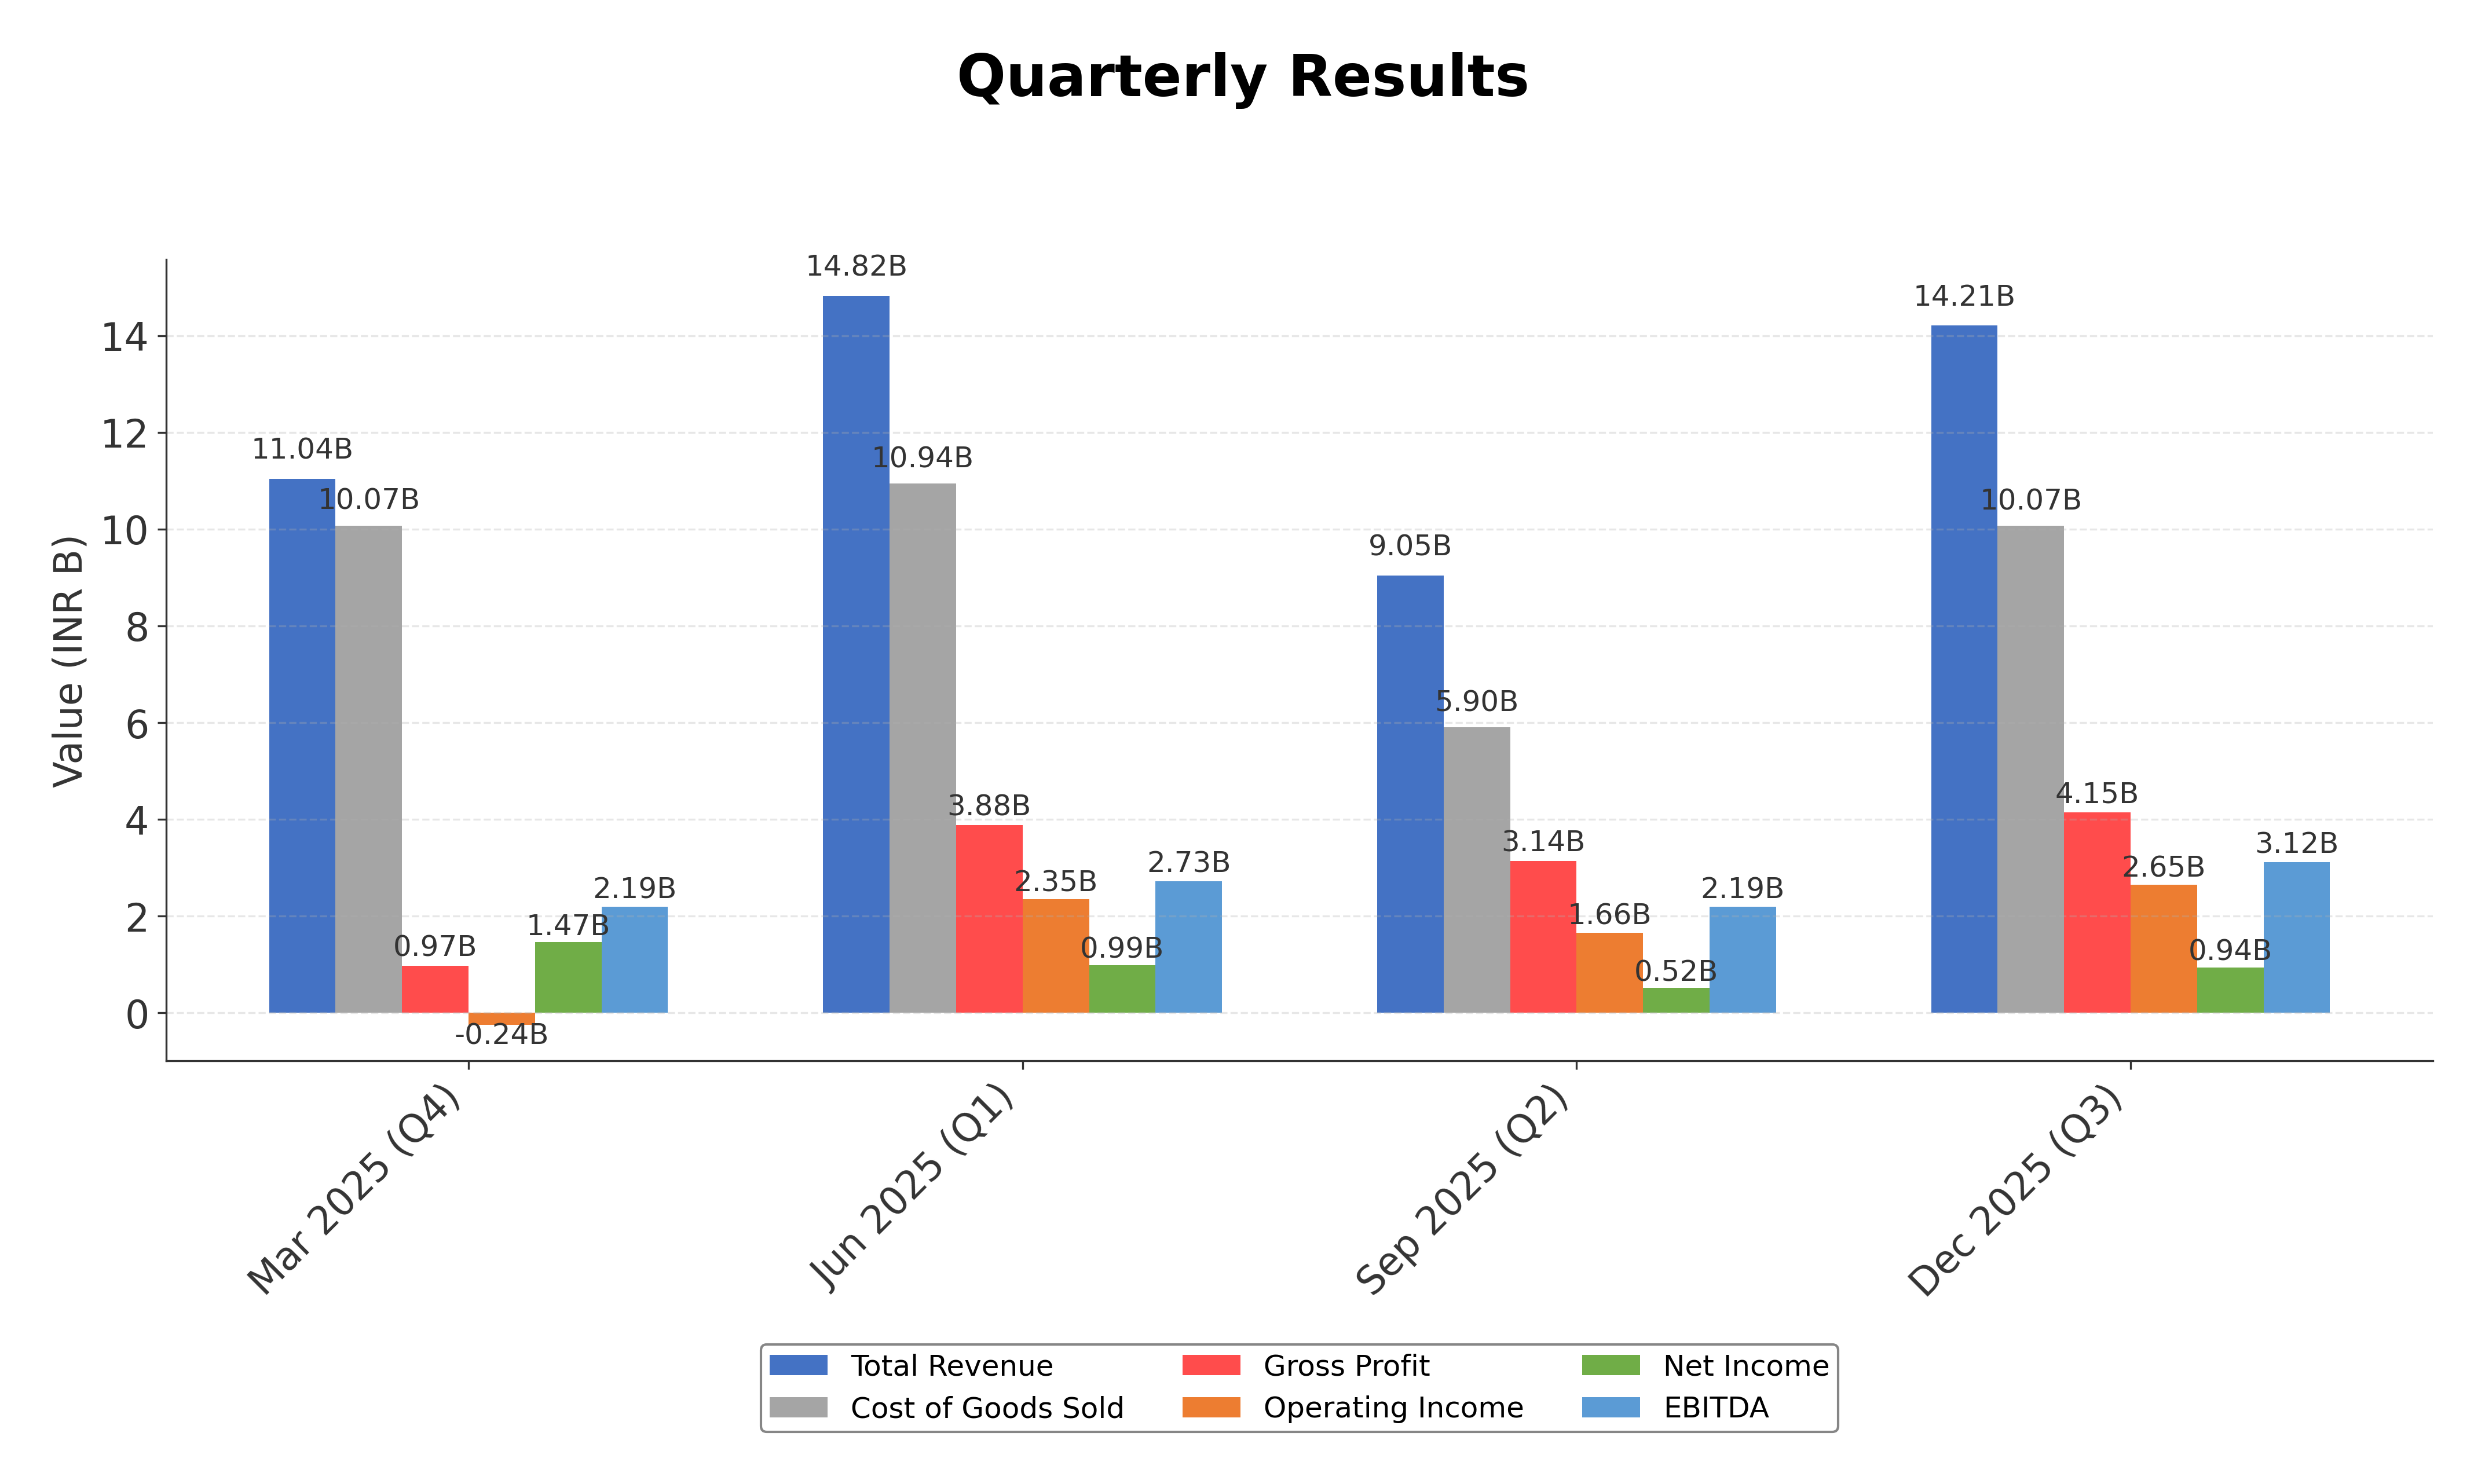
Peer Analysis
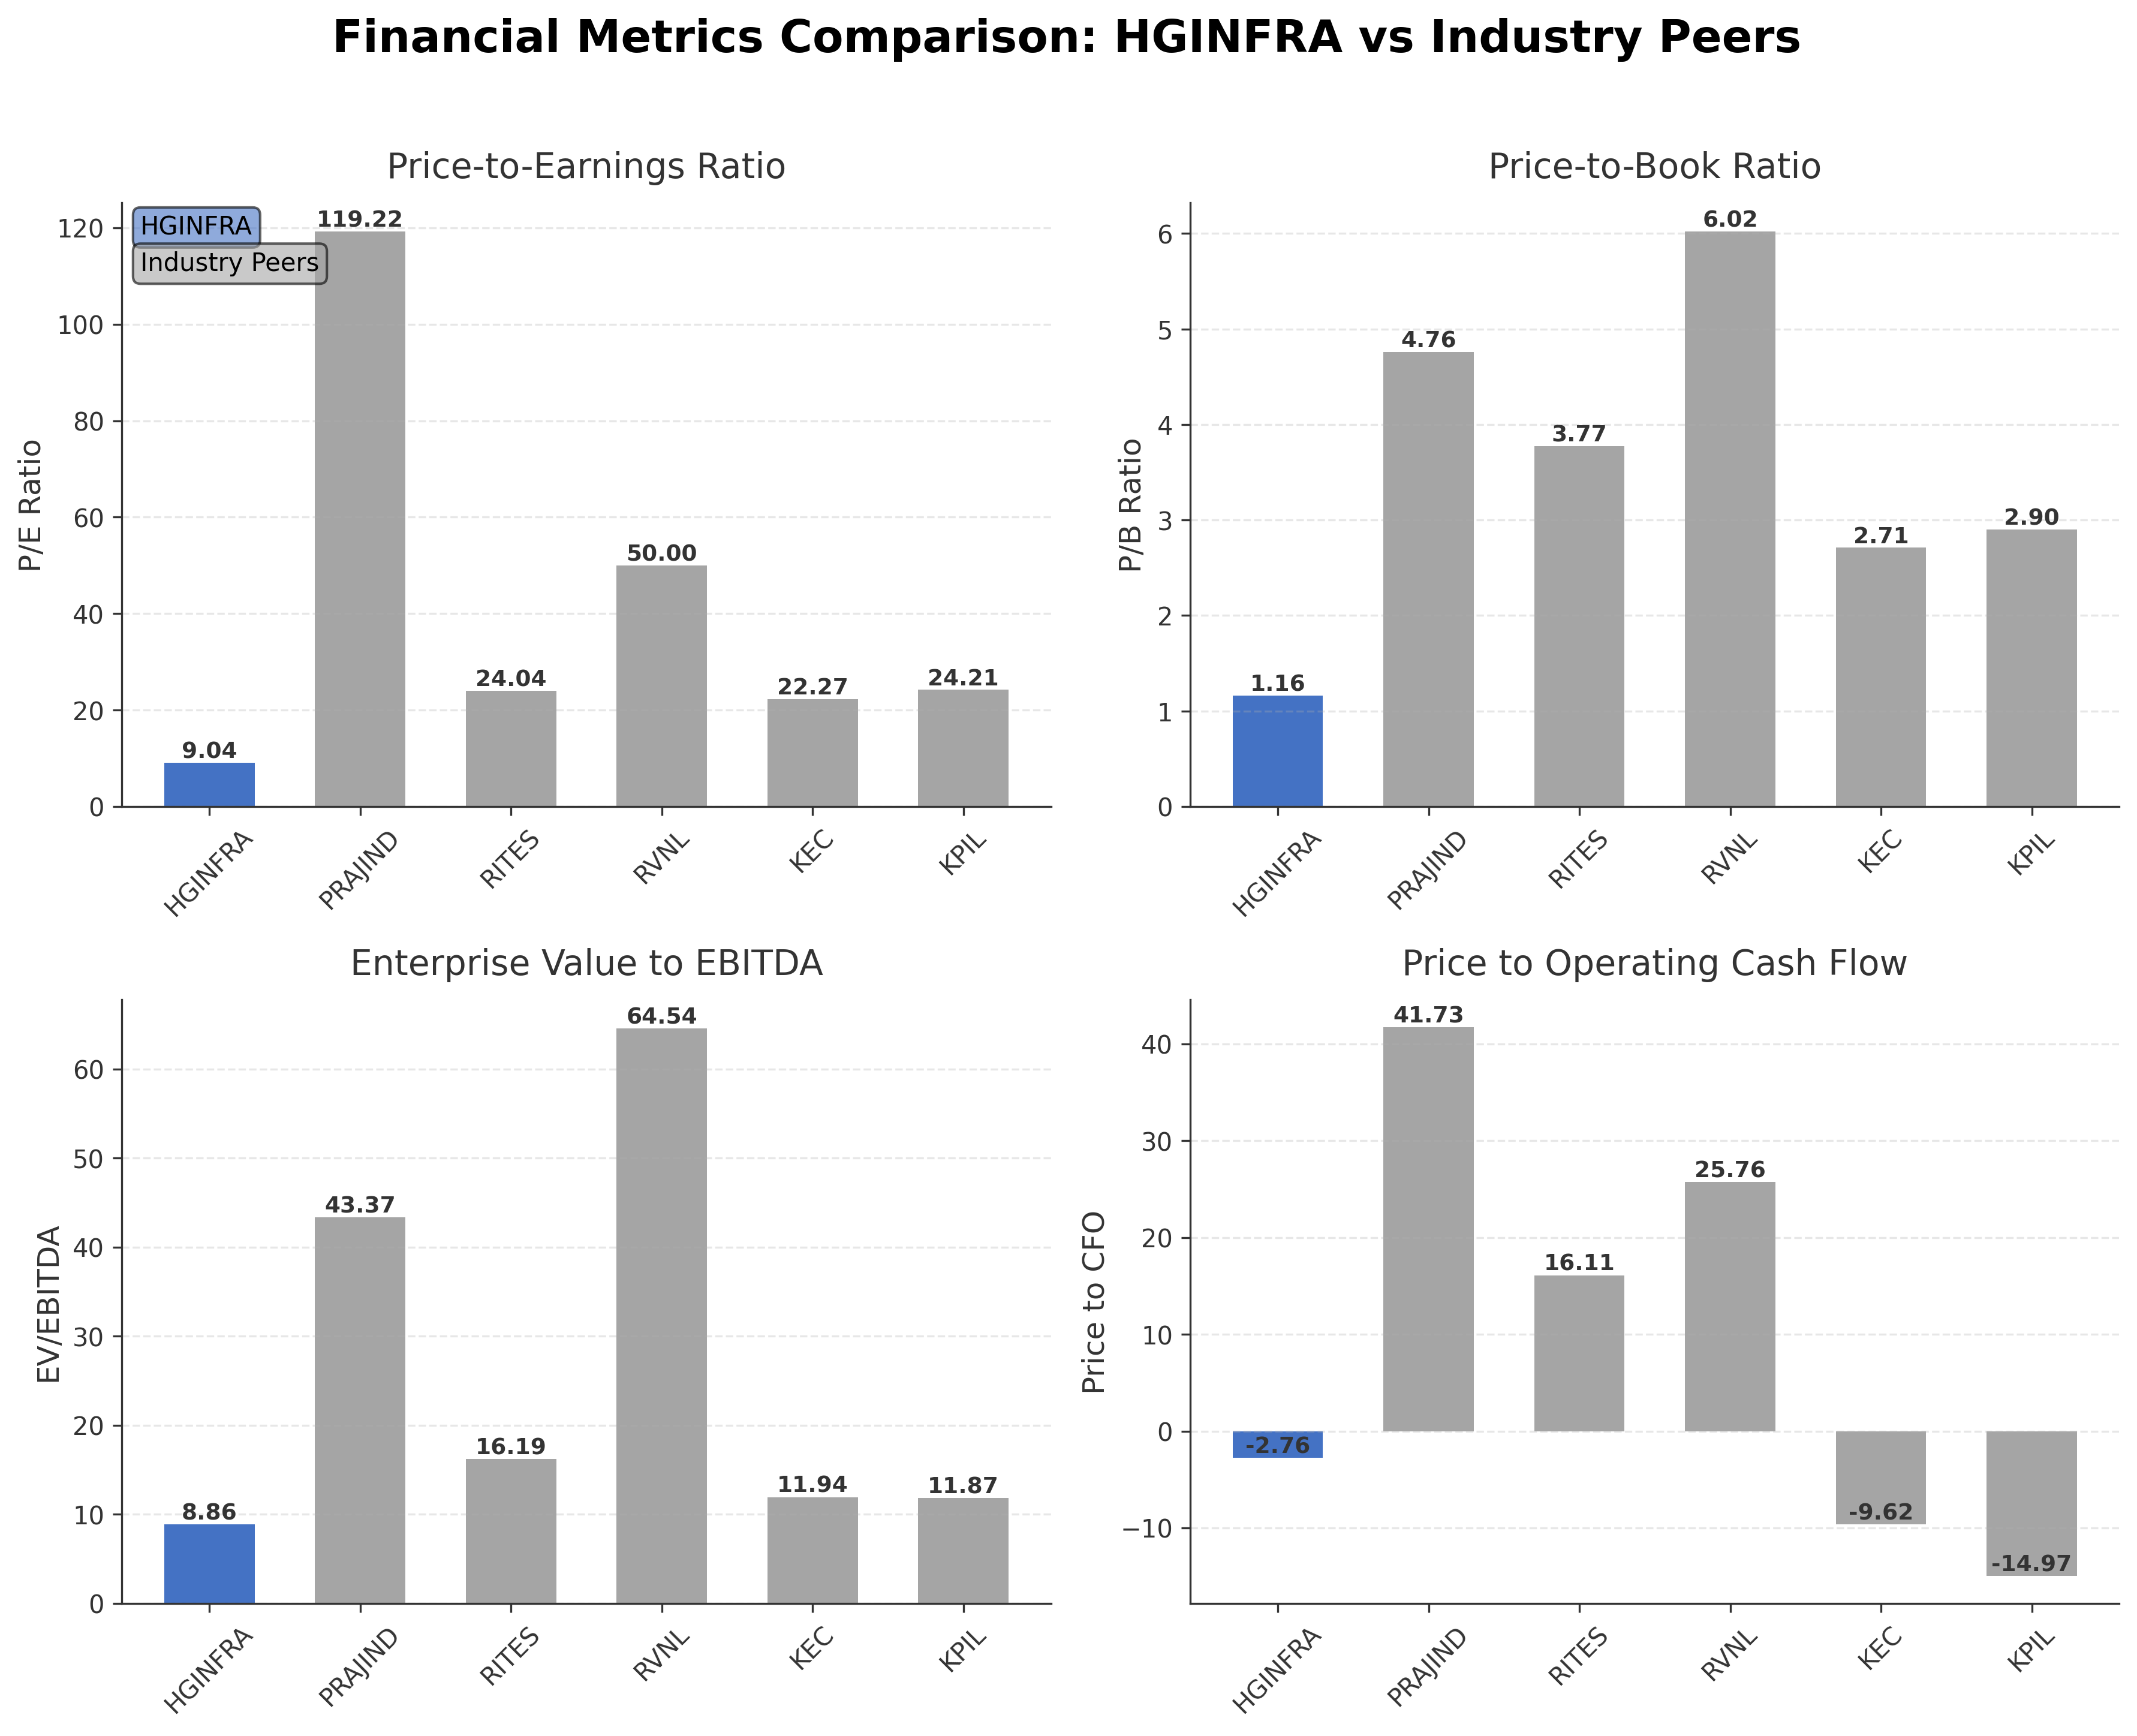
| Company Name | Market Cap | P/E Ratio | P/B Ratio | EV/EBITDA | Price to CFO |
|---|---|---|---|---|---|
| HG Infra Engineering Ltd. | ₹35.54B | 9.04 | 1.16 | 8.86 | -2.76 |
| Praj Industries Ltd. | ₹62.16B | 119.22 | 4.76 | 43.37 | 41.73 |
| Rites Ltd. | ₹99.56B | 24.04 | 3.77 | 16.19 | 16.11 |
| Rail Vikas Nigam Ltd. | ₹573.54B | 50.00 | 6.02 | 64.54 | 25.76 |
| Kec International Ltd. | ₹152.71B | 22.27 | 2.71 | 11.94 | -9.62 |
| Kalpataru Projects International Limited | ₹202.08B | 24.21 | 2.90 | 11.87 | -14.97 |
Comparison Analysis: HG Infra Engineering Ltd. trades at significantly lower valuation multiples compared to its regional peers, with a P/E ratio of 9.04 versus peers ranging from 22.27 to 119.22, and a P/B ratio of 1.16 compared to peer averages above 2.7. Its EV/EBITDA ratio of 8.86 is also notably lower, suggesting more attractive valuation relative to earnings and cash flow. The company exhibits a higher return on equity (17.14%) than most peers, indicating efficient capital utilization. However, negative price to CFO contrasts with positive values for most peers, highlighting cash flow challenges. Overall, HG Infra presents a value-oriented profile with strong profitability metrics but faces operational cash flow headwinds relative to its industry peers.
Financial Metrics Comparison with Peers
Financial Statements
Comprehensive financial data including income, balance sheet, and cash flow metrics
Income Statement
| fiscal_date | 2025-03-31 | 2024-03-31 | 2023-03-31 | 2022-03-31 | 2021-03-31 |
|---|---|---|---|---|---|
| Sales | 48.00B | 51.25B | 44.66B | 36.42B | 25.75B |
| Cost Of Goods | 35.88B | 39.25B | 34.54B | 28.70B | 19.82B |
| Gross Profit | 12.11B | 12.00B | 10.12B | 7.72B | 5.93B |
| Operating Expense Selling General And Administrative | 245.07M | 204.72M | 164.29M | 137.35M | 109.24M |
| Operating Expense Other Operating Expenses | 556.46M | 692.62M | 504.77M | 208.47M | 176.50M |
| Operating Income | 6.88B | 7.42B | 6.64B | 6.26B | 3.66B |
| Non Operating Interest Income | 2.44B | 1.99B | 1.46B | 59.54M | 410.58M |
| Non Operating Interest Expense | 2.35B | 1.78B | 1.21B | 727.61M | 635.30M |
| Pretax Income | 6.81B | 7.40B | 6.65B | 5.15B | 3.12B |
| Income Tax | 1.75B | 2.01B | 1.71B | 1.35B | 753.40M |
| Net Income | 5.05B | 5.39B | 4.93B | 3.80B | 2.37B |
| Eps Basic | 77.55 | 82.64 | 75.68 | 58.31 | 36.31 |
| Eps Diluted | 77.55 | 82.64 | 75.68 | 58.31 | 36.31 |
| Basic Shares Outstanding | 65.17M | 65.17M | 65.17M | 65.17M | 65.17M |
| Diluted Shares Outstanding | 65.17M | 65.17M | 65.17M | 65.17M | 65.17M |
| Ebit | 9.16B | 9.18B | 7.85B | 5.87B | 3.76B |
| Ebitda | 10.50B | 10.48B | 8.81B | 6.74B | 4.61B |
| Net Income Continuous Operations | 6.64B | 7.22B | 6.65B | 5.15B | 3.12B |
| Minority Interests | 650.00K | 0.00 | 0.00 | N/A | N/A |
| Preferred Stock Dividends | 0.00 | 0.00 | 0.00 | 0.00 | 0.00 |
Data provided by Twelve Data
Balance Sheet
| fiscal_date | 2025-03-31 | 2024-03-31 | 2023-03-31 | 2022-03-31 | 2021-03-31 |
|---|---|---|---|---|---|
| Cash And Cash Equivalents | 870.89M | 1.15B | 934.67M | 492.31M | 1.44B |
| Accounts Receivable | 6.71B | 6.73B | 7.28B | 6.35B | 5.82B |
| Total Assets | 87.73B | 54.34B | 49.27B | 32.92B | 26.84B |
| Total Liabilities | 58.23B | 29.79B | 30.05B | 18.56B | 16.21B |
| Long Term Debt | 32.13B | 10.97B | 14.84B | 9.66B | 5.57B |
| Shareholders Equity | 29.50B | 24.55B | 19.22B | 14.36B | 10.63B |
Data provided by Twelve Data
Cash Flow Statement
| fiscal_date | 2025-03-31 | 2024-03-31 | 2023-03-31 | 2022-03-31 | 2021-03-31 |
|---|---|---|---|---|---|
| Operating Activities Net Income | 6.64B | 7.22B | 6.65B | 5.15B | 3.12B |
| Operating Activities Other Non Cash Items | 2.53B | 2.03B | 1.43B | 1.12B | 875.64M |
| Operating Activities Accounts Receivable | -4.52B | -4.24B | -3.39B | -1.46B | 1.88B |
| Operating Activities Other Assets Liabilities | -17.55B | -9.62B | -8.72B | -7.11B | -4.02B |
| Operating Activities Operating Cash Flow | -12.90B | -4.62B | -4.03B | -2.30B | 1.86B |
| Investing Activities Capital Expenditures | -15.35B | -2.14B | -3.16B | -573.36M | -977.22M |
| Investing Activities Net Intangibles | -18.59M | -9.36M | -10.89M | -800.00K | 107.70M |
| Investing Activities Net Acquisitions | 922.83M | 1.81B | -90.00M | 0.00 | N/A |
| Investing Activities Other Investing Activity | 300.00K | 1.23M | 1.47M | 1.19M | N/A |
| Investing Activities Investing Cash Flow | -14.43B | -322.88M | -3.97B | -710.03M | -977.22M |
| Financing Activities Long Term Debt Issuance | 27.59B | 7.92B | 9.50B | 5.45B | 4.50B |
| Financing Activities Long Term Debt Payments | -2.48B | -2.92B | -1.94B | -1.02B | -1.87B |
| Financing Activities Short Term Debt Issuance | 653.66M | 487.14M | -327.74M | -260.10M | -129.67M |
| Financing Activities Common Dividends | -97.76M | -81.46M | -65.17M | -52.14M | N/A |
| Financing Activities Financing Cash Flow | 25.67B | 5.40B | 7.17B | 4.12B | 2.50B |
| End Cash Position | 870.89M | 1.19B | 934.67M | 492.31M | 1.44B |
| Free Cash Flow | -24.38B | -5.44B | -4.78B | -3.89B | -271.70M |
| Investing Activities Purchase Of Investments | N/A | N/A | -716.06M | -137.86M | N/A |
Data provided by Twelve Data
Technical Analysis
Key Insights
- The current trend direction for HG Infra Engineering Ltd. shows a downward trajectory with recent price action consolidating near the 50-day moving average at INR 548, below the 200-day moving average of INR 814, indicating bearish momentum over the medium term.
- Key support levels are identified near INR 430, the 52-week low, while resistance is observed around INR 575 to INR 600, corresponding to recent intraday highs and the 50-day moving average zone.
- The stock price is currently below the 200-day moving average and hovering near the 50-day moving average, with the 10-day moving average positioned below both, reflecting short-term weakness.
- Momentum indicators show the Relative Strength Index (RSI) near neutral to slightly oversold levels, MACD trending below the signal line indicating bearish momentum, and Stochastic oscillators suggesting limited upward momentum in the short term.
- Across daily, weekly, and monthly timeframes, the stock exhibits consistent weakness with no significant bullish reversal patterns, maintaining a downward bias in the medium term.
- Potential market scenarios include continued consolidation near support levels with risk of further downside if support breaks, or a gradual recovery if momentum indicators improve and price moves above key moving averages.
Trending News
1. Headline: H.G. Infra Engineering Ltd Surges 7.18% to Day's High of Rs 518.8 — Outperforms Sector by 4.91 Percentage Points
Summary: The Sensex climbed 3.95% on 8 Apr 2026, yet H.G. Infra Engineering Ltd outpaced the benchmark with a 7.18% gain, reaching an intraday high of Rs 518.8. This 4.91-percentage-point outperformance over the Engineering sector’s 2.25% advance signals a distinctly stock-specific rally rather than ...
Sentiment: positive
Summary: HG Infra Engineering Limited is Hiring | Solar O&M Professionals | Rajasthan (Bikaner & Jodhpur)
Sentiment: neutral
3. Headline: HG Infra Engineering Submits ISIN Specifications for INR 400 Crore Debt Securities
Summary: HG Infra Engineering Limited submitted ISIN specifications for debt securities worth INR 400 crore to BSE for the half year ended March 31, 2026. The debt securities, issued through private placement, carry a coupon rate of 8.55% per annum with semi-annual payment frequency and mature on August ...
Sentiment: neutral
4. Headline: HG Infra Engineering Gets CARE AA Stable Rating Reaffirmed for ₹140.00 Crore Bank Facilities
Summary: HG Infra Engineering Limited received a reaffirmed CARE AA Stable rating from CARE Ratings Limited for Long Term Bank Facilities worth ₹140.00 crore, reduced from ₹200.00 crore. The company disclosed this credit rating update to stock exchanges on April 03, 2026, in compliance with SEBI ...
Sentiment: positive
5. Headline: HG Infra Engineering Transfers 49% Stake in Subsidiary to Neo Infra Income Opportunities Fund
Summary: HG Infra Engineering Limited has transferred 49% stake in H.G. Khammam Devarapalle PKG-1 Private Limited to Neo Infra Income Opportunities Fund for a total consideration of ₹233.77 crore. The company received ₹81.69 crore as first tranche on March 30, 2026, with the remaining 51% stake ...
Sentiment: neutral
Powered by Brave
Recent Updates
News Summary
Recent news on HG Infra Engineering Ltd. reflects a mixed but predominantly stable operational and financial outlook. The company has been rated 'Sell' by MarketsMojo as of May 2025, indicating some market caution. However, positive developments include the decision to strike off eight dormant solar project subsidiaries, signaling portfolio optimization. The Q3 FY25 earnings call reported a 12% year-over-year revenue increase with an EBITDA margin of 16.6% and PAT margin of 9.1%, underscoring operational resilience. Despite a 35% stock price decline in 2025, the company secured a significant Rs 401 crore order, boosting revenue prospects. These updates collectively highlight ongoing efforts to strengthen financial health and business focus amid sector challenges.
News Sentiment
Sentiment across recent updates is mixed with a slight positive tilt. While the 'Sell' rating and stock price decline indicate caution, operational earnings growth and strategic corporate actions such as subsidiary restructuring and order wins contribute positive sentiment. The balance of neutral and positive news suggests market participants are weighing both risks and opportunities, reflecting a cautious but constructive outlook.
Analytical Overview
Analysis Summary
Overall Business and Market Assessment
Supporting Factors: Primary supporting factors include attractive valuation multiples relative to industry peers, consistent revenue growth, and a strong market position in infrastructure EPC services. Main risks involve the high debt burden and negative operating cash flow, which could impact financial flexibility. The appropriate investment timeframe is medium to long term, considering the company's strategic initiatives and sector dynamics. Overall, the analysis reflects a company with solid fundamentals but requiring careful attention to leverage and liquidity metrics.
Risk Factors: No data
SWOT Analysis
Strengths
- Strong market position in Indian infrastructure EPC services.
- Consistent revenue growth with a 12.4% quarterly increase.
- Attractive valuation metrics with a trailing P/E of 9.04.
- Stable credit rating with CARE AA reaffirmed.
Weaknesses
- High debt-to-equity ratio of 182.68 indicating significant leverage.
- Negative operating cash flow of INR -12.9 billion TTM.
- Low dividend yield of 0.38%, limiting income appeal.
- Negative price to cash flow ratio reflecting cash flow challenges.
Opportunities
- Expansion into battery energy storage systems and renewable energy projects.
- Strategic partnerships and stake sales to raise capital and improve liquidity.
- Government infrastructure spending supporting order book growth.
- Potential to improve operational efficiency and cash flow management.
Threats
- Intense competition in the infrastructure construction sector.
- Regulatory and compliance risks associated with large infrastructure projects.
- Macroeconomic volatility impacting government spending and project execution.
- Rising input costs and supply chain disruptions affecting margins.
Company Description
HG Infra Engineering Ltd. is an Indian infrastructure company primarily engaged in the construction and development of roads and highways. With a focus on executing large-scale projects, the company plays a crucial role in enhancing India's transport infrastructure. HG Infra's portfolio extends beyond road construction, also encompassing water pipeline development, airport runway construction, and railway projects. The firm’s comprehensive services include engineering, procurement, and construction, allowing it to deliver complete infrastructural solutions. Headquartered in Jaipur, Rajasthan, HG Infra Engineering Ltd. is strategically positioned to tap into the growing demand for robust infrastructure to support economic growth in India. It actively participates in government tenders while also collaborating with private players, underscoring its adaptability and broad market presence. The company's contributions are significant to sectors such as logistics, trade, and inter-state connectivity, enhancing overall economic efficiency and mobility. As a leader in the infrastructure sector, HG Infra Engineering Ltd. has established a reputation for timely delivery and high-quality standards, reinforcing its critical role in the ongoing development of India's infrastructure landscape.