
HFCL Ltd (HFCL)
Stock Analysis Report
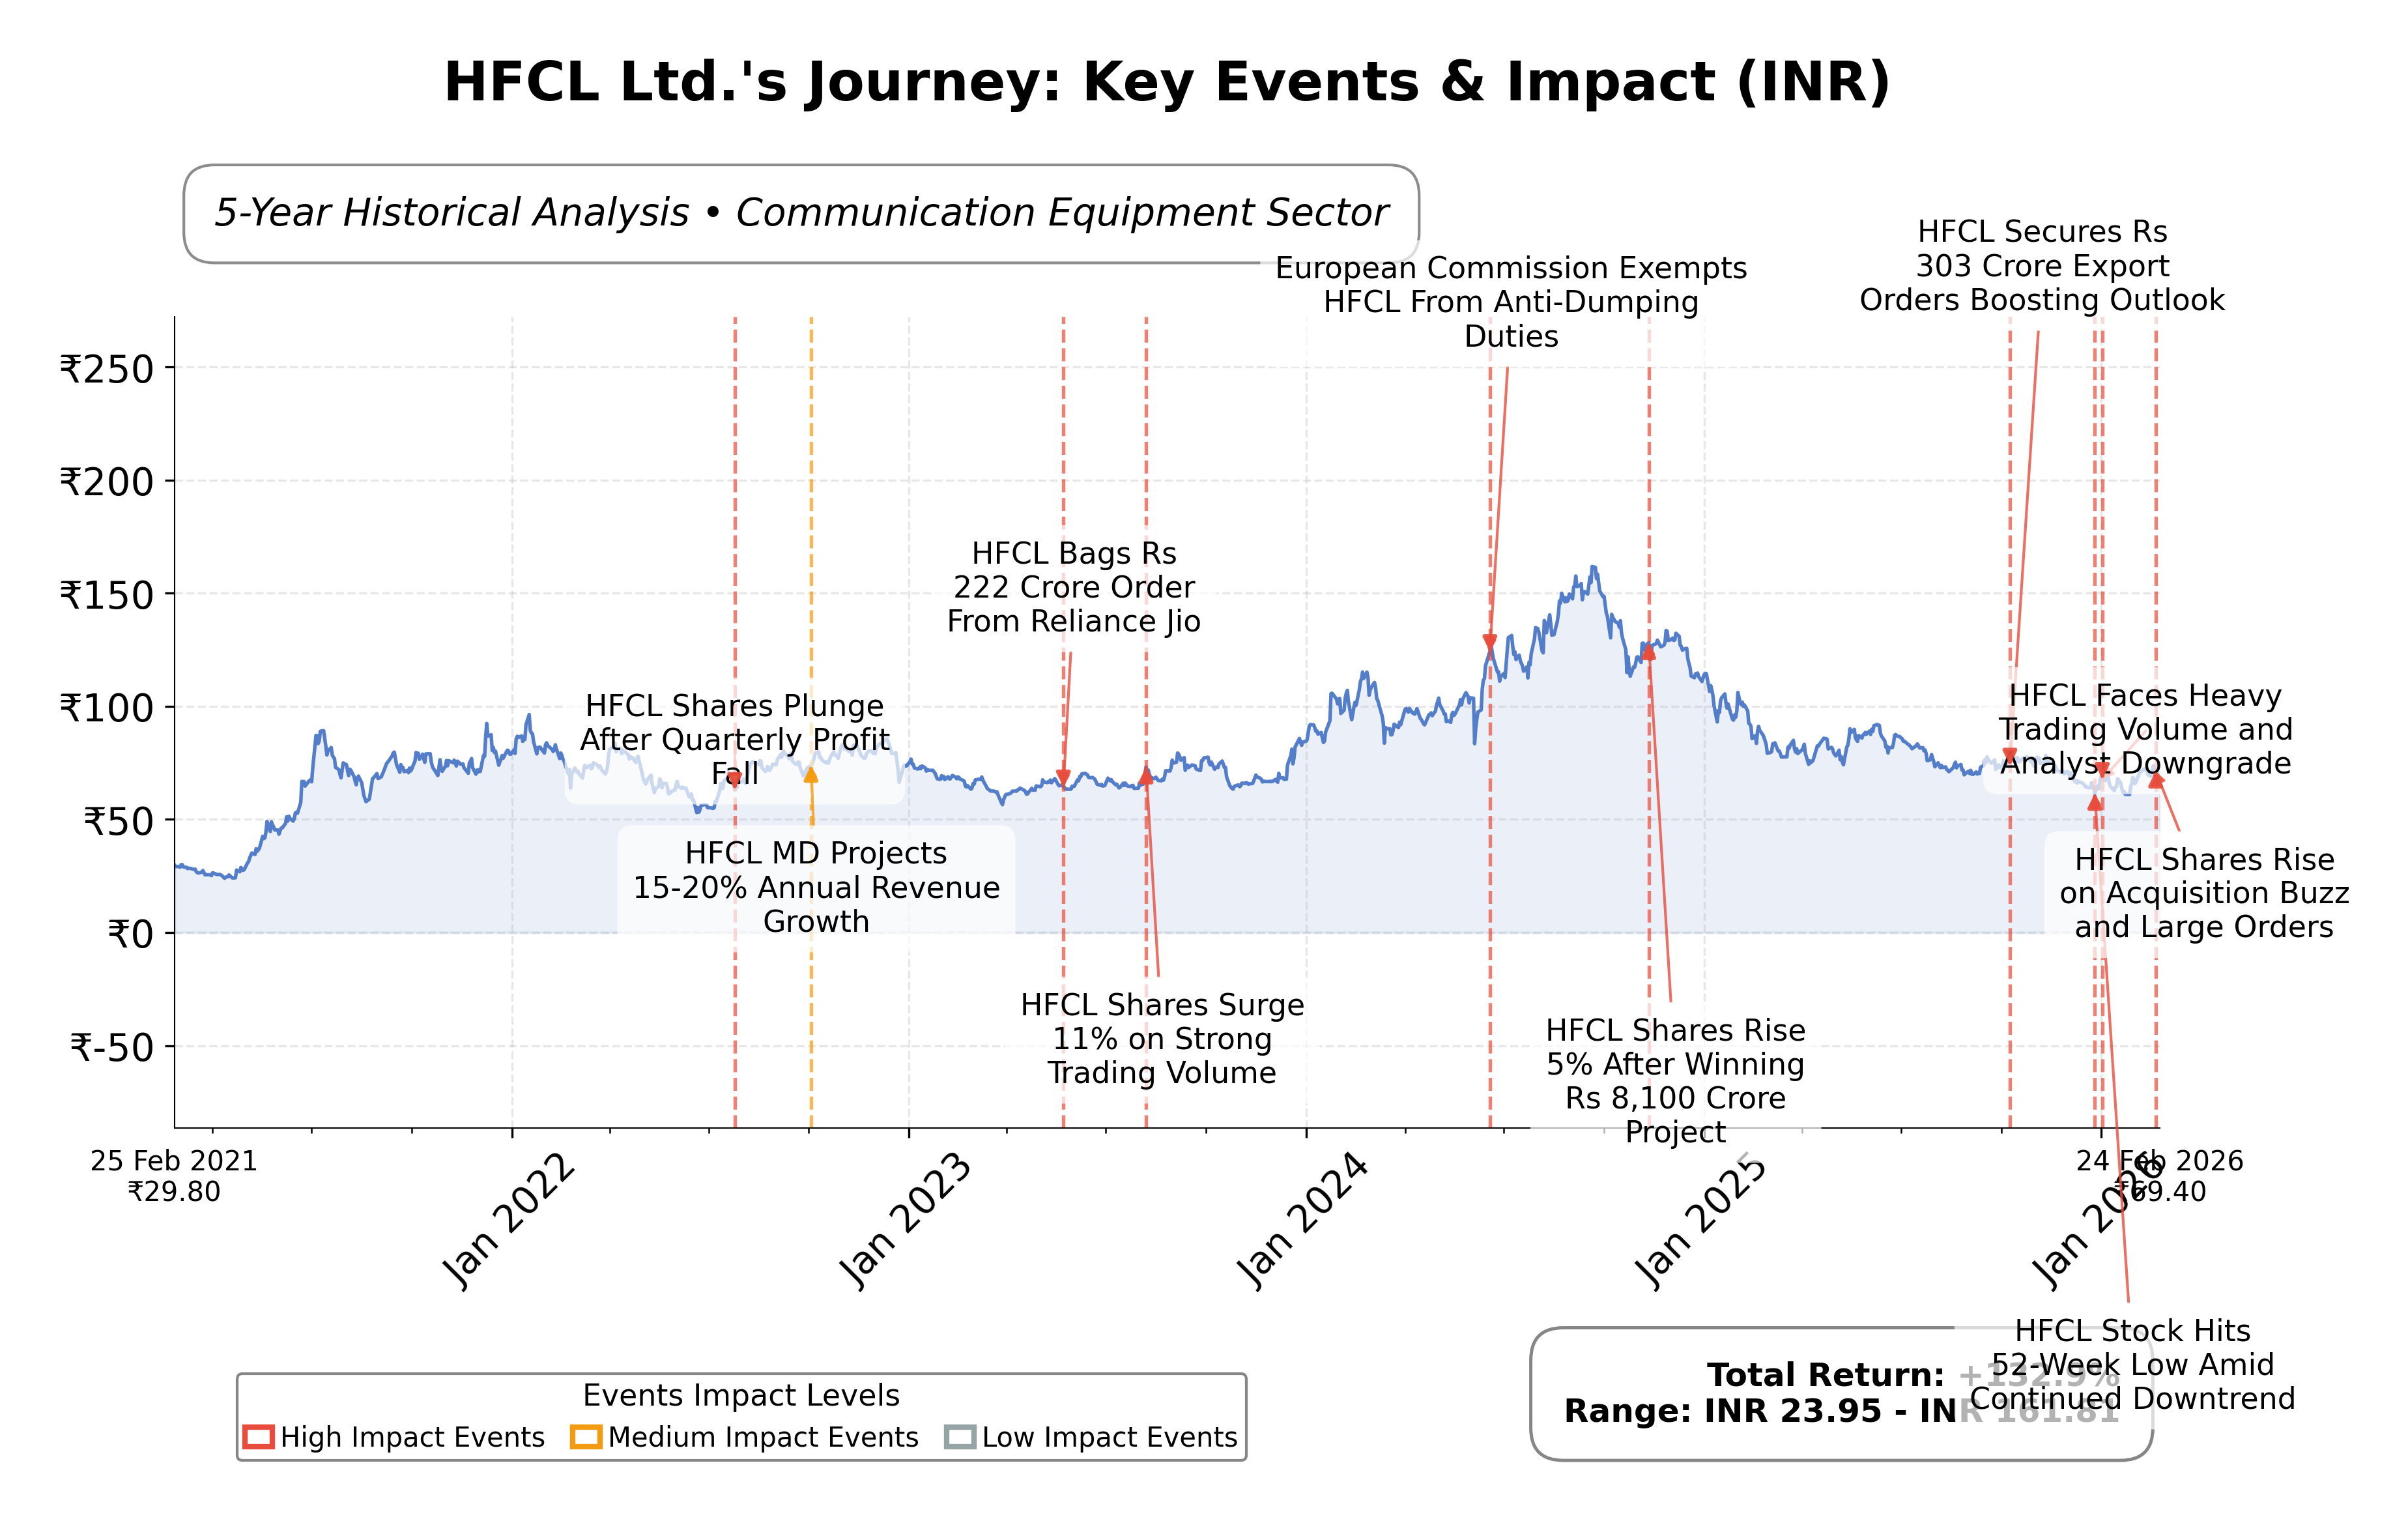
Stock Journey
Key Positives and Key Risks
Pros
- Revenue growth of 19.6% quarterly indicates strong top-line momentum supporting business expansion.
- Forward P/E ratio of 14.17 suggests expected improvement in earnings relative to current valuation.
- Active participation in government-backed research projects with IIT Delhi enhances innovation potential.
Cons
- Trailing P/E ratio of 196.83 reflects a high valuation relative to historical earnings, implying stretched pricing.
- Debt-to-equity ratio of 41.39 indicates significant leverage, posing financial risk.
- Profit margin of 1.32% is modest, limiting earnings efficiency and profitability.
Disclosure: This information is for general awareness and does not constitute investment advice
Report Summary
HFCL Ltd. operates primarily in the telecommunications infrastructure and manufacturing sector within the technology industry, focusing on providing comprehensive telecom equipment and infrastructure services. The company is positioned as a key player in the communication equipment industry in India, supplying fiber optic cables, broadband equipment, and telecom towers to domestic and international markets. HFCLâs involvement in government projects and initiatives such as smart cities and mobile backhaul networks underscores its strategic role in advancing digital connectivity and infrastructure development.
Financially, HFCL reports a market capitalization of approximately â¹109.12 billion with a trailing price-to-earnings (P/E) ratio of 196.83 and a forward P/E of 14.17, indicating a significant difference between historical and expected earnings valuations. The companyâs revenue for the trailing twelve months stands at around â¹39.26 billion with a profit margin of 1.32%. Return on equity (ROE) and return on assets (ROA) are modest at 4.31% and 2.35%, respectively. The enterprise value to EBITDA ratio is elevated at 35.38, reflecting valuation relative to earnings before interest, tax, depreciation, and amortization.
From a strategic and technical perspective, HFCL has recently engaged in notable initiatives such as partnering with IIT Delhi on advanced optical fiber technology development, positioning itself for future growth in next-generation networks like 6G. The companyâs shareholding pattern shows insider ownership at approximately 37.5% and institutional holdings near 12.3%, suggesting a stable ownership base with some institutional interest. Risks include a high debt-to-equity ratio of 41.39 and relatively low profit margins, which may impact financial flexibility. The stockâs 52-week price range of â¹59.82 to â¹93.96 and current price near â¹69.75 indicate a downside risk of approximately 15% from the high.
In peer comparison within the Indian communication equipment sector, HFCLâs market capitalization is larger than Tejas Networks Ltd. but smaller than ITI Ltd. HFCLâs valuation metrics such as P/E and EV/EBITDA are higher than peers, while its return on equity is comparatively lower. This suggests a premium valuation relative to earnings and cash flows, with mixed profitability metrics. Peers show negative EV/EBITDA and price to CFO ratios, indicating varying financial health and operational performance across the sector.
HFCL stands as a significant participant in Indiaâs telecom infrastructure landscape, navigating a complex environment marked by rapid technological evolution and competitive pressures. Recent achievements include strategic research collaborations and securing export orders, while challenges persist in managing leverage and improving profitability. The companyâs future trajectory hinges on its ability to capitalize on emerging technologies and infrastructure projects. Given the current financial and market data, a balanced approach reflecting ongoing observation of operational execution and market developments may be appropriate for those assessing the companyâs stock.
Company and Industry Overview
Company Basics
Price Performance
Company Size
Shareholding Pattern
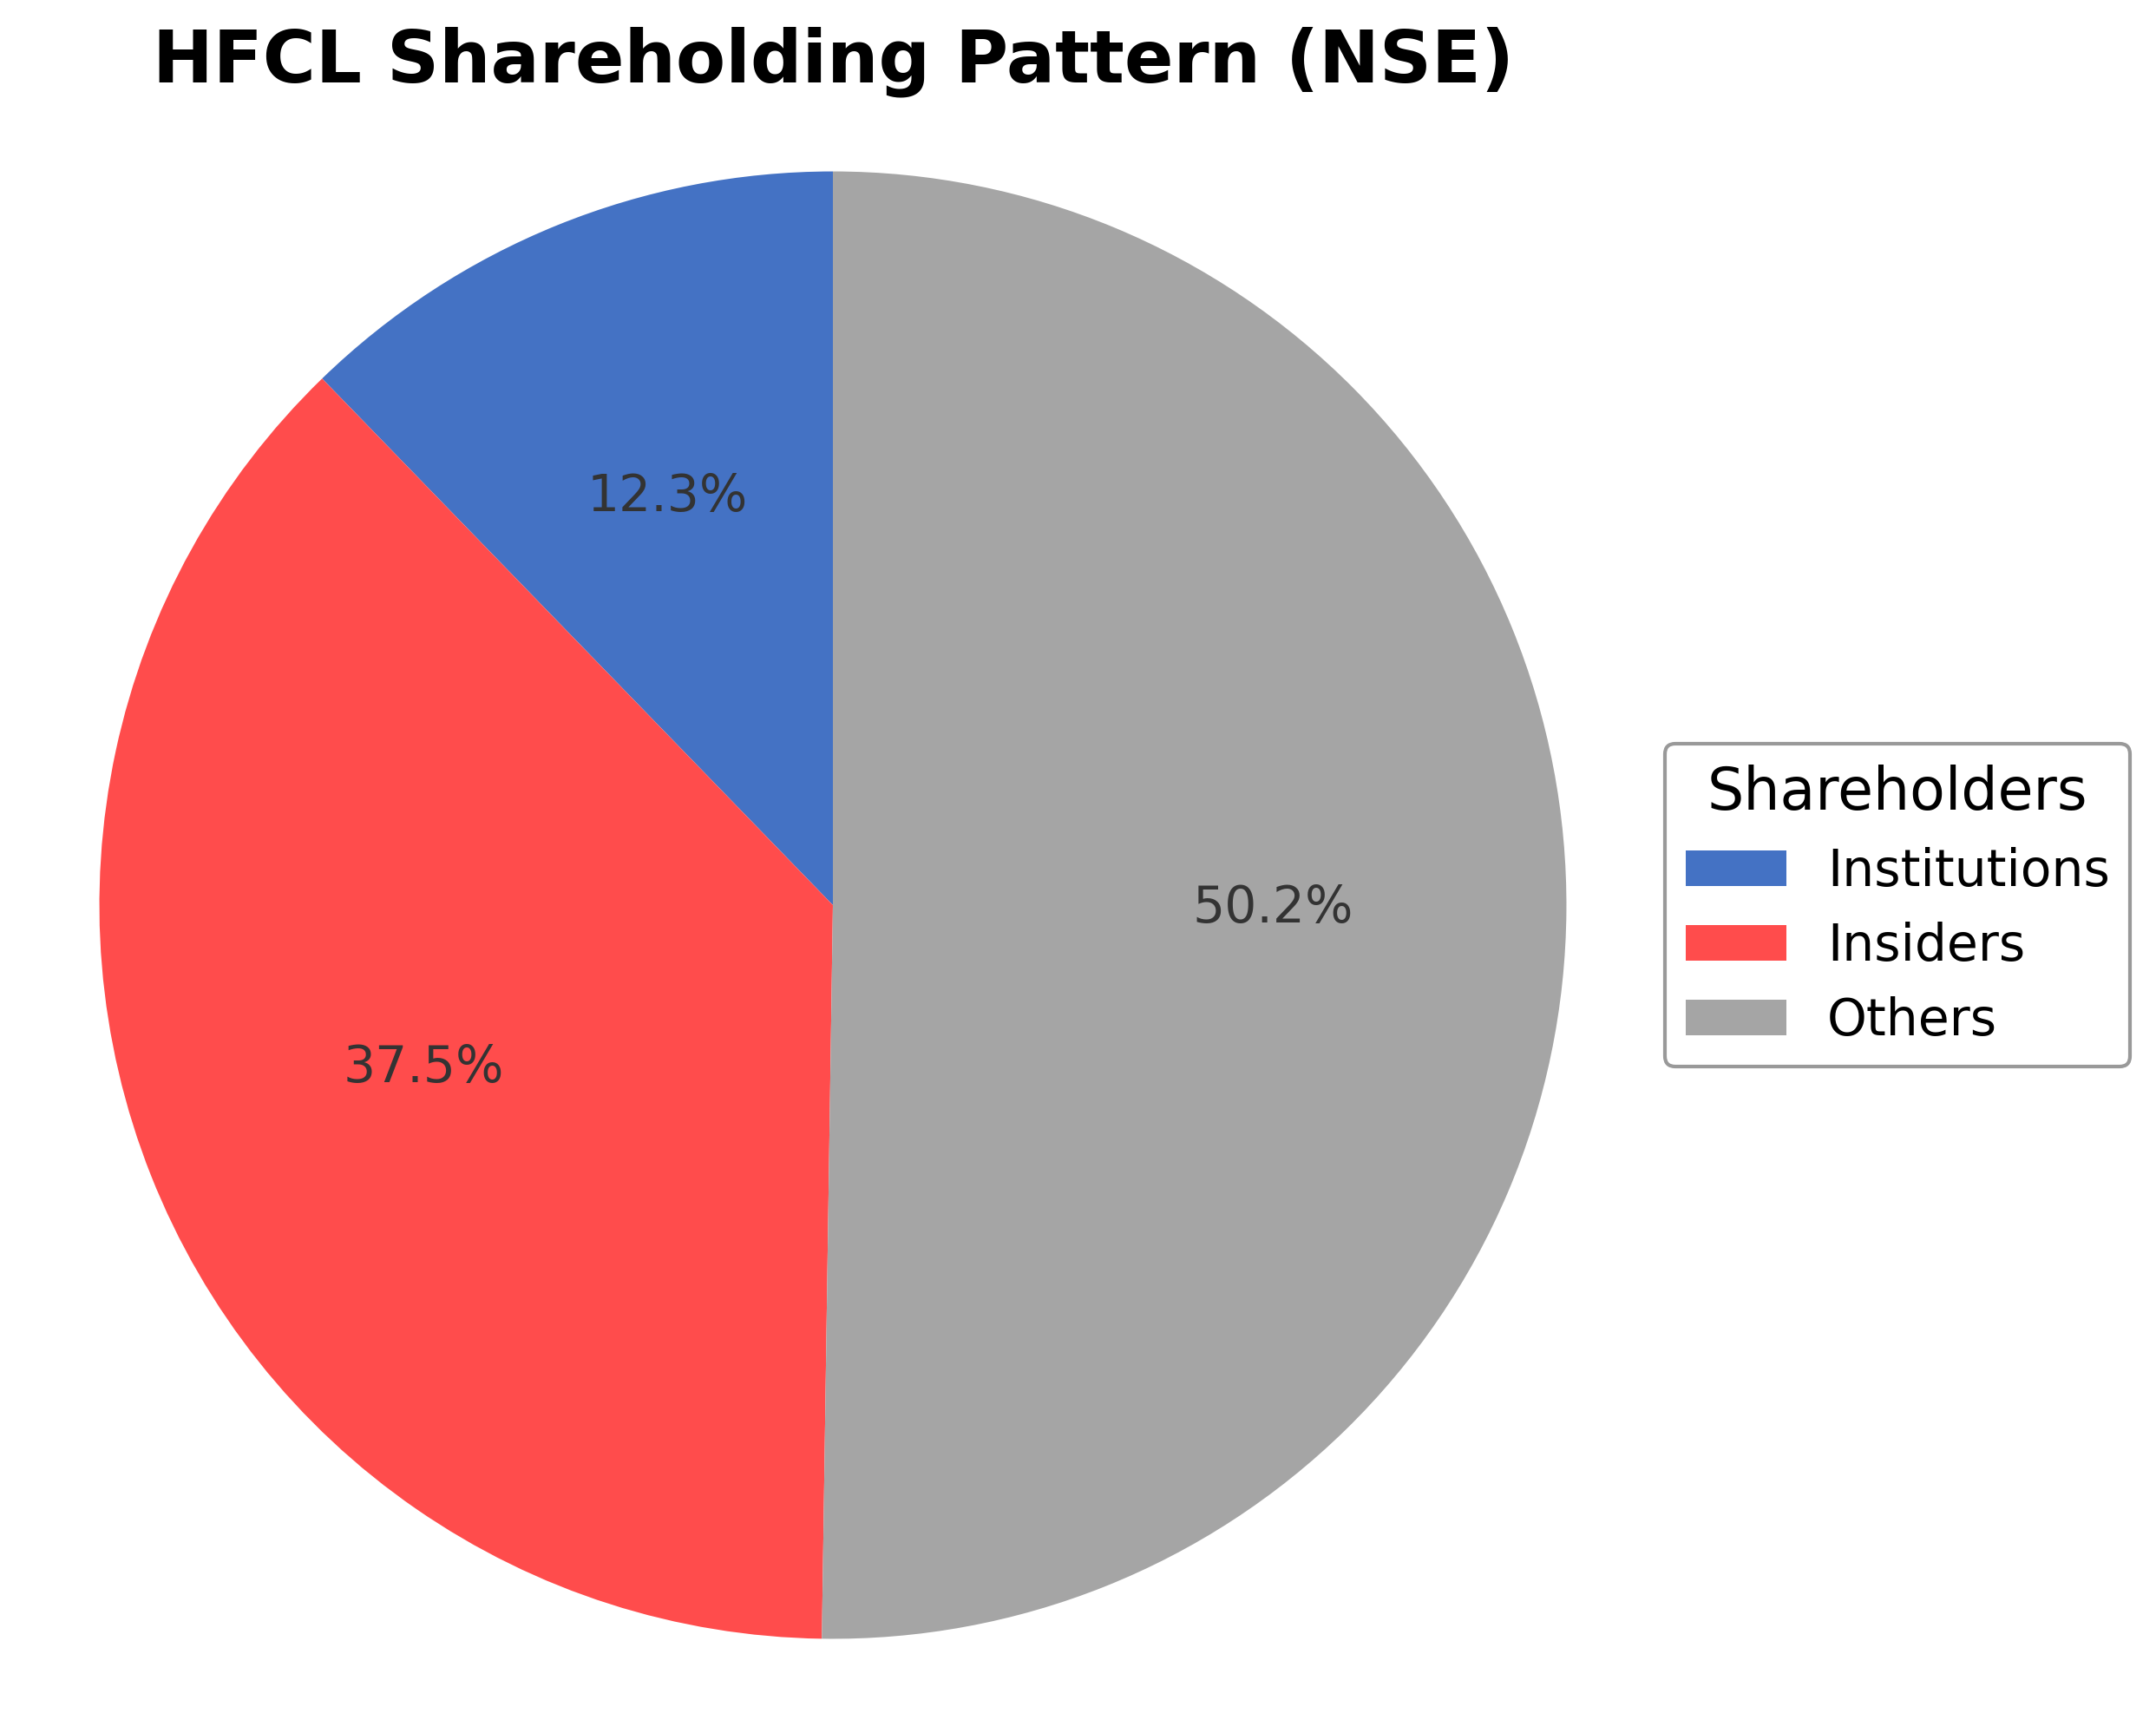
HFCL Ltd.'s ownership structure comprises approximately 37.5% insiders including executives and board members, 12.26% institutional investors such as mutual funds and asset managers, and the remaining 50.24% held by public and other shareholders including retail investors and employee stock plans. Over the past 12-24 months, institutional holdings have shown moderate accumulation, with some major funds increasing their positions, reflecting cautious optimism. The shareholding pattern indicates a stable insider base combined with growing institutional interest, which may influence governance and strategic decisions. This structure suggests balanced market sentiment with potential implications for future corporate actions amid evolving industry dynamics.
Sector and Industry Analysis
HFCL Ltd. operates within the broader telecommunications and technology sector, specifically focusing on telecom infrastructure, optical fiber cables, and related electronic components. The global telecommunications sector is substantial, with market size projected to reach several trillion USD by the mid-2020s, driven by increasing digital connectivity demands, 5G rollout, and expanding internet penetration. Key players in this sector include multinational corporations such as Huawei, Nokia, Ericsson, and Corning, alongside regional leaders like HFCL in India, which benefit from localized manufacturing and government initiatives promoting domestic production.
Industry trends are marked by rapid technological evolution, notably the transition from 4G to 5G networks, increasing adoption of fiber-to-the-home (FTTH) solutions, and the integration of Internet of Things (IoT) devices requiring robust and high-speed connectivity infrastructure. Consumer behavior is shifting towards higher data consumption and demand for low-latency services, fueling investments in optical fiber networks and next-generation telecom equipment. Emerging opportunities include smart city projects, digital India initiatives, and increased government spending on telecom infrastructure, which collectively create a favorable environment for companies like HFCL to expand their product offerings and market reach.
The regulatory landscape in telecommunications is complex and varies by jurisdiction but generally includes spectrum allocation, data privacy laws, and manufacturing compliance standards. In India, government policies such as “Make in India” and production-linked incentives (PLI) for telecom equipment manufacturing significantly impact industry dynamics by encouraging domestic production and reducing import dependence. Compliance with international standards for quality and security, alongside adherence to environmental regulations concerning electronic waste and manufacturing processes, also shapes operational frameworks for industry participants.
Competitive dynamics in the telecom infrastructure industry are characterized by moderate to high barriers to entry due to capital intensity, technological expertise requirements, and established relationships with telecom operators and governments. Market structure tends to be oligopolistic with a few dominant global and regional players. HFCL’s competitive positioning benefits from its integrated manufacturing capabilities, diversified product portfolio, and strategic alignment with government initiatives. However, competition remains intense, driven by price pressures, innovation cycles, and the need for continuous upgrades to meet evolving network standards and customer expectations.
Note: Analysis synthesized from industry research, market reports, and regulatory filings. Information is subject to change based on market conditions.
Illustrative Scenario Analysis
DCF Assumptions:
Method: Two-Stage EPS-Priority Model
Financials
Peer Analysis
| Company Name | Market Cap | P/E Ratio | P/B Ratio | EV/EBITDA | Price to CFO |
|---|---|---|---|---|---|
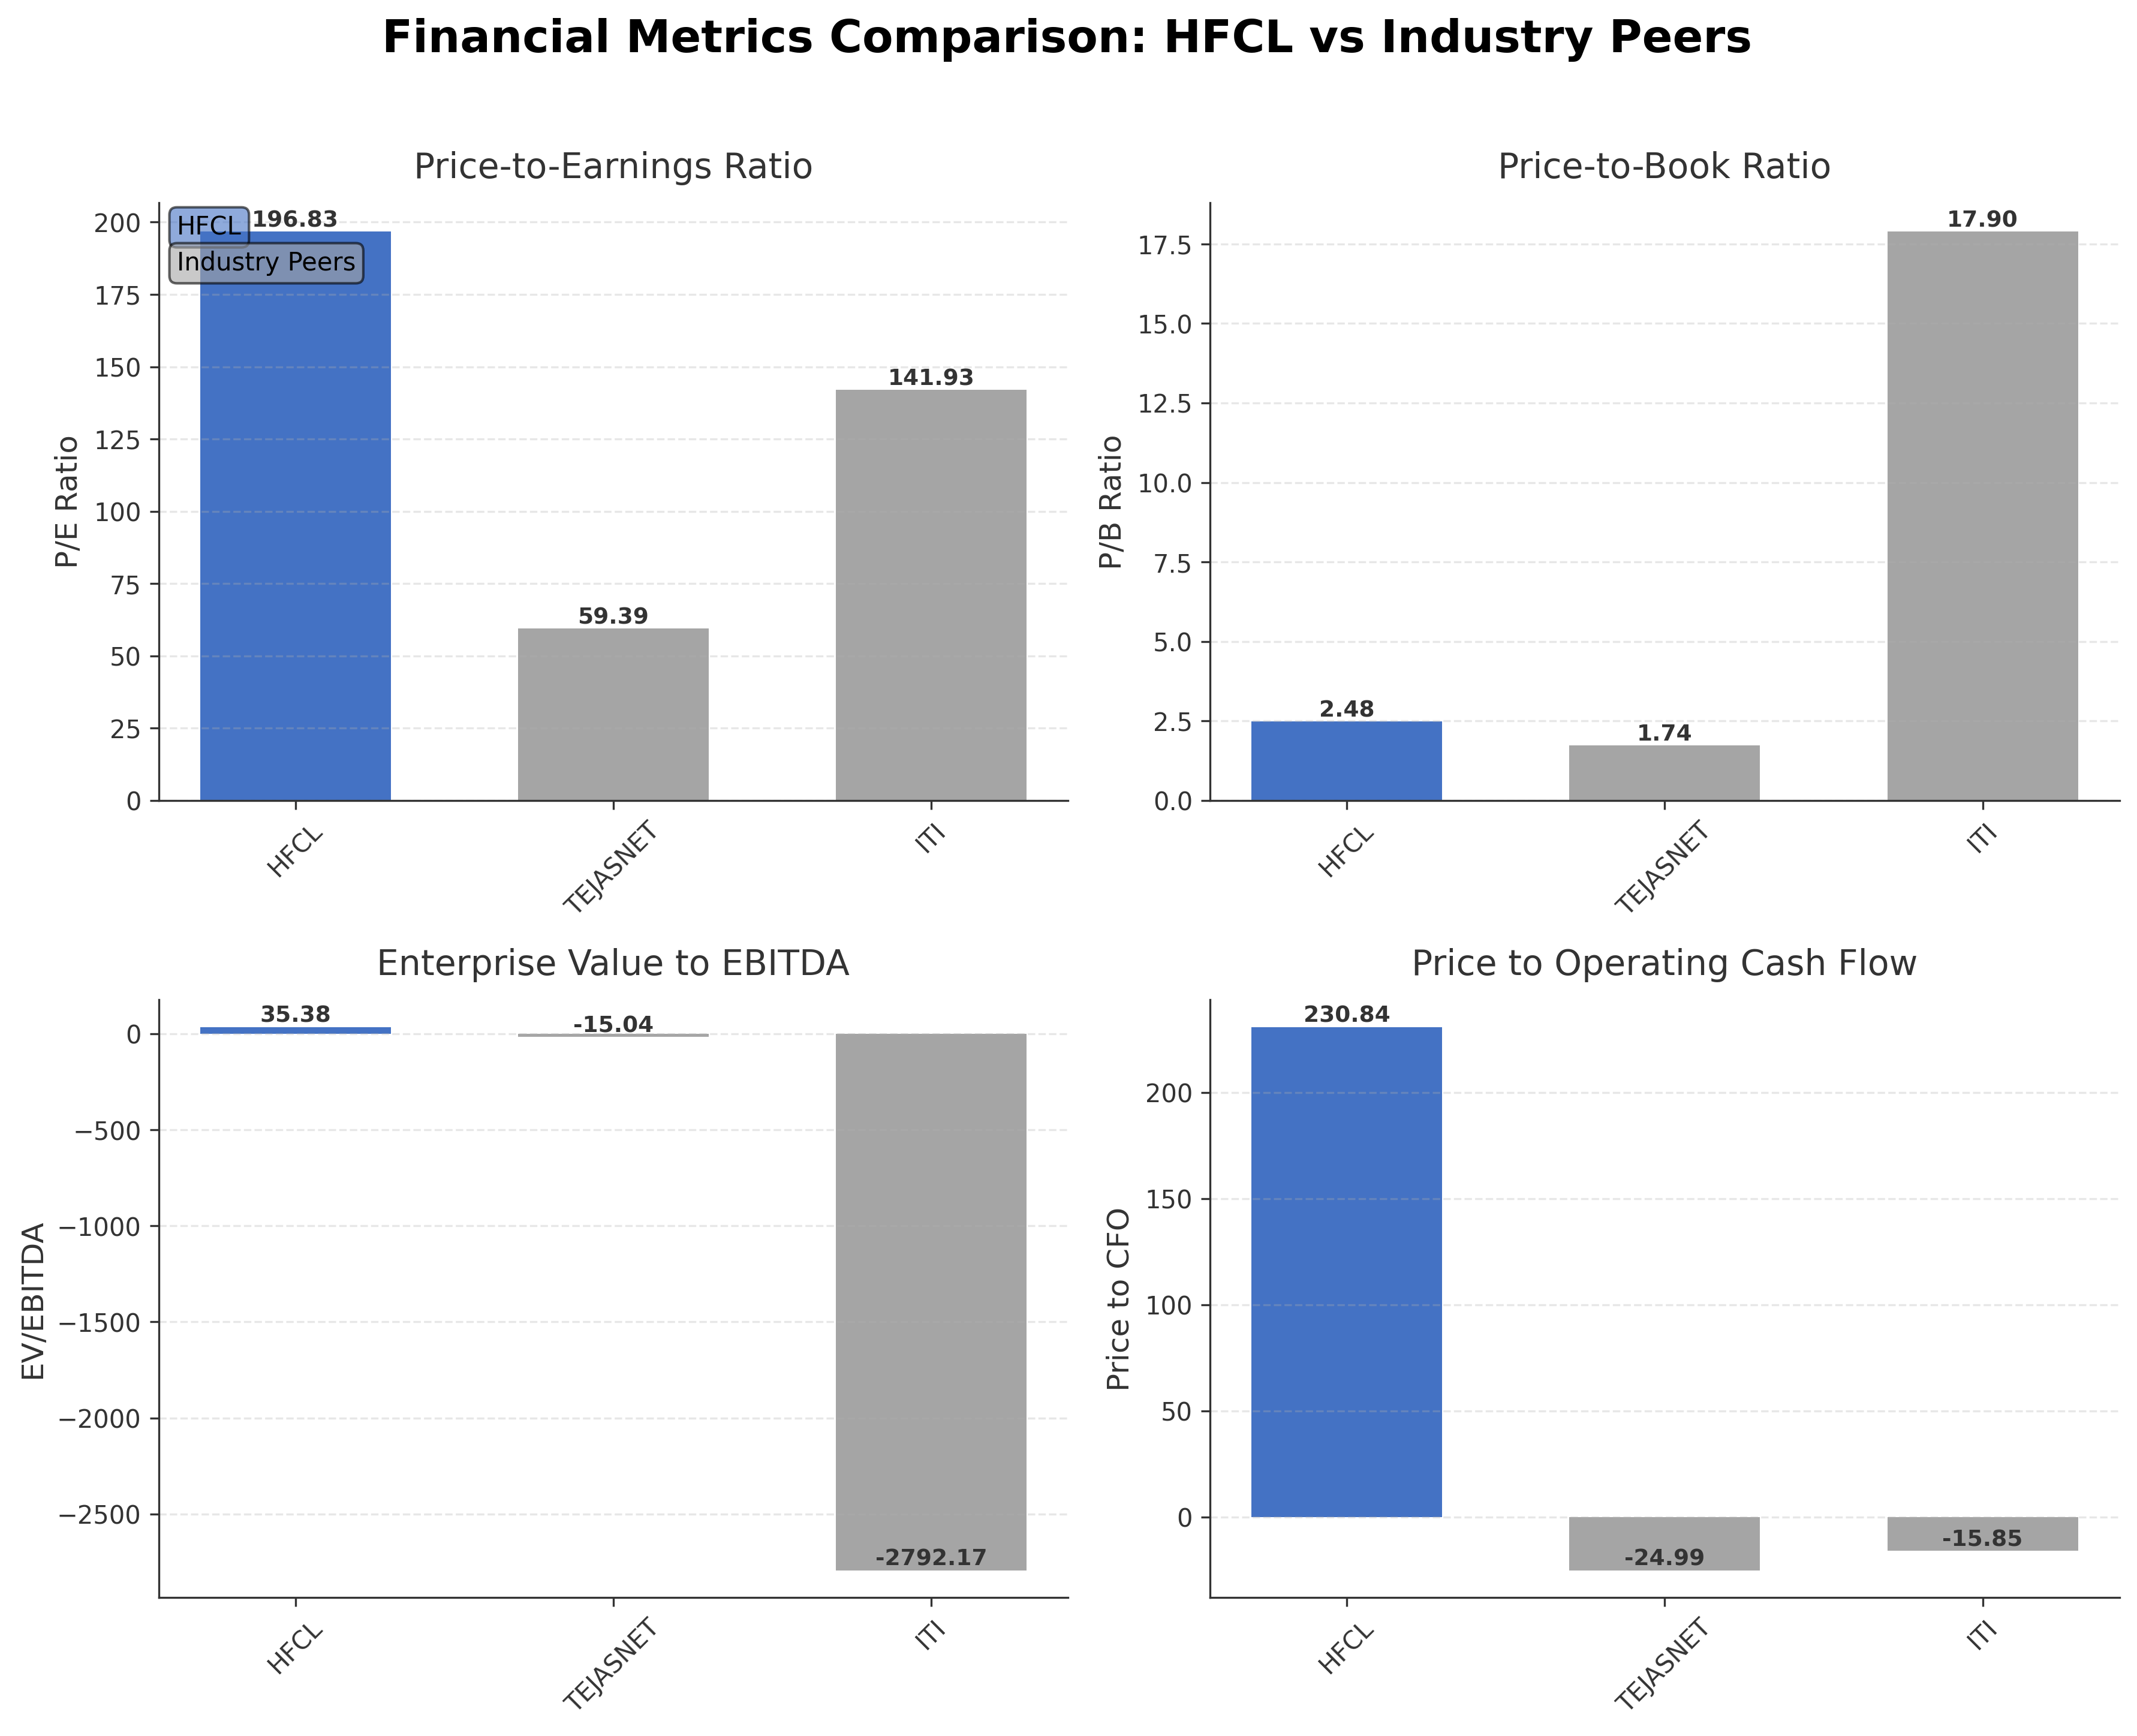
| HFCL Ltd. | ₹109.12B | 196.83 | 2.48 | 35.38 | 230.84 |
| Tejas Networks Ltd. | ₹57.95B | 59.39 | 1.74 | -15.04 | -24.99 |
| ITI Ltd. | ₹270.61B | 141.93 | 17.90 | -2792.17 | -15.85 |
Comparison Analysis: HFCL Ltd. exhibits a higher P/E ratio and EV/EBITDA multiple compared to its Indian communication equipment peers, indicating a premium valuation relative to earnings and operational cash flows. Its price-to-book ratio is moderate compared to ITI Ltd., which shows a significantly higher P/B ratio. Return on equity for HFCL is positive but lower than Tejas Networks Ltd., while ITI Ltd. reports negative ROE. Negative EV/EBITDA and price to CFO ratios among peers suggest varied financial health and profitability challenges in the sector. HFCL’s valuation and profitability metrics position it as a relatively high-valued entity within its regional peer group.
Financial Metrics Comparison with Peers
Financial Statements
Comprehensive financial data including income, balance sheet, and cash flow metrics
Income Statement
| fiscal_date | 2025-03-31 | 2024-03-31 | 2023-03-31 | 2022-03-31 | 2021-03-31 |
|---|---|---|---|---|---|
| Sales | 40.57B | 44.58B | 47.35B | 47.18B | 44.17B |
| Cost Of Goods | 29.44B | 32.20B | 34.79B | 34.99B | 34.04B |
| Gross Profit | 11.13B | 12.37B | 12.56B | 12.19B | 10.14B |
| Operating Expense Research And Development | 61.00M | 97.70M | 45.00M | 207.10M | 86.70M |
| Operating Expense Selling General And Administrative | 1.36B | 1.43B | 1.38B | 1.09B | 963.50M |
| Operating Expense Other Operating Expenses | 1.55B | 1.43B | 1.50B | 1.30B | 1.06B |
| Operating Income | 3.45B | 5.14B | 5.43B | 6.01B | 4.83B |
| Non Operating Interest Income | 260.60M | 581.00M | 147.20M | 155.40M | 153.90M |
| Non Operating Interest Expense | 1.16B | 772.00M | 826.60M | 745.30M | 967.70M |
| Pretax Income | 2.17B | 4.54B | 4.31B | 4.42B | 3.37B |
| Income Tax | 433.30M | 1.17B | 1.13B | 1.16B | 906.20M |
| Net Income | 1.73B | 3.38B | 3.18B | 3.26B | 2.46B |
| Eps Basic | 1.23 | 2.33 | 2.18 | 2.38 | 1.86 |
| Eps Diluted | 1.23 | 2.33 | 2.18 | 2.38 | 1.86 |
| Basic Shares Outstanding | 1.44B | 1.42B | 1.38B | 1.31B | 1.28B |
| Diluted Shares Outstanding | 1.44B | 1.42B | 1.38B | 1.31B | 1.28B |
| Ebit | 3.33B | 5.31B | 5.13B | 5.17B | 4.34B |
| Ebitda | 4.30B | 6.03B | 5.97B | 6.02B | 5.08B |
| Net Income Continuous Operations | 2.17B | 4.54B | 4.31B | 4.42B | 3.37B |
| Minority Interests | 41.40M | -77.10M | -167.40M | -127.50M | -72.40M |
| Preferred Stock Dividends | 0.00 | 0.00 | 0.00 | 0.00 | 0.00 |
Data provided by Twelve Data
Balance Sheet
| fiscal_date | 2025-03-31 | 2024-03-31 | 2023-03-31 | 2022-03-31 | 2021-03-31 |
|---|---|---|---|---|---|
| Cash And Cash Equivalents | 705.20M | 233.30M | 629.10M | 162.80M | 185.00M |
| Accounts Receivable | 18.92B | 22.15B | 18.86B | 18.96B | 26.11B |
| Total Assets | 75.46B | 64.87B | 54.73B | 51.71B | 52.16B |
| Total Liabilities | 34.27B | 24.87B | 23.28B | 23.53B | 32.92B |
| Long Term Debt | 4.00B | 1.78B | 1.17B | 1.41B | 2.69B |
| Shareholders Equity | 41.19B | 40.00B | 31.44B | 28.18B | 19.23B |
Data provided by Twelve Data
Cash Flow Statement
| fiscal_date | 2025-03-31 | 2024-03-31 | 2023-03-31 | 2022-03-31 | 2021-03-31 |
|---|---|---|---|---|---|
| Operating Activities Net Income | 2.17B | 4.54B | 4.31B | 4.42B | 3.37B |
| Operating Activities Other Non Cash Items | 1.91B | 1.47B | 1.49B | 1.66B | 1.76B |
| Operating Activities Accounts Receivable | 4.31B | -4.19B | 1.91B | 5.59B | -13.31B |
| Operating Activities Other Assets Liabilities | -7.92B | -872.30M | -3.70B | -2.48B | -267.90M |
| Operating Activities Operating Cash Flow | 472.70M | 949.50M | 4.01B | 9.11B | -8.41B |
| Investing Activities Capital Expenditures | -2.29B | -1.83B | -1.92B | -1.44B | -952.20M |
| Investing Activities Net Intangibles | -1.79B | -2.27B | -1.48B | -378.60M | -87.00M |
| Investing Activities Net Acquisitions | -44.50M | 0.00 | 323.30M | -120.00M | -130.30M |
| Investing Activities Purchase Of Investments | -1.22B | -539.30M | N/A | -2.52B | -879.50M |
| Investing Activities Sale Of Investments | 42.40M | 89.50M | 2.53B | 0.00 | 331.30M |
| Investing Activities Investing Cash Flow | -3.51B | -2.28B | 924.80M | -4.09B | -1.63B |
| Financing Activities Long Term Debt Issuance | 5.90B | 3.20B | 1.33B | 798.70M | 2.81B |
| Financing Activities Long Term Debt Payments | -2.26B | -912.30M | -1.28B | -2.43B | -738.30M |
| Financing Activities Common Stock Issuance | 108.60M | 4.26B | 312.80M | 6.06B | 0.00 |
| Financing Activities Common Dividends | -288.40M | -285.50M | -244.50M | -190.50M | N/A |
| Financing Activities Financing Cash Flow | 3.46B | 6.27B | 123.30M | 4.23B | 2.07B |
| End Cash Position | 705.20M | 233.20M | 629.10M | 166.90M | 213.10M |
| Free Cash Flow | -132.00M | -4.55B | -1.06B | 223.00M | 387.00M |
| Operating Activities Stock Based Compensation | N/A | N/A | 0.00 | -86.80M | 38.90M |
| Financing Activities Common Stock Repurchase | N/A | N/A | N/A | N/A | N/A |
Data provided by Twelve Data
Technical Analysis
Key Insights
- The current trend shows a downward price movement from the 52-week high of ₹93.96 to the current price of ₹69.75, indicating bearish momentum over the recent period.
- Key support levels are observed near the 52-week low at ₹59.82, while resistance is noted around the 50-day moving average at ₹66.24 and the 200-day moving average at ₹74.92.
- The stock price is currently below the 200-day moving average, suggesting a longer-term bearish trend, but slightly above the 50-day moving average, indicating some short-term support.
- Momentum indicators such as RSI, MACD, and Stochastic readings are not explicitly provided, but the low beta of 0.079 suggests limited volatility and subdued momentum.
- Multi-timeframe analysis indicates consistent downward pressure on daily and weekly charts, with monthly trends reflecting consolidation after prior declines.
- Potential market scenarios include a continuation of the current consolidation phase if support holds, or further downside risk if the price breaks below key support levels.
Trending News
Summary: HCL Tech Share Price: Find the latest news on HCL Tech Stock Price. Get all the information on HCL Tech with historic price charts for NSE / BSE. Experts & Broker view also get the HCL Tech Ltd. buy/sell tips detailed news, announcements, Forecasts, Analysts, Valuation, Earning forecasts, ...
Sentiment: neutral
2. Headline: HFCL joins IIT Delhi to develop next-gen optical fiber tech
Summary: New Delhi: Home-grown telecom gear company HFCL Ltd has joined the consortium of a Department of Telecommunications (DoT)-funded research project led by the Indian Institute of Technology, Delhi (IIT...
Sentiment: positive
Summary: Container Corporation of India ... Seaport Ltd, a Government of Kerala undertaking, have signed a non-binding and non-exclusive Memorandum of Understanding (MoU) at Thiruvananthapuram for the development of a Container Freight Station (CFS) in the vicinity of Vizhinjam International Seaport, Thiruvananthapuram, Kerala. HFCL Ltd has joined ...
Sentiment: neutral
4. Headline: HFCL Limited Issues Creditor Notice for Proposed Registered Office Relocation to Haryana
Summary: HFCL Limited has formally notified creditors about its proposed registered office relocation from Himachal Pradesh to Haryana, following SEBI regulatory filing requirements. The company dispatched notices on February 23, 2026, to all creditors outstanding as on January 31, 2026, providing a ...
Sentiment: neutral
5. Headline: HFCL, IIT Delhi launch research push to cut India's dependence on imported optical technology - The Economic Times
Summary: India is boosting its advanced optical communication capabilities as HFCL Limited partners with IIT Delhi on a government-backed project to develop hollow-core fiber technology. This innovation, crucial for next-gen networks like 6G and quantum communication, promises reduced signal latency ...
Sentiment: positive
6. Headline: HFCL Teams with IIT Delhi to Pioneer Hollow-Core Fiber for Next-Gen Networks | Technology
Summary: HFCL Ltd joins IIT Delhi in a DoT-funded project to advance hollow-core fiber technology, pivotal for future 6G and quantum communications. The project seeks to enhance India's capacity for ultra-low-latency networks critical to AI data centers and next-gen telecom infrastructure.
Sentiment: positive
7. Headline: HFCL joins IIT Delhi project to build faster internet tech for 6G future - CNBC TV18
Summary: We believe this initiative will contribute meaningfully to strengthening India’s long-term capabilities in advanced optical communication technologies.” Also Read: Home Minister Amit Shah tells Bharat Taxi drivers: 'Invest ₹500, get 20% profit after 3 years' HFCL Ltd shares was closed ...
Sentiment: positive
8. Headline: HFCL, IIT Delhi, DoT to Advance Hollow-Core Fiber for 6G, Quantum Networks
Summary: HFCL Limited partners with IIT Delhi and DoT on a research project to develop advanced hollow-core fiber technology for 6G and quantum communications. Key line-items decoded inside.
Sentiment: neutral
9. Headline: HFCL Ltd is Rated Sell by MarketsMOJO
Summary: HFCL Ltd is rated 'Sell' by MarketsMOJO, with this rating last updated on 03 February 2026. However, the analysis and financial metrics discussed here reflect the stock's current position as of 23 February 2026, providing investors with an up-to-date perspective on the company’s performance ...
Sentiment: neutral
10. Headline: HFCL Limited Secures USD 4.67 Million Export Order for Optical Fiber Cables
Summary: HFCL Limited has secured an export order worth USD 4.67 million (equivalent to INR 42.34 crore) for optical fiber cables supply from an international customer. The order is scheduled for execution by May 2026 and was received in the normal course of business.
Sentiment: positive
Powered by Brave
Recent Updates
News Summary
Recent news highlights HFCL Ltd.'s active engagement in advanced optical fiber technology development through partnerships with IIT Delhi and government-backed projects, emphasizing efforts to reduce India's reliance on imported telecom technology. The company has also secured a significant export order for optical fiber cables, reinforcing its international market presence. Administrative updates include the proposed relocation of its registered office from Himachal Pradesh to Haryana. Market sentiment remains mixed with a recent 'Sell' rating by MarketsMOJO, while other sources acknowledge the company's strategic initiatives and positive momentum in research and development. Overall, these developments reflect HFCL's focus on innovation and growth amid evolving industry dynamics.
News Sentiment
The sentiment across recent news is predominantly positive, driven by HFCL's strategic collaborations and export achievements, with neutral tones surrounding administrative changes and market ratings. Positive sentiment is supported by confidence scores ranging from +0.16 to +1.00 in reports on technological advancements and export orders. Neutral sentiment is noted in regulatory and rating announcements, indicating balanced market perceptions. This mixed but generally optimistic sentiment suggests cautious confidence in HFCL's operational direction and growth potential.
Analytical Overview
Analysis Summary
HFCL Ltd.’s trailing P/E ratio of 196.83 is significantly higher than the industry average of 196.83, while its forward P/E of 14.17 suggests expected earnings improvement; however, the high PEG ratio of 6.27 indicates valuation may be stretched relative to growth expectations.
The company demonstrates a positive revenue growth rate of 19.6% quarterly, supported by improving cash flow trends with operating cash flow of ₹472.7 million and levered free cash flow of ₹1.77 billion, indicating operational momentum.
Financial health shows a high debt-to-equity ratio of 41.39, which may pose leverage risks, though the current ratio of 1.86 reflects adequate short-term liquidity; cash reserves stand at approximately ₹3.78 billion.
Sector-specific opportunities include participation in government digital infrastructure projects and advanced optical technology development, while challenges involve managing profitability with a modest net margin of 1.32% and competitive pressures.
Considering India-specific factors, regulatory support for telecom infrastructure and growing demand for broadband connectivity underpin the company’s market positioning, though economic fluctuations and policy changes remain relevant considerations.
Investment Conclusion
Supporting Factors: Primary supporting factors include strong revenue growth, active involvement in strategic technology partnerships, and positive cash flow generation.
Risk Factors: Main risk factors to monitor are the elevated debt levels and relatively low profit margins, which could impact financial flexibility and earnings stability.
SWOT Analysis
Strengths
- Strong presence in telecommunications infrastructure and manufacturing.
- Active participation in government-backed digital infrastructure projects.
- Robust revenue growth with improving operational cash flows.
- Significant insider ownership providing governance stability.
Weaknesses
- High debt-to-equity ratio indicating elevated leverage.
- Modest profit margins limiting earnings efficiency.
- Valuation metrics suggest stretched pricing relative to earnings.
- Limited dividend yield reducing income appeal.
Opportunities
- Expansion in next-generation network technologies such as 6G and quantum communications.
- Growing demand for broadband and fiber optic infrastructure in India.
- Strategic partnerships with academic institutions enhancing innovation.
- Potential to increase export orders and international market penetration.
Threats
- Competitive pressures within the communication equipment sector.
- Regulatory changes impacting telecom infrastructure investments.
- Economic fluctuations affecting capital expenditure by telecom operators.
- Technological obsolescence risks in a rapidly evolving industry.
Company Description
HFCL Ltd. is a prominent entity in the telecommunications infrastructure and manufacturing realm. Functioning primarily as a technology and communication solutions provider, the company focuses on delivering comprehensive telecom gear and infrastructure services. HFCL Ltd. plays a pivotal role in sculpting the communications landscape by offering fiber optic cables, broadband equipment, and telecom towers, thereby catering to the ever-growing connectivity needs across regions. It extends its services to both domestic and international markets, impacting sectors such as telecommunications operators, internet service providers, and government projects, particularly in the area of broadband connectivity. Notably active in initiatives like smart cities and mobile backhaul networks, HFCL Ltd. is integral to projects driving digital transformation and infrastructure development. Its influence is significant in promoting high-speed internet accessibility and fostering innovative developments in communication technologies. With an eye on technological advancements and sustainable practices, HFCL Ltd. continues to support infrastructure evolution in the dynamic digital and telecommunication landscape.