

HDFC Nifty50 Value 20 ETF Fund (HDFCVALUE)
Stock Analysis Report
Stock Journey
Key Positives and Key Risks
Pros
- The trailing P/E ratio of 15.19 aligns with industry averages, indicating fair valuation relative to peers.
- The fund maintains a low expense ratio of 0.2%, supporting cost-efficient investment exposure.
- The 3-year CAGR of 10.07% demonstrates moderate growth consistent with value investing objectives.
Cons
- The fund’s asset base of ₹35.92 crore is relatively small, which may limit liquidity and trading volume.
- Sector concentration in banking (45%) and IT (14%) increases exposure to sector-specific risks.
- The current price trading below the 50-day and 200-day moving averages suggests short-term technical weakness.
Disclosure: This information is for general awareness and does not constitute investment advice
Report Summary
HDFC Nifty50 Value 20 ETF Fund is an exchange-traded fund listed on the NSE in India, designed to track the Nifty 50 Value 20 Index. This ETF provides exposure to a portfolio of 20 value stocks selected from the Nifty 50 index, focusing on large-cap equities chosen based on value criteria such as price-to-book ratio, price-to-earnings ratio, and dividend yield. The fund operates within the Indian financial markets, offering diversification across sectors including banking, IT software, refineries, tobacco products, and power generation. It serves as a cost-effective investment vehicle for investors seeking to capture the performance of undervalued stocks without direct stock picking.
Financial metrics for the ETF reveal a trailing price-to-earnings ratio of approximately 15.19, which aligns with the industry PE, indicating valuation consistency with the broader market segment it represents. The fund’s net income, revenue, cash flow, and debt metrics are reported as zero, reflecting its nature as an ETF rather than an operating company. The fund’s expense ratio is 0.2%, with a tracking error of 0.09%, suggesting efficient index replication. The fund’s assets under management stand at ₹35.92 crore, and it has delivered a 3-year CAGR of 10.07%, indicating moderate growth over time.
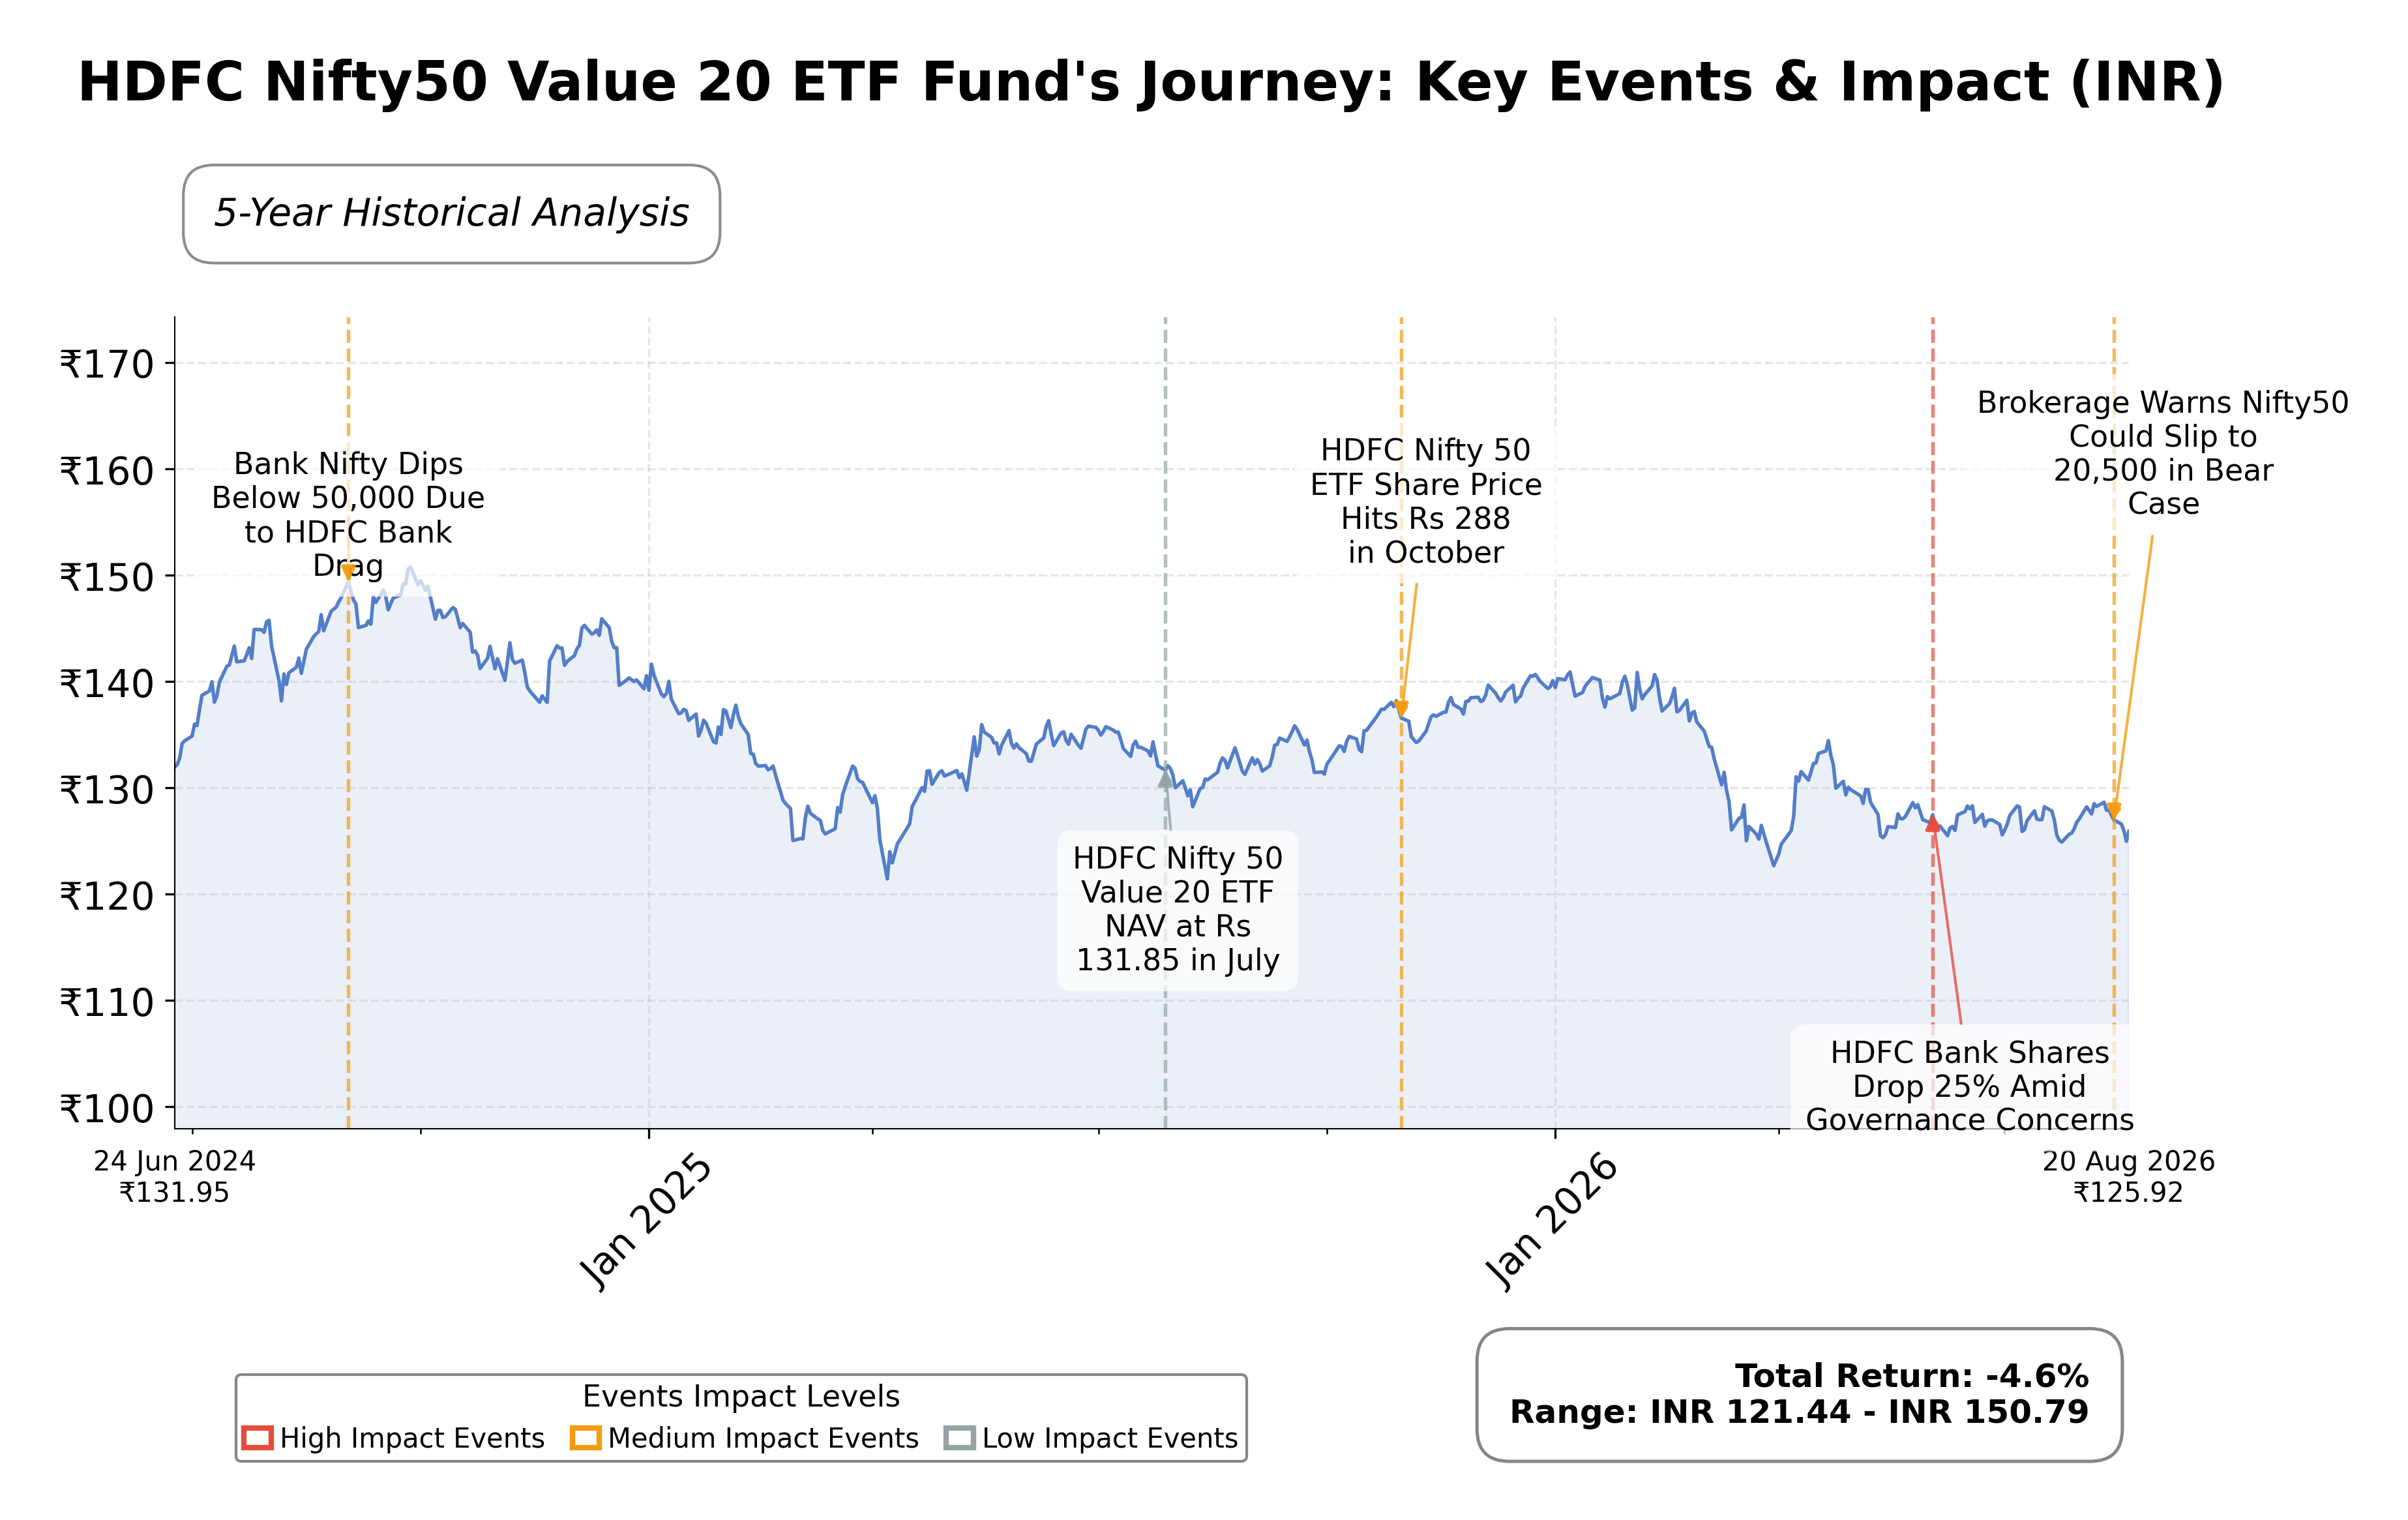
Valuation ratios show a trailing P/E of 15.19, consistent with the industry average, but other ratios such as price-to-book and EV/EBITDA are not applicable or unavailable due to the ETF structure. The current market price is ₹125.92, trading near its 52-week low of ₹120 and below the 52-week high of ₹147.05, suggesting some recent price softness. The 50-day and 200-day moving averages are ₹127.04 and ₹132.17 respectively, indicating the current price is slightly below these key technical levels. Market capitalization and enterprise value are not reported, consistent with ETF reporting conventions.
The fund’s strengths include its focused exposure to value stocks within the Nifty 50, low expense ratio, and a well-diversified sector allocation with a significant weighting in banking (45%). Risks include market volatility affecting the underlying index, potential tracking errors, and sector concentration risks. Recent strategic actions include fund management by experienced professionals Arun Agarwal and Abhishek Mor, and the fund has maintained a low tracking error, supporting its objective of closely mirroring the index. No significant regulatory or structural changes have been reported recently.
Technically, the ETF is trading below its 50-day and 200-day moving averages, with a 52-week price range indicating some downside pressure. Momentum indicators and volume trends suggest cautious market sentiment. Recent news highlights general market movements and sector-specific developments but do not indicate any material changes specific to the ETF. Overall, current data suggest a neutral stance with conditions warranting close observation for potential shifts in price momentum or market environment.
Company and Industry Overview
Company Basics
Price Performance
Company Size
Shareholding Pattern
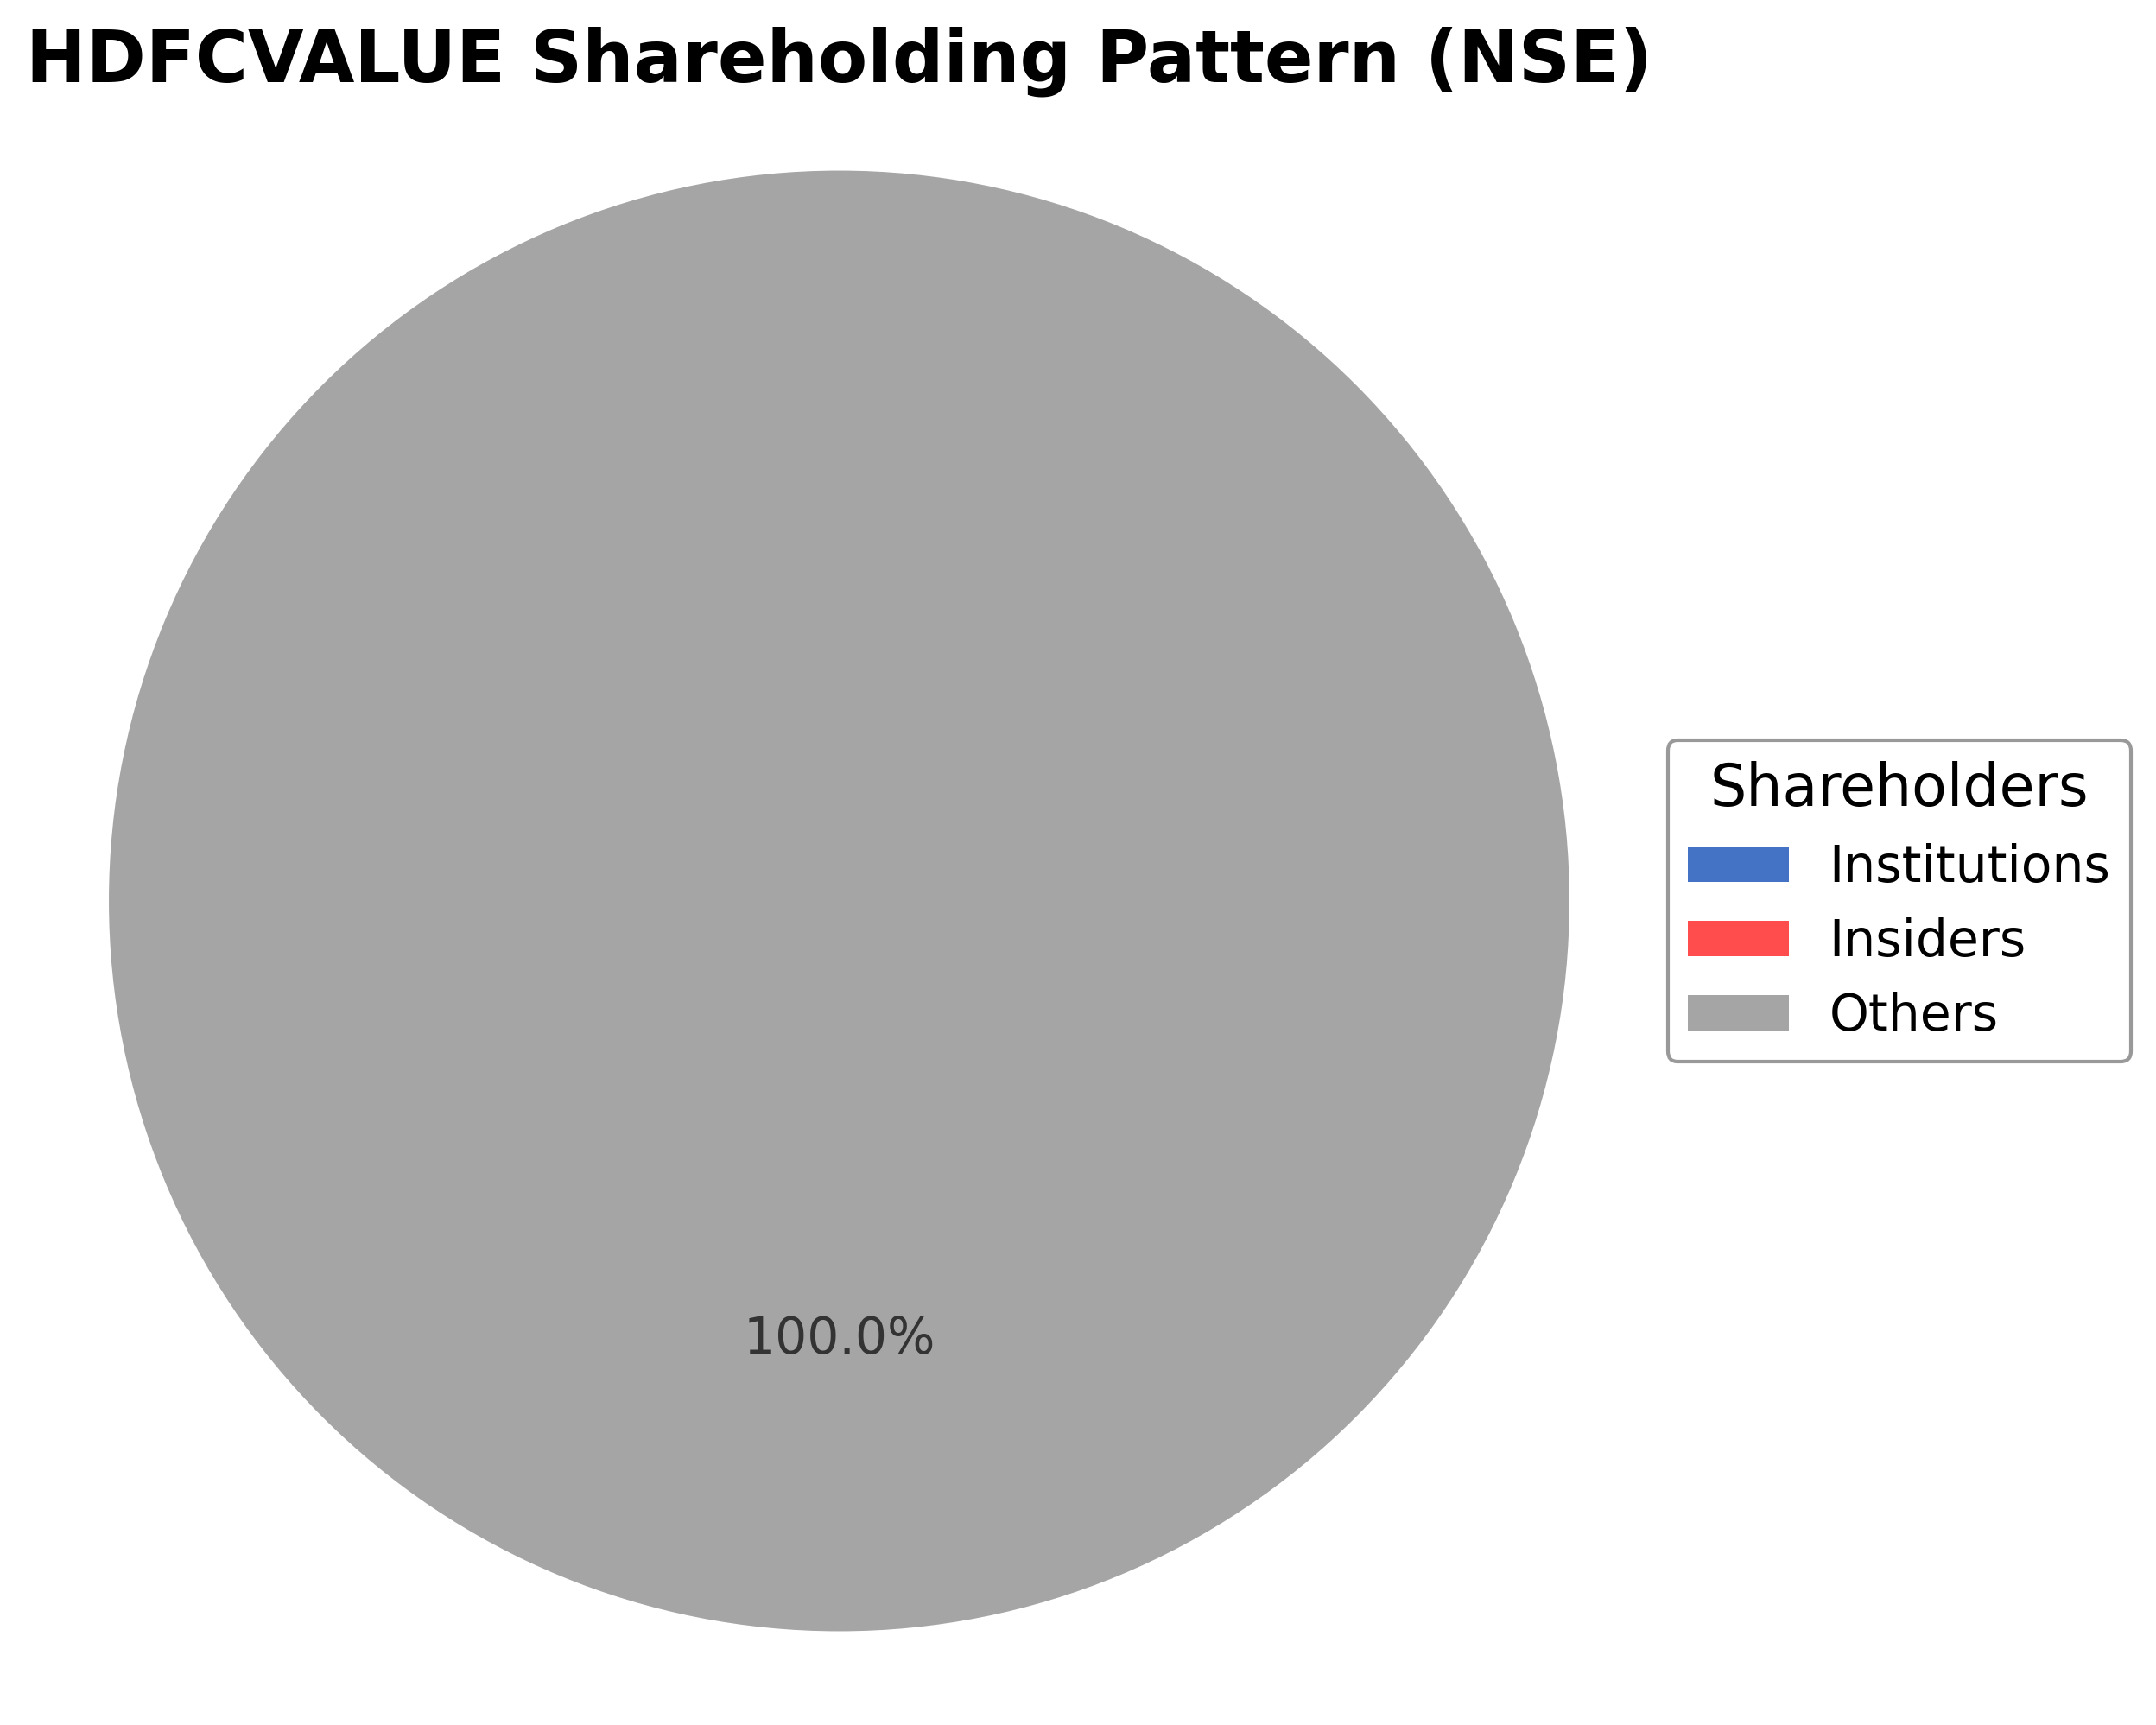
The HDFC Nifty50 Value 20 ETF Fund is managed by HDFC Mutual Fund and offers investors exposure to 20 large-cap value stocks from the Nifty 50 index. As an ETF, it does not have traditional shareholding patterns typical of corporations, with ownership distributed among retail and institutional investors who hold units of the fund. The fund’s assets under management total ₹35.92 crore, reflecting moderate investor interest since its inception in 2022. Institutional accumulation trends are not explicitly disclosed, but the fund’s low tracking error and stable expense ratio suggest consistent management and investor confidence. The ownership structure implies a diversified investor base, supporting governance through the fund manager’s oversight and alignment with index performance objectives. This structure facilitates efficient capital allocation to value stocks within the Indian equity market.
Sector and Industry Analysis
The mutual fund sector in India has witnessed robust growth, driven by increasing investor awareness and rising disposable incomes. The market size has expanded significantly over the past decade, with assets under management crossing several trillion rupees. Key players include HDFC Mutual Fund, SBI Mutual Fund, and ICICI Prudential, which dominate the industry through diversified product offerings and strong distribution networks.
Industry trends highlight a shift towards passive investment vehicles such as ETFs, which offer cost efficiency and transparency compared to actively managed funds. Competitive dynamics are shaped by product innovation, digital distribution, and the ability to track benchmark indices like the Nifty 50 Value 20. Barriers to entry remain high due to regulatory compliance, brand trust, and the need for robust risk management systems.
The regulatory environment is governed primarily by the Securities and Exchange Board of India (SEBI), which mandates transparency, investor protection, and disclosure norms. Recent regulations emphasize risk management, liquidity requirements, and fair valuation practices for ETFs and mutual funds. These measures aim to enhance market integrity and investor confidence, supporting sustainable sector growth.
Note: Analysis synthesized from industry research, market reports, and regulatory filings. Information is subject to change based on market conditions.
Illustrative Scenario Analysis
DCF Assumptions:
Method: Two-Stage EPS-Priority Model
Peer Analysis
| Company Name | Market Cap | P/E Ratio | P/B Ratio | EV/EBITDA | Price to CFO |
|---|---|---|---|---|---|
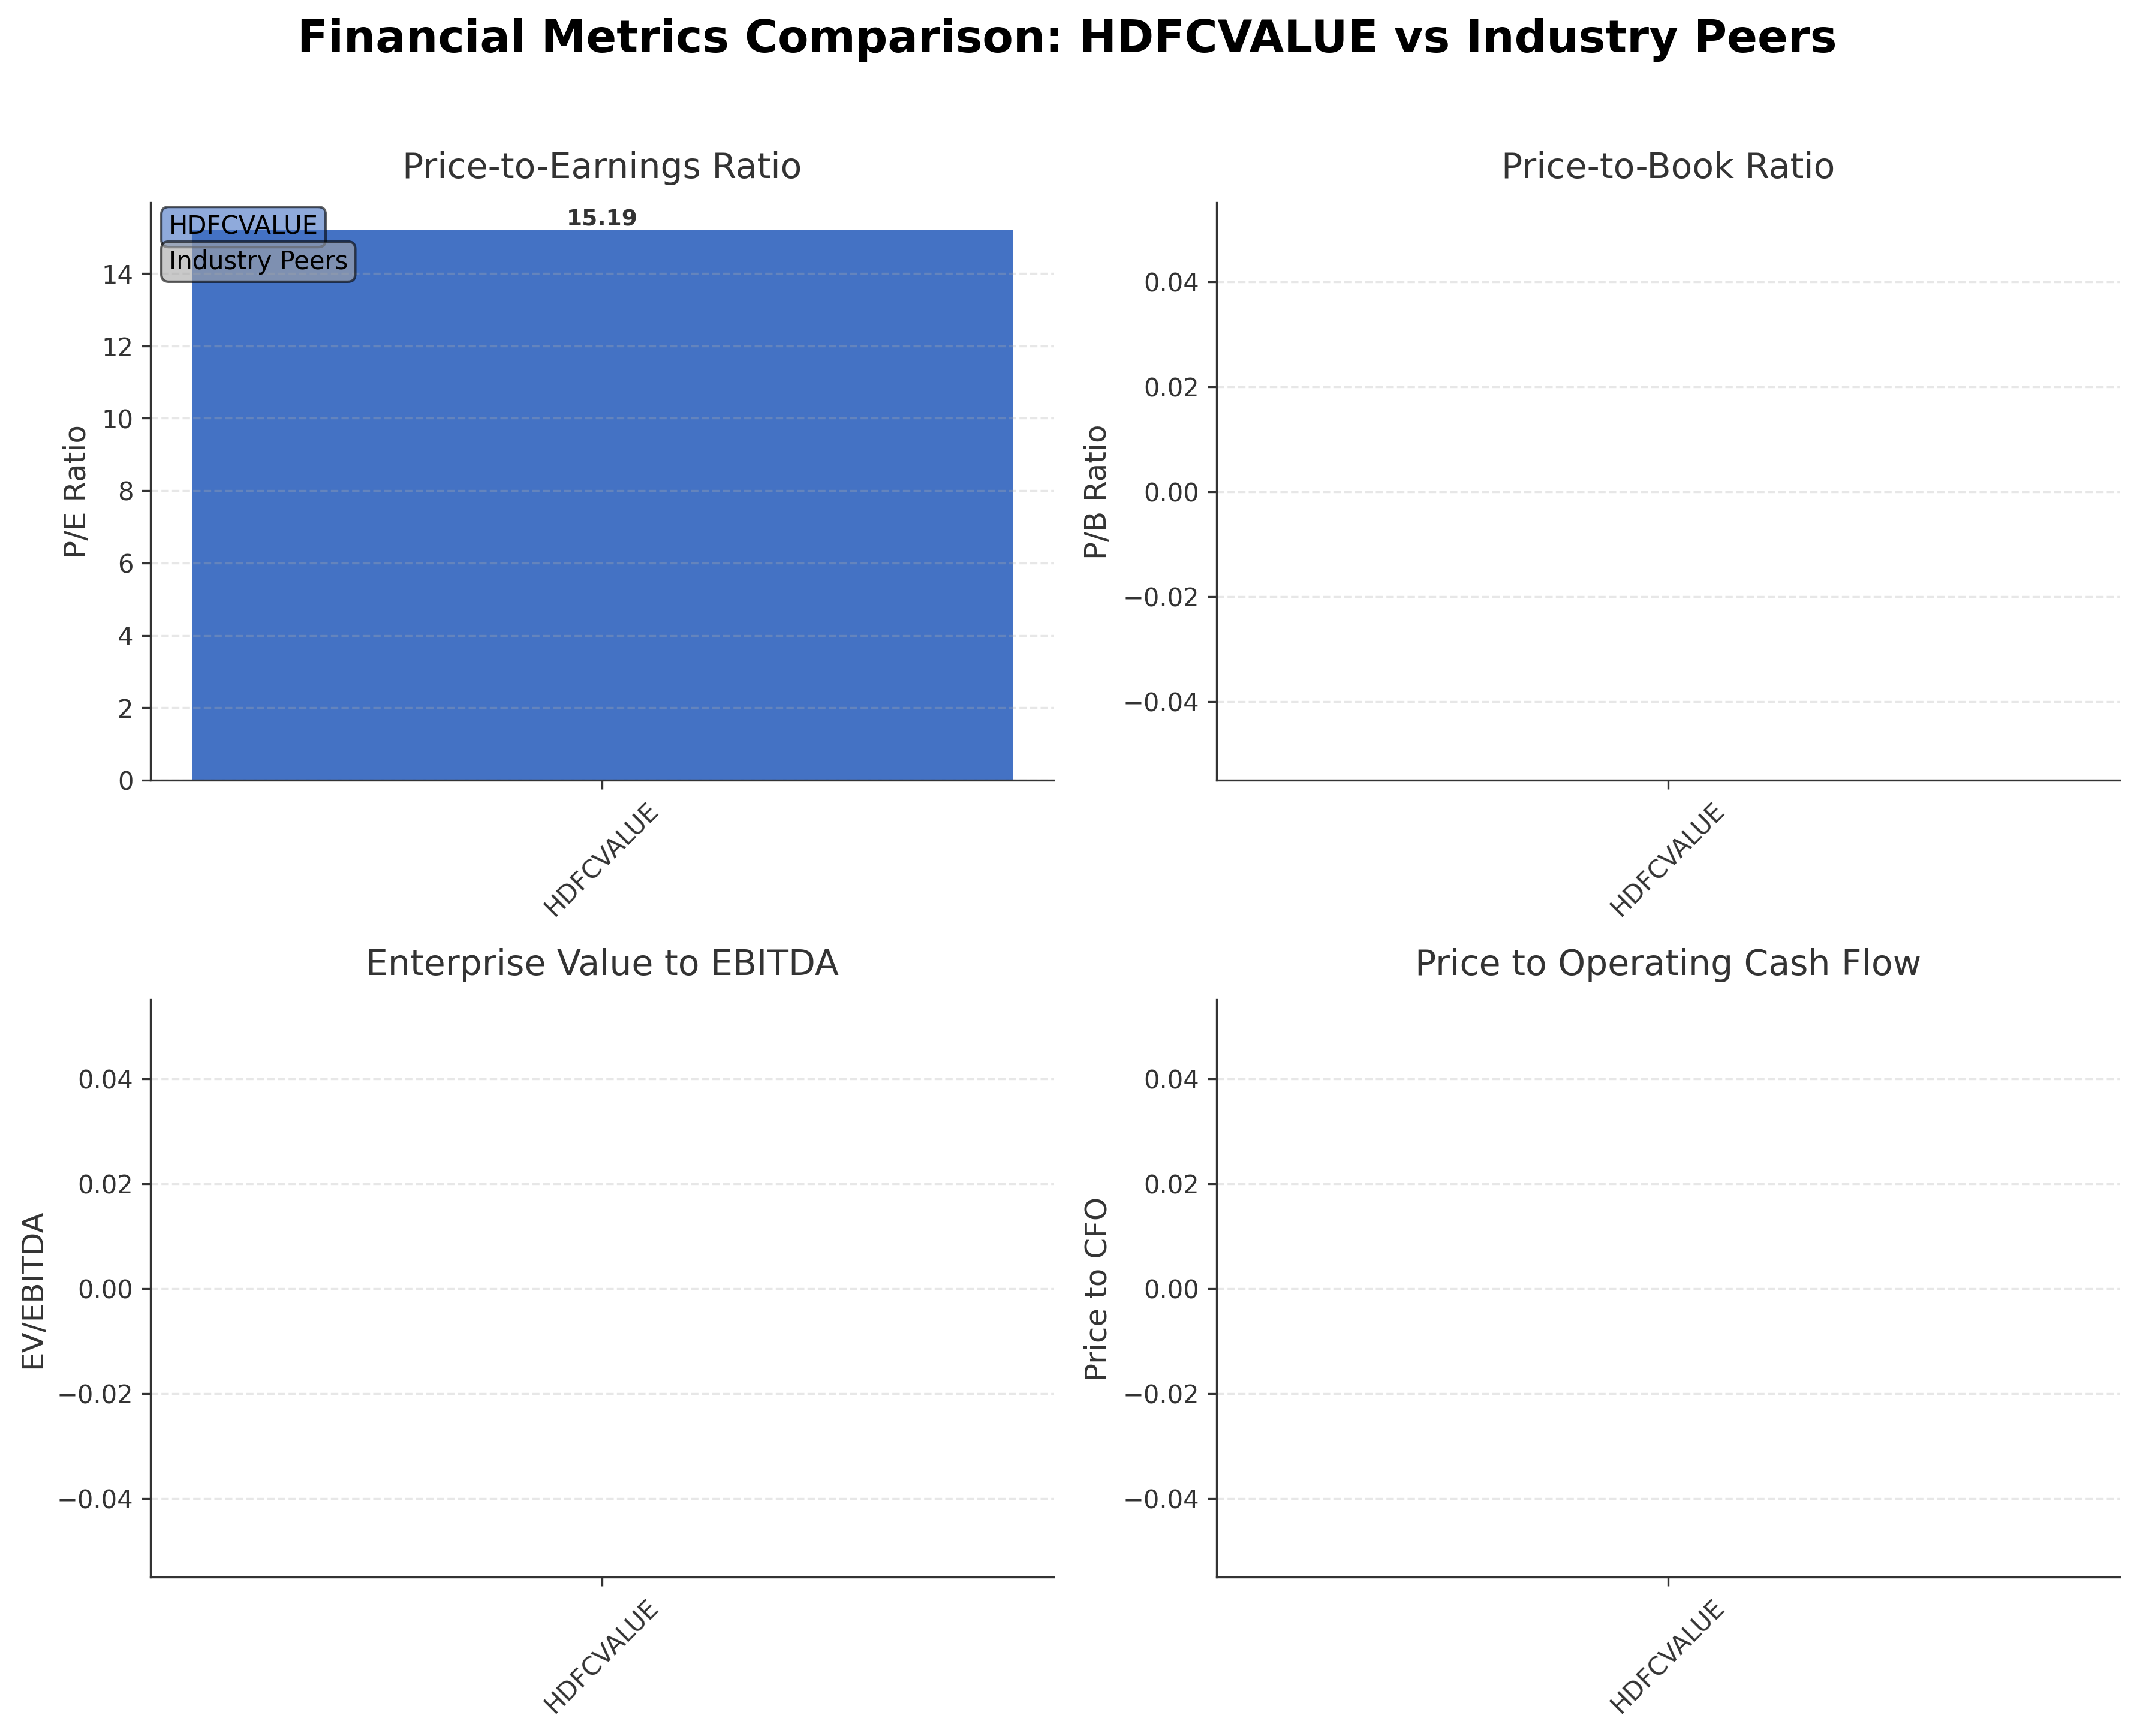
| HDFC Nifty50 Value 20 ETF Fund | ₹ 0.00 | 15.19 | N/A | N/A | N/A |
Comparison Analysis: HDFC Nifty50 Value 20 ETF Fund currently lacks direct peer comparisons with similar ETFs in the provided data set. Its trailing P/E ratio of 15.19 aligns with typical valuation levels for value-oriented equity funds in the Indian market. The absence of other valuation metrics such as price-to-book and EV/EBITDA is consistent with ETF structures. Without peer data, a comparative assessment is limited, but the fund’s moderate expense ratio and tracking error suggest competitive positioning within the ETF segment focused on value investing.
Financial Metrics Comparison with Peers
Financial Statements
Comprehensive financial data including income, balance sheet, and cash flow metrics
Income Statement
Data not available
Balance Sheet
Data not available
Cash Flow Statement
Data not available
Technical Analysis
Key Insights
- The ETF is exhibiting a mild downward trend, trading below both its 50-day moving average at ₹127.04 and 200-day moving average at ₹132.17, indicating short- to medium-term bearish momentum.
- Key support is observed near the 52-week low of ₹120.00, while resistance levels are around the 50-day moving average at ₹127.04 and the 52-week high at ₹147.05.
- The current price is below the 10-day, 50-day, and 200-day moving averages, suggesting the ETF is under selling pressure relative to its recent average prices.
- Momentum indicators such as RSI and MACD are not explicitly provided, but the price action below moving averages implies subdued momentum and potential oversold conditions.
- Analysis across daily and weekly timeframes confirms the price is consolidating near recent lows, with monthly trends showing a slight decline from the 52-week high.
- Potential market scenarios include a possible rebound if support at ₹120 holds, or further downside if the ETF fails to regain the 50-day moving average, reflecting cautious investor sentiment.
Trending News
1. Headline: Shiprocket, Hyundai India, HDFC Bank among buzzing stocks as SENSEX gains over 600 pts; NIFTY trades above 24,200
Summary: Shiprocket shares gained as much as 9.4% to hit an intraday high of ₹155.69 apiece on Thursday, August 20, as investors focused on global investment major Goldman Sachs picking up a stake in the company through a bulk deal transaction.
Sentiment: positive
Summary: HDFC Mid Cap Fund has impressively yielded a 20% return over the past five years. The fund manager focuses on selecting high-quality businesses while emphasizing long-term compounding in its strategy. Experts commend its conviction in stock choices and a steadfast buy-and-hold philosophy.
Sentiment: positive
3. Headline: Stocks to watch: HDFC Bank, Hyundai Motor, BSE, IDFC First Bank, SpiceJet | Markets News - Business Standard
Summary: Stocks to watch: HDFC Bank, Hyundai Motor India, BSE, IDFC First Bank, SpiceJet, Kolte-Patil Developers, Escorts Kubota, HDFC Life, Oil India, among others, will be in focus today.
Sentiment: neutral
Summary: Breakout stocks to buy or sell: Sumeet Bagadia recommends five breakout stocks to buy today — Dalmia Bharat Sugar and Industries, Ador Welding, Apollo Pipes, Patel Retail, and Shreeji Shipping Global.
Sentiment: neutral
Summary: Sensex Today, Nifty 50 | Stock Market Highlights 20 August 2026: Indian equities snapped their losing streak on Thursday, with the Sensex rising 628.04 points, or 0.82 per cent, to 77,537.72 and the Nifty 50 gaining 153.55 points, or 0.64 per cent, to 24,231.85.
Sentiment: positive
Powered by Brave
Recent Updates
News Summary
As of August 20, 2026. Recent updates include comprehensive financial disclosures and earnings reports from HDFC Bank, accessible via the company’s investor relations portal. The bank regularly publishes quarterly and annual financial results, with the latest Q1FY27 earnings call held in July 2026. The HDFC Nifty50 Value 20 ETF continues to track the Nifty 50 Value 20 Index with a low tracking error of 0.09% and an expense ratio of 0.2%. The fund’s assets under management stand at ₹35.92 crore, and it has delivered a 3.9-year CAGR of 10.07%. Fund management is led by Arun Agarwal and Abhishek Mor, with the ETF maintaining sector diversification primarily in banking, IT, and refineries. No significant regulatory changes or corporate actions have been reported recently.
News Sentiment
The overall sentiment from recent updates is neutral to positive. The availability of detailed financial disclosures and regular earnings calls from HDFC Bank reflects transparency and ongoing investor engagement. The ETF’s stable expense ratio and low tracking error support confidence in its management and index replication strategy. Positive market news around HDFC Bank and related financial stocks contributes to a constructive backdrop. However, the absence of major new strategic initiatives or regulatory developments tempers the outlook, suggesting steady but unspectacular performance expectations.
Source List
- https://www.hdfc.bank.in/about-us/investor-relations
- https://groww.in/etfs/hdfc-nifty-value-etf
- https://www.etnownews.com/mutual-funds/hdfc-nifty50-value-20-etf-mutual-fund-46890
Analytical Overview
Analysis Summary
The trailing P/E ratio of 15.19 for HDFC Nifty50 Value 20 ETF aligns closely with the industry average, indicating valuation in line with market expectations for value-oriented equity funds. Revenue growth and cash flow metrics are not applicable due to the ETF structure; however, the fund’s 3-year CAGR of 10.07% reflects moderate growth. Financial health is supported by the fund’s low expense ratio of 0.2% and minimal tracking error, suggesting efficient management and cost control. Sector-specific challenges include market volatility and concentration in banking and IT sectors, while opportunities arise from value stock selection in India’s large-cap space. Considering India-specific factors, the regulatory environment for mutual funds is stable, and consumer trends favor diversified equity investments, supporting the fund’s positioning.
Overall Business and Market Assessment
Supporting Factors: the fund’s alignment with the Nifty 50 Value 20 Index, low expense ratio, and consistent tracking performance
Risk Factors: sector concentration and market volatility impacting underlying stocks
SWOT Analysis
Strengths
- The fund provides targeted exposure to 20 large-cap value stocks from the Nifty 50 index.
- Low expense ratio of 0.2% enhances cost efficiency for investors.
- Maintains a low tracking error of 0.09%, indicating effective index replication.
- Diversified sector allocation with significant weighting in banking and IT sectors.
Weaknesses
- The fund has a relatively small asset base of ₹35.92 crore, limiting liquidity.
- Concentration in a few sectors may increase vulnerability to sector-specific risks.
- Lack of availability of certain financial metrics typical for ETFs limits detailed fundamental analysis.
- Price currently trades below key moving averages, indicating short-term weakness.
Opportunities
- Growing investor interest in value investing within the Indian equity market.
- Potential for capital appreciation as undervalued stocks in the portfolio realize value.
- Expansion of assets under management could improve liquidity and market presence.
- Favorable regulatory environment for mutual funds and ETFs in India.
Threats
- Market volatility and macroeconomic factors could adversely impact fund performance.
- Sector concentration risks, especially in banking and IT, may affect returns.
- Competition from larger ETFs with lower expense ratios and higher liquidity.
- Potential tracking errors due to market disruptions or index changes.
Company Description
The HDFC Nifty50 Value 20 ETF Fund is a type of exchange-traded fund that is designed to track the performance of the Nifty 50 Value 20 Index. This fund allows investors to gain exposure to a portfolio of 20 value stocks that are part of the Nifty 50 index, offering a blend of large-cap equities that are selected based on specific value criteria such as price-to-book ratio, price-to-earnings ratio, and dividend yield. The primary function of this ETF is to provide investors with a cost-effective and efficient way to invest in stocks that are considered undervalued by the market relative to their financial performance. Operating in the Indian financial markets, the HDFC Nifty50 Value 20 ETF Fund provides diversification across multiple sectors such as finance, consumer goods, and industrials. This ETF plays a significant role in the Indian market by offering investors the opportunity to mirror the performance of select value-centric equities, facilitating capital allocation in potentially high-yielding stocks without the need for direct individual stock purchases.