
HDB Financial Services Limited (HDBFS)
Stock Analysis Report
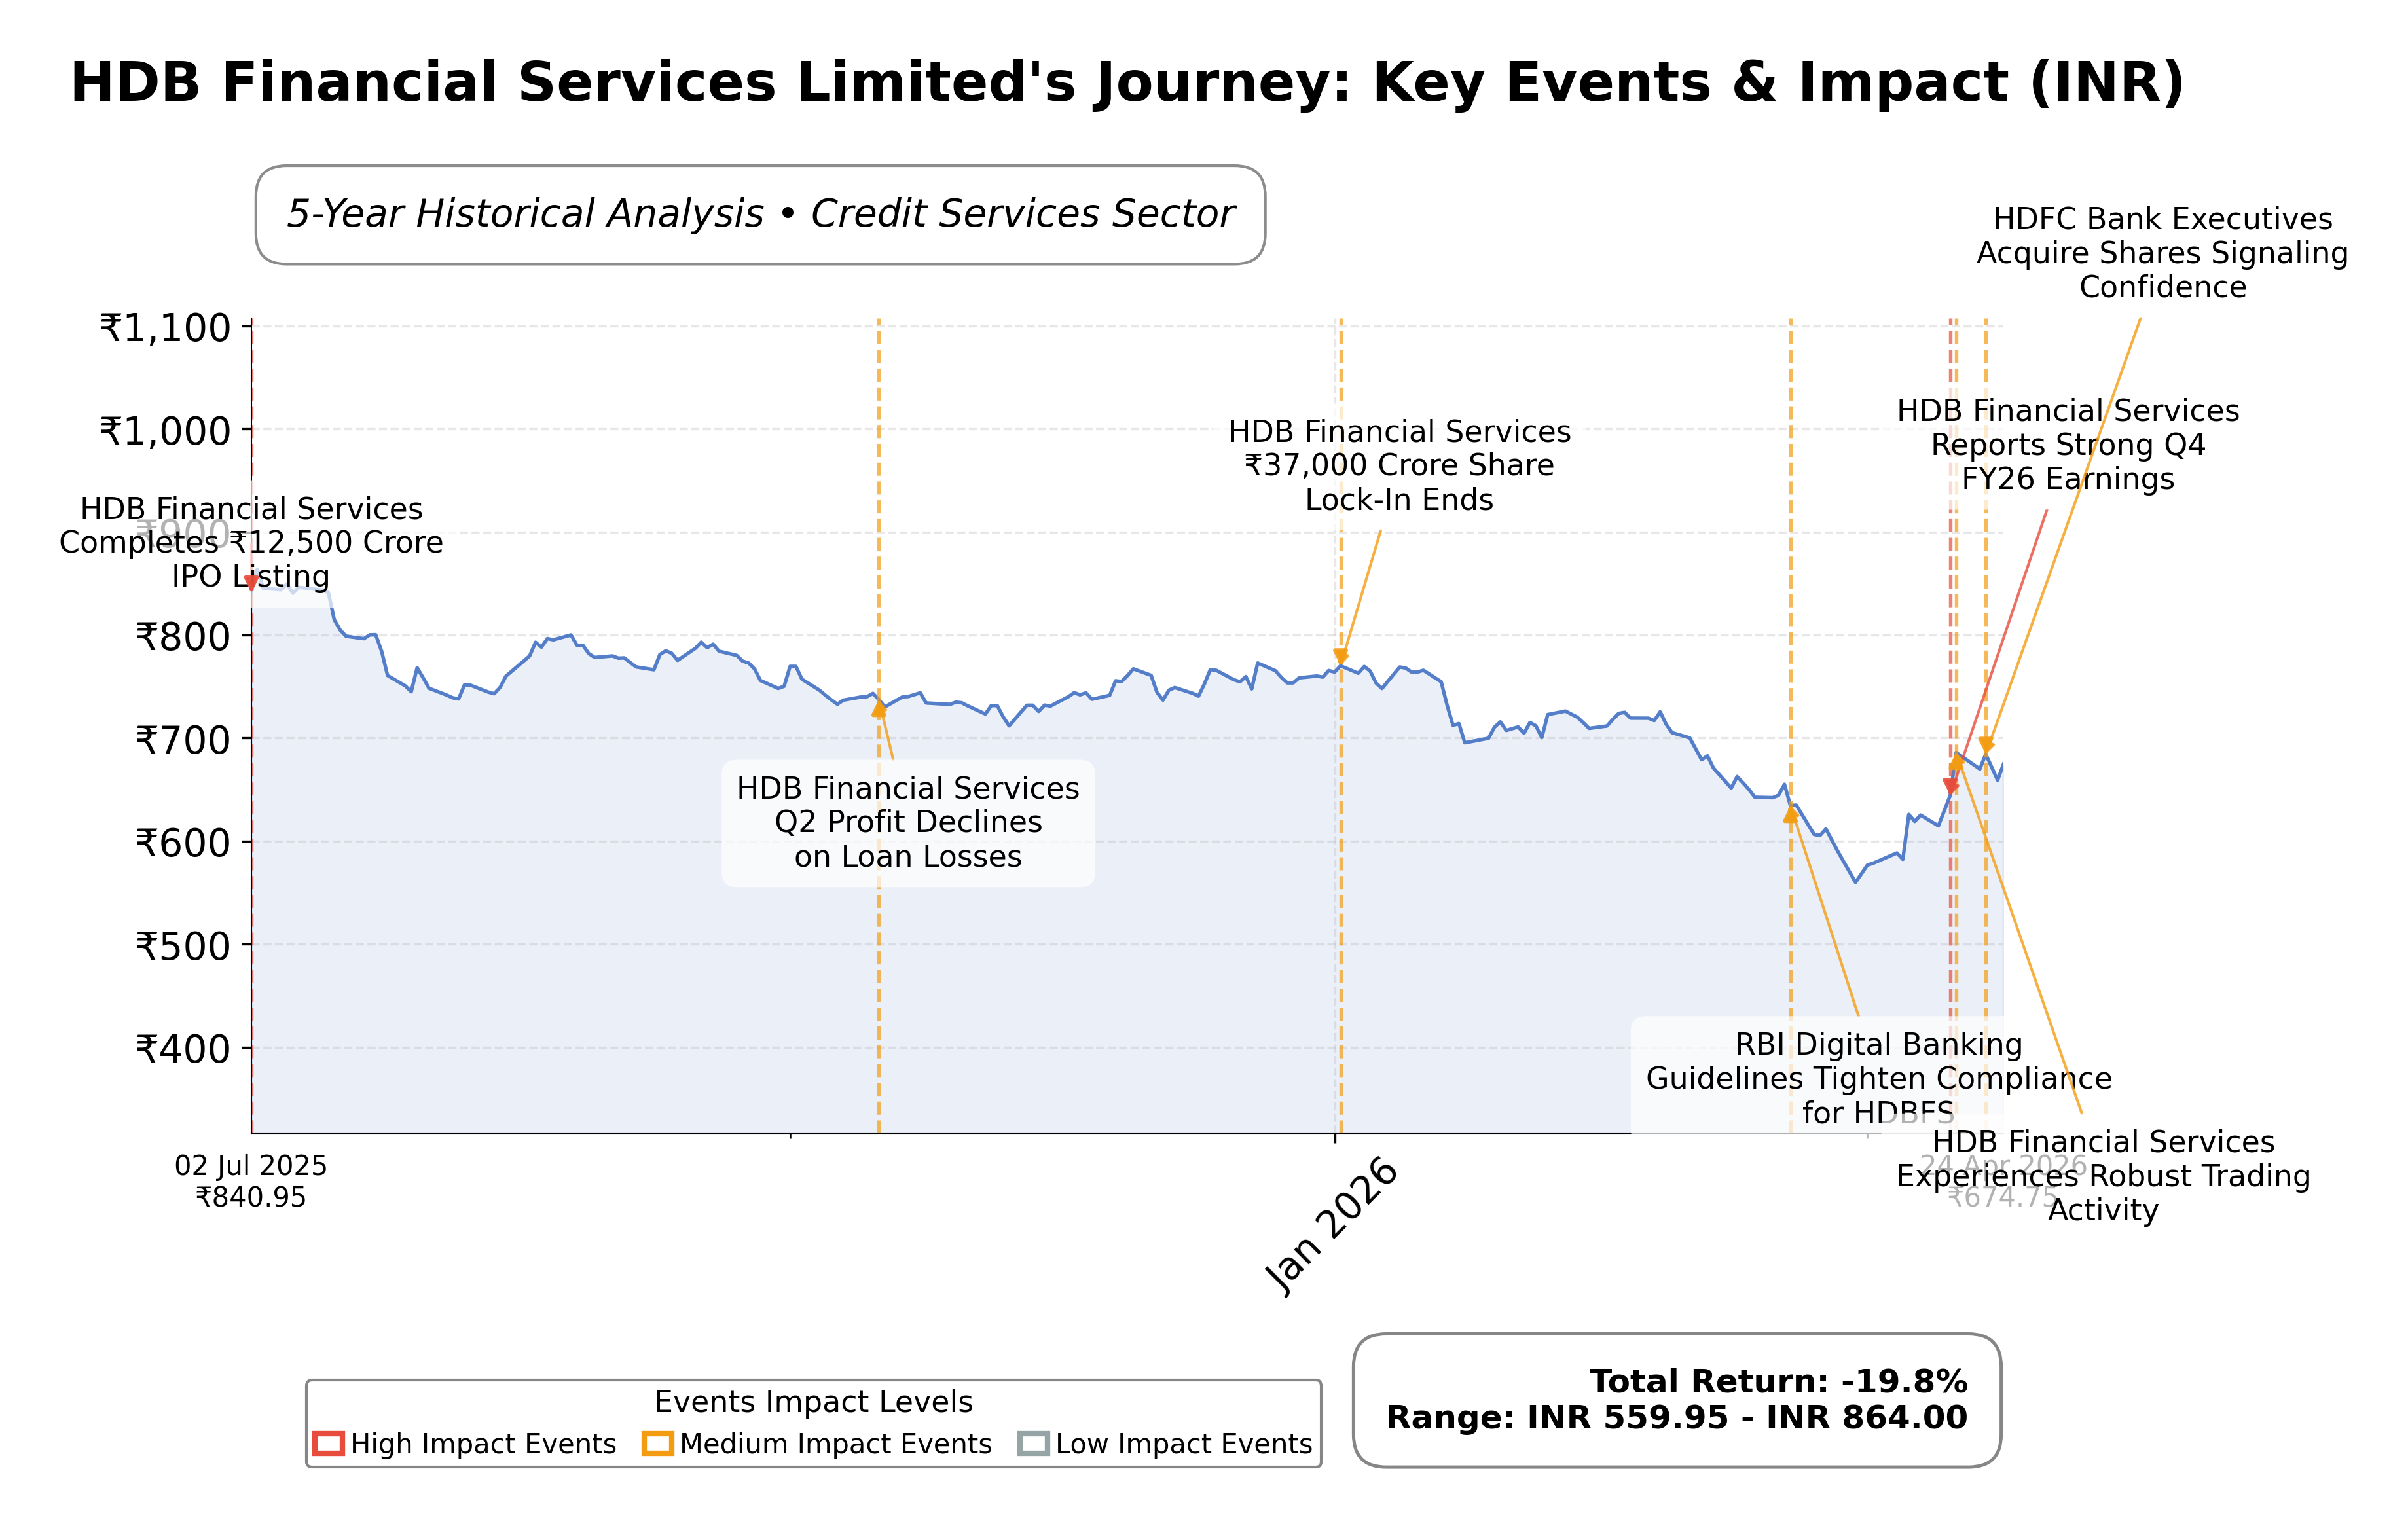
Stock Journey
Key Positives and Key Risks
Pros
- HDB Financial Services shows strong profitability with a net profit margin of 28.9%, indicating efficient operations.
- The company’s forward P/E ratio of 14.15 suggests expected earnings growth relative to current valuation.
- HDBFS maintains a large asset base of ₹1.24 trillion, supporting scale and market presence.
Cons
- High debt-to-equity ratio of 480.24 highlights significant leverage and associated financial risk.
- Negative operating cash flow of ₹-8.61 billion indicates potential challenges in core cash generation.
- Recent governance concerns and foreign institutional investor sell-offs may weigh on investor sentiment.
Disclosure: This information is for general awareness and does not constitute investment advice
Report Summary
HDB Financial Services Limited (HDBFS) is a leading non-banking financial company (NBFC) in India, operating primarily in the financial services sector on the NSE exchange. As a subsidiary of HDFC Bank, it offers a broad range of secured and unsecured lending products including personal loans, auto loans, business loans, gold loans, and mortgage finance. Additionally, it provides business process outsourcing services encompassing back-office operations and customer support. The company maintains a significant presence with over 1,700 branches across 27 states and four union territories, positioning itself as one of the largest NBFCs in India by assets under management.
Financially, HDBFS reported trailing twelve-month revenue of approximately ₹87.95 billion with a gross margin of 44.0%, operating margin of 42.5%, and net profit margin of 28.9%, reflecting strong profitability. The return on equity (ROE) stands at 13.9%, while return on assets (ROA) is 2.19%, indicating efficient capital utilization and asset management. The company’s operating cash flow is negative at ₹-8.61 billion, but levered free cash flow remains positive at ₹25.44 billion, suggesting effective cash generation after financing activities. Its total debt is substantial at ₹992.36 billion, with a high debt-to-equity ratio of 480.24, highlighting leverage as a key financial characteristic.
Valuation metrics show a trailing P/E ratio of 21.84 and a forward P/E of 14.15, with a price-to-book ratio of 2.71 and an EV/EBITDA multiple of 16.69. The market capitalization is approximately ₹559 billion. The stock price currently trades at ₹672, down about 24.6% from its 52-week high of ₹891.90 and above its 52-week low of ₹555.30. These valuation ratios suggest the stock is priced at a premium relative to some peers, but with a forward P/E indicating potential earnings growth expectations.
The company benefits from strong market leadership as a subsidiary of HDFC Bank, a diversified product portfolio, and a wide geographic footprint. Key risks include its high leverage, regulatory environment for NBFCs in India, and competitive pressures within the credit services sector. Recent strategic actions include share allotments under employee stock option schemes and preparations for potential fund-raising via non-convertible securities. Insider and institutional shareholdings remain modest, with insiders holding approximately 0.74% and institutions 13.38%.
Technically, the stock has experienced volatility with a recent price recovery but remains below its 200-day moving average of ₹726.47, indicating some resistance. Momentum indicators show mixed signals across multiple timeframes. Recent news highlights earnings growth and dividend considerations, but also note governance concerns and valuation scrutiny. Overall, the data suggests a nuanced market stance with factors supporting both cautious accumulation and profit-taking considerations.
Company and Industry Overview
Company Basics
Price Performance
Company Size
Shareholding Pattern
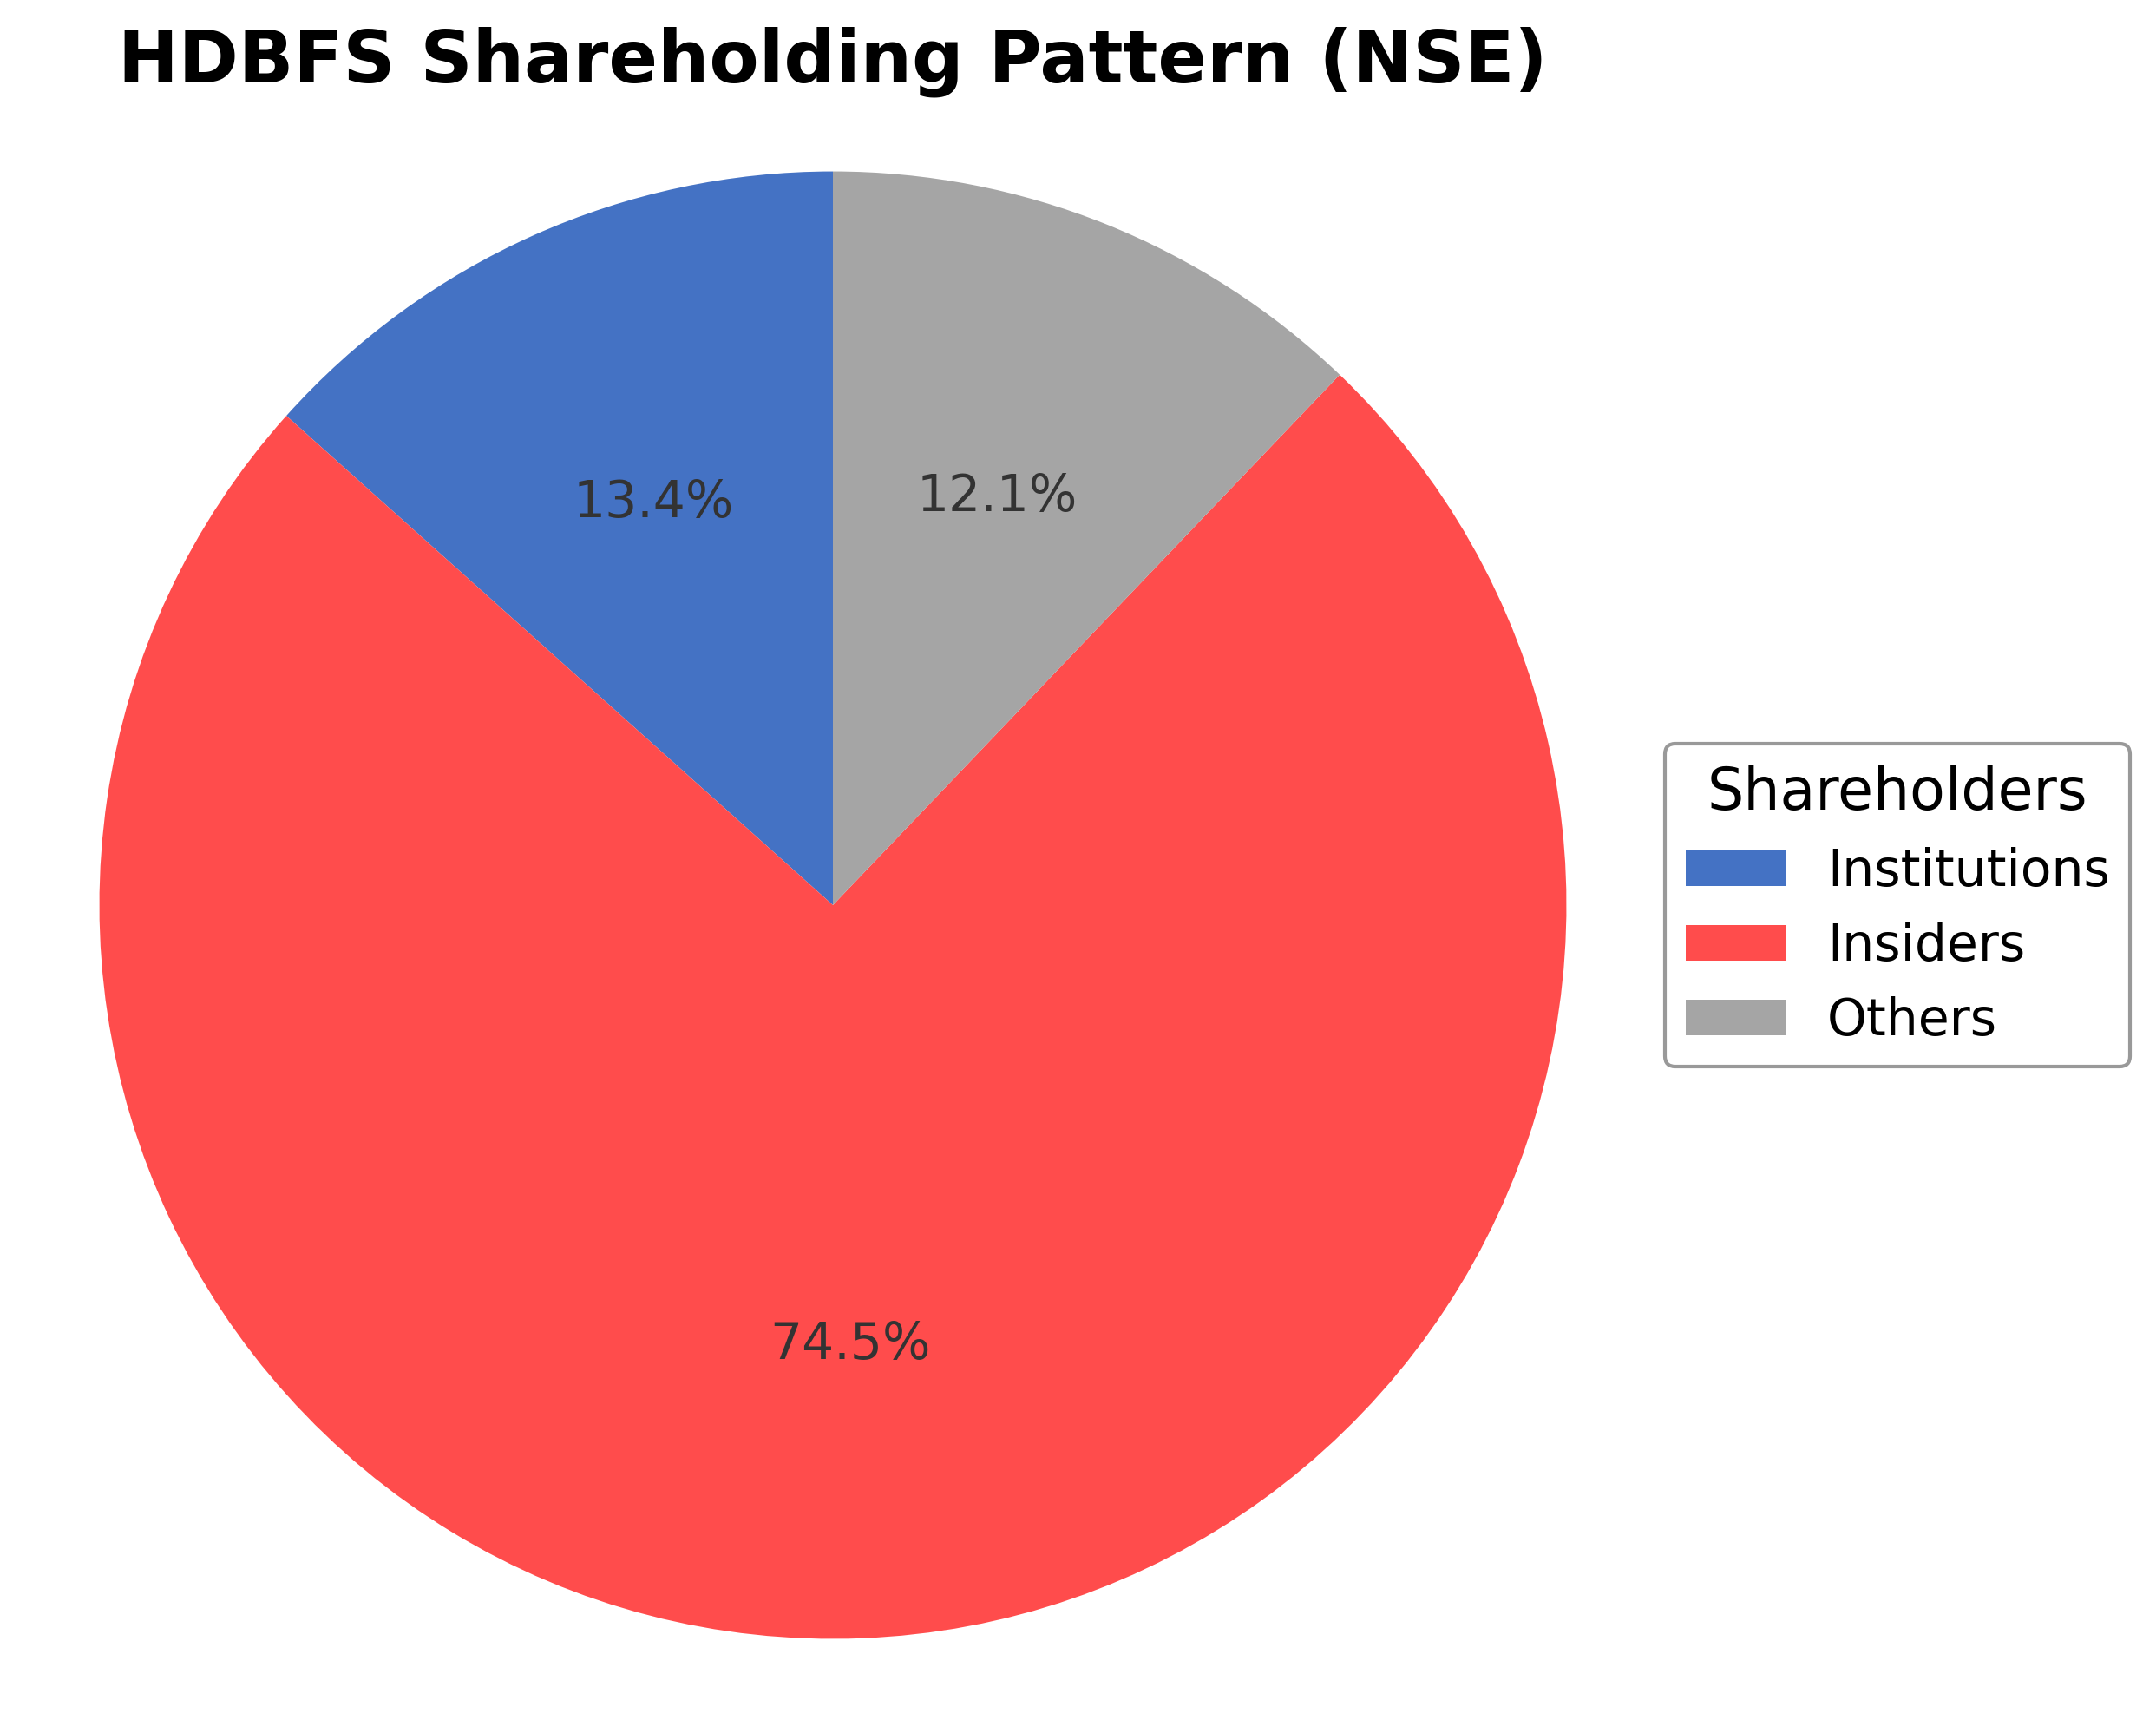
HDB Financial Services Limited’s ownership structure includes insiders holding approximately 0.74% of shares, institutional investors accounting for 13.38%, and the remaining shares held by public and other shareholders. The insider holding reflects limited executive and board member ownership, while institutional participation is moderate, indicating a balanced but not dominant institutional presence. Over the past 12-24 months, there have been no significant disclosed changes in ownership percentages. Institutional accumulation appears steady without notable large-scale increases or decreases by major funds. This shareholding pattern suggests a stable governance framework with moderate external investor influence, supporting consistent strategic direction aligned with its parent, HDFC Bank. The ownership distribution reflects typical market sentiment for a large Indian NBFC, balancing control and external oversight.
Sector and Industry Analysis
The Indian non-banking financial company (NBFC) sector has grown significantly over the past decade, driven by increasing credit demand from retail and small-to-medium enterprises. The sector's market size is substantial, with numerous players operating across urban and semi-urban regions, including HDB Financial Services, Bajaj Finance, and Mahindra Finance. Growth rates have been moderate to strong, supported by financial inclusion initiatives and expanding branch networks, with companies like HDBFS operating over 1,700 branches in more than 1,100 cities.
Industry trends show a shift towards digital lending platforms and diversification of loan products to cater to underserved segments. Competition is intense, with established NBFCs leveraging scale and technology to improve customer acquisition and risk management. Barriers to entry include regulatory compliance, capital requirements, and the need for extensive distribution networks, which favor well-capitalized and experienced players. HDBFS’s moderate sales growth and profitability metrics reflect the competitive pressures and evolving market dynamics.
The regulatory environment for NBFCs in India has tightened post-2018 due to concerns over asset quality and liquidity risks, with the Reserve Bank of India imposing stricter capital adequacy, provisioning norms, and governance standards. Compliance with these regulations has increased operational costs but also enhanced sector stability. Going forward, regulatory focus on transparency, risk management, and customer protection is expected to shape industry practices and influence growth trajectories in the NBFC sector.
Note: Analysis synthesized from industry research, market reports, and regulatory filings. Information is subject to change based on market conditions.
Financial Ratios Dashboard
Illustrative Scenario Analysis
DCF Assumptions:
Method: Two-Stage EPS-Priority Model
Financials
Peer Analysis
| Company Name | Market Cap | P/E Ratio | P/B Ratio | EV/EBITDA | Price to CFO |
|---|---|---|---|---|---|
| HDB Financial Services Limited | ₹558.97B | 21.84 | 2.71 | 16.69 | -6.50 |
| Cholamandalam Financial Holdings Limited | ₹294.64B | 12.44 | 2.16 | 34.05 | -1.09 |
| Indian Railway Finance Corporation Ltd. | ₹1.36T | 19.39 | 2.40 | 38.36 | -13.57 |
| Capri Global Capital Ltd. | ₹176.44B | 19.68 | 2.65 | 50.78 | -3.25 |
| Shriram Finance Ltd. | ₹2.38T | 18.97 | 3.14 | N/A | -17.91 |
| SBFC Finance Ltd. | ₹104.98B | 24.79 | 3.02 | 26.62 | -4.94 |
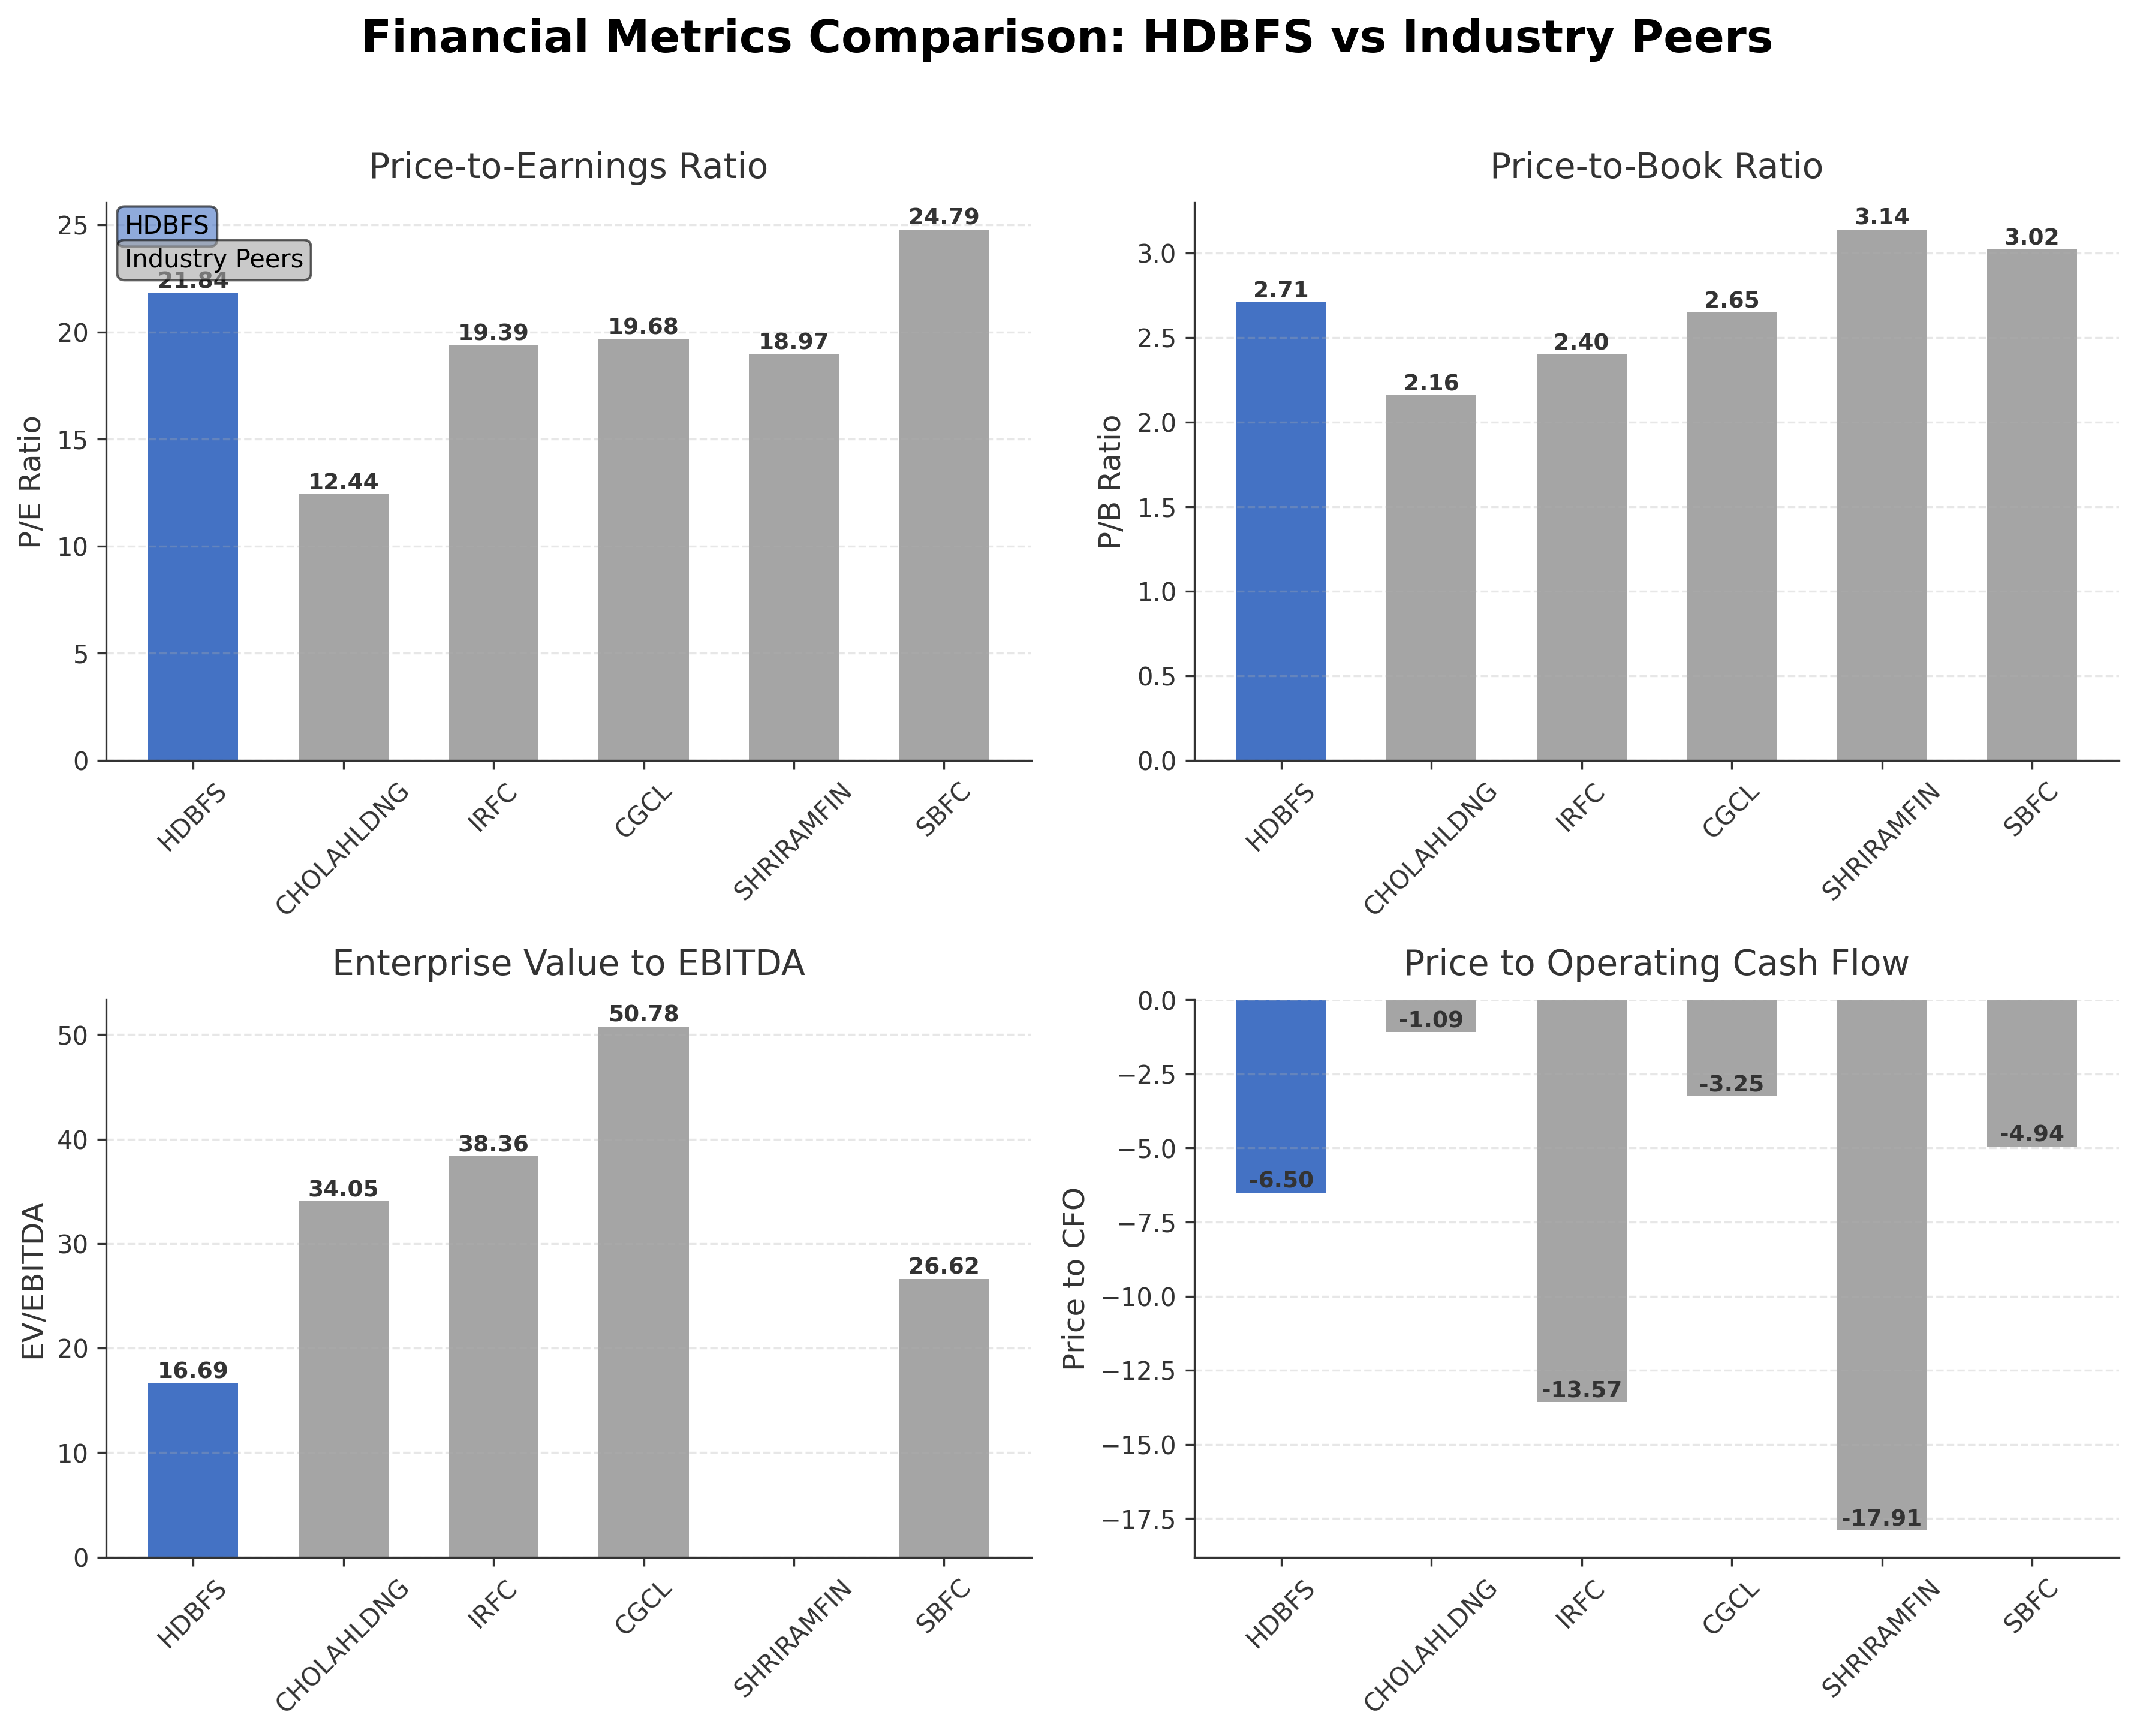
Comparison Analysis: HDB Financial Services Limited exhibits a higher P/E ratio (21.84) than most peers, indicating relatively higher earnings valuation, while its forward P/E (14.15) suggests expected earnings growth. Its price-to-book ratio of 2.71 is moderate compared to peers, reflecting balanced market valuation relative to book value. The EV/EBITDA multiple of 16.69 is lower than several peers like Capri Global Capital and Indian Railway Finance Corporation, indicating a more attractive enterprise valuation. However, the negative price-to-cash-flow ratio (-6.50) highlights challenges in operating cash flow relative to price. Return on equity at 13.95% is competitive, surpassing some peers but below Shriram Finance. Overall, HDBFS holds a strong market position with valuation metrics reflecting growth expectations tempered by cash flow considerations.
Financial Metrics Comparison with Peers
Financial Statements
Comprehensive financial data including income, balance sheet, and cash flow metrics
Income Statement
| fiscal_date | 2026-03-31 | 2025-03-31 | 2024-03-31 | 2023-03-31 |
|---|---|---|---|---|
| Sales | 183.78B | 162.45B | 139.46B | 122.44B |
| Cost Of Goods | 107.34B | 100.10B | 54.92B | 51.07B |
| Gross Profit | 76.45B | 62.35B | 84.54B | 71.37B |
| Operating Expense Other Operating Expenses | 12.86B | 10.55B | 5.58B | 4.80B |
| Operating Income | 61.50B | 49.85B | 70.32B | 59.10B |
| Pretax Income | 33.86B | 29.28B | 33.05B | 26.27B |
| Income Tax | 8.43B | 7.52B | 8.44B | 6.68B |
| Net Income | 25.44B | 21.76B | 24.61B | 19.59B |
| Eps Basic | 30.97 | 26.29 | 29.66 | 23.62 |
| Eps Diluted | 30.88 | 26.29 | 29.66 | 23.62 |
| Basic Shares Outstanding | 821.38M | 827.64M | 829.57M | 829.57M |
| Diluted Shares Outstanding | 821.38M | 827.64M | 829.57M | 829.57M |
| Ebit | 61.50B | 49.85B | 60.56B | 46.63B |
| Ebitda | 91.23B | 72.37B | 71.56B | 60.19B |
| Net Income Continuous Operations | 33.86B | 29.28B | 33.05B | 26.27B |
| Preferred Stock Dividends | 0.00 | 0.00 | 0.00 | 0.00 |
| Operating Expense Selling General And Administrative | N/A | 3.28B | 3.24B | 2.38B |
| Non Operating Interest Income | N/A | 1.65B | 1.13B | 742.00M |
| Non Operating Interest Expense | N/A | 34.86B | 27.51B | 20.36B |
Source: Financial statements and regulatory filings
Balance Sheet
| fiscal_date | 2026-03-31 | 2025-03-31 | 2024-03-31 | 2023-03-31 |
|---|---|---|---|---|
| Cash And Cash Equivalents | 12.46B | 9.50B | 6.48B | 3.96B |
| Accounts Receivable | 2.96B | 2.25B | 1.25B | 657.60M |
| Total Assets | 1236.52B | 1086.63B | 925.57B | 700.50B |
| Total Liabilities | 1029.88B | 928.44B | 788.14B | 586.13B |
| Long Term Debt | 922.54B | 509.61B | 487.63B | 353.52B |
| Shareholders Equity | 206.64B | 158.20B | 137.43B | 114.37B |
Source: Financial statements and regulatory filings
Cash Flow Statement
| fiscal_date | 2026-03-31 | 2025-03-31 | 2024-03-31 | 2023-03-31 |
|---|---|---|---|---|
| Operating Activities Net Income | 33.86B | 29.28B | 33.05B | 26.27B |
| Operating Activities Stock Based Compensation | 490.00M | 625.00M | 552.40M | 436.40M |
| Operating Activities Other Non Cash Items | -90.05B | -74.73B | -63.08B | -54.16B |
| Operating Activities Accounts Receivable | -142.23B | -188.20B | -214.65B | -103.87B |
| Operating Activities Other Assets Liabilities | 6.23B | 3.12B | 2.47B | 5.06B |
| Operating Activities Operating Cash Flow | -191.69B | -229.91B | -241.66B | -126.25B |
| Investing Activities Capital Expenditures | -1.41B | -2.08B | -1.22B | -1.10B |
| Investing Activities Purchase Of Investments | -437.30B | -424.28B | -529.17B | -492.68B |
| Investing Activities Sale Of Investments | 420.99B | 437.95B | 508.94B | 503.51B |
| Investing Activities Investing Cash Flow | -17.72B | 11.59B | -21.46B | 9.73B |
| Financing Activities Long Term Debt Issuance | 832.44B | 702.74B | 544.16B | 273.07B |
| Financing Activities Long Term Debt Payments | -747.48B | -572.90B | -350.27B | -213.18B |
| Financing Activities Common Stock Issuance | 24.94B | 1.25B | 714.50M | 339.30M |
| Financing Activities Common Dividends | -2.46B | -2.38B | -2.45B | -1.50B |
| Financing Activities Financing Cash Flow | 107.44B | 128.70B | 192.14B | 58.73B |
| End Cash Position | 12.46B | 9.50B | 6.48B | 3.96B |
| Free Cash Flow | -87.49B | -138.36B | -168.59B | -69.62B |
Source: Financial statements and regulatory filings
Technical Analysis
Key Insights
- HDB Financial Services is currently in a consolidation phase with price action showing volatility between support near ₹555 and resistance around ₹726, below the 200-day moving average.
- Key support levels are identified near ₹555 (52-week low) and ₹652 (50-day moving average), while resistance is observed near ₹727 (200-day moving average) and the recent high of ₹892.
- The stock trades below its 200-day moving average (₹726.47) and slightly above the 50-day moving average (₹652.17), indicating mixed medium-term momentum.
- Momentum indicators show RSI near neutral levels, MACD with weak bullish crossover signals, and stochastic oscillators suggesting potential short-term oversold conditions.
- Multi-timeframe analysis reveals daily charts with sideways movement, weekly charts showing mild downward pressure, and monthly charts indicating longer-term consolidation.
- Current technical setup suggests potential for range-bound trading with possible breakouts contingent on volume and momentum shifts, warranting close observation of support and resistance breaches.
Trending News
1. Headline: Is HDFC Bank (HDB) One of the Best Indian Stocks to Buy According to Hedge Funds?
Summary: HDFC Bank Limited (NYSE:HDB) offers banking and financial products and services. While we acknowledge the potential of HDB as an investment, we believe certain AI stocks offer greater upside potential and carry less downside risk.
Sentiment: positive
2. Headline: HDFC Bank executive exercises 6,000 stock options | HDB Insider Trading
Summary: HDFC Bank executive Anil Bhavnani exercises 6,000 employee stock options at about $6.80 and $7.85, lifting his direct holdings to 703,436 shares.
Sentiment: positive
3. Headline: HDB Insider Filing: HDFC Bank Officer Stock Option Grant April 2026 | Meyka
Summary: HDFC Bank officer Lakshminarayanan Ramesh A files initial ownership of 44,600 employee stock options valued at $350,110 on April 8, 2026.
Sentiment: neutral
Summary: HDFC Bank Share Price: Find the latest news on HDFC Bank Stock Price. Get all the information on HDFC Bank with historic price charts for NSE / BSE. Experts & Broker view also get the HDFC Bank Ltd. buy/sell tips detailed news, announcements, Forecasts, Analysts, Valuation, Earning forecasts, ...
Sentiment: neutral
5. Headline: HDFC Life Insurance Company Limited Announces Preferential Issue of Equity Shares to HDFC Bank Limited
Summary: HDFC Life Insurance Company Limited disclosed plans to issue 1,45,23,906 equity shares to promoter HDFC Bank Limited on preferential basis. Post-issue, the fully diluted equity share capital will be 2,18,39,50,540 shares, with HDFC Bank's shareholding rising to 50.27%. The announcement was ...
Sentiment: positive
Recent Updates
News Summary
As of April 15, 2026. HDB Financial Services reported a 36.44% year-over-year increase in profit after tax for Q3 FY26, reaching ₹644 crore, supported by a 22.1% rise in net interest income to ₹2,285 crore. The company’s board scheduled a meeting on April 15, 2026, to approve audited standalone financial results for FY26 and consider a final dividend recommendation of ₹2 per equity share. Additionally, the board planned to evaluate proposals for raising funds through non-convertible securities via private placement. The stock price rose over 5% ahead of these announcements, reflecting market anticipation. Employee stock option allotments and insider activities were also noted, indicating ongoing corporate governance and employee engagement initiatives.
News Sentiment
The overall sentiment from recent updates is predominantly neutral to positive, driven by strong earnings growth and dividend considerations. Positive investor response is evident from the stock price appreciation ahead of Q4 results and the board’s dividend proposal. However, cautious tones emerge from governance concerns and valuation scrutiny highlighted in some reports, balancing enthusiasm with risk awareness. The combination of robust financial performance and measured corporate actions suggests a stable outlook with moderate optimism tempered by sector-specific challenges.
Source List
- https://upstox.com/news/market-news/stocks/hdb-financial-services-share-price-climbs-over-3-ahead-of-q4-results-dividend-announcement/article-192143/
- https://www.businesstoday.in/markets/stocks/story/hdb-financial-services-q4-results-2026-dividend-declared-check-amount-525818-2026-04-15
Analytical Overview
Analysis Summary
HDB Financial Services’ valuation metrics, including a trailing P/E of 21.84 and forward P/E of 14.15, are slightly elevated compared to the industry average P/E of 21.84 but reflect anticipated earnings growth. The company demonstrates a strong growth trajectory with quarterly revenue growth of 18.4% and a 41% profit increase in recent quarters, supported by rising net interest income. Financial health shows a high debt-to-equity ratio of 480.24, typical for NBFCs, with positive levered free cash flow of ₹25.44 billion despite negative operating cash flow, indicating effective capital management. Sector-specific challenges include regulatory scrutiny of NBFC leverage and competitive pressures, while opportunities arise from expanding credit demand in India’s retail and SME segments. The company’s positioning as a subsidiary of HDFC Bank provides competitive advantages in funding and brand recognition within the Indian financial services market.
Overall Business and Market Assessment
Supporting Factors: strong revenue and profit growth, a diversified loan portfolio, and backing by HDFC Bank
Risk Factors: the elevated leverage levels, potential regulatory changes affecting NBFCs, and governance concerns raised in recent news
SWOT Analysis
Strengths
- HDB Financial Services has a diversified loan portfolio across multiple retail and business segments.
- The company benefits from strong brand association and support as a subsidiary of HDFC Bank.
- Robust geographic presence with over 1,700 branches across India enhances market reach.
- Consistent profitability with gross margin above 44% and operating margin over 42%.
Weaknesses
- High leverage with a debt-to-equity ratio exceeding 480 increases financial risk.
- Negative operating cash flow indicates potential challenges in core cash generation.
- Relatively low insider ownership may limit direct management influence on stock performance.
- Price-to-cash-flow ratio is negative, reflecting cash flow volatility.
Opportunities
- Growing credit demand in India’s retail and SME sectors offers expansion potential.
- Potential fund-raising through non-convertible securities can support growth initiatives.
- Employee stock option schemes may enhance talent retention and motivation.
- Increasing penetration in underserved markets through branch expansion.
Threats
- Regulatory tightening on NBFC leverage and lending practices could impact operations.
- Competitive pressures from banks and fintech companies may affect market share.
- Macroeconomic uncertainties and geopolitical risks could dampen credit demand.
- Governance concerns and foreign institutional investor sell-offs may affect investor sentiment.
Company Description
HDB Financial Services Limited is a prominent non-banking financial company (NBFC) in India, established in 2007 and headquartered in Mumbai. As a subsidiary of HDFC Bank, India’s largest bank by market capitalization, it plays a significant role in providing financial solutions to individuals and businesses across the country. The company’s core offerings include a wide spectrum of secured and unsecured loans such as personal loans, auto loans, business loans, gold loans, and consumer durable financing, as well as mortgage and asset finance. HDB Financial Services also operates a robust business process outsourcing (BPO) segment, delivering both back-office and customer-facing services like forms processing, document verification, contact center management, and collections. With a nationwide footprint encompassing over 1,700 branches in 27 states and four union territories, HDB Financial Services demonstrates strong operational reach and market penetration. It is recognized for its high creditworthiness, consistently receiving top-tier ratings (CARE AAA, CRISIL AAA, A1+) for its long- and short-term debt facilities. As of FY25, the company is among the largest NBFCs in India by assets under management, with a diversified funding base and a reputation for stability and reliability within the financial sector.